
Abstract
Objective
To study the growth of length-for-age (L/A), weight-for-age (W/A), and body mass index (BMI) of children with cleft lip and palate receiving a normal diet; to establish specific growth curves for children with cleft palate with or without cleft lip (CLP/ICP) who had not undergone palatoplasty and for children with isolated cleft lip (ICL); and to assess if CLP/ICP growth differed from ICL growth and if CLP/ICP and ICL growth differed from growth for typical children.
Design
Prospective and cross-sectional study.
Setting
Hospital for Rehabilitation of Craniofacial Anomalies, Bauru, São Paulo, Brazil.
Main Outcome Measures
Weight and length of 381 children with cleft lip and palate and who were younger than 2 years were recorded and used to calculate W/A, L/A, and BMI growth curves. The 2006 World Health Organization growth charts were used as a reference for typical children. All children received a normal diet for age.
Results
Children with CLP/ICP had median W/A and BMI growth curves below growth curves for typical children but showed spontaneous recovery starting at approximately 5 months of age, even with nonoperated cleft palate. Children with ICL had growth similar to that of typical children. Children with CLP/ICP, who initially had W/A and BMI values less than those of the ICL group, had W/A and BMI equal to or higher than the ICL group after 9 months of age.
Conclusion
Children with CLP/ICP had impaired W/A and BMI growth with spontaneous recovery starting early in childhood. This study established specific W/A, BMI, and L/A growth curves for children with cleft lip and palate.
Over the years, various studies have described feeding difficulties that can impair nutritional status and growth in children with cleft lip/palate, mainly in the first months of life (Jones, 1988; Seth and McWilliam, 1988; Frisancho, 1990; Gibson, 1990; Lee et al., 1997; Biancuzzo, 1998; Pandya and Boorman, 2001; Mizuno et al., 2002; Montagnoli et al., 2005; World Health Organization, 2006; Masarei et al., 2007; Reid et al., 2007; Britton et al., 2011; Marques, 2012). Children with cleft lip and palate (CLP) have feeding difficulties because of the lack of intraoral negative pressure, which is necessary for efficient sucking and swallowing. These children often present choking, nasal obstruction, noncoordination of sucking with breathing and swallowing, and prolonged feeding time. Moreover, parents of infants with CLP feel insecure to feed them, and the reduced volume of ingested milk may lead to failure to thrive (Mizuno et al., 2002; Montagnoli et al., 2005; Masarei et al., 2007; Marques, 2012).
Children with isolated cleft lip (ICL) have less feeding difficulty than children with cleft palate with or without cleft lip (CLP/ICP; Mizuno et al., 2002; Montagnoli et al., 2005; Masarei et al., 2007; Miller, 2011; Marques, 2012). Moreover, this difficulty is more frequent and more severe in younger children, mainly in the first year of age (Mizuno et al., 2002; Montagnoli et al., 2005; Masarei et al., 2007; Marques, 2012).
Growth problems in the first years of age in children with CLP have been attributed mainly to feeding difficulty (Drillen et al., 1966; Jones, 1988; Coy et al., 2000; Kuczmarski et al., 2002; Gopinath and Muda, 2005; Montagnoli et al., 2005; Marques et al., 2009; Zarate et al., 2010), but the high frequency of respiratory and middle ear infectious diseases can contribute to growth impairment (Drillen et al., 1966; Seth and McWilliams, 1988; Coy et al., 2000; Gopinath and Muda, 2005; Montagnoli et al., 2005; Marques et al., 2009; Zarate et al., 2010).
Several studies have reported the growth of children with cleft palate, but most had low sample size or were retrospective. Marques et al. (2009) established weight-for-age (W/A) and length-for-age (L/A) growth curves in a study with a large sample size, but only in children with unilateral CLP, and the authors did not study body mass index (BMI). Body mass index reflects the weight-for-length relationship and gives information mainly about acute undernourishment. Thus, body growth studies are important to establish strategies for growth recovery and to define CLP treatment protocols.
This study aimed to (1) study the growth of L/A, W/A, and BMI of children with CLP receiving a normal diet; (2) establish specific growth curves for children with cleft palate with or without cleft lip (CLP/ICP) who had not undergone palatoplasty and for children with isolated cleft lip (ICL); and (3) assess if CLP/ICP growth curves differed from ICL growth curves and if CLP/ICP and ICL growth differed from growth of typical children.
Methods
The sample consisted of 381 children with CLP, ICP, or ICL who were younger than 24 months, had not yet undergone palatoplasty, and were registered at the Hospital for Rehabilitation of Craniofacial Anomalies–University of São Paulo (HRAC-USP), São Paulo, Brazil. Preterm infants and children with genetic syndromes, other malformations, or health conditions that could negatively affect the children's overall health status were excluded from the study.
The sample was divided into two groups: one with ICL and one with CLP/ICP. Weight and length measurements were obtained from a prospective cross-sectional study, and children were measured only once. Growth measurement techniques were standardized. Weight was recorded using standard scales (10 g accuracy), calibrated weekly, with children clothed only in underpants. Height was measured using a horizontal anthropometer (±0.5-cm error) with the child lying straight and barefoot. All children were examined and measured by the same investigator. All children received care at the same facility and a normal diet for age recommended by the World Health Organization (WHO; 2006) following the HRAC-USP protocol.
The children were classified according to socioeconomic status (SES) into high, medium, and low socioeconomic levels following HRAC-USP guidelines (Graciano et al., 1996). The children were divided into two groups according the type of feeding: breast-fed and bottle-fed.
The WHO growth curves (WHO, 2006) were used as a growth reference for typical children.
Classification of Nutritional Status
Undernourished: children whose W/A and BMI were lower than the fifth percentile (P5) of the 2006 WHO growth curves (WHO, 2006)
Eutrophic: children whose W/A and BMI were between P5 and 95th percentile (P95) of the 2006 WHO growth curves (WHO, 2006)
Overweight or obese: children whose W/A and BMI were greater than P95 of the 2006 WHO growth curves (WHO, 2006)
Classification of Short Stature
Short stature: children whose L/A was lower than P5 of the 2006 WHO growth curves (WHO, 2006)
Eutrophic: children whose L/A was greater than P5 of the WHO growth curves (WHO, 2006)
This study was approved by the Ethical Committee at HRAC-USP and supported by São Paulo Research Foundation (FAPESP; contract No. 2007/0724-6).
The 95% confidence limits for age intervals were calculated when there were differences in W/A, L/A, and BMI measurements between the CLP/ICP and ICL groups. The same procedure was applied to determine the age ranges in which there were differences between each type of cleft and the 2006 WHO reference curves (WHO, 2006).
The chi-square test was used to compare proportions of low W/A, L/A, and BMI (values less than P5 of the 2006 WHO curves).
Statistical Analysis
Linear regression models (polynomials) were used to check the effect of the explanatory variables (cleft, type of feeding, and SES adjusted to age and gender) on the response variables (W/A, L/A, and BMI). A third-degree function was used when the coefficients of determination were equal to 0.87, 0.91, and 0.34 for weight, length, and BMI, respectively.
The 95% confidence limits for age intervals were calculated when there were differences in W/A, L/A, and BMI measurements between CLP/ICP and ICL groups. The same procedure was applied to determine the age ranges in which there were differences between each type of cleft and the 2006 WHO reference curves (WHO, 2006).
The chi-square test was used to compare proportions of low W/A, L/A, and BMI (values less than P5 of the 2006 WHO curves).
Results
The sample consisted of 290 children with CLP/ICP and 91 with ICL.
Two hundred sixty-three children (69.0%) were from the middle SES group, and 118 (31.0%) were from the low SES group. Forty percent (n = 152) of the children were girls, and 60% (n = 229) were boys. Forty-seven percent of the children with ICL were breast-fed, and 53% were bottle-fed. The children with CLP/ICP were bottle-fed only.
Most the children in both groups (ICL and CLP/ICP) were eutrophic; THAT IS, they were in P5-P95 of the 2006 WHO curves (Table 1). In addition, 3.3% of the ICL group and 4.1 % of CLP/ICP group were considered at risk for obesity, similar to values found in the reference population, which is 5% (WHO, 2006).
Distribution of Children According to Percentile (WHO, 2006), Type of Cleft, Weight-for-Age (W/A), Length-for-Age (L/A), and Body Mass Index (BMI)
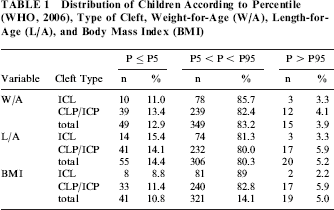
Of all the children studied, 12.9% (n=49) had low W/A, 14.4% (n = 55) had short stature, and 10.8% (n = 41) had low BMI (P < 5 of the 2006 WHO curves; Table 1). These proportions are higher than those found in the 2006 WHO reference curves (WHO, 2006). In addition, W/A, L/A, and BMI were not affected by SES when adjusted for age, with P = .682, P = .269, and P = .857, respectively.
The type of feeding had no effect on any of the variables weight, length, and BMI, when adjusted for age, whose P values were equal to .959, .733, and .859, respectively. The effect of SES on those variables also showed no statistical significance, with P values equal to .610, .394, and .213, respectively.
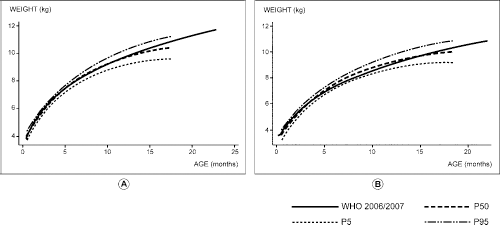
The initial distance between the weight growth curves CLP/ICP and ICL groups was 0.641 kg more for the ICL group, but this distance decreased 0.073 kg per month, resulting in higher values in CLP/ICP than in ICL after 9 months of age (Fig. 1A and 1B). A significant effect of cleft palate was observed on weight growth curves (P < .001) as well as a significant interaction of cleft palate with age in months (P = .014). The distance between ICL and CLP/ICP curves was significant in favor of the ICL group only before 3 months of age, for both genders.

Mean W/A growth curves of children with ICL and of children with CLP/ICP, for boys and girls. CLP/ICP, cleft lip and palate and isolated cleft palate; ICL, isolated cleft lip; W/A, weight-for-age.
The effect of cleft palate on BMI (P < .001) and the interaction between cleft palate and age (P = .031) were statistically significant, as children with ICL had a greater BMI than those with CLP/ICP until 13 months of age (Fig. 2A and 2B). After this age, BMI growth curves of children with CLP/ICP began to present superior values than the first group, for both genders (Fig. 1A and 1B). However, the distance between the ICL and CLP/ICP BMI curves was significant only before 6 months of age for both genders.
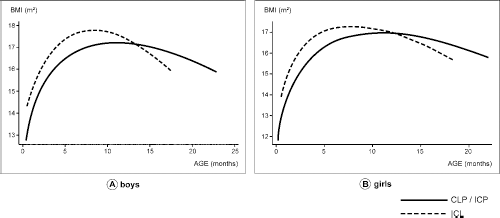
Mean BMI growth curves of children with ICL and of children with CLP/ICP, for boys and girls. BMI, body mass index; CLP/ICP, cleft lip and palate and isolated cleft palate; ICL, isolated cleft lip.
The initial distance between the ICL and CLP/ICP length curves was small: the estimated ICL curve was only 1.0 cm greater than the CLP/ICP curve, but this difference decreased 0.15 cm per month. After 9 months of age, the curve for children with CLP/ICP had higher values than the curve for children with ICL (L/A; Fig. 3A and 3B). The effect of cleft palate on L/A (P= .089) and the interaction of cleft palate with age (P = .110) were not significant, and the two curves can be considered coincident.
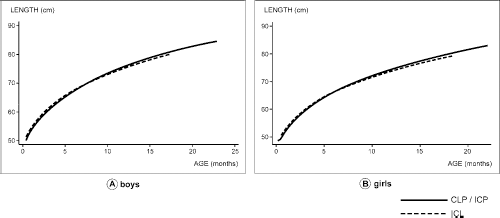
Mean L/A growth curves of children with ICL and of children with CLP/ICP, for boys and girls. CLP/ICP, cleft lip and palate and isolated cleft palate; ICL, isolated cleft lip; L/A, length-for-age.
The 2006 WHO growth curve was within the confidence limits of the median growth curves of the ICL group at all ages and for both genders for W/A (Fig. 4A and 4B), BMI (Fig. 5A and 5B), and L/A (Fig. 6A and 6B). For children with CLP/ICP, the 2006 WHO growth curves were above the upper limit of the CLP/ICL curves at ages inferior than 5 months for both genders for W/A (Fig. 7A and 7B) and BMI (Fig. 8A and 8B) and within the confidence limits after this age range. For L/A, the 2006 WHO growth curves were within the confidence limits at all ages for both genders (Fig. 9A and 9B). These results demonstrate that there was no significant difference between the growth of children with ICL and typical children, but children with CLP/ICP had impaired growth for W/A and BMI only before 5 months of age.
Mean W/A growth curves and 95% confidence limits of children with ICL and mean height W/A curves of typical children (WHO, 2006), for boys and girls. ICL, isolated cleft lip; P5, fifth percentile; P50, 50th percentile; P95, 95th percentile; W/A, weight-for-age; WHO, World Health Organization.

Mean BMI growth curves and 95% confidence limits of children with ICL and mean BMI curves of typical children (WHO, 2006), for boys and girls. BMI, body mass index; ICL, isolated cleft lip; P5, fifth percentile; P50, 50th percentile; P95, 95th percentile; WHO, World Health Organization.

Mean L/A growth curves and 95% confidence limits of children with ICL and mean L/A curves of typical children (WHO, 2006), for boys and girls. L/A, length-for-age; ICL, isolated cleft lip; P5, fifth percentile; P50, 50th percentile; P95, 95th percentile; WHO, World Health Organization.
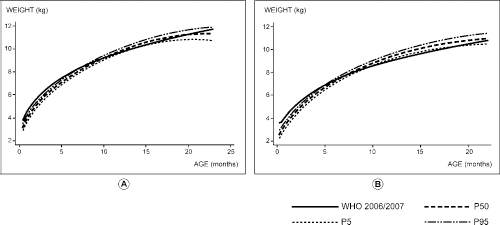
Mean W/A growth curves and 95% confidence limits of children with CLP/ICP and mean W/A curves of typical children (WHO, 2006), for boys and girls. CLP/ICP, cleft lip and palate and isolated cleft palate; P5, fifth percentile; P50, 50th percentile; P95, 95th percentile; W/A, weight-for-age; WHO, World Health Organization.
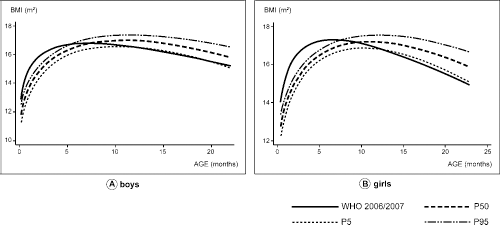
Mean BMI growth curves and 95% confidence limits of children with CLP/ICP and mean BMI curves of typical children (WHO, 2006), for boys and girls. BMI, body mass index; CLP/ICP, cleft lip and palate and isolated cleft palate; WHO, World Health Organization; P5, fifth percentile; P50, 50th percentile; P95, 95th percentile.
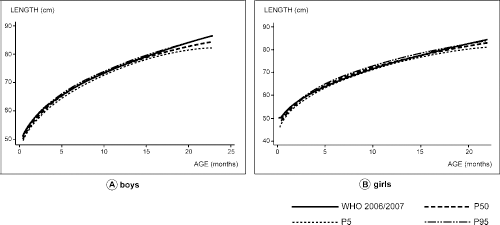
Mean L/A growth curves and 95% confidence limits of children with CLP/ICP and mean L/A curves of typical children (WHO, 2006), for boys and girls. CLP/ICP, cleft lip and palate and isolated cleft palate; L/A, length-for-age; P5, fifth percentile; P50, 50th percentile; P95, 95th percentile; WHO, World Health Organization.
Discussion
In the present study, most infants with CLP, regardless of the type of cleft, were eutrophic. That means they presented adequate nutritional status, which corresponds to P5-P95 of the 2006 WHO reference curves (WHO, 2006). When compared with typical children, a higher proportion of low W/A and BMI was observed in both the CLP/ICP and ICL groups, which is indicative of malnutrition. However, the CLP/ICP group presented with greater impairment. These results are in agreement with the other studies in the literature (Paradise and McWilliams, 1974; Bowers et al., 1987; Lee et al., 1997; Montagnoli et al., 2005; WHO, 2006; Marques, 2009, 2012).
The L/A curves of the CLP/ICP and ICL groups showed a greater percentage of individuals under P5 than the reference population. Various studies have shown that children with CLP (CLP, ICP, and ICL) have smaller body dimensions at birth than typical children (Almeida and Passerotii, 1986; Becker et al., 1998; Reid et al., 2007; Britton et al., 2011). Moreover, some authors have suggested that there is an association between cleft extension and intrauterine growth deficiency (Kirschner et al., 2000). Although the length at birth was not the goal of the present study, the hypothesis of intrauterine growth deficit in children with CLP could explain the results (Becker et al., 1998).
The percentage of children whose BMI and W/A values were indicative of overweight and obesity was similar to the normal population. However, those infants included in overweight or obesity (BMI, P > P95) or malnutrition (W/A, P < P5) groups should be under nutritional vigilance regardless the type of cleft.
The growth curves of children with ICL were closer to growth curves for typical children than were those of children with CLP/ICP. The latter had impaired W/A and BMI only in the first 5 months of age. This result suggests that the difficulties of children with CLP/ICP are more severe in the first semester of life.
Children of both genders with CLP/ICP, who initially had W/A and BMI growth curves below the growth curves of the ICL group, began to present W/A growth curves equal to or higher than those of the ICL group at 9 months of age. In addition, at 13 months of age for both genders, BMI growth curves equal to or higher than ICL curves were observed (Figs. 1 through 3).
Even though children of the CLP/ICP group had not undergone palatoplasty at 13 months of age, they had similar and even greater BMI and W/A values than those with ICL. This result suggests the occurrence of catch-up growth, which could be due to an improvement of feeding and/or an adaptation by these children to their anomalies. Moreover, these results were not affected by SES.
Children with isolated cleft lip have fewer feeding problems than those with more complex clefts, but the present study shows exactly when the nutritional status recovery (W/A and BMI growth) starts to happen in the CLP/ICP group (i.e., at 5 months of age). This information is important when analyzing different surgical treatment protocols for cleft palate. For instance, some protocols indicate palatoplasty in early infancy to improve hearing (Kirschner et al., 2000). However, other protocols indicate palatoplasty for older ages, because the early closure of the palate can lead to maxillary deformity and severe crossbite occlusion at older ages and in adulthood (Fried et al., 1980; Bartzela et al., 2012). The results of this study identified risk for undernourishment in infants with CLP/ICP, but the children studied showed recovery of nutritional status at 5 months of age, even with nonoperated cleft palate. Thus, the decision about the ideal age for palate closure should also consider recovery of nutritional status.
The first collection of growth data for BMI in a large sample of children with CLP and the comparison of BMI, W/A, and L/A between different types of cleft are further contributions of this study. A previous study performed at HRAC-USP (Marques et al., 2009) recorded W/A and L/A growth data in a large sample of children with unilateral CLP younger than 2 years but did not evaluate children with other types of cleft, nor did it study BMI. The data set in our study enabled the establishment of gender-specific mean growth curves and respective confidence limits for BMI, W/A, and L/A for children with ICL and CLP/ICL, providing growth data for children younger than 2 years.
The growth curves established in this study can be used along with reference curves to monitor the nutritional status of children with CLP, because in our study, the children with other malformations, syndromes, or health conditions that could negatively affect overall health status were excluded and W/A, BMI, and L/A were not affected by SES in the entire sample. Thus, deviations away from the confidence limits of these curves found in children with CLP could indicate other problems or complications associated with cleft.
Conclusions
Children with cleft lip/palate had smaller body dimensions and a greater risk of malnutrition than did typical children. Growth impairment was found in children who had cleft palate with or without cleft lip compared with children with isolated cleft lip but only in early infancy. The W/A, BMI, and L/A growth curves of children with ICL were similar to growth curves for typical children, whereas children with CLP/ICP presented impaired W/A and BMI growth compared with typical children only in the first 5 months of age. After this age, these children presented catch-up growth, even when receiving a normal diet for their age.
This study established specific W/A, L/A, and BMI growth curves for children with CLP.
Footnotes
Acknowledgments
The authors wish to acknowledge the financial support of FAPESP (2007/07124-6) and the patients and their families, staff, and professionals at HRAC-USP for their assistance in the study.