






Abstract
Objective
To identify the oral and nasal microbial profile of cleft palate children and control children and to reveal interrelationships between the microbiome and the high prevalence of infectious diseases.
Design
Saliva and nasal samples of 10 cleft palate children and 10 age-matched control children were analyzed. Total microbial genomic DNA was isolated, polymerase chain reaction-denaturing gradient gel electrophoresis was applied to obtain fingerprints, and selected bands on fingerprints were sequenced.
Results
The results revealed a significantly lower saliva microbial diversity in cleft children and a different microbial component in both saliva and nares in children with cleft palate. A higher component similarity between the oral and nasal samples was found in the cleft group than in the control group. Lautropia species and Bacillus species were significantly less present among the saliva samples of cleft group. Dolosigranulum species and Bacillus species were significantly fewer in the nasal cavity of cleft group. Streptococcus species became much more predominant in the nasal cavity of the cleft group than in that of the control group.
Conclusions
A disturbed ecological ecosystem is found in oral and nasal microbiome of children with cleft palate as a consequence of the abnormal communication between the two cavities. Further studies are needed to explore the relationship between the disturbed microbiome and diseases.
Cleft palate is one of the most common congenital oralfacial malformations and presents a high prevalence among newborns all over the world (Medeiros et al., 2000). Studies have shown that patients with cleft lip and/or palate have a higher prevalence of dental caries compared with the general population. Our previous investigation revealed that children with clefts, especially palatal clefts, experienced a significantly higher incidence of dental caries than children in a control group in western China (Zhu et al., 2010). Similar results have been suggested by several investigators in other countries (Bokhout et al., 1997; Turner et al., 1998; Besseling and Dubois, 2004). Meanwhile, high incidences of middle ear infections and recurrent upper respiratory infections such as otitis media and nasosinusitis have been reported among children with palatal clefts despite previous surgical closure of their clefts (Takemura et al., 2002).
There are several possible reasons for those clinical findings. The mouth-breathing habits would cause dry mouth, which reduces the natural cleaning of teeth by saliva (Besseling and Dubois, 2004). The irregular dentition will increase oral clearance time for foods and reduce the efficiency of oral hygiene methods (Ahluwalia et al., 2004). And the open palate and the incompetent velopharynx may cause regurgitation of saliva and food, with irritation of the mucous membranes of the sinuses (Jaffe and DeBlanc, 1971). Furthermore, microorganisms might be involved in or contribute to these conditions. Ahluwalia et al. (2004) reported higher levels of caries-associated microorganisms, Streptococcus mutans and Lactobacillus, in the oral cavity of cleft children. When compared with a normal population, the nose and oropharynx of children with unrepaired cleft lip and palate are recognized to be at an increased risk of colonization by bacterial pathogens, particularly ″β-Hemolytic streptococci and Staphylococcus aureus (Chuo and Timmons, 2005).
The oral and the nasal cavities, separated by the palate, are independent ecosystems that provide different advantageous conditions for various kinds of microorganisms. It is our hypothesis that the disturbance of tissue continuity in patients of palatal clefts will dispose an altered composition of normal microflora at both ecological sites. Several microbiological studies have been carried out to compare the bacteriology between cleft and noncleft sites, but all of them depended on a culture method focusing on specific species (Brennan et al., 2003; Chuo and Timmons, 2005; Cocco et al., 2010), which has a limitation of learning the profile of the ecosystem. To our knowledge, no culture-independent study has been carried out to identify the microbial profile of children with cleft palate.
The polymerase chain reaction-denaturing gradient gel electrophoresis (PCR-DGGE) fingerprinting technique allows rapid assessment of the predominant bacterial species as well as changes in the overall microbial population present in complex bacterial specimens such as saliva and dental plaque (Gafan et al., 2005; Li et al., 2005; Wang et al., 2012). The aim of this study was to use PCR-DGGE fingerprinting to identify the oral and nasal microbial profile of children with cleft palate and control children. This allows comparison of the diversity of the oral bacterial profiles between healthy and cleft palate populations and to reveal interrelationships between the microbiota and the high prevalence of infectious diseases such as caries and otitis media.
Materials and Methods
Approval to conduct this study was received from the ethics committee of West China Dental Hospital of Sichuan University (WCHSIRB-D-2013-069-R). Informed and written consents were obtained from the parents before their children were recruited into the study.
Study Subject Selection and Sample Collection
Subjects registered at the Department of Cleft Lip and Palate, West China Dental Hospital of Sichuan University, were included in this study. Inclusion criteria were 1 year or older; deciduous dentition; diagnosis of non-syndromic complete cleft palate (CCP), with or without cleft lip; no surgical treatment done. Children aged 1 year or older without cleft palate served as controls. The individuals who had current infections (ear, nose, or oral cavity), had used an antibiotic within 3 months, had an orthodontic history, or suffered from systemic diseases (heart disease, endocrine disease, cancer, immune-deficient diseases, and others) were excluded.
Microbial samples of saliva and nasal specimens were collected 2 hours after food intake, by referring to the Sampling Protocol (HMP-07-001) of the Human Microbiome Project (2009). Unstimulated saliva, as the representation of an average sample of the whole oral ecosystem (Aas et al., 2005), was collected from the individuals by research staff using sterile, disposable pipettes and was placed into sterile cryogenic vials. The nasal specimen was obtained by gently rubbing the mucosal surfaces of the anterior nares with a sterile nylon-flocked swab (Bianzhen, Nanjing, China). The swab was dippedin 750 μl of phosphate-buffered saline in a tube, stirred by hand for 10 seconds, and then pressed against the tube wall multiple times for 20 seconds to ensure transfer of bacteria from swab to solution. The specimens were put in a zippered plastic bag, placed over ice, and taken to the lab for processing within 2 hours.
DNA Extraction and PCR-DGGE
Total bacterial genomic DNA was extracted from clinical samples using QIAamp DNA Micro Kit (Qiagen, Germantown, MD) according to the instructions. Concentration and purity of extracted DNA was checked by Nanodrop 2000 spectrometer (Thermo Fisher Scientific, Wilmington, DE). An approximately 300-base pair (bp) internal fragment of the 16S rRNA gene was amplified by the universal primer set Bac1 (5′-CGC CCG CCG CGC CCC GCG CCC GTC CCGCCG CCC CCG CCC GAC TAC GTG CCA GCA GCC-3′)and Bac2 (5′-GGACTA CCA GGGTAT CTA ATC C-3′) (Li et al., 2007). Each 50-μL PCR reaction contains 100 ng of purified genomic DNA, 40 pmol of each primer, 200 μM of each deoxyribonucleotide triphosphate, 4.0 mM magnesium chloride, 5μL 10X PCR buffer, and 2.5 U Taq DNA polymerase (Invitrogen, Carlsbad, CA). Cycling conditions were 94°C for 3 minutes, followed by 30 cycles of 94°C for 1 minute, 56°C for 1 minute, and 72°C for 1 minute, with a final extension period of 5 minutes at 72°C. The PCR products were evaluated by 1% agarose gel electrophoresis (Wang et al., 2012).
A 40% (containing 2.8M urea and 16% [vol/vol] formamide) to 60% (containing 4.2M urea and 24% [vol/vol] formamide) linear DNA denaturing gradient was formed in an 8% (wt/vol) polyacrylamide gel. The gels were submerged in 1X TAE buffer. The PCR products were generated from every sample. Approximately 30 μL of PCR product was applied to each well and separated by electrophoresis for 16 hours at 58°C using a fixed voltage of 60 V in the Bio-Rad DCode System (Bio-Rad Laboratories, Inc., Hercules, CA). After electrophoresis, gels were stained for 15 minutes in 1X TAE buffer containing 0.5 μg/mL ethidium bromides, followed by 15 minutes of rinsing in 1X TAE buffer. The DGGE profile images were digitally recorded using the Molecular Imager Gel Documentation system (Bio-Rad Laboratories) (Wang et al., 2012).
DGGE Profile Analysis
The DGGE profile analysis was performed on the basis of the migration distances and intensity of each detected band by GelCompare II software, version 6.5 (Applied Maths, Kortrijk, Belgium). Each gel was normalized according to a DGGE standard marker included in all the gels, which was generated using four species-specific strains (Lactobacillus acidophilus ATCC4356, Streptococcus mutans UA159, Aggregatibacter actinomycetemcomitans ATCC29523, Streptococcus gordonii ATCC 10558). The background was subtracted using mathematical algorithms according to the spectral analysis of overall densitometric curves. A minimal profiling setting (1.0%) was used for the band searching.
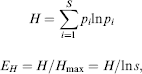
The diversity index of the oral or nasal microbiota was evaluated by the Shannon-Wiener index (H), richness (S), and evenness (EH) on the basis of the following equations:
Similarities among profiles were analyzed by the Pearson product moment correlation coefficient of similarity (Smalla et al., 2001), using the unweighted pair group method by means of arithmetic averages (uPGMA) (Tao et al., 2013). Dendrograms of genetic similarity between samples were calculated.
16S rRNA Gene Sequencing
Distinct amplicons from DGGE gels from the samples were excised and transferred to a 200-μL PCR tube containing 10 μL of sterile nuclease-free water (Fisher Scientific). After incubation at 4°C overnight, the recovered PCR products were reamplified with the same Bac1 and Bac2 primers but without the GC clamp. The resulting PCR products were purified and sequenced on an ABI 3730XL automated DNA sequencer (Applied Biosystems, Foster City, CA). Obtained sequences were analyzed by ABI Sequence Analysis 5.2 (Applied Biosystems) and were determined by using the BLASTN search program at the National Center for Biotechnology Information Web site and Human Oral Microbiome Database 16S rRNA sequence identification. Sequences with a similarity of 98% or above were considered to be positive identification of taxa.
Statistical Analysis
The differences of mean age, gender distribution, and number of erupted teeth between the cleft and control groups were determined by the nonparametric Mann-Whitney U test and Fisher exact test, respectively. A paired-samples t test was used to compare the diversity indices between saliva and nasal swab samples in each group (control group: saliva versus nasal swab; CCP group: saliva versus nasal swab). An independent-samples t test was used to compare the diversity indices between saliva or nasal samples from the two groups (saliva: control versus CCP; nasal swab: control versus CCP). The frequencies of the sequenced bands distribution between the two groups were compared by Fisher exact test. All statistical analyses were performed with SPSS software, Version 19.0 (IBM, Inc., Armonk, NY). A P value below .05 was considered to be statistically significant.
Results
Ten children with CCP and 10 controls were enrolled in this study. There are no significant differences of mean age, gender distribution, and erupted teeth number between the two groups (Table 1).
Comparisons of Age, Gender, and Number of Teeth Between the Two Groups
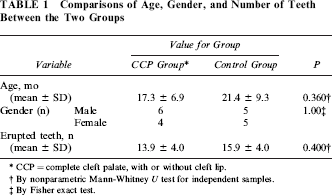
CCP = complete cleft palate, with or without cleft lip.
By nonparametric Mann-Whitney U test for independent samples.
By Fisher exact test.
Microbial Diversity Indices
The diversity indices (H, S, and EH) of samples from oral and nasal cavities are presented in Table 2. There were significant differences in H, S, and EH (P = .002, P = .002, P = .046, respectively) between salivary and nasal samples in the control group. In the CCP group, however, no significant differences were found in any of these indexes among samples from saliva and the nose.
Comparison of the Diversity Indices Calculated From DGGE Profiles
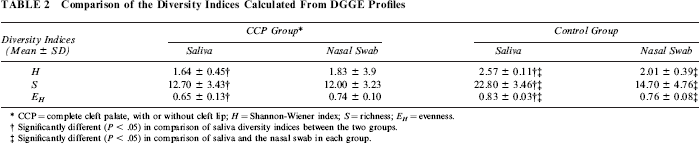
CCP = complete cleft palate, with or without cleft lip; H = Shannon-Wiener index; S = richness; EH = evenness.
Significantly different (P < .05) in comparison of saliva diversity indices between the two groups.
Significantly different (P < .05) in comparison of saliva and the nasal swab in each group.
Most interesting, we found significant differences in H, S, and EH (P < .001, P < .001, P = .001, respectively) of saliva samples between the CCP group and the control group. Saliva in the control group represents the higher H (2.57 ± 0.11), EH (22.80 ± 3.46), and S (0.83 ± 0.03). However, there was no significant difference in the diversity indices between the nasal samples from the two groups.
Clustering of DGGE Profiles
Similarity of microbiota in the saliva and the nasal swab was analyzed using the Pearson product moment correlation coefficient and dendrograms that were constructed on the basis of the UPGMA clustering algorithm method. Figure 1 shows the dendrogram of the DGGE profiles of the CCP group. Five of 10 samples from the nasal cavity are clustered with saliva samples. Figure 2, the dendrogram of the control group, shows two distinct clusters, with one saliva sample clustered in the nasal group and two nasal samples clustered in the saliva group. The scales above the dendrograms, which represent percentage of similarity, revealed a higher similarity of the oral and nasal samples in the CCP group than of those in control group. Specifically, for individuals numbered 10, 8, 1, and 6, they presented a high similarity around 90%.
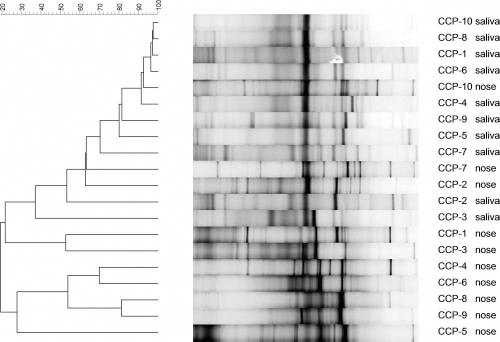
Dendrogram derived from DGGE analysis of salivary and nasal samples of complete cleft palate group (CCP1 to CCP10). Half of nasal samples are clustered with saliva samples. High percentage of similarity is shown on the scale above the dendrogram.
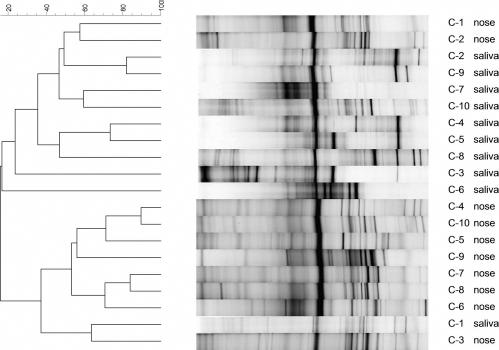
Dendrogram derived from DGGE analysis of salivary and nasal samples of control group (C1 to C10). Two isometric clusters were formed. Low percentage of similarity is shown on the scale above the dendrogram.
Sequence Analysis
A total of 123 distinct amplicons were excised from the DGGE gels. After sequencing, 10 genera were identified (Table 3; Fig. 3), and the frequencies of their distribution in different kinds of samples between the two groups were analyzed. The most predominant genera in the saliva of the control group were Streptococcus species, Gemella species, Lautropia species, and Neisseria species; whereas, Lautropia species and Bacillus species were significantly less present among the saliva samples of the CCP group (for both, P = .029). Dolosigranulum species was the most predominant genus in the nasal cavity of the control group, but the frequency was less in the CCP group (P = .016). Bacillus species also appeared less in the CCP group (P = .029). Streptococcus species became much more predominant in the nasal cavity of the CCP group than in that of the control group (P = .012).
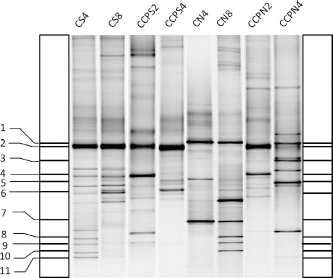
Gel image of two samples from each group (numbers 2 and 4 from CCP group and numbers 4 and 8 from control group) were selected for illustration of the distribution of sequenced DGGE bands. The illustrations on both sides show the sequenced bands' relative location in each lane. The number labeled is in accord with the band numbers in Table 3. CS = saliva of controls; CCPS = saliva of children with complete cleft palate; CN = nasal swabs of controls; CCPN = nasal swabs of children with complete cleft palate.
Distribution of Genera According to 16S rDNA V3-V5 Region Sequence Analysis Detected From the Study Subjects
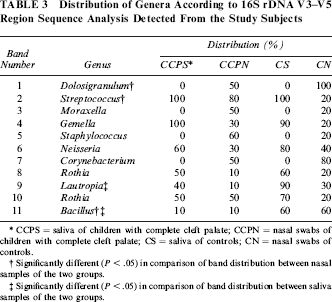
CCPS = saliva of children with complete cleft palate; CCPN = nasal swabs of children with complete cleft palate; CS = saliva of controls; CN = nasal swabs of controls.
Significantly different (P < .05) in comparison of band distribution between nasal samples of the two groups.
Significantly different (P < .05) in comparison of band distribution between saliva samples of the two groups.
Discussion
To monitor the onset of oral or nasal infectious diseases of the cleft palate population, it is valuable to clarify the composition of the microbial community of these ecological niches (oral cavity and the niches surrounding it), as we do for healthy and carious populations (Li et al., 2007; Jiang et al., 2011). The PCR-DGGE is an effective way to have a quick glance at the microbial communities and to know what has taken place in the altered environments. Theoretically, the number and pattern of the DGGE bands are related to the predominant bacteria and are considered to be indicators of microbiota richness (S). In addition, we used both the band number and their relative intensities to calculate the H, which would in theory reflect sample diversity (Gafan et al., 2005). In our study, DGGE profiling of saliva from children with CCP displayed significantly less diversity than that of controls; whereas, the nasal microbiome demonstrated a stable diversity. Research had demonstrated a diverse environment in saliva and plaque of healthy individuals, and this diversity is a crucial feature in maintaining a degree of stability within that community (Filoche et al., 2010). For instance, oral microbiomes of individuals suffering from gingivitis and severe dental caries are less diverse than those of healthy individuals (Gafan et al., 2005; Li et al., 2005; Tao et al., 2013). The reduced diversity of saliva in our study may suggest a disturbance of the oral ecology and a less stable and resilient oral microbial environment of children with CCP.
Cluster analysis, including the UPGMA applied in this study, can be used to identify samples that generate similar patterns. The calculation was based on the number of bands detected, the relative intensity, and the migration distribution of the PCR 16S amplicons (Gafan et al., 2005). The dendrograms calculated in our study demonstrated similarities of nasal and oral microbial communities of individuals with or without cleft palate. Two structured clades were generated by samples from the control group, where the saliva samples and nasal samples were well distinguished. Conversely, in the CCP group, five of 10 nasal samples resembled saliva samples. Three of them represented more than 60% similarity with the saliva samples. Furthermore, interindividual variation existed in all the samples, in accordance with other studies (Rasiah et al., 2005; Bik et al., 2010). Relman (2008) attributed this to humans' different abilities to respond to different stimuli, biological stressors, and environments. In healthy individuals, nasal and oral cavities are separated by the palate and display different environmental characteristics that favor different species of microorganisms. However, in the oral and nasal cavities of patients with CCP, the communicated nasal-oral cavity will cause a constant interchange of body fluids from two different sites and food reflux from the oral cavity to the nasal cavity. Then the differences between two sites lessen. Thus, a higher similarity between saliva and nasal microbiome was presented in cleft individuals, which we speculated was derived from the domestic change of environment.
Because the identification by the sequencing was based on partial 16S rRNA gene sequences and phylogenetically related species might overlap in one band (Hayes et al., 1999), it might not be sufficient for species-level assignment. In addition, comigration of DNA fragments brought problems for retrieving clean sequences from individual bands, resulting in failures of parts of the sequencing. Regarding all these problems, we were finally able to distinguish 10 bacterial genera: Dolosigranulum, Streptococcus, Moraxella, Gemella, Staphylococcus, Neisseria, Corynebacterium, Rothia, Lautropia, and Bacillus. All of them were parts of predominant bacteria in oral and/or nasal cavities (Zaura et al., 2009; Frank et al., 2010). Furthermore, except for Dolosigranulum, Moraxella, and Lautropia, all are on the list of the major genera with the largest presentation in healthy oral cavities (Zarco et al., 2012). Judging from the results, changes of bacterial composition had taken place in CCP saliva and the nares. In our study, we found that Dolosigranulum species was abundant in the nares of control individuals, represented by the thick bands in the profiles (100%). According to the research of Frank et al. (2010), Dolosigranulum species is a common genus in the nares of healthy adults. But the presence of Dolosigranulum species was decreased obviously in cleft nares (50% absence). A similar suppression happened to Lautropia species and Bacillus species in the CCP group, with a decreased occurrence in saliva and in both saliva and nares, respectively. We find it interesting that Streptococcus species always dominated the saliva in spite of the cleft. An increased number of Streptococcus species was found colonized in nasal cavity, which might suggest a migration from the oral cavity.
The genus Moraxella actually was identified as species Moraxella catarrhalis by sequencing. The bacteria mainly colonizes in the nasopharyngeal cavity, quite common through infancy, and is now considered an important pathogen of sinusitis, otitis media, tracheitis, bronchitis, and pneumonia in children (Verduin et al., 2002). Faden et al. (1994) reported an increased risk of otitis media related to a high rate of M. catarrhalis. In fact, M. catarrhalis is now the third leading cause of otitis media, following Streptococcus pneumoniae and nontypeable Haemophilus influenzae. In this study, though the increase did not quite reach statistical significance, we can see a trend of flourishing M. catarrhalis in nares of children with CCP. We hypothesize that the altered, moist nasal environment might mimic the nasopharyngeal cavity environment that M. catarrhalis prefers. This might relate to the susceptibility of these M. catarrhalis–mediated diseases of cleft people to some extent.
A microbial ecosystem has been defined as a system that consists of all the microorganisms that live in a certain area or niche, which function together in the context of other biotic (plant and animals) and abiotic (temperature, chemical composition, and structure of the surroundings) factors of the niche (Raes and Bork, 2008). There exist extensive interactions between different species that contribute to the microbial ecosystem (Yang et al., 2011). It is crucial that there be a dynamic ecological balance among microorganisms in the ecosystem to prevent pathological changes and disease from occurring (Zarco et al., 2012). However, in oral and nasal cavities of children with CCP, alterations of the environment and microenvironments influence the survival and reproduction of microorganisms and allows abnormal migration of microorganisms between the two cavities. Alterations might refer to carbohydrates, partial pressure of oxygen, and so on (Brennan et al., 2003). Certain kinds of microorganisms are absent, flourishing, or suppressed, leading to a shift in the relative abundance and interactions of the microorganisms. The shift is presented by the diversity change and component alteration of the saliva community and component alteration of nasal community, as we observed in our study. On the whole, we can arrive at the conclusion that an ecological shift has taken place in the oral and nasal cavities of children with CCP.
In summary, we found significantly less microbial diversity in the saliva of children with CCP, compared with control children. Distinct microbial components in both saliva and nares can be observed in children with CCP. We concluded that there is a disturbance of the ecological balance in oral and nasal environments of children with CCP as a consequence of the abnormal communication between the two cavities. Nevertheless, with the relative limitation of methodological biases in this exploratory study, further studies are needed to explore the oral and nasal microbial communities of individuals with CCP and to determine the relationship between the balance disturbance of ecosystem and diseases.