
Abstract
Background
Our aim was to investigate the regulation of the gene expression of leptin in subcutaneous adipose tissue biopsies in morbid obesity before and after biliopancreatic diversion (BPD).
Methods
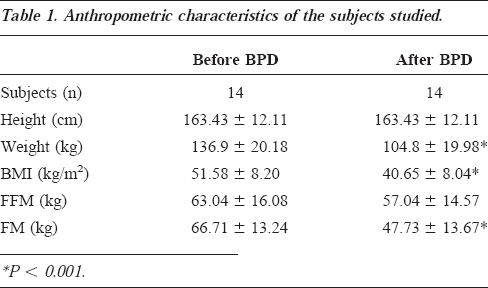
Longitudinal study in morbidly obese subjects investigated twice: before and 6 months after BPD. Fourteen morbidly obese women, 37±13 years old and with a body mass index of 51.6±8.2 kg/m2, were studied before and 6 months after BPD (40.6±8.0 kg/m2). Using reverse transcriptase polymerase chain reaction analysis, the mRNA expression of leptin was investigated in adipose tissue. Plasma leptin was measured by radioimmunoassay; plasma insulin was measured by microparticle enzyme immunoassay. Free fatty acids (FFA) were measured using a colorimetric kit.
Results
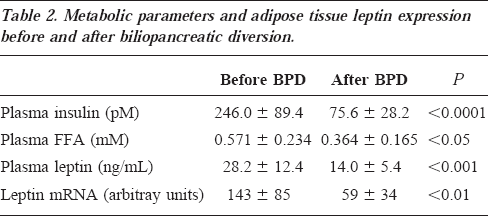
A significant decrease in leptin mRNA level was observed in comparison with pretreatment in BPD patients (59±34 vs 143±85 arbitrary units, P <0.01). A strict relationship between adipose tissue leptin mRNA and plasma leptin either before (R2=0.80, P <0.0001) or after BPD (R2=0.86, P <0.0001) and between plasma FFA concentration and insulin either before (R2=0.65, P <0.001) or after BPD (R2=0.92, P <0.0001) was observed. Finally, a significant correlation was found between changes in FFA and insulin (R2=0.64, P <0.001), insulin and leptin (R2=0.88, P <0.0001), and insulin and leptin mRNA (R2=0.83, P <0.0001).
Conclusion
These data demonstrate a high correlation between leptin mRNA expression in adipose tissue and plasma leptin in postobese subjects after BPD. The significant relationship between both leptin mRNA and plasma leptin with insulin suggests that circulating insulin might regulate leptin expression. It might be hypothesized that plasma FFA concentration can act on the insulin secretion and subsequently on the leptin secretory pathway.
Introduction
In healthy humans, the ob gene product, the leptin, circulates as a 16 K monomer with an internal disulfide bridge. 1 Leptin levels increase exponentially with increasing fat mass (FM), 2 and its production is larger in subcutaneous than in visceral fat depots.3,4 Most obese individuals have increased leptin levels, 2 indicating that obesity represents a leptin-resistant state. It has been shown that serum leptin levels in humans decline with weight loss after either low caloric diet2,5–9 or bariatric surgery.10–12 Energy metabolism and body composition have been extensively studied in obese subjects who undergo biliopancreatic diversion (BPD) either by our13–16 or other groups.17,18 This population of postobese subjects achieves a near-normal body weight within at least 2 years after surgery and displays, in the following years, remarkable stability of body weight associated with normalization of the lipid profile and the glucose metabolism.16,18 Recent studies have shown that plasma leptin levels in humans decrease after BPD.10–12 De Marinis et al 11 observed that in post-BPD patients, leptin decreased rapidly without correlation with body mass index (BMI) but with a consistent correlation with the decline of circulating insulin levels. However, no data are available in the literature on the relationship between ob gene expression in adipocytes and plasma leptin levels after bariatric surgery. Therefore, in this study, we investigated the regulation of leptin mRNA expression in subcutaneous adipose tissue biopsies from morbidly obese subjects before and 6 months after BPD.
Methods
Subjects
The study group consisted of 14 morbidly obese women (BMI, 51.6±8.2 kg/m2) investigated twice: before and 6 months after BPD. Their physical characteristics are described in Table 1. None had diabetes mellitus or any endocrine or nonendocrine disease. All were normotensive, with diastolic pressure lower than 90 mm Hg. The women were observed in the follicular phase of the menstrual cycle. At the time of the baseline study, all subjects were on an ad libitum diet, with the following average composition: 60% carbohydrate, 30% fat, 10% protein (at least 1 g/kg of body weight). This dietary regimen was maintained for 1 week before the study. Blood samples were drawn between 8:00 and 8:30 am after an overnight fast and immediately centrifuged to separate plasma. The Institutional Ethical Committee of the Catholic University of Rome approved the study protocol; the nature and purpose of the study were carefully explained to all subjects before they provided their written agreement to participate.
Anthropometric characteristics of the subjects studied.
Body Composition
At time 0, body weight was measured to the nearest 0.1 kg by a beam scale, and height was measured to the nearest 0.5 cm using a stadiometer (Holatin, Crosswell, Wales, UK). Total body water (TBW) was determined using 0.19 Bq tritiated water in 5 mL saline solution administered as an intravenous bolus injection. 19 Blood samples were drawn before and 3 hours after the injection. Radioactivity was determined in duplicate on 0.5 mL of plasma using a β-scintillation counter (Camberra-Packard, Model 1600TR, Meriden, CT). Corrections were made (5%) for nonaqueous hydrogen exchange; 20 water density at body temperature was assumed to be 0.99371 kg/L. TBW (kg) was computed as 3H2O dilution space (in liters)x0.95x0.99371. The within-subject coefficient of variation for this method is 1.5%. 21 Fat-free mass in kg was obtained by dividing the TBW by 0.732. 22
Analytical Methods
Plasma samples for leptin and insulin determinations were stored at -70°C for an average of 6 months. These samples were not thawed until hormone assays were performed. Plasma leptin was measured by radioimmunoassay (Linco Research, St. Charles, MO). The limit of detection was 0.5 ng/mL, and the intra-assay and interassay coefficients of variation for leptin analysis were less than 8%. All assays were performed in duplicate. Plasma insulin was measured by microparticle enzyme immunoassay (Abbott Imx, Pasadena, CA). Free fatty acids (FFA) were measured using a colorimetric kit (Boehringer Mannheim Biochemical, Mannheim, Germany).
Reverse Transcriptase-Polymerase Chain Reaction Analysis
Subcutaneous fat over the femoral quadriceps muscle was obtained twice by means of needle liposuction after an overnight fast before and 6 months after BPD. Total RNA preparation and quantification of leptin mRNA in adipose tissue were described previously. 23 Briefly, total RNA was isolated from the adipose tissue biopsies using the RNAzol method (Cinna Scientific, Friendwood, TX). The RNAs were treated for 1 hour at 37°C with 6 U RNAse-free DNAse I per γ RNA in 100 mM Tris-HCl, pH 7.5, and 50 mM MgCl2 in the presence of 2 U/βL placenta RNAse inhibitor. All of the RNAs (approximately 200 ng from each biopsy) were reverse-transcribed with 200 U of Moloney murine leukemia virus reverse transcriptase (Promega, Madison, WI) in 20 βL buffer containing 0.4 mM dNTP, 2 U/mL RNAse inhibitor, and 0.8 γ oligo (dT)15 primer (Promega). The reverse transcriptase-polymerase chain reaction (RT-PCR) was performed using Taq DNA polymerase (Promega) in 25 βL standard buffer (10 mM Tris-HCl, pH 9.50 mM KCl, 0.1% Triton X-100, 2.5 mM MgCl2, and 200 μ dNTPs) and 40 pM of each sense- and antisense-specific oligonucleotide primer. The primer sequences were chosen using the Gene-Works program (IntelliGenetics, Inc., USA) and were as follows: 5′-CAC CAA AAC CCT CAT CAA GCA-3′ and 5′-AGC CTG CTC AGG GCC ACC ACC-3′.
A control experiment without reverse transcriptase was performed for each sample to verify that the amplification was not caused by any residual genomic DNA. The mRNA for the constitutive β-actin was examined as the reference cellular transcript. The primers for β-actin were added at the 10th cycle of each PCR amplification to avoid a plateau situation. The ob gene was amplified using 30 cycles at 94°C for 30 seconds, 60°C for 30 seconds, and 72°C for 30 seconds, followed by a 5-minute final extension at 72°C. After amplification, 10 βL of the reaction mixture was separated by electrophoresis (1.2% agarose gel in Tris-acetate EDTA buffer), visualized using ethidium bromide staining and a QuickImage-D system (Camberra Packard, Milan, Italy), and densitometrically analyzed using Phoretix 1D version 3.0. The number of cycles for the semiquantitative RT-PCR assay and the conditions of the reaction temperature were estimated to be optimal for a linear relationship between the amount of input template and the amounts of PCR product generated over a significant concentration range: 20 to 100 ng from total RNA. In particular, the linearity of the RT-PCR amplifications for the tested genes was measured at 15, 30, and 40 cycles (data not shown). β-Actin mRNA amplification products were present at equivalent levels in all tissue extracts. The nucleotide sequences of the amplified products were determined and were found to be identical to the mRNA products of the human ob and β-actin genes.
Statistical Analysis
Data are presented as mean±SD. Pearson/s correlation coefficients were computed to evaluate the magnitude of the associations between mRNA leptin and metabolic variables. The coefficient of determination, R, was used as a measure of goodness of fit of the generated equation. A paired t test was used to compare the same groups before and after BPD therapy.
Results
The average weight loss observed over a 6-month period in the post-BPD patients was 32 kg. Plasma insulin, FFA, and leptin concentrations, as well as leptin mRNA levels before and after BPD, are reported in Table 2. Plasma leptin levels were significantly correlated (R2=0.67; P <0.001) with FM in morbid obese subjects, while no significant correlation (R2=0.06; P=NS) was observed 6 months after BPD. Fasting plasma leptin concentration highly correlated with the insulin level both before (R2=0.84; P <0.0001) and after BPD (R2=0.83, P <0.0001) (Figure 1A and 1B). Changes in adipose tissue leptin expression is depicted in Figure 2. A strict relationship between adipose tissue mRNA leptin and plasma leptin was found in our population either before (R2=0.80; P <0.0001) or after (R2=0.86, P <0.0001) the surgical operation. Moreover, mRNA leptin levels and plasma insulin concentrations (Figure 3A and 3B) correlated well in our sample (R2=0.82; P <0.0001 before vs R2=0.83, P <0.0001 after BPD). A significant correlation between plasma FFA and insulin concentrations was observed before BPD (R2=0.65; P <0.001), which became closer 6 months after BPD (R2=0.92, P <0.0001). Changes in insulin, FFA, leptin, and leptin mRNA are, respectively, 151.10±94.03 pM, 0.357±0.099 mM, 16.39±10.60 ng/mL, and 78.23±58.49 arbitrary units. A significant correlation was found between changes in FFA and insulin (R2=0.64, P <0.001), insulin and leptin (R2=0.88, P <0.0001), and insulin and leptin mRNA (R2=0.83, P <0.0001).
Metabolic parameters and adipose tissue leptin expression before and after biliopancreatic diversion.
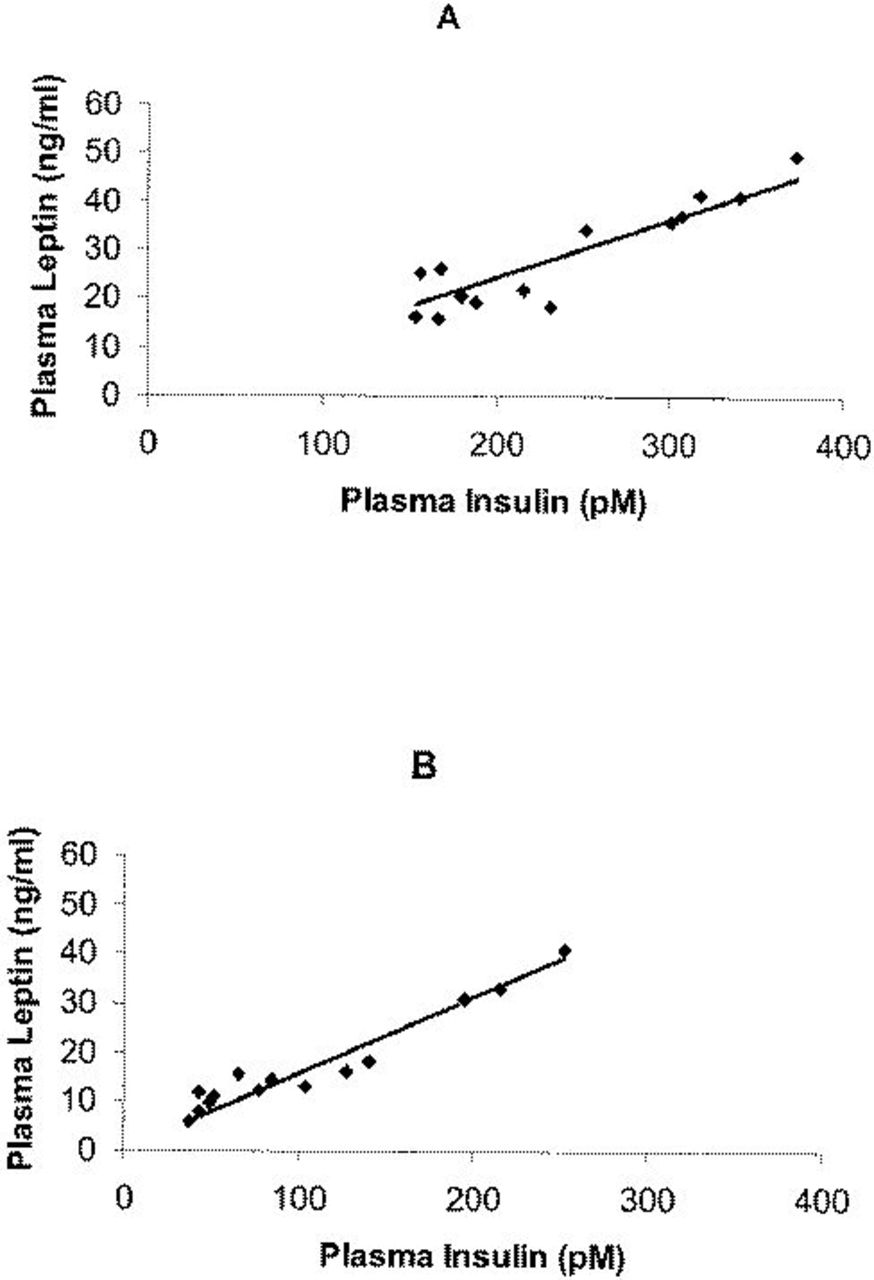
Linear correlation between fasting plasma leptin concentration and circulating insulin level before (A) (R2=0.84, p<0.0001) and after BPD (B) (R2=0.83, p<0.0001)
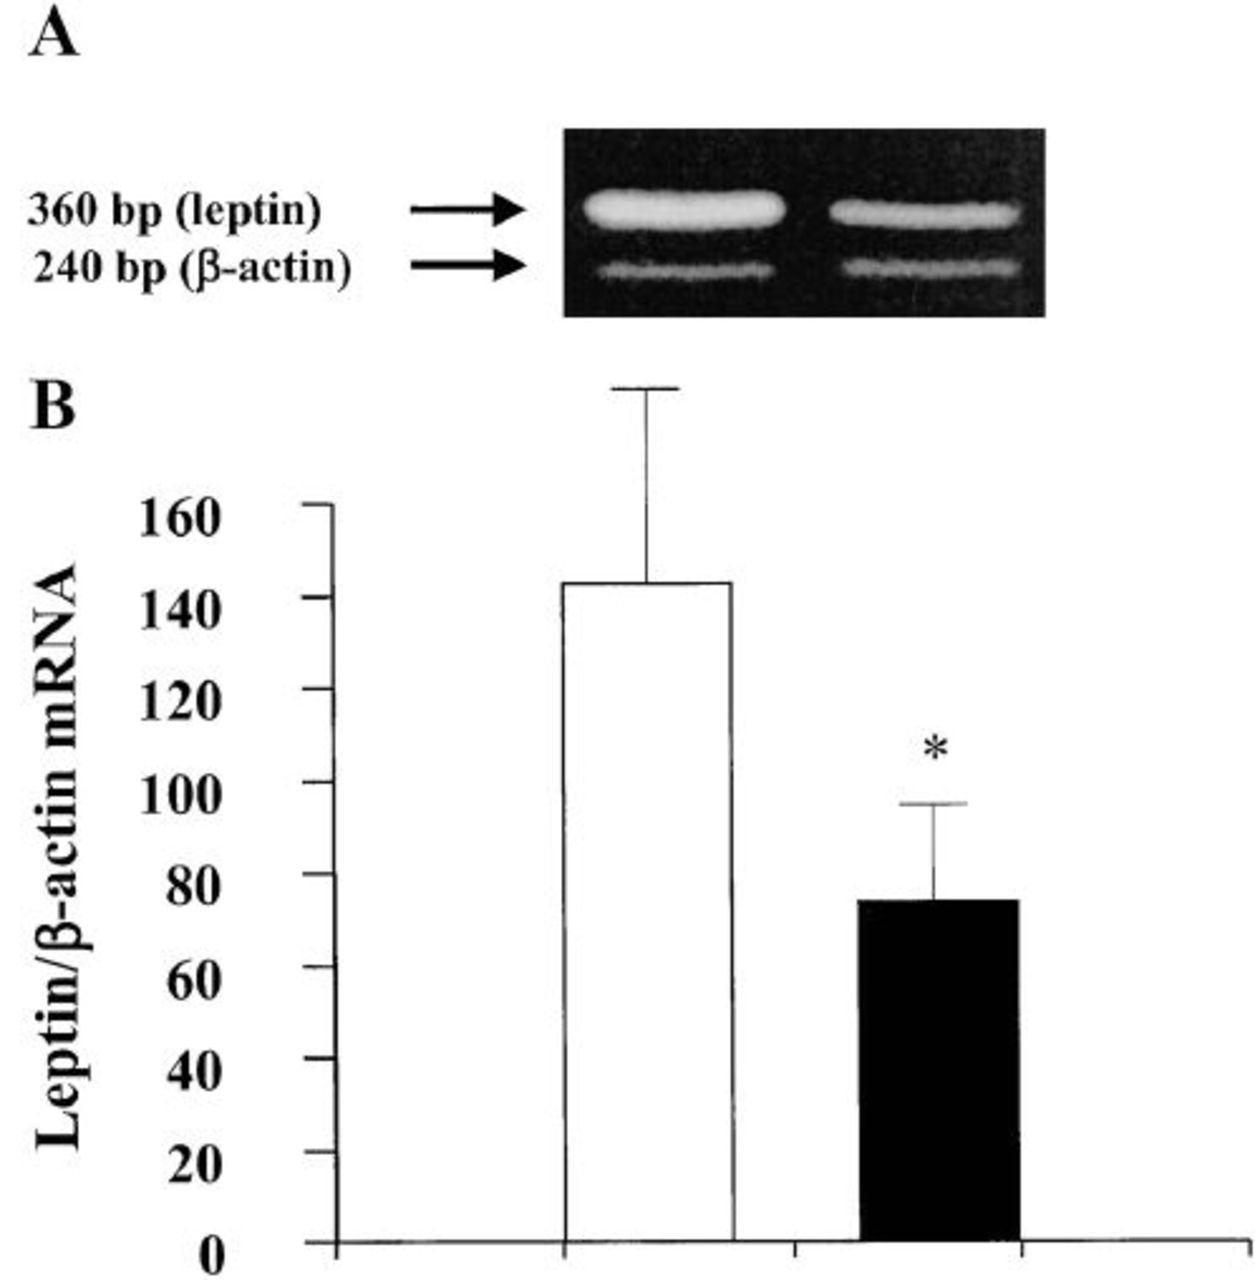
Leptin-mRNA expression before and after BPD in the fat biopsies. (A) Representative agarose gel showing RT-PCR analysis of leptin and β-actin mRNA content in adipose tissue samples of one obese subject. (B) Densitometric analysis of the ratios of leptin/β-actin mRNA abundance normalized to arbitrary units before (open bars) and after (closed bars) BPD surgical operation. Bars represent the mean±SEM.
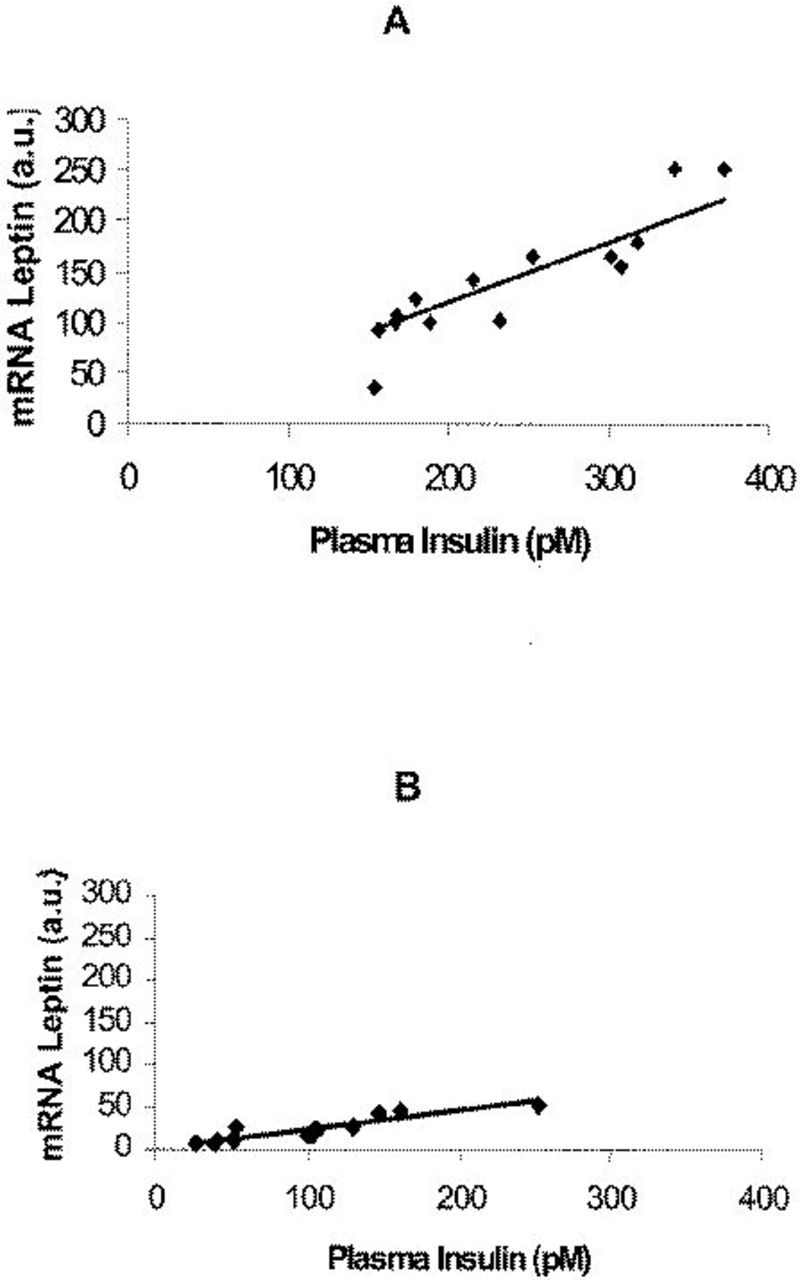
Correlation between mRNA leptin levels and plasma insulin concentrations before (A) (R2=0.82, p<0.0001) and after BPD (B) (R2=0.83; p<0.0001). a.u., arbitrary units.
Discussion
Our data indicate that BPD causes a decrease in leptin mRNA expression in subcutaneous adipose tissue. Therefore, these results suggest that the plasma leptin level reflects the concentration of leptin mRNA of subcutaneous adipose tissue and therefore of the total body fat. A body of literature suggests that leptin plays a regulatory role in weight control5,24–26; overfeeding increases leptin gene expression, 27 whereas fasting results in reduction of plasma leptin.5,24 Guven et al 28 demonstrated that higher leptin levels in weight-reduced obese women are related to the higher total fat, and particularly the subcutaneous fat masses. After operation, De Marinis et al 11 observed that BMI and leptin levels had a different pattern of decrease; leptin decreased rapidly, without correlation with BMI. Also, in our study, no significant correlation between plasma leptin and FM was observed in postobese subjects. The major part of studies reported in the literature concern leptin changes in obese subjects during diet-induced weight loss,29,30 while in our series the morbidly obese patients who underwent BPD were consuming a hypercaloric diet. 15 This suggests that the regulation of leptin synthesis in the adipose tissue is more complex than previously supposed. In this regard, Havel et al 25 and Mueller et al 31 have shown that glucose transport and metabolism is a crucial factor in the regulation of leptin expression and secretion. Although the subjects we have studied were not in a stable weight, which is usually reached around 2 years after BPD, 16 they were not, however, actually in a hypocaloric state because these kinds of subjects have a very high caloric intake, and their metabolizable energy (energy intake minus energy loss) is still positive, as previously demonstrated. 15 Therefore, the hypothesis that the lack of correlation between plasma leptin and FM at the follow-up, possibly deriving from a hypocaloric state, is unlikely.
It has been recently shown 32 that variation in the magnitude of the fall in plasma leptin levels after weight loss is strictly correlated with the associated decrease in the day-long plasma insulin response, suggesting that the prevailing insulin concentration acts as an important and independent regulator of leptin level. Our data are confirmatory of those reports showing a positive correlation between leptin mRNA and the circulating levels of both leptin and insulin. Also, the variations in these parameters over time were significantly correlated, indicating that changes in leptin mRNA are reflected in similar changes in both plasma leptin and insulin.
The relationship between leptin and insulin secretion represented a matter of debate over the last years. It has been found that sustained hyperinsulinemia stimulates leptin mRNA expression, 33 although acute changes in insulin levels do not seem to affect the expression of this protein. 34 There is evidence that changes in insulin levels during weight loss are associated with changes in leptin even after corrections for changes in adiposity in women.25,35 Barr et al 36 reported that insulin increased both leptin secretion and production by white adipose tissue in rats when epididymal fat pads were incubated in vitro in the presence or absence of insulin. Insulin deficiency provoked by streptozotocin also markedly down-regulated leptin mRNA, and this suppression was rapidly reversed by insulin. 37 Other groups also reported that the mRNA levels for leptin in fully differentiated adipocytes were increased by insulin.38,39 In adipose cells, the level of leptin mRNA is sensitive to insulin in the nanomolar range of concentrations with an increase from an average of 1 copy to 5 to 10 copies/cell. 40 The effect of insulin was fully reversible and occurred primarily at a transcription level. Finally, a recent report 41 suggests that the glucose- and insulin-dependent expressions of leptin, insulin receptors, and lipogenic enzymes are coordinately and/or mutually regulated by dietary manipulation. Altogether, these results suggest that insulin is an important regulator of leptin gene expression.
The mechanism responsible for the increased insulin secretion in obesity is not clear, mainly in cases where glucose concentrations are not elevated. Hyperinsulinemia has been suggested, at least in part, to be caused by a reduced hepatic insulin uptake as a consequence of exposure of the liver to increased FFA levels coming from enlarged intra-abdominal fat depots. 42 Fatty acids considerably enhance glucose-stimulated insulin secretion in animals and humans.43–48 Stein et al44,45 observed that the lowering of the circulating FFA in fasted rats by infusion of nicotinic acid resulted in undetectable basal insulin concentrations and caused total ablation of insulin secretion in response to a glucose load. Our data clearly demonstrate a significant correlation between plasma FFA concentrations and insulin levels. Therefore, we hypothesize that circulating FFA levels might be a crucial factor in stimulating insulin and, then, leptin secretion.
Recently, a great deal of attention has been focused on the role of the lipids as major determinants of the insulin resistance in humans.16,49–51 Skeletal muscle, the principal site of insulin-mediated glucose disposal, 52 has an increased amount of triglyceride (TG) in obesity.51,53 It has been suggested there is a potential link between muscle TG content and insulin-resistant glucose metabolism,50,54–59 independent of central and overall adiposity.56,60 Manco et al 61 found an inverse correlation between degree of TG storage in skeletal muscle biopsies and whole body glucose uptake. Goodpaster et al 62 revealed that weight loss reduces the amount of adipose tissue infiltrating muscle (after a large weight loss, approximately 14 kg) down to 32% with a simultaneous improvement of insulin sensitivity in obesity.
Conclusions
Our data demonstrate a high correlation between leptin mRNA expression in adipose tissue and plasma leptin level in postobese subjects after BPD. The consistent correlation of both leptin mRNA of adipose tissue and plasma leptin with insulin levels suggests that leptin expression might be regulated by circulating insulin. Finally, to close the loop, plasma FFA concentrations seem to act as a first step in the insulin and, subsequently, in the leptin secretory pathway.