
Abstract
Background:
The 2006 Canadian Dermatology Association (CDA) member survey tracked the Canadian dermatology workforce. Information on use of nondermatologist extenders, impact of financial burden on practice style, and wait times was collected in the survey.
Objective:
To survey Canadian dermatologists for specialty-specific physician resource information including demographics, workload, and future career plans and compare it to results from the 2001 survey. In addition, to explore three other areas not covered in the previous survey: patient access to dermatologic care through wait times, the use of nondermatologist extenders, and potential impact of educational financial debt on practice styles.
Methods:
CDA members in 2006 were surveyed by mail. Follow-up mailings were done for nonresponders. Survey results were compared to those of the 2001 survey.
Results:
Thirty-six percent (216 of 602) of Canadian dermatologists responded (70% in 2001). The national distribution was identical between surveys. The median age increased to 55 years; two-thirds of dermatologists are male. The median retirement age remained at 65 years. There was a shift from rural to urban practice locations; 78% practice in private offices. Three-fifths of dermatologists do mainly medical dermatology, a decrease between surveys. Pediatric dermatology decreased 10%, whereas surgical dermatology increased 52% between surveys. Fewer practitioners perform noninsured services, and half as many perform research or hospital consultations or teach medical students. Financial debt burden had no impact on selection of practice style. Median wait times for nonurgent consultations doubled from 5 to 10 weeks; follow-up visits increased from 4 to 5 weeks; noninsured consultations increased from 4 to 5 weeks. The national median wait time for a third available consultation appointment was 42 days (range 7–161 days). Seventeen percent of dermatologists reported using nondermatologist extenders. Training programs produce only 60% of new practitioners needed to replace retirees over the next 5 years. Existing training programs are at full capacity, and only the creation of new programs can expand training capacity.
Conclusions:
Although the face of Canadian dermatology shows a productive specialty committed to patient care, teaching, and research, the demographics of the Canadian baby boom generation will have a major negative impact on the effectiveness of Canadian dermatology in the service of the Canadian population. The attrition rate predicted in the 2001 survey and validated by the 2006 survey spotlights the critical imperative for the specialty to adapt to the future of a shrinking workforce in the face of expanding demand for its services.
IN 2001, the Canadian Dermatology Workforce Survey was performed to identify and quantify the landscape of Canadian dermatology. Its results served to emphasize what has become the central health care issue in the country: health human resource planning. There is a general inadequacy of health human resources in Canada, which is particularly evident in the shortage of nurses and physicians.1,2 The shortage of physicians is likely secondary in part to the 10% cut in the enrolment to medical schools in response to the Barer-Stoddart report. 3
The 2001 Canadian Dermatology Association (CDA) member survey provided invaluable information about the demographics, workloads, practice styles, and future career plans of the Canadian dermatologist. In the context of a national crisis concerning health human resource planning, outlined in the Romanow report, 4 we had the unique opportunity to present our survey results and offer specialty-specific recommendations regarding the future. Maguiness and colleagues also made some prognostications on the identified trends seen with the survey results. 5
In 2006, the CDA member survey was performed using most of the same parameters used in the 2001 CDA member survey. It was expected that the 2006 survey would provide an opportunity to determine the validity of some of the prognostications contained within the 2001 survey. Furthermore, several new indicators were introduced in the 2006 survey: a benchmark for national wait times, the use of nondermatologist extenders, and the impact of financial burden on practice style.
The 2006 CDA member survey confirmed the predicted attrition of Canadian dermatologists and its anticipated impact on the provision of dermatologic services for the Canadian public.
Results
In 2006, the CDA surveyed 602 Canadian dermatologists for resource information. The purpose of the Canadian Dermatology Workforce Survey was to obtain information on demographics, workload, and future career plans from a fair distribution of dermatologists across Canada. Of the 602 dermatologists surveyed, 216 or 36% of all practicing dermatologists responded. To ensure fair representation from each province, a response rate of at least 30% of practicing dermatologist from each province was obtained (Table 1).
Summary of Interesting Statistics
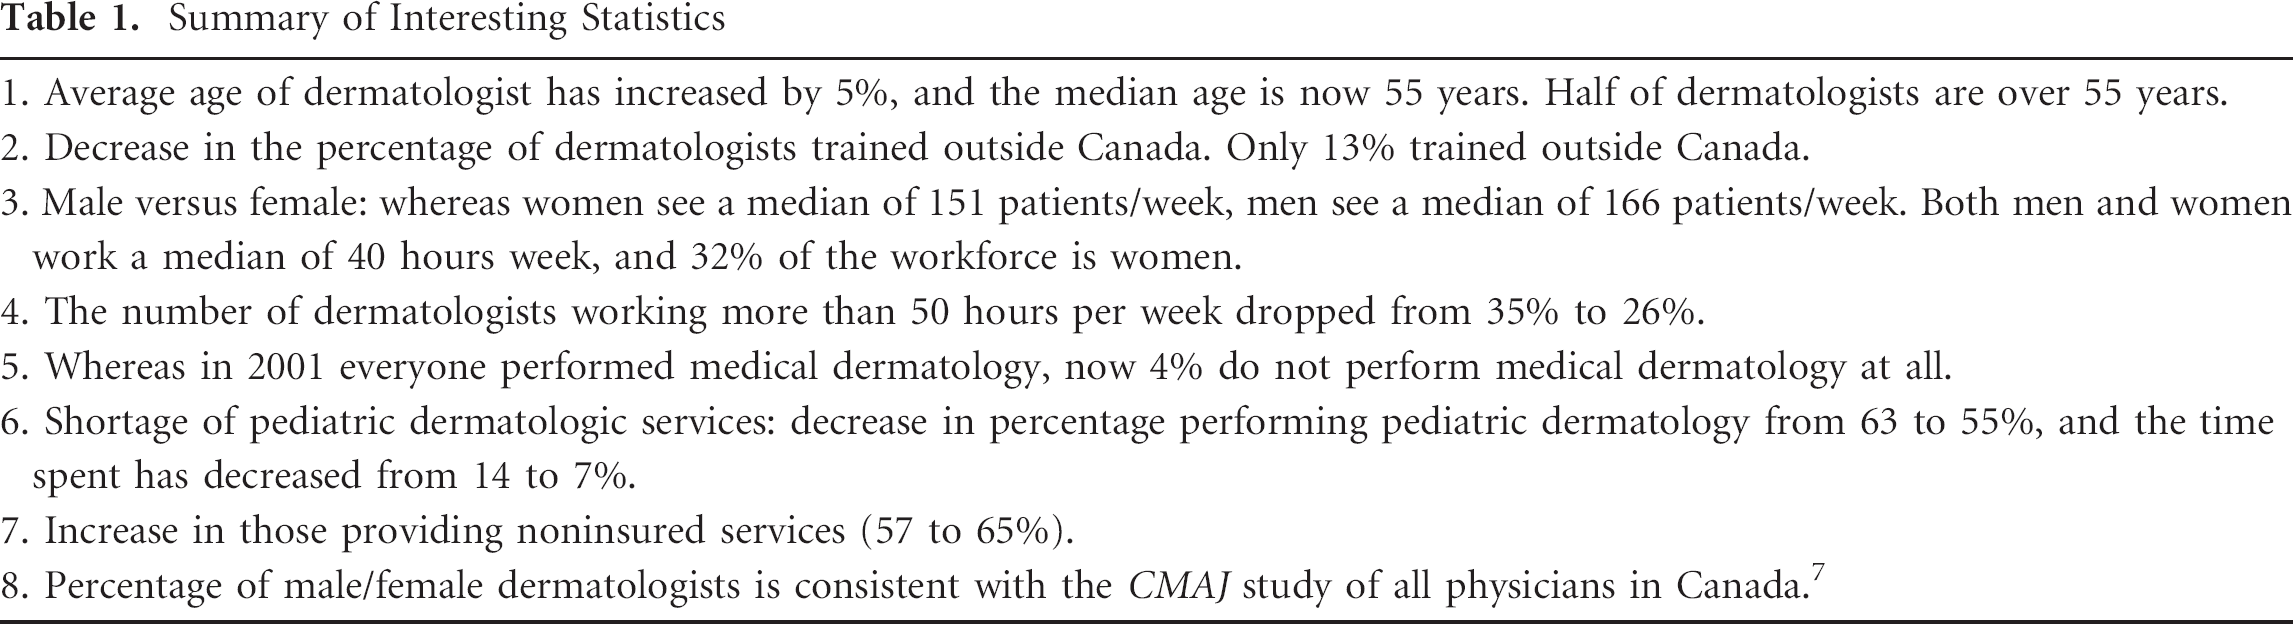
As this is a survey, the responses are inherently subjective, and the hours and percentages quoted by the surveyed are estimates. We were also only able to obtain a 36% response rate across the country despite multiple attempts through mailings, telephone calls, and faxes to collect more completed surveys. Given the rate of response, a small variation in the number of respondents for specialized areas such as pediatric dermatologists or dermatopathologists could translate into a significant variation in our results.
Demographics
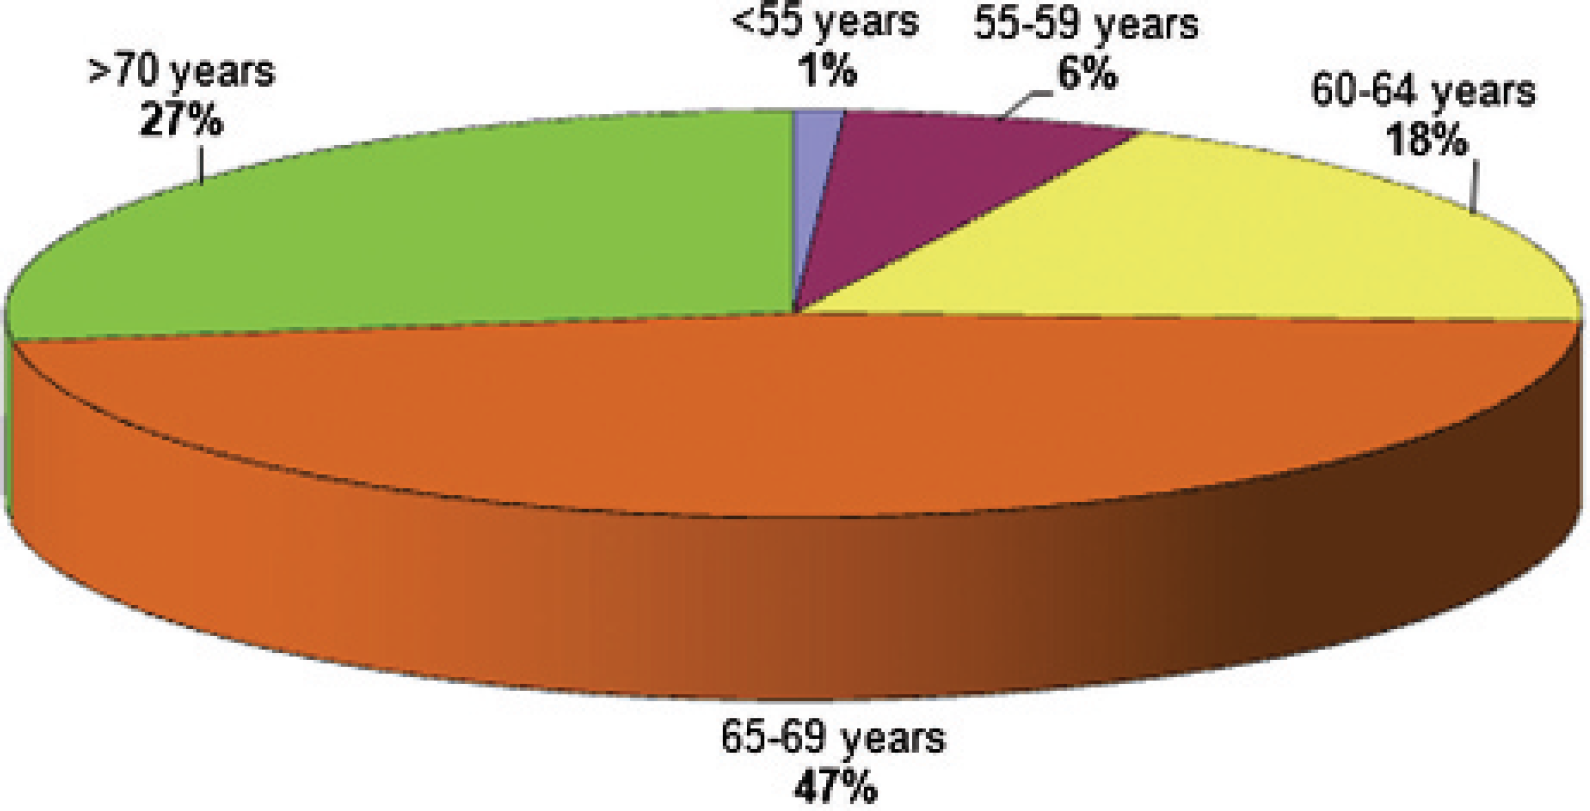
As predicted in the 2001 survey, the dermatologist population in Canada is aging (Figure 1). The average age of dermatologists in Canada was 55 years compared with 52 years in 2001. More significant was that the number of dermatologists over the age of 55 years had increased from 35 to 50%. At the time of the survey, there were relatively more male than female dermatologists, increasing from 63% in 2001 to 66%. The majority of dermatologists practicing in Canada were trained in Canada, with only 13% trained outside Canada (2001, 14.5%). Most dermatologists are trained in eastern Canada, with 21% from the University of Toronto, 20% from the Université de Montréal, 14% from McGill University, 9% from the University of Ottawa, 5% from Laval University, and 2% from Dalhousie University. From western Canada, 12% were trained at the University of British Columbia and 2% from the University of Alberta. These numbers were very similar to those from the 2001 survey.
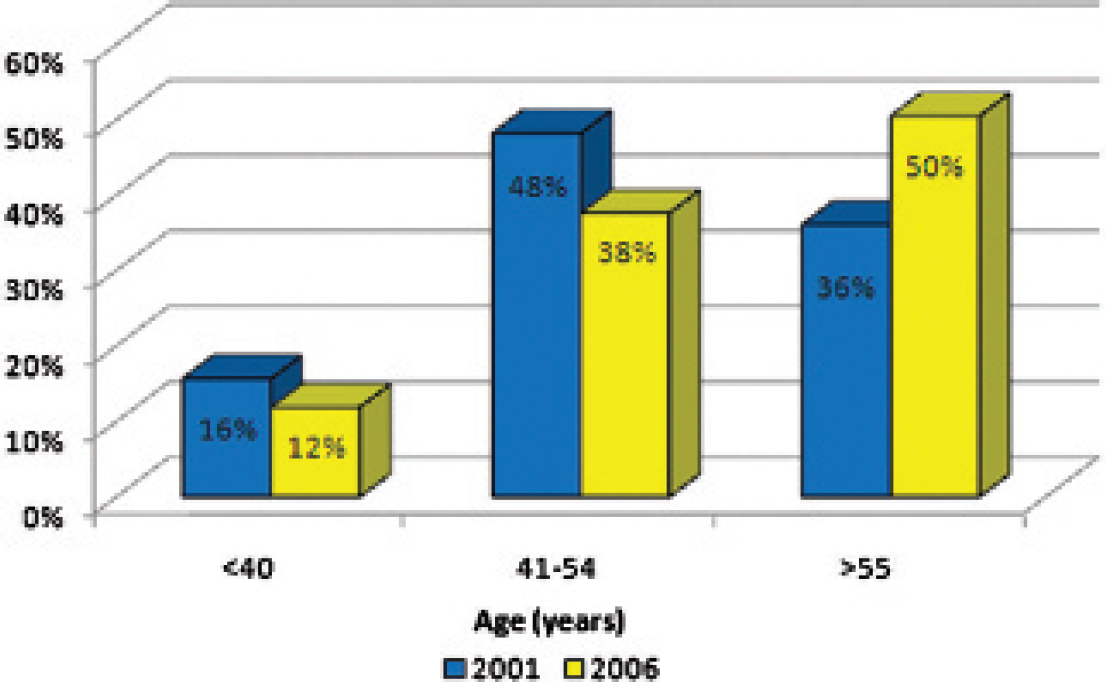
Age distribution of Canadian dermatologists reported in the 2001 and 2006 surveys. The median age increased from 52 years to 55 years between surveys.
In examining practice locations, 95% of dermatologists had an urban practice component (population > 70,000), 16% had a rural component (population between 10,000 to 69,999) to their practice, and 7% had a remote practice component (population < 10,000). Compared with the 2001 survey, the number of dermatologists who had an urban component to their practice rose from 89 to 95%, the number of dermatologists with a rural component fell from 19% to 16%, and the number of dermatologists who had a component of remote practice rose from 0.5 to 7%. Approximately 93% of dermatologists spent their time in an urban practice, with only 7% stating that they spent 50% or more of their time in rural practice and only one dermatologist (< 0.5%) stating that he spent most of his time in a remote practice setting.
The majority of dermatologists spent their time in a nonhospital setting (78%), whereas 17% spent most of their time in a teaching hospital and only 5% spent most of their time in a community hospital. However, 54% of all dermatologists devoted a portion of their time in a teaching hospital setting, 28% in a community hospital setting, and 89% in a nonhospital setting.
Workload and Activities
When examining the amount of time spent in particular aspects of clinical dermatology, Canadian dermatologists spent the same amount of time in medical dermatology (2006, 62%; 2001, 61%), a greater amount of time was spent on insured surgical services (2006, 18%; 2001, 14%), a lesser amount of time was spent in pediatric dermatology (2006, 7%; 2001, 9%), and a lesser amount of time was spent in other types of dermatology (2006, 13%; 2001, 16%), such as dermatopathology, research, noninsured services, advisory boards, and phototherapy.
When examining the type of clinical practice among the dermatologists, a greater percentage spent the majority (ie, greater than 50%) of their time in medical dermatology (2006, 71%; 2001, 68%), a greater percentage spent the majority of their time on insured surgical services (2006. 4%; 2001, 2%), the same spent the majority of their time in pediatric dermatology (2006, 2%; 2001, 2%), and fewer spent the majority of their time in other types of dermatology (2006, 0%; 2001, 1%), such as dermatopathology, research, noninsured services, advisory boards, and phototherapy.
However, when looking at the number of dermatologists who have components of each type of dermatology in their practice, most dermatologists are now concentrating their practice type to a specific area of interest rather than having a broad generalist practice (Figure 2). Compared to 2001, fewer did any medical dermatology (2006, 96%; 2001, 100%), the same number did any surgical dermatology (2006, 83%; 2001, 84%), fewer did any pediatric dermatology (2006, 55%; 2001, 63%), and fewer did noninsured services (2006, 41%; 2001, 57%).
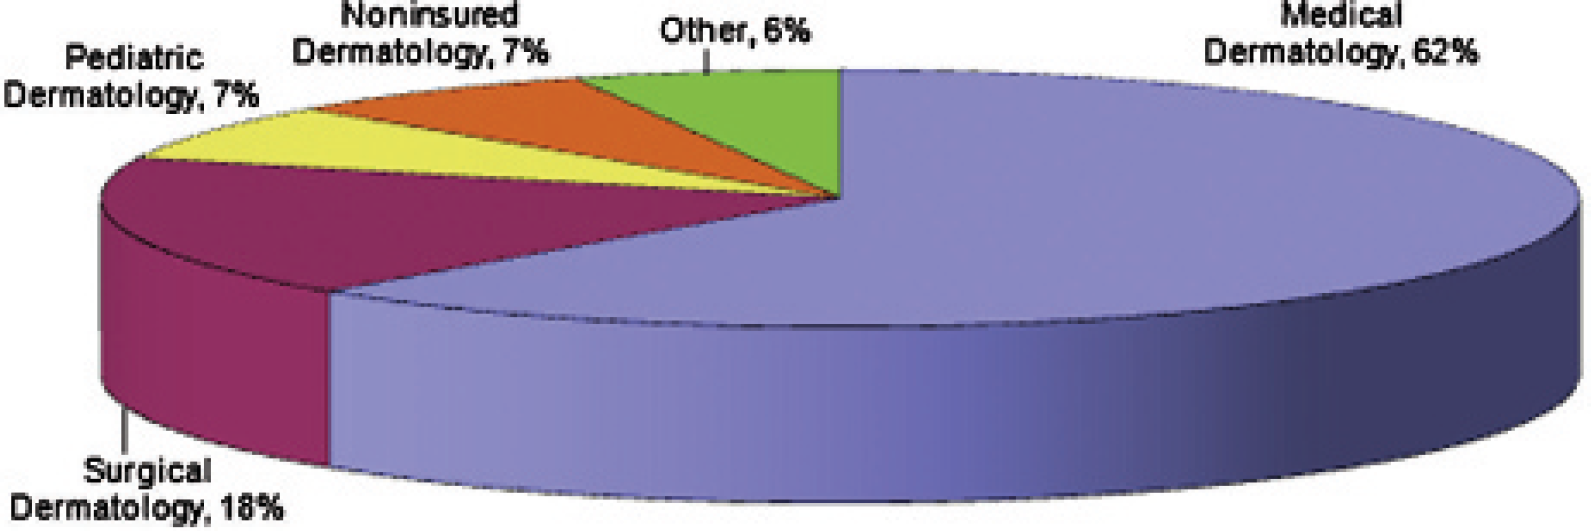
Distribution of time spent according to area of interest by Canadian dermatologists in 2006.
The average dermatologist worked 44 hours per week (2001, 45 hours per week) over an average of 46 weeks of work per year (2001, 46 weeks per year) (Figure 3). The percentage of dermatologists who worked over 50 hours per week was 26% (2001, 36%), and among that group, 36% are over 55 years old. Although female dermatologists saw fewer median patients per week (female, 151; male, 166) (Figure 4), the median hours worked for both males and females were the same at 40 hours per week. This number fell from 45 hours for males in 2001 but stayed the same for women.
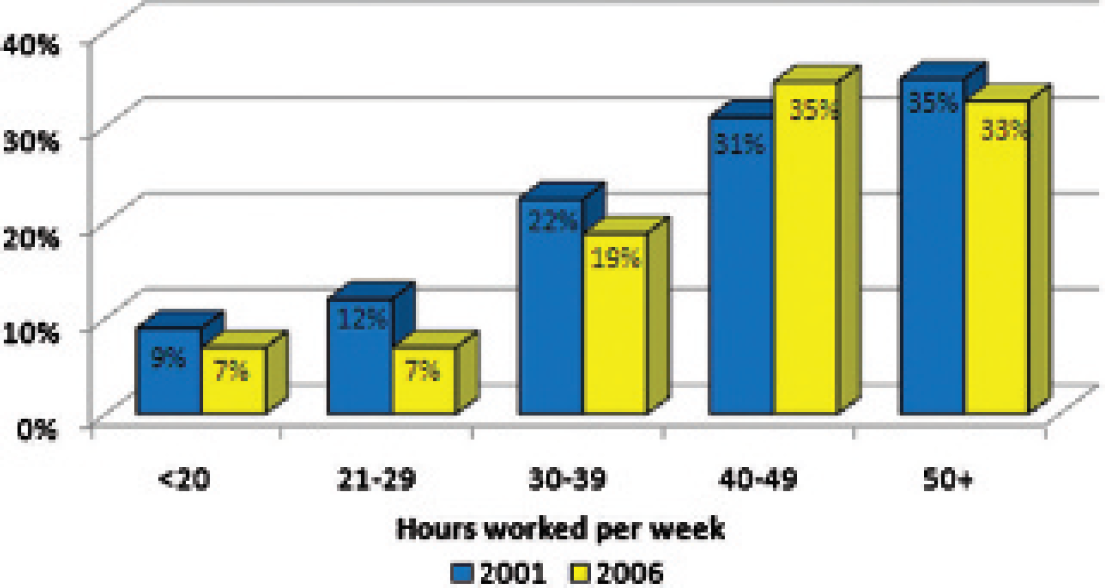
Hours worked per week by Canadian dermatologists for the survey years 2001 and 2006.
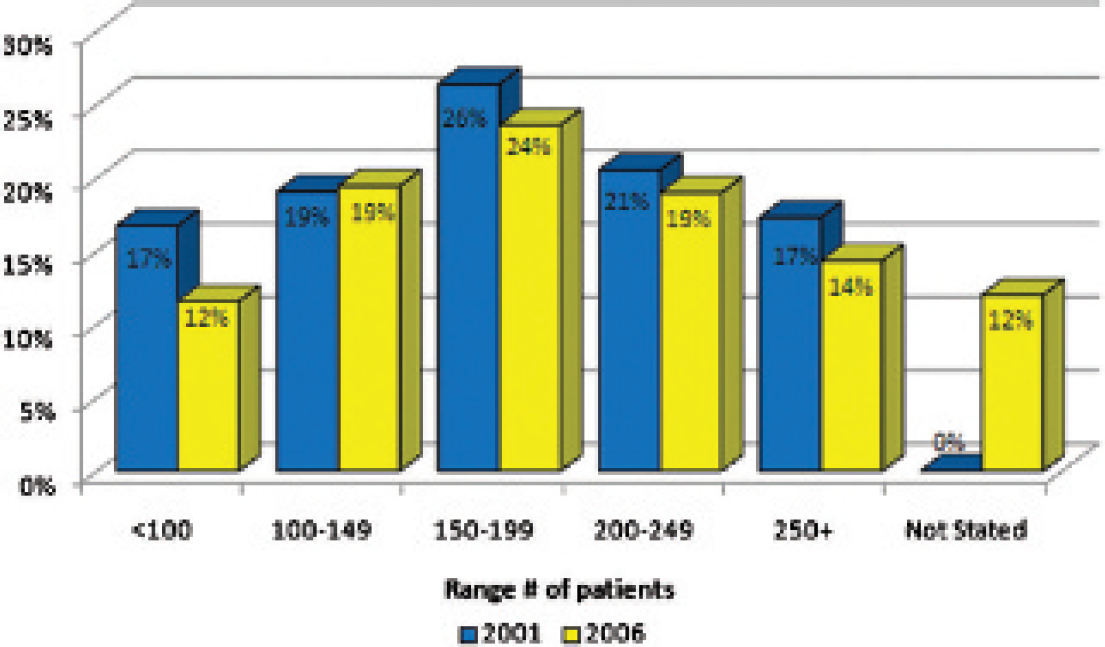
Number of patients seen per week by Canadian dermatologists during the survey years 2001 and 2006.
There were more dermatologists spending time on advanced surgical dermatology, with an increase of 52% (2006, 18%; 2001, 12%) and a 42% increase in those performing Mohs surgery (2006, 6%; 2001, 4%). It would seem that more dermatologists who perform surgeries are focusing on surgery in their practice, with an increase of 80% (2006, 11%; 2001, 6%) spending more than 11 hours per week on surgery.
The percentage of dermatologists who provided noninsured services increased to 65% (2001, 57%); the same 17% provided laser services and phototherapy. There was a decrease to 13% (2001, 15%) who provided occupational dermatology.
The amount of time dermatologists were spending on clinical research had not changed significantly. Those spending more than 26 hours per month on research fell from 4% to 2%, and the percentage doing clinical research increased slightly from 29 to 30%.
The number of dermatologists who did hospital consultations decreased from 72% to 58% (a decrease of 20%), whereas those who did the consultations were spending an average of 8 hours per week in the hospital. The number who saw patients at long-term care facilities had also decreased by 29% (from 32% to 23%), whereas the hours spent per week stayed the same at 4 hours. Telemedicine conferencing had increased from 5 to 8%.
The number of dermatologists who attended continuing medical education (CME) decreased slightly from 94% to 91%, whereas the median hours per year spent on CME was 43 hours (a 325% increase from 10 hours per year). Most dermatologists read journals (91%, decreased from 97%), with a median of 2 hours per week. The same number of dermatologists provided classroom teaching (50%) (Figure 5), whereas slightly fewer dermatologists provided private office teaching (46%, increased from 38%). The median hours per month spent on private office teaching is 8 hours per month, an increase from 2 hours per month. The number of dermatologists who provided hospital-based clinic teaching dropped dramatically from 60% in 2001 to 46% in 2006, on average spending 28 hours per month teaching (increased from 21 hours per month). Therefore, dermatologists seem to prefer to teach in a private office setting rather than in a hospital-based setting. However, although the percentage of dermatologists teaching in a hospital has decreased, the median hours per month has increased from 2 hours per month to 12 hours per month.
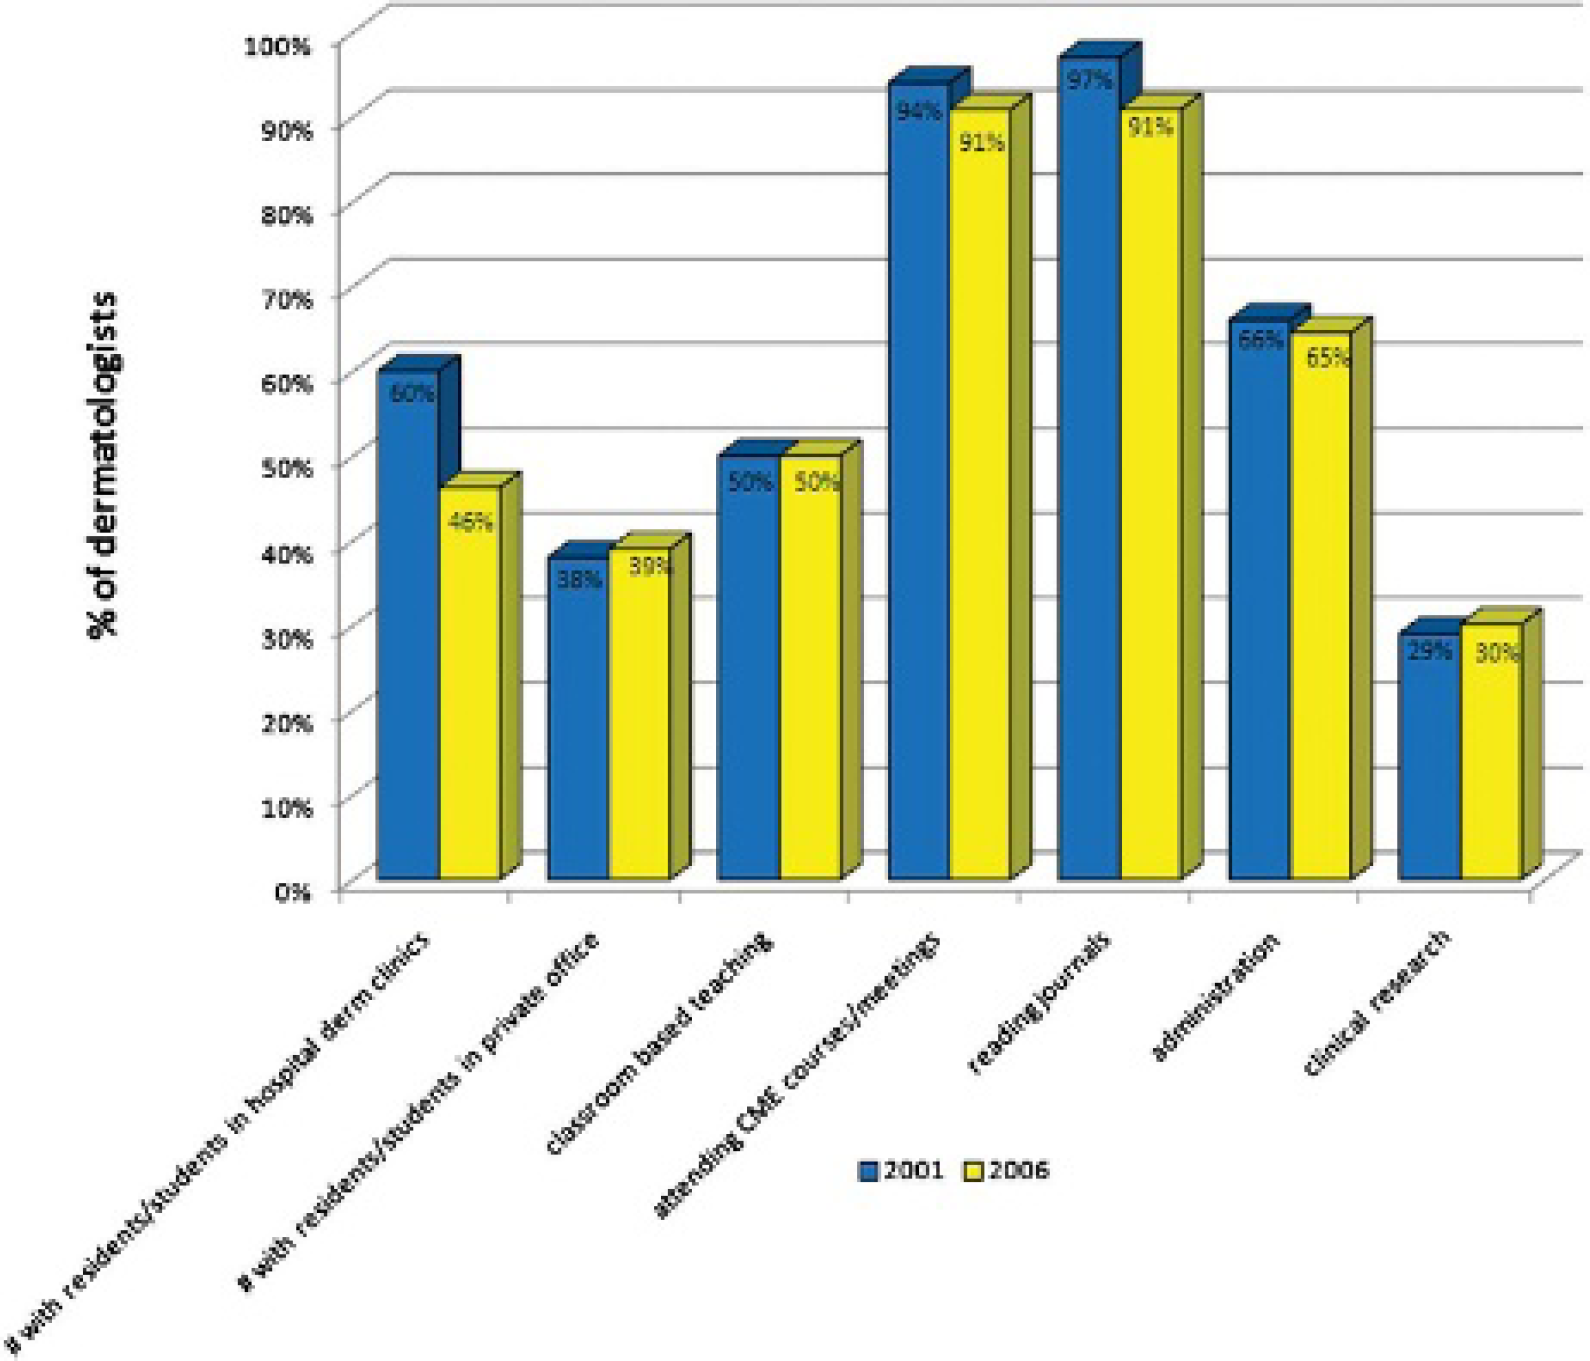
Proportion of Canadian dermatologists participating in teaching and personal professional development activities in the survey years 2001 and 2006. CME = continuing medical education.
Wait Times
Overall, wait times have increased compared to 2001 numbers (Figure 6). The most alarming increase in wait time was for urgent consultations. The average wait for an urgent consultation increased from 17 hours to 35 hours, and the median increased from 8 hours to 24 hours. For nonurgent medically insured consultations, the median wait time increased from 5 weeks to 10 weeks, and for follow-up visits, the median wait time increased from 4 weeks to 5 weeks. The median wait times for noninsured procedures increased from 3 to 4 weeks, and the follow-ups decreased slightly from 2.5 weeks to 2 weeks (Figure 7).
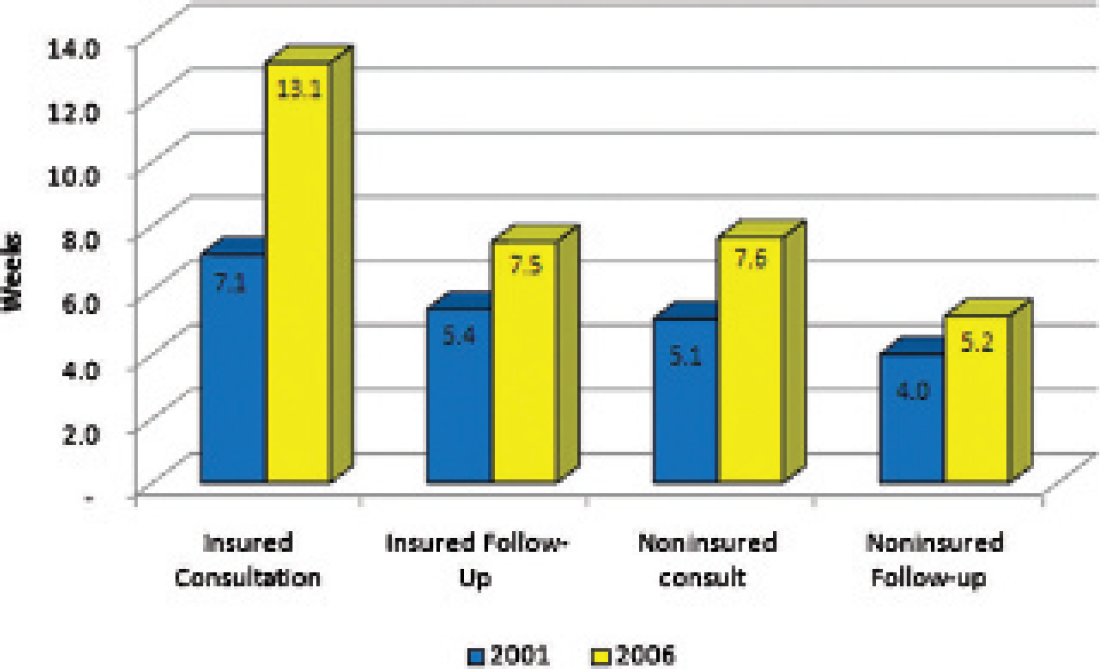
National average wait times according to visit type for Canadian dermatologists in the survey years 2001 and 2006.
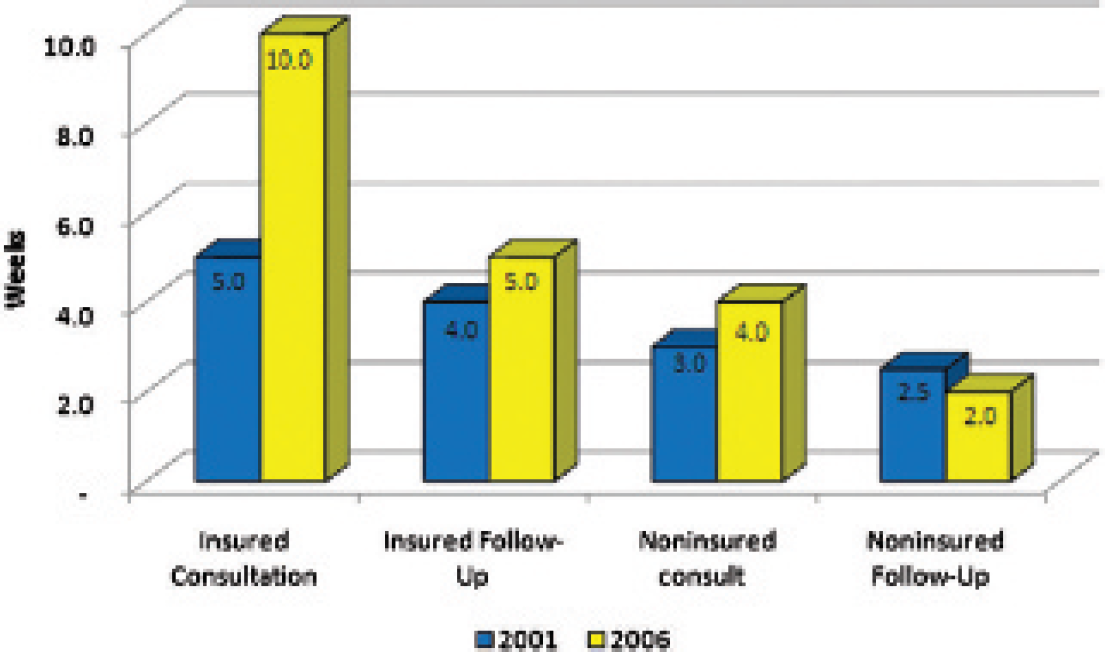
National median wait times according to visit type for Canadian dermatologists during the survey years 2001 and 2006.
A commonly accepted benchmark for measuring wait times is the time to the third available appointment for a nonurgent, medically insured consultation. This benchmark would provide the referring physician with an estimate on how long a patient with a new problem will be required to wait for a first appointment with the dermatologist. The third available appointment is used to minimize the impact of a cancellation on the true wait time. This metric is also relatively simple to determine as most dermatologists use an electronic scheduling system that can identify the available appointments according to their visit type. In 2006, the national average wait time to the third available apppointment was 64.5 days (median 42 days). There were substantial variations between geographic regions, ranging from as few as 7 days to as long as 161 days (Figure 8).
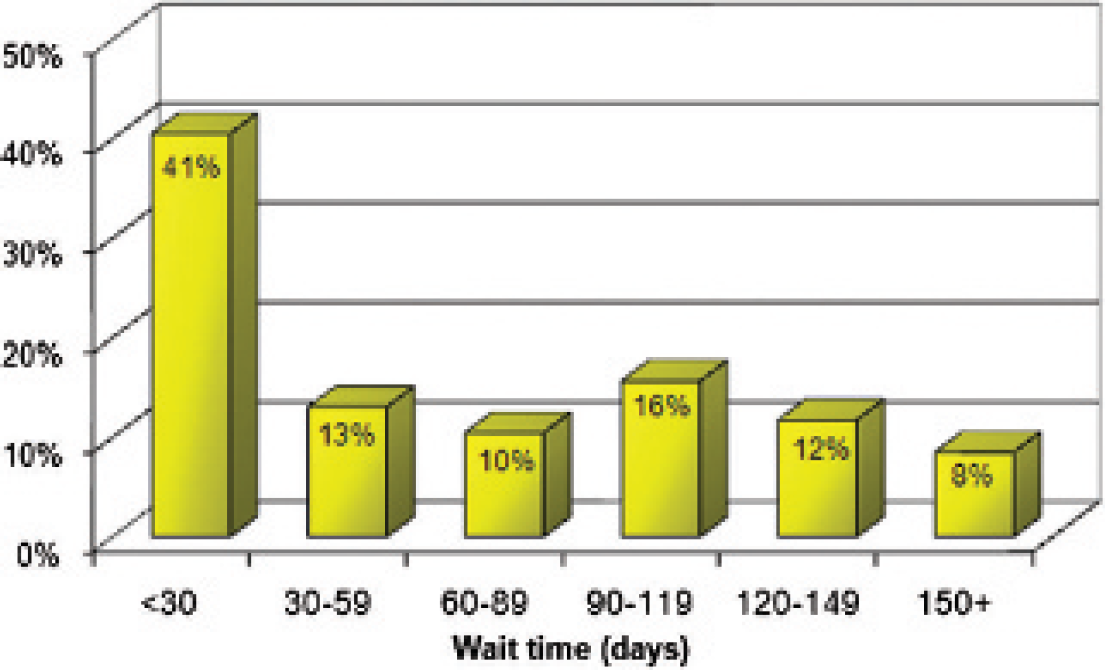
Wait times for a medically insured consultation with Canadian dermatologists. There was substantial geographic regional variation.
Retirement
The average age of retirement increased from 63 to 66 years, but the median retirement age remained the same at 65 years (Figure 9). The percentage of Canadian dermatologists who planned to reduce hours worked over the next 5 years decreased from 44% to 42%. The percentage who planned on retirement over the next 5 years decreased from 15% to 14%.
Proposed age of retirement of Canadian dermatologists. The median age of retirement is reported at 65 years.
Financial Burden at Time of Certification
The 2006 survey examined the financial debt of new certificants. The survey then correlated the amount of financial debt to practice style. Some studies in the United States proposed a hypothesis that dermatologists with a higher financial debt incurred during training tended to select practice styles that provided higher remuneration. 6 For example, dermatologists who perform surgical procedures have higher median revenues than those who perform nonprocedural practice styles. Furthermore, dermatologists who practice in nonacademic settings will have higher median revenue than dermatologists who practice in academic settings.
The average amount of debt is $57,856, and the median is $30,000. There were no differences in practice styles or settings between dermatologists who reported high financial debt and those who reported low financial debt. Although the number surveyed was limited, there is no support for the perception that newly trained dermatologists will select practice styles with higher remuneration based on financial burden.
Predicting the Future
According to a 2003 Canadian Medical Association Journal (CMAJ) article, there were 1.6 dermatologists per 100,000 people. 7 In the United States, there were 3.5 per 100,000 people. Based on 602 active dermatologists in 2006 and a Canada census population of 31.6 million people, there were 1.9 dermatologists per 100,000 people. 8
Over the next 5 years, 40 dermatologists (of the 183 who answered the question, 22%) will retire, and an additional 42 in the following 5 years, so over the next 10 years, 82 dermatologists will have retired (45%). In other words, 22% of dermatologists will retire in the next 5 years, and 45% of dermatologists will retire in the next 10 years.
From 2006 to 2011, we expect 76 dermatologists to enter the workforce from Canadian universities. If we extrapolate the 22% retirement rate (30% response rate for our survey question) over the next 5 years, that translates into approximately 130 retiring in the next 5 years. To maintain the current level of service, accounting for attrition and retirement, we need at least an additional 54 dermatologists over the next 5 years. This calculation also presumes that the productivity of each practicing dermatologist will remain the same and does not take into account the aging patient population and the proportionate increase in service demand. It would be difficult to predict the number of dermatologists in the workforce in 10 years without more accurate information regarding the number of expected residency positions in each dermatology program in the next 5 years.
Although the general trend predicts a growing number of dermatologists in the future, nearly half of the current practicing dermatologists plan on retiring within the next 10 years, and that, compounded with the aging Canadian population, will create a severe shortage of dermatologic services.
Comparison of Workforce Issues in the United States
Examination of the workforce dynamics has been tracked in the United States over the same time period. Although practice patterns and training are different between Canada and the United States, several trends bear examination.
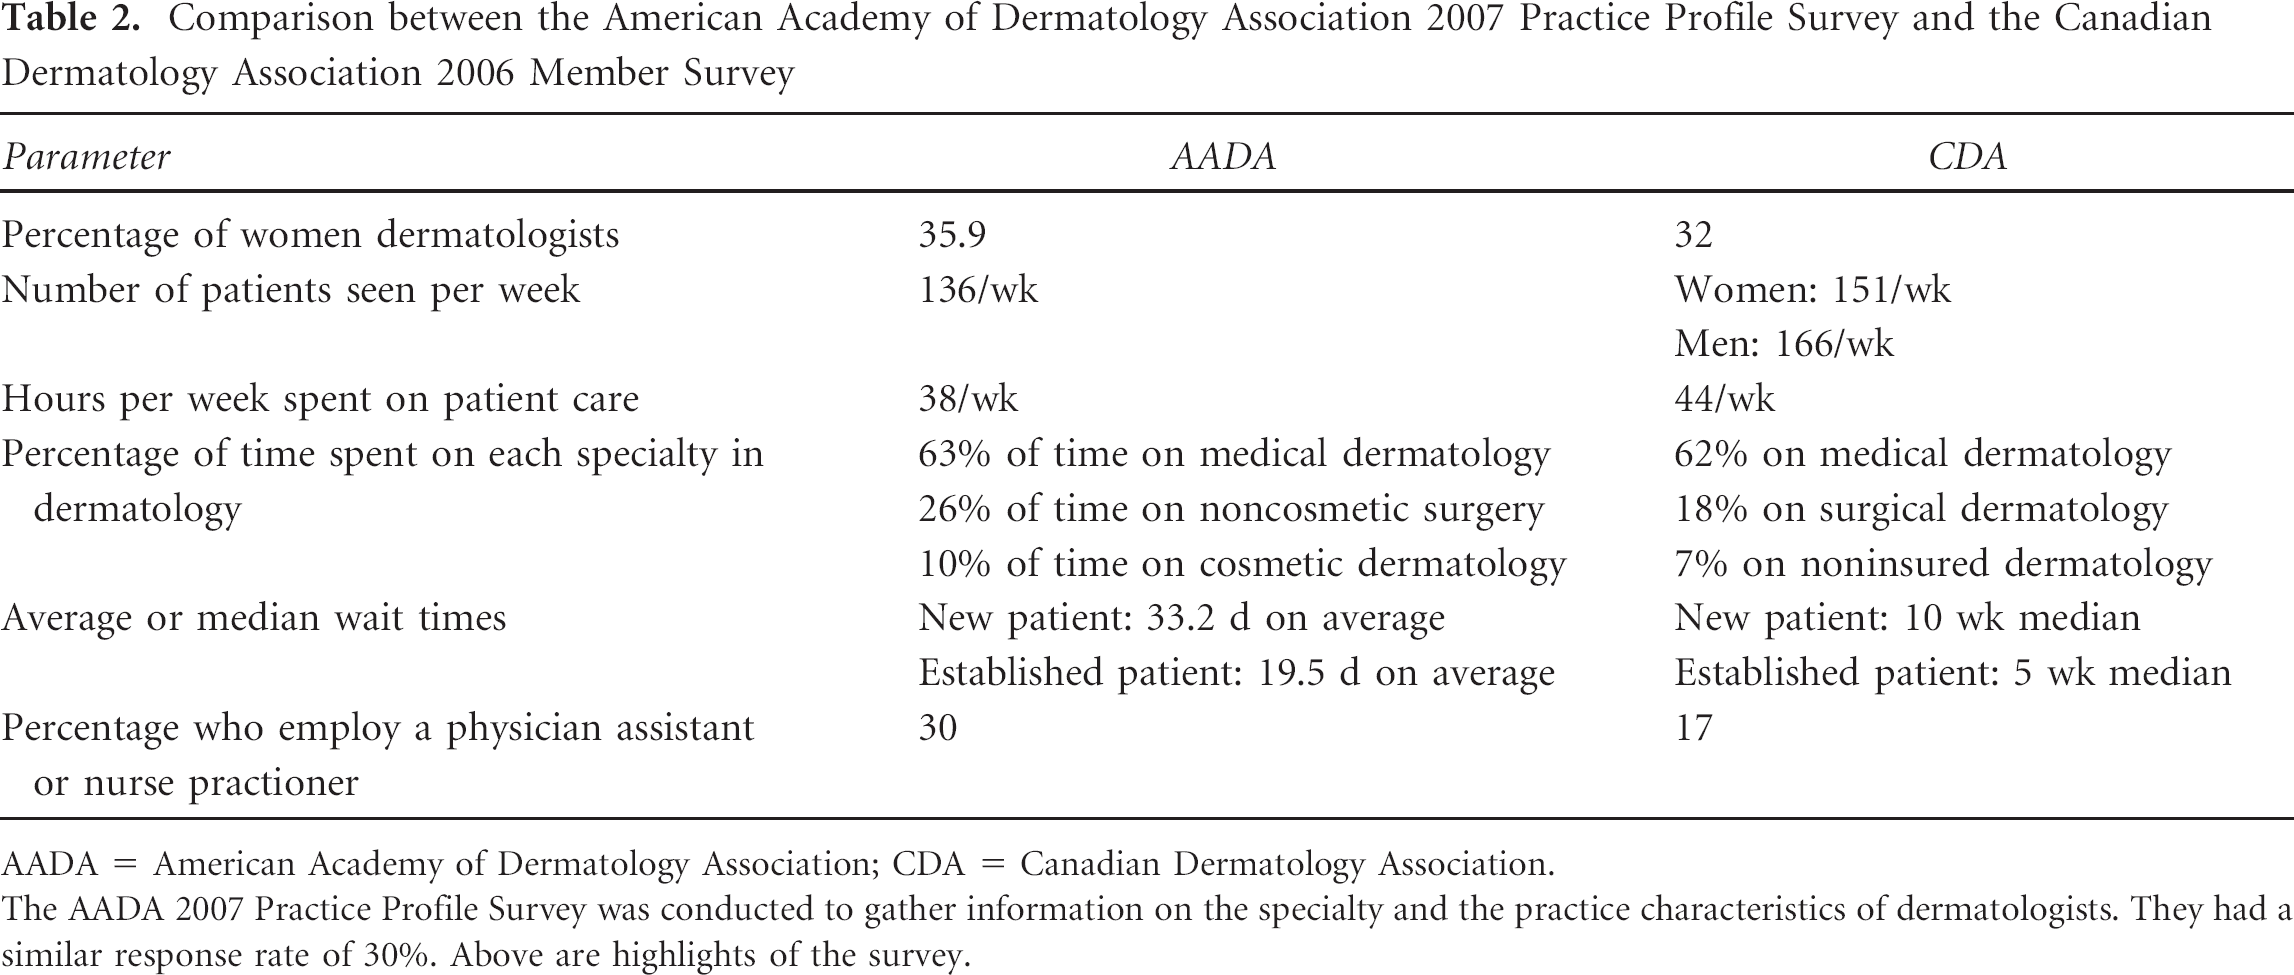
The American Academy of Dermatology Association (AADA) conducted a workforce survey of its membership in 2007. 9 They, too, reported a 30% response rate to their survey (Table 2). The demographics of the survey populations were similar, with a similar number of respondents being women (AADA, 35.9%; CDA, 32%). Canadian dermatologists tended to see more patients on a weekly basis (AADA, 136 patients/week; CDA, 162 patients/week), partly because they had a longer work week (AADA, 38 hours/week; CDA, 44 hours/week). Case mix was similar between the two groups, with similar numbers in each country reporting medical, surgical, and noninsured services.
Comparison between the American Academy of Dermatology Association 2007 Practice Profile Survey and the Canadian Dermatology Association 2006 Member Survey
AADA = American Academy of Dermatology Association; CDA = Canadian Dermatology Association.
The AADA 2007 Practice Profile Survey was conducted to gather information on the specialty and the practice characteristics of dermatologists. They had a similar response rate of 30%. Above are highlights of the survey.
The largest discrepancy between Canadian and American dermatologists was in the reported wait times. However, there may be differences in how the wait time was determined as the criteria were subjective in both populations, and no objective benchmark was used. Nonetheless, there is a large difference between Canadian and American dermatologists in how long it takes for a patient to see a dermatologist.
Looking Back at Looking Forward
Analysis of the 2001 CDA member survey 5 provided an opportunity to track trends on workforce numbers and productivity. The 2006 CDA member survey provided an opportunity to validate some of the predictions from 5 years before. The attrition rate of Canadian dermatologists was accurately predicted, and the advancing median age of Canadian dermatologists indicated that existing efforts to expand and recruit new dermatologists have not halted the net attrition rate. Thus, in 7 years, almost half of all current Canadian dermatologists will have retired from active practice. Furthermore, as this cohort of practitioners approach retirement, their productivity will progressively decline, both in numbers of patients seen and in hours worked each week.
The increasing number of dermatologists who are providing surgical dermatology will assist in the expected demand in treating skin malignancies in the aging Canadian population. However, this increase will be inadequate to meet the demand expected within the next 5 years.
Mechanisms for Accommodating Demand
The 2001 member survey reported by Maguiness and colleagues proposed several recommendations for improving workforce capacity. 5 The results of the 2006 member survey can illuminate the progress of several of these trends:
Increasing residency training program capabilities. Residency training spots have increased since the 2001 member survey. Using the 2002–2007 Canadian Resident Match Service statistics, 10 the number of dermatology residency positions has increased by 200%. This is in comparison to other small programs, such as otolaryngology (93% increase), ophthalmology (94%), and plastic surgery (118%). Overall, the number of postgraduate year 1 (PGY-1) Canadian resident match positions, including all disciplines, has increased by 81%. Dermatology programs in Canadian universities have taken steps to fill the dermatologist shortage by increasing the number of graduates. In addition to these PGY-1 match positions, there were also universities introducing reentry positions into the third year of the program, allowing family physicians to retrain, or allowing residents from other programs to transfer into dermatology. Currently, there are 19 government-funded positions. There are two spots each at Laval University, Sherbrooke University, Université de Montréal, McGill University, and University of Ottawa; four spots at the University of Toronto, one spot at the University of Alberta; and three spots at the University of British Columbia. There is also an international medical graduate (IMG) position at the University of Toronto. The University of Alberta may also participate in providing suitable IMGs through the Alberta IMG program initiative, starting in 2009.
Creation of new academic training centers. The last new dermatology training program was established in 1988 at the University of Alberta. There have been no new applications for new programs since then. However, with the expansion of enrolment at almost every medical school in Canada and the limits to training capacity at the existing dermatology training programs, there is opportunity for the establishment of new training centers in Canada. The most likely candidates would be at other Canadian medical schools that have established core resident training programs and a core of dedicated academic and community-based dermatologists. However, it will take at least 6 to 10 years before the first certificant would be produced from the new programs.
Improving the skills of general practioners in services related to dermatology. The introduction of dermatology extenders is not unique. The 2007 AADA Member Profile Survey indicated that 30% of American dermatologists employ nondermatologist extenders to provide patient care. These nondermatologist extenders can be nurse practitioners, physician assistants, or general practitioners with an interest in dermatology. In Canada, 17% of dermatologists surveyed reported using nondermatologist extenders in patient care. It remains to be seen how the use of extenders will impact outcomes and quality of care. However, many jurisdictions are using dermatologist substitutes to meet the patient demand.
Providing undergraduate medical students with better training in dermatology. Several Canadian medical schools have modified their undergraduate curricula, with the result of having fewer hours of dermatologic teaching within the curriculum. Dermatologists surveyed reported the same number of hours in the lecture hall but fewer hours in the clinic with medical students. Thus, whereas a better educated medical student population may provide for better primary care of common dermatologic conditions, the current trend of fewer opportunities to see dermatologic patients in the clinic would indicate that future medical students will be less prepared to identify and manage dermatologic conditions in their patients. Currently, there is no trend to provide more teaching opportunities in dermatology at the undergraduate level in Canadian medical schools.
Summary
The 2006 CDA member survey provided an ongoing track of the Canadian dermatology workforce and provided a comparison to a similar survey conducted 5 years previously. Although the face of Canadian dermatology shows a productive specialty that is committed to patient care, teaching, and research, the demographics of the Canadian baby boom generation will have a major negative impact on the effectiveness of Canadian dermatology in the service of the Canadian population. The attrition rate predicted in the 2001 survey and validated by the 2006 survey spotlights the growing urgency for the specialty to adapt to the future of a shrinking workforce in the face of expanding demand for its services.
Footnotes
Acknowledgment
Financial disclosure of authors and reviewers: None reported.