
Abstract
Background
Hyperinsulinemia has been associated with hepatic fat deposition and ensuing insulin resistance. It is unknown if treatment with exogenous insulin in patients with type 2 diabetes, who are most prone to hepatic fat accumulation, would promote the occurrence or worsening of nonalcoholic fatty liver disease.
Methods
Patients with treatment-naive type 2 diabetes (N = 16) were treated with insulin and metformin for a 3-month lead-in period, then assigned triple oral therapy (metformin, glyburide, and pioglitazone) or continued treatment with insulin and metformin. Hepatic triglyceride content (HTC)—measured by magnetic resonance spectroscopy, serum lipids, glucose, liver function tests, and inflammatory and thrombotic biomarkers were followed for a median of 31 months.
Results
The 45% decline in HTC during the lead-in period persisted through the follow-up period with no difference between treatment groups at the end of the study (5.26 ± 4.21% in the triple oral therapy vs 7.47 ± 7.40% for insulin/metformin), whereas glycemic control was comparable.
Conclusions
Improvements in HTC with initial insulin/metformin therapy persisted through the median 31-month follow-up period regardless of the treatment. More importantly, insulin-based treatment did not appear to promote or worsen nonalcoholic fatty liver disease.
Nonalcoholic fatty liver disease (NAFLD), the most common cause of liver disease in the United States, is characterized by the intracytoplasmic accumulation of hepatic triglycerides. 1 NAFLD encompasses a histopathological spectrum from simple steatosis to nonalcoholic steatohepatitis and represents the fastest growing etiology for cirrhosis and end-stage liver disease. Insulin resistance and obesity both associate with NAFLD and type 2 diabetes, and it was noted that up to 78% of patients with type 2 diabetes also have hepatic steatosis. 2 Given the significant consequences of NAFLD, especially in patients with type 2 diabetes, it is important to evaluate the effect of diabetes treatment on occurrence or progression of hepatic steatosis.
Insulin sensitizers approved for diabetes treatment, including thiazolidinediones (TZDs) and biguanides, have demonstrated short-term hepatic triglyceride content (HTC) improvement. Pioglitazone, a second-generation TZD, increases adiponectin levels and blocks sterol regulatory element binding protein-1c. 3 Patients with type 2 diabetes treated with pioglitazone demonstrate reduced HTC, 4 as well as improvements in histology and biochemistry in studies with follow-up of up to 1 year.5,6 Metformin reduces expression of hepatic TNF-α,7,8 but its use in NAFLD has produced conflicting results.9–12 Currently, no approved therapies exist for the treatment of NAFLD.
Insulin stimulates intracellular triglyceride synthesis while inhibiting lipolysis. In one study, 13 8 patients with type 2 diabetes underwent a 72-hour hyperinsulinemic-euglycemic clamp and demonstrated increased hepatic steatosis compared with prior baseline measurements. In contrast, a 3-month pilot study in 19 newly diagnosed type 2 diabetes patients 14 using insulin/metformin combination treatment demonstrated improved hepatic steatosis. A 3-month combination therapy with insulin/metformin has previously resulted in a 45% reduction in HTC (P < 0.001) and resolved hepatic steatosis in 75% of patients. 15 Whether long-term exogenous insulin therapy promotes hepatic fat deposition accelerating the progression of steatosis is uncertain.
As pancreatic β-cell function and insulin sensitivity deteriorate in type 2 diabetes, combinations of oral antidiabetic (OAD) agents, with or without exogenous insulin, may help patients achieve satisfactory glycemic control. 16 Interventional studies for NAFLD historically exclude patients with type 2 diabetes because of the confounding effects of OADs and insulin therapy. These studies do not evaluate the long-term impact of therapy on hepatic steatosis. We performed an open-label, prospective clinical trial of patients with newly diagnosed type 2 diabetes to investigate the effects of insulin/metformin versus combination OADs, specifically metformin/pioglitazone/glyburide (“triple oral therapy”) to characterize the long-term progression of hepatic steatosis as measured by localized proton magnetic resonance spectroscopy (MRS).
Materials and Methods
Study Participants
Treatment-naive patients aged 21 to 70 years diagnosed with type 2 diabetes within the preceding 2 months were recruited into a parent study from Parkland Memorial Hospital diabetes services and self-referral at the Clinical Diabetes Research Clinic at the University of Texas Southwestern Medical Center (UTSW) in Dallas, Texas. Exclusion criteria included: type 1 diabetes–related antibodies, HbA1c less than 7%, serum creatinine greater than 1.5 mg/dL, women who are pregnant or not using contraception, and history of heart failure or lactic acidosis. All patients met additional inclusion criteria of weight less than 160 kg, absence of metallic implants, claustrophobia, and known chronic liver diseases of any etiology. Additionally, patents met exclusion criteria prohibiting illicit drug use within the past 6 months or consumption of 2 or more alcoholic drinks daily. The study protocol was approved by the local institutional review board, and participants provided written informed consent before enrollment.
Treatment
Patients were treated for a 3-month lead-in period with a combination of NovoLog Mix 70/30 and metformin (1000 mg twice daily). 15
After the 3-month lead-in period, patients either continued insulin/metformin or discontinued insulin and began triple oral therapy at visit 2 (month “0”). Treatment was assigned in the parent study using a block randomization scheme as described previously. 17 Patients assigned to triple oral therapy were treated with metformin (1000 mg twice daily), pioglitazone (45 mg once daily), and glyburide (1.25 mg twice daily). Dose titration of insulin and glyburide (up to 10 mg daily) was performed by the study physician throughout the study to maintain target glycemic control (HbA1c, ≤6.5%). Initiation and dose adjustment of antihypertensive and lipid-lowering agents were permitted after the treatment allocation visit if medically necessary.
Measurements
Biochemical evaluations, performed at baseline and within 3 months of each MRS, included blood glucose, insulin, HbA1c, liver function tests, and lipid profile. All blood samples were obtained while fasting (10–14 hours), in the morning, processed immediately and analyzed within 24 hours. Liver function tests, glucose levels, and lipid profiles were measured by a commercial laboratory (Quest Diagnostics, Irving, TX). Insulin levels were measured using radioimmunoassay (Coat-A-Count Insulin TKIN1; Siemens Healthcare Diagnostics, Tarrytown, NY) and HbA1c using high-performance liquid chromotography in the UTSW Clinical Diabetes Laboratory.
Hepatic triglyceride content was measured using MRS at baseline (month “-3”) at the treatment assignment visit (month “0”) and compared with follow-up studies performed after short-term treatment (months 10-23) or long-term treatment (months 24–42). MRS is the preferred method for noninvasive measurement of hepatic steatosis in vivo as it permits precise and reproducible quantification of intracellular HTC.18–28 MRS evaluation of HTC is now broadly accepted in clinical studies as fast, safe, and reliable. We evaluated HTC using a 1.5 Tesla Gyroscan Achieva whole body clinical system (Philips Medical Systems, Cleveland, OH) equipped with software for localized spectroscopy as described previously.20–27 High-resolution morphological images were collected to define a testing volume of 27 cm3 within the upper right hepatic lobe, avoiding major blood vessels, intrahepatic bile ducts, and neighboring adipose tissue. All spectra were collected using PRESS sequence (PointRESolvedSpectroscopy) for spatial localization and signal acquisition with the following data acquisition parameters: Te = 27 ms, Tr = 3 seconds. All data were collected without water suppression. Sixteen acquisitions were averaged. Areas of resonances from protons in water molecules and in methylenes of fatty acid chains were evaluated with line-fit procedure using a commercial software (NUTS-Acorn NMR, Freemont, CA). The unit of measurement is the ratio of signal from fat (f) to the total signal from fat (f) and water (w) [f / (f + w)] expressed as percentage. The upper limit of normal for HTC is 5.56%. 27 The coefficient of variation (CV) for MRS is 8.5%, 27 which is superior to the reproducibility of liver biopsy in the determination of HTC.29–31 Although liver biopsy is considered the gold standard to measure hepatic steatosis, the procedure carries significant morbidity and mortality, as well as risk for sampling error. Previous studies demonstrate high validity and reproducibility for hepatic steatosis measurements obtained using MRS and biopsy both in animals 21 and humans. 6
Statistical Analysis
Summary statistics are means and SD for continuous variables or counts and percentages for categorical variables. Correlations between variables at the treatment allocation visit were calculated using the nonparametric Spearman method. We tested for the intervention effect using a mixed linear regression model of the HTC outcome with fixed treatment group, visit, and treatment group × visit effects, assuming a first-order autoregressive process for the residual errors. A significant treatment group × visit interaction was considered evidence for an intervention effect. We fit an exploratory longitudinal model to the HTC visit series by using backward variable selection in a mixed linear regression model including cross-sectional and longitudinal weight, BMI, HbA1c, glucose, cholesterol, fasting triglycerides, fibrinogen, and PAI-1. The selected model included within- and between-subject versions of any covariates that were significant within subjects and any other significant between-subject covariates. Insulin resistance was measured using the HOMA-IR calculator provided at the Diabetes Treatment Unit, University of Oxford (http://www.dtu.ox.ac.uk/). Significance was denoted by P < 0.05. We used SAS/STAT®, version 9.2, (SAS Institute, Inc., Cary, NC) for all analyses.
Results
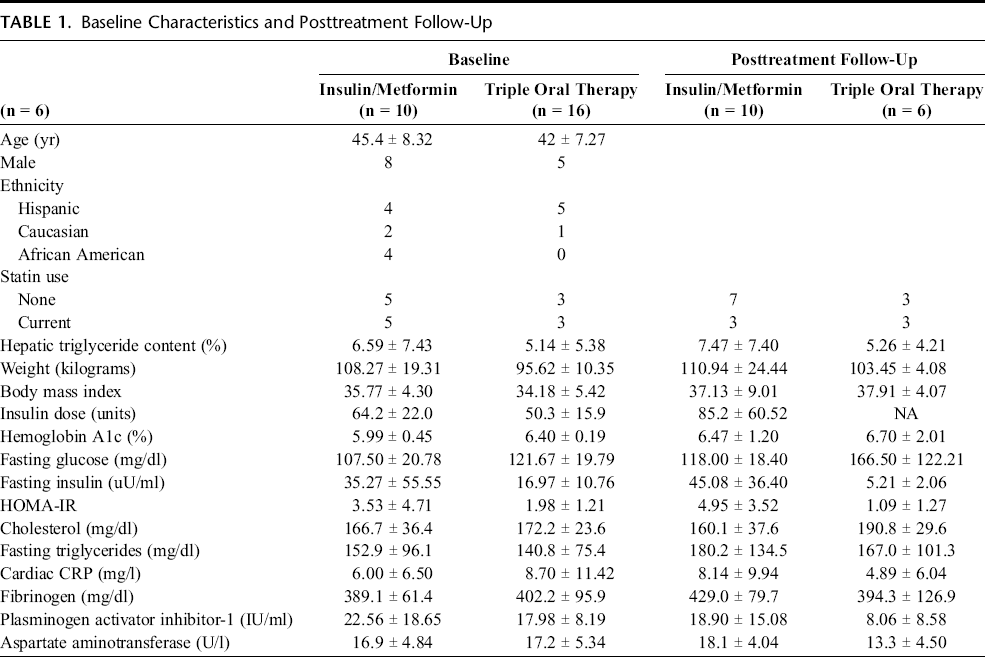
Twenty-four patients were enrolled initially; 1 patient was excluded because of motion artifact on the baseline MRS, and 7 patients did not return for subsequent MRIs. Of the 16 patients with at least 1 baseline and 1 follow-up posttreatment MRS, 10 patients were in the insulin/metformin arm, and 6 patients were in triple oral therapy arm. The baseline (at the time of randomization) characteristics of the treatment groups are shown in Table 1.
Baseline Characteristics and Posttreatment Follow-Up
Lead-In Period
Treatment-naive patients with newly diagnosed type 2 diabetes completed a 3-month lead-in period with insulin/metformin treatment. HTC declined on average 45.6% (from 11.83 ± 7.6% to 6.1 ± 6.6%, P< 0.001) during the lead-in period compared with the baseline measurements at enrollment. More details on the lead-in period results are provided in a previous publication. 15
Intervention Period
Following the lead-in period, patients either continued insulin/metformin therapy or discontinued insulin and began triple oral therapy. No difference in the between-visit changes in HTC was observed in the 2 treatment groups (Table 1). There was also no difference in HbA1c, HOMA-IR, total cholesterol, fasting serum triglycerides, cardiac CRP, fibrinogen, PAI-1, and AST. After allocation to triple oral therapy versus continued insulin/metformin treatment, no difference in HTC between groups was observed (5.26 ± 4.21% vs 7.47 ± 7.40% at a median of 31 months from treatment allocation). These results are summarized in Figure 1.
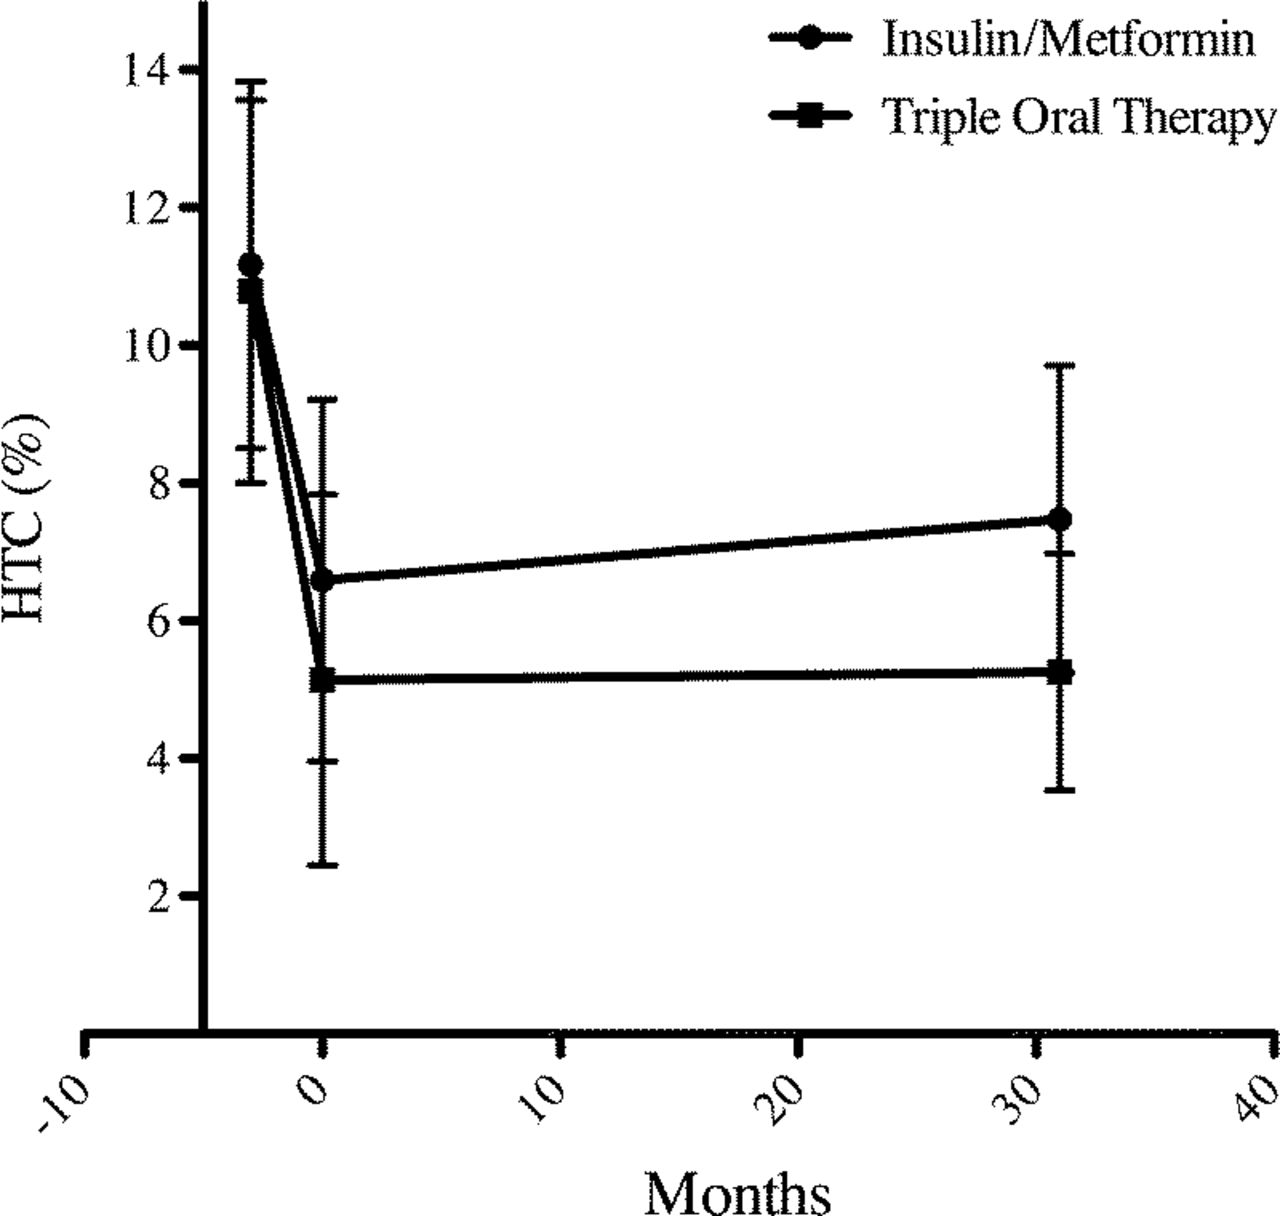
HTC in newly recognized type 2 diabetes treated with insulin/metformin or triple oral therapy. Treatment-naive patients with type 2 diabetes underwent lead-in treatment with insulin and metformin (months, -3 through 0) and were subsequently assigned to triple oral therapy (n = 6) versus continued treatment with insulin/metformin (n =10). HTC did not differ between treatment groups in long-term follow-up (median, 31 months). Data are mean % standard error of the mean.
An exploratory longitudinal model of HTC suggests that within-subject changes in glucose (coefficient = 0.21% per mg/dL, P < 0.001) and fibrinogen (coefficient = 0.04% per mg/dL, P = 0.002) are positively associated with changes in HTC, controlling for corresponding between-subject effects and between-subject effect of weight. Neither the dose of insulin nor statin use, whether concurrent or initiated during the study, correlated with HTC improvement.
Spearman rank correlation showed that baseline HTC correlated with BMI (r = 0.577, P = 0.019), whereas no significant association was found between HTC and cholesterol, triglyceride, fibrinogen, PAI-1, and AST or ALT level.
Discussion
Type 2 diabetes is a cluster of metabolic abnormalities that coexist and compound cardiovascular risk. It is most important to study the impact of treatments not only on the condition for which they are being primarily prescribed but also on the associated comorbidities, ensuring their safety profile and, ultimately, a positive effect on global cardiovascular risk reduction. Our study aimed to evaluate the long-term effect of the 2 most commonly used treatment regimens for type 2 diabetes on a comorbidity known to exist in more than 70% of these patients–hepatic steatosis.
We found that newly diagnosed patients with type 2 diabetes initiated on insulin/metformin therapy showed a 45% improvement in HTC content within 3 months, which was sustained over the subsequent 31 months regardless of whether patients continued insulin/metformin or resumed triple oral therapy. Neither treatment with insulin nor the insulin dose required for glycemic control accelerated HTC progression. Our findings suggest that therapeutically induced hyperinsulinemia (ie, exogenous treatment) does not have a deleterious effect on hepatic steatosis occurrence or progression, in contrast to the well-established positive association between hepatic steatosis and endogenous hyperinsulinemia.
Although conclusions from our study are limited by the small sample size and randomization in the parent study, to our knowledge, this is the longest study to chart the progression of hepatic steatosis in newly diagnosed patients with type 2 diabetes treated with insulin or OADs. Previously, the longest study evaluated pioglitazone monotherapy versus placebo in type 2 diabetes and hepatic steatosis for 1 year. 5 The longest study to define the contribution of insulin treatment to hepatic steatosis progression lasted only 7 months,32 and no studies sufficiently model real-life diabetes treatment, in which patients receive multiple OADs or a combination of insulin and metformin. Our study confirms, complements, and extends the findings of these previous studies by having longer follow-up (median follow-up of 31 months) and by comparing the effect of TZD-based therapy with insulin regimens most commonly used to treat type 2 diabetes. Furthermore, both groups had comparable and sustained glycemic control throughout the study period, allowing for the treatment effect to be observed independent of changes in glycemic control.
The selection of insulin injections over OADs has bearing on the clinical management of patients with newly diagnosed type 2 diabetes. Our study specifically addresses the effects of treatment, suggesting that both insulin and OADs provide equivalent and sustained improvements on HTC and that concern for worsening HTC with exogenous insulin is unfounded. Further larger studies are warranted to evaluate the effect of diabetes treatment on other metabolic comorbidities, including hepatic steatosis.
Footnotes
Acknowledgments
The authors thank Rogers MRI staff for the skillful help in conducting the study.