
Abstract
An ongoing epidemic of illicit fentanyl overdose deaths started in Maryland in July 2013. The records of the Office of the Chief Medical Examiner for the state of Maryland were searched to identify these deaths from July 2013 to February 2015. A geographic information system was used to map and analyze the spatial and temporal distribution of the deaths in Maryland. A total of 266 fentanyl-related deaths were identified. The number of deaths per month generally increased from July 2013 to June 2014, decreased precipitously in August 2014, and rose steadily until the end of the study in February 2015. Deaths began in Baltimore City and then spread throughout the state. A statistically significant cluster (“hot spot”) of deaths was centered in Baltimore City. Greater death densities were also centered on other cities. A high-density band of deaths extended from Baltimore City towards Annapolis. Deaths extended past cities and into the surrounding suburbs; this effect was most pronounced around Baltimore City. Deaths in Baltimore City appeared concentrated in certain neighborhoods. However, the activity moved between various neighborhoods over the course of the study. Review of the above data with the United States Drug Enforcement Administration's Baltimore Office (DEA) allowed some of the above trends to be explained in terms of illicit drug production, transportation and distribution. The DEA is implementing a new strategy to combat illicit narcotic distribution and use in Maryland.
Introduction
Fentanyl is a high potency narcotic (50 to 100 times as potent as morphine) that is commonly prescribed for the treatment of severe, chronic pain (1, 2). Several properties of fentanyl including its low molecular weight, lipophilia, high potency, and relatively short duration of activity have allowed for the development of transdermal patch dosing formulations (3). A dramatic increase in prescribed transdermal fentanyl in the 1990s was associated with abuse of these patches and overdose deaths (4). From April 2005 to March 2007, an epidemic of illicitly produced (nonpharmaceutical) fentanyl-related deaths in New Jersey, Maryland, Illinois, Michigan, and Pennsylvania claimed over 1000 lives (5). These deaths commonly involved fentanyl mixed with heroin or cocaine, and the distribution of deaths was thought to reflect networks for illicit drug distribution (5-8). Since the summer of 2013, a more recent epidemic of illicit fentanyl-related deaths (often in combination with heroin and/or cocaine) has been described in Ohio and Maryland (9, 10).
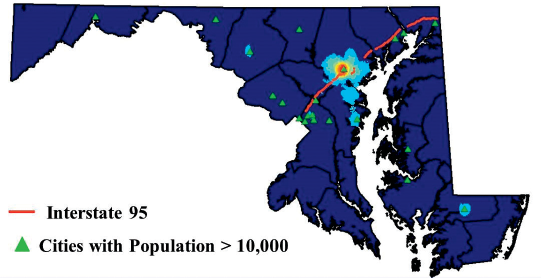
This study was conducted to see if there were significant spatial and temporal trends in the recent Maryland fentanyl death epidemic. A geographic information system (GIS) is a computer program used to create maps and analyze data (11). ArcGIS (a GIS software program) was used to determine the spatial and temporal distribution of the fentanyl-related deaths. Collaboration between the Office of the Chief Medical Examiner for the State of Maryland and the United States Drug Enforcement Administration's Baltimore Office (DEA) allowed for better understanding of identified trends. Additional discussion will highlight ongoing efforts by the DEA to combat the illicit distribution of fentanyl with the hope of decreasing associated overdose deaths. A map of Maryland (
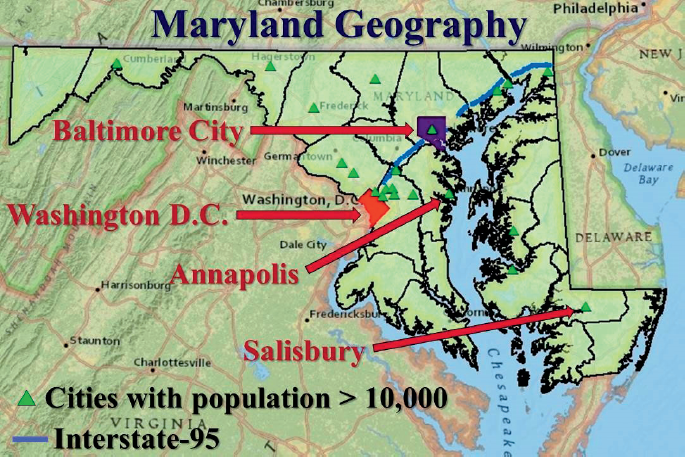
Map of Maryland showing geographic features of interest including: county and Baltimore City borders; cities with populations greater than 10 000 (with highlighting of Baltimore City, Annapolis, and Salisbury); Washington D.C.; Interstate-95; and the Delmarva Peninsula, which is bordered to the west by the Chesapeake Bay and to the east by the Delaware Bay and Atlantic Ocean.
Methods
The records of the Office of the Chief Medical Examiner (OCME) for the state of Maryland were searched to identify illicit fentanyl-related deaths from July 2013 to February 2015. Deaths were considered fentanyl-related if acute intoxication with illicitly produced fentanyl caused or contributed to the death. An initial screen of the data was based on searching the OCME database for “fentanyl” in the cause of death field on the death certificate. Cases involving fentanyl analogs (such as acetyl fentanyl) were excluded. Also excluded were cases in which evidence was found that fentanyl detected on postmortem toxicology was from pharmaceutically derived patches (e.g., patches at the scene or on/in the body). Cases involving fentanyl patches were excluded since this study was concerned with illicitly produced fentanyl.
The incident location of each death was converted to latitude and longitude through a process called geocoding. The incident locations rather than death locations were used because the location at the time of overdose was of interest. Cases in which the incident location was unknown were excluded from further analysis. The actual death location was often different since many decedents were not declared dead until after they were transported to a local hospital. ArcGIS was used to analyze and map the deaths.
The number of deaths per month was calculated so that temporal trends in data could be identified. A least squares linear regression was performed on the data during two different data subsets (July 2013 to July 2014; and August 2014 to February 2015) to determine whether the data could be adequately described by a linear model (p < 0.05 was considered significant).
Spatial density (“heat”) maps of fentanyl deaths were generated and compared to cities with populations over 10 000, as well as the location of Interstate-95 in Maryland. To determine if any statistically significant spatial clustering of data was present, an additional spatial density (hot spot) analysis was performed using the optimized hot spot analysis tool of ArcGIS. This tool first performed incident aggregation to count incidents within fishnet polygons; the size of the polygons was determined by calculating average and median nearest neighbor distances. This tool then determined the appropriate scale of analysis by an incremental spatial autocorrelation tool or by examining the spatial distribution of features. A Getis-Ord Gi* statistic was then calculated so that statistically significant hot or cold spots could be identified (at > 99% and >95% confidence). A similar spatial analysis as above was performed for deaths occurring only in Baltimore City.
Results
A total of 266 fentanyl-related deaths were identified and had their incident locations geocoded. Two additional cases were excluded because the incident locations were unknown. The gender distribution of the deaths was 204 (77%) male and 62 (24%) female. The average age of the decedents was 39.9 years, with minimum and maximum ages of 16 years and 67 years, respectively. Baltimore City accounted for 107 (40%) of the deaths, and the remaining 159 deaths (60%) were distributed throughout the 23 counties of Maryland.
A map showing the spatial distribution of deaths during the study period (
Map of Maryland showing spatial distribution of fentanyl-related deaths during the study period.
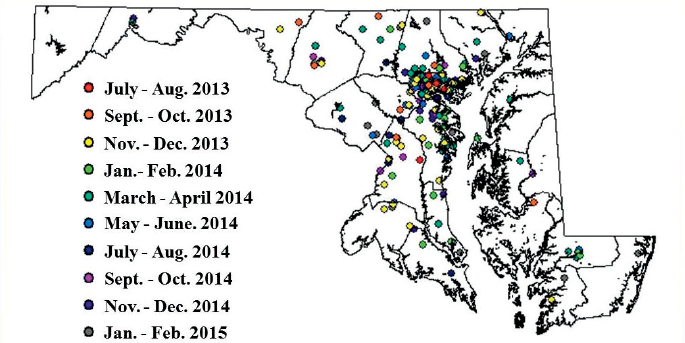
Map of Maryland showing spatial and temporal distribution of fentanyl-related deaths during the study period.
The temporal trends in the data were further explored by graphing the number of deaths per month (
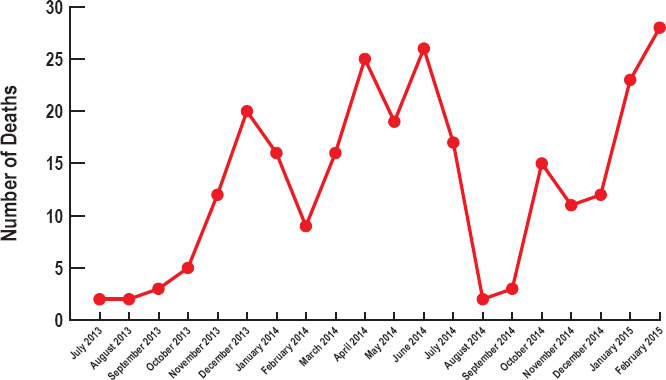
Number of fentanyl-related deaths per month during the study period.
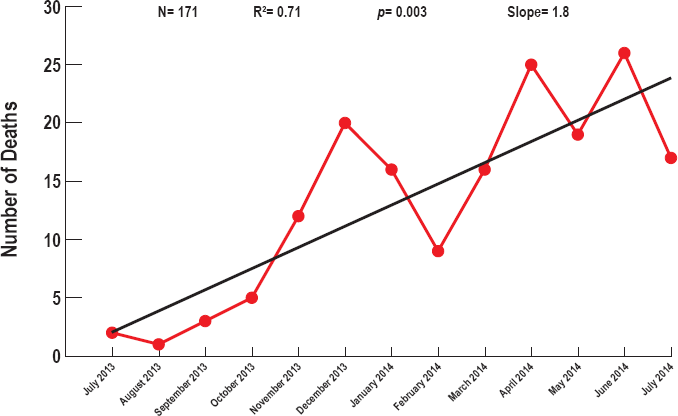
Number of fentanyl-related deaths per month during the first 13 months of the study period. A linear least squares regression line is shown in black.
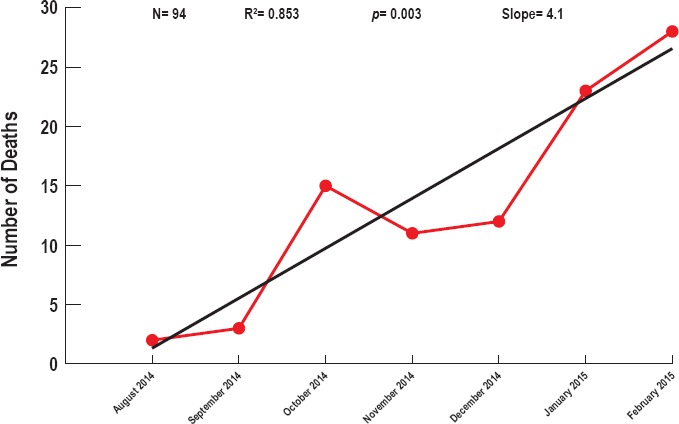
Number of fentanyl-related deaths per month during the last seven months of the study period. A linear least squares regression line is shown in black.
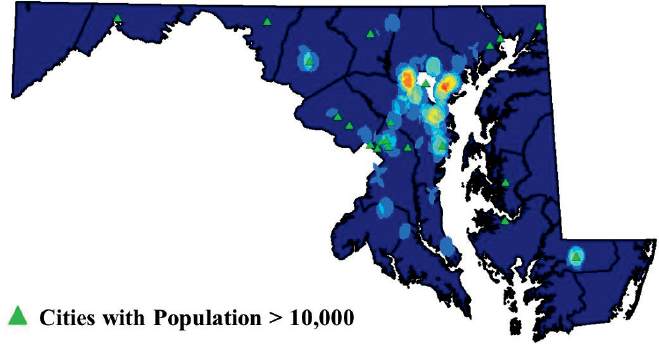
A heat map of fentanyl-related deaths (
Map of Maryland showing a heat map of the fentanyl-related deaths. The density of deaths increases from the cool colors (blue) to the hot colors (red).
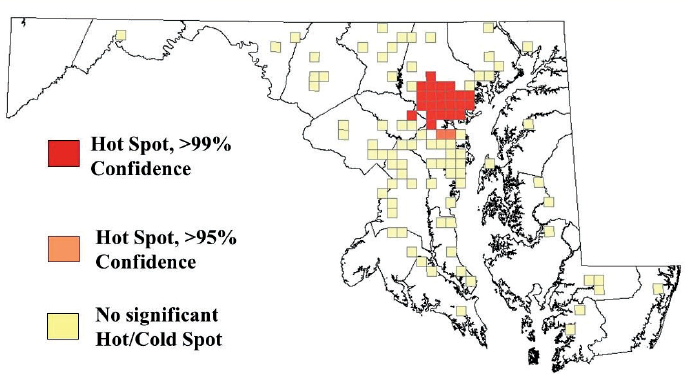
Map of Maryland showing hot spots of fentanyl-related deaths. Statistically significant hot spots are shown in red (> 99% confidence) and orange (> 95% confidence).
A heat map of fentanyl deaths was generated excluding all data from Baltimore City to evaluate whether other trends in the data existed that were masked by the high clustering of deaths in Baltimore City (
Map of Maryland showing a heat map of the fentanyl-related deaths (excluding deaths in Baltimore City). The density of deaths increases from the cool colors (blue) to the hot colors (red).
A higher-resolution map shows the spatial and temporal distribution of deaths in and adjacent to Baltimore City (
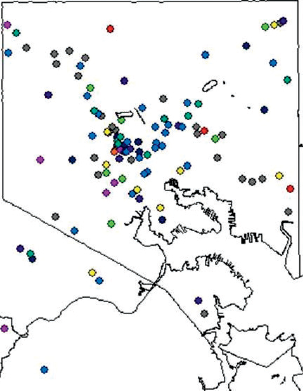
Map of Baltimore City showing spatial and temporal distribution of fentanyl-related deaths during the study period. Deaths in the counties immediately adjacent to Baltimore City can also be seen. The same color scheme was used to for displaying the time interval in which each death occurred as shown in the legend of Figure 3.
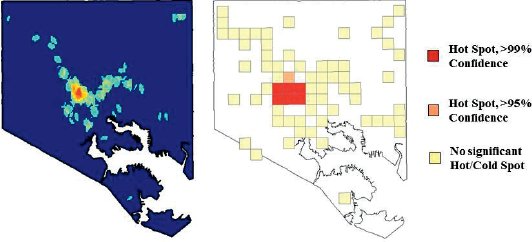
Maps of Baltimore City showing a heat map and hot spots of the fentanyl-related deaths. Heat map density of deaths increases from the cool colors (blue) to the hot colors (red). Statistically significant hot spots are shown in red (> 99% confidence) and orange (> 95% confidence).
Temporal trends were evaluated by making heat maps of death density after dividing the data into three intervals (July 2013 to February 2014, March 2014 to August 2014, and September 2014 to February 2015) (
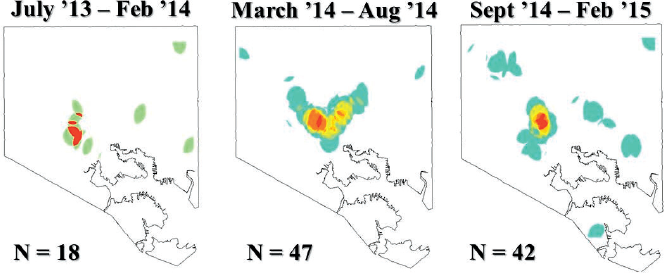
Map of Baltimore City showing a heat map of the fentanyl-related deaths during three separate time intervals. The density of deaths increases from the cool colors (blue) to the hot colors (red).
A higher-resolution map with streets overlain onto the data allows for a better appreciation of the actual neighborhoods involved during these two time intervals (
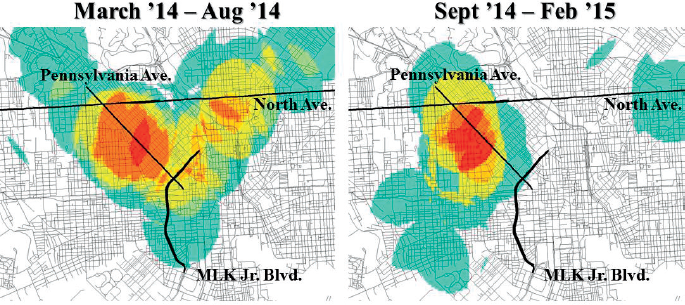
Map of a portion Baltimore City showing a heat map of the fentanyl-related deaths during two separate time intervals. The density of deaths increases from the cool colors (blue) to the hot colors (red). A street map is included in these maps; three streets are bold to allow for easier comparison of the maps and to highlight the neighborhoods involved by high density of deaths.
Discussion
Communication with the DEA helped to explain several features of the results of this study. The dramatic decrease in the number of fentanyl-related deaths per month that reached a nadir in August 2014 (
The DEA was able to provide information on the production and distribution of fentanyl (alone or mixed with heroin) that explained some of the trends seen on the heat and hot spot maps of fentanyl-related deaths in Maryland (
The illegally produced fentanyl was smuggled into the United States at multiple sites across the USA/Mexican border. The majority of the narcotic would then travel east in the U.S. to where the majority of end users lived. Baltimore served as a major distribution point for illicit narcotics supplied to Maryland, southern Pennsylvania, northern Virginia, and West Virginia. The drugs would be cut in Baltimore City by dealers who often had no idea that they were handling fentanyl as opposed to heroin. Baltimore City became a hot spot of fentanyl deaths due a large market of end users in this city where the drug was being cut and distributed. The high density of deaths in Salisbury, MD was directly attributable to this city acting as a secondary distribution site to supply the entire Delmarva Peninsula. A large volume of drug in Salisbury spilled out into the community causing a cluster of deaths at this location.
The high density of fentanyl-related deaths in the suburbs around Baltimore City was a reflection of increased prescribing of oral opioids with a concomitant increase in abuse of these medications (12). A subpopulation of people prescribed oral opioids like oxycodone became addicted to this medication. The price of diverted oxycodone ($60 - $100 for a 80 mg OxyContin pill), as well as readily available cheaper heroin ($45 - $60 for multiple comparable doses) (13), led to an increased market for heroin in the suburbs. The synergistic combination of increased prescription of oral opioids, and readily available cheaper fentanyl/heroin, caused an expansion of the market of illicit narcotics out of its historic center in Baltimore City. In other words, abuse of illicit narcotics was increasingly not just a problem of inner cities. It is likely that the clustering of deaths in the suburbs around Washington D.C. was due to a similar phenomenon as described for Baltimore City.
The heat maps of fentanyl-related deaths in Baltimore City (
The heat map of fentanyl-related deaths in Baltimore City had a similar spatial distribution to that seen for violent crimes such as shootings and homicides (14). Thus, the toll of overdose deaths and violent crimes falls most heavily on the same neighborhoods, neighborhoods which have the lowest median household income, the highest percent of black/African-American residents, and the highest unemployment rates (14).
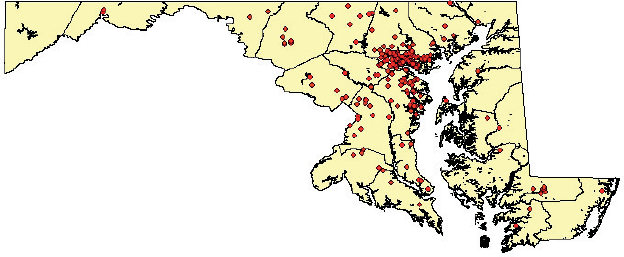
The possibility that clusters of fentanyl deaths found in this study simply reflected areas of high population density was considered by comparing the heat maps of fentanyl-related deaths to population density for the state of Maryland (15). Such a comparison makes it clear that the trends identified in the current study are not simply a reflection of population density. For example, there are areas of high population density other than Baltimore City that are not highlighted by the “bulls-eye” pattern seen in the heat map of fentanyl deaths (
Use of OCME data is just one part of an ongoing effort by the DEA to combat this latest epidemic of fentanyl-related deaths. In February 2014, the DEA's Baltimore District Office created a heroin fentanyl task force that partnered with the United States Attorney's Office, the OCME, and state and local law enforcement partners. The group was tasked to address the spike in Maryland of heroin overdoses, specifically examining the effect of fentanyl used as an adulterant or cutting agent in heroin. Based on these trends, as well as additional research and developed information, the Task Force decided to expand its scope and mission to maximize its impact throughout the entire State of Maryland in an initiative called Operation Trojan Horse. An essential element of the initiative was to develop a data collection clearinghouse within the DEA Baltimore Intelligence Group that solicits, processes, and analyzes information from fatal and nonfatal overdoses occurring throughout the State of Maryland. Initial in-house analysis includes de-confliction of case data such as phone numbers, email and IP addresses, and bank account numbers. The links that are found are shared with the relevant partners, with the ultimate goal of consolidating resources and efforts; this provides for the greatest possibility of success. Collection and analysis of raw overdose data from first-responders (Bio-Surveillance) is mapped at DEA (exactly analogous to the maps made from OCME data in this paper) (
Spatial distribution and heat maps of Baltimore City showing emergency medical services dispatches for all suspected heroin/opioid overdoses during a two-week interval in August 2015.
The DEA engages with partners to bolster the development of educational and drug awareness programs, viable tactics and all applicable enforcement avenues and opportunities to mitigate the further spread of heroin and fentanyl. Operation Trojan Horse identifies the commonalities among the fatal and nonfatal heroin/fentanyl overdoses. When the information from the various areas throughout the State of Maryland reveals a common drug trafficking organization (DTO), a long-term investigation is initiated and pursued to the highest level possible, ideally back to the cartel/organization producing/supplying the heroin and/or fentanyl.
The DEA coordinates with the respective police departments to further investigate the overdoses. The Task Force works with local jurisdictions to develop best practices when responding to overdose deaths. These include the preservation of evidence such as the seizure of the victim's cellular telephone, drug paraphernalia, and drug evidence as well as conducting interviews with family members/associates regarding the heroin source of supply's identity. Many first responders, both police and fire departments, have begun administering naloxone. DEA monitors the frequency and areas of its use, as well as developing profiles on overdosed persons. Predictive analysis allows investigators to identify potential sources of the heroin, as well as distribution patterns and local dealers. The goal of this concerted, highly coordinated effort is to identify, disrupt, and dismantle the criminal organizations responsible for the proliferation of these drugs.
In summary, a collaboration between the OCME and DEA allows for a better understanding of trends identified when GIS was used to analyze epidemic fentanyl-related deaths. OCME data supplied monthly to the DEA is a critical component in its efforts to address the public health catastrophe that illicit fentanyl represents in Maryland.
Footnotes
Acknowledgement
Data from the U.S. Census Bureau were used in making several figures in this manuscript using TIGER/Line Shapefile software.