
Abstract
Background
Nasal airway obstruction (NAO) is a common health condition impacting mood, energy, recreation, sleep, and overall quality of life. Nasal surgery often addresses NAO but the results are sometimes unsatisfactory. Evaluating surgical treatment efficacy could be improved if objective tests were available that correlated with patient-reported measures of symptoms. The goal of this study was to develop methods for comparing nasal resistance computed by computational fluid dynamics (CFD) models with patient-reported symptoms of NAO using early data from a 4-year prospective study.
Methods
Computed tomography (CT) scans and patient-reported scores from the Nasal Obstruction Symptom Evaluation (NOSE) scale and a visual analog scale (VAS) measuring unilateral airflow sensation were obtained pre- and postoperatively in two NAO patients showing no significant mucosal asymmetry who were successfully treated with functional nasal surgery, including septoplasty. Pre- and postsurgery CFD models were created from the CT scans. Numerical simulation of steady-state inspiratory airflow was used to calculate bilateral and unilateral CFD-derived nasal resistance (CFD-NR).
Results
In both subjects, NOSE and VAS scores improved after surgery, bilateral CFD-NR decreased, and unilateral CFD-NR decreased on the affected side. In addition, NOSE and VAS scores tracked with unilateral CFD-NR on the affected side.
Conclusion
These preliminary results suggest a possible correlation between unilateral NR and patient-reported symptoms and imply that analysis of unilateral obstruction should focus on the affected side. A formal investigation of unilateral CFD-NR and patient-reported symptoms in a series of NAO patients is needed to determine if these variables are correlated.
In particular, a number of studies have tried to correlate patient-reported symptoms of NAO with clinical measurements of nasal resistance (NR). As was noted by Andre and colleagues, 11 many studies combined both nasal passages in their analyses and were not able to correlate patient-reported symptoms with NR. A positive correlation between these variables was consistently reported when a unilateral analysis was conducted; however, relatively few unilateral studies have been published. 11
Recent advances in computational technology have made computer simulation a viable way to provide consistent objective measures of nasal airflow and function. Computational fluid dynamics (CFD) techniques can be used to simulate airflow through three-dimensional (3D) reconstructions of the nasal cavity, providing highly detailed assessments of airflow patterns, pressure, and, in particular, bilateral and unilateral NR. A number of studies have been conducted using 3D nasal CFD models, some of which have focused specifically on the effects that common pathologies and surgical changes have on nasal airflow,12–25 indicating a growing maturity in the use of CFD methods.
Because NRs can be calculated from CFD simulations of airflow at resting breathing rates, CFD-derived NRs may correlate with patient-reported symptoms better than rhinomanometry-derived NRs, which are measured at higher airflow rates (by definition, rhinomanometry measures NR at a pressure drop of 150 Pa). In addition, CFD analysis of unilateral NR may correlate with symptoms better than bilateral NR.26,27
This article presents early data from a prospective study designed to explore the relationships between CFD-derived objective measures of nasal airflow and patient-reported subjective measures of nasal obstruction. The objective of this preliminary report is to develop methods for comparing CFD-derived NR with validated patient-reported measures of NAO symptoms.
Materials and Methods
Patient-Reported Measures
The Nasal Obstruction Symptom Evaluation (NOSE) scale 28 and a 0- to-10-scale unilateral visual analog scale (VAS) questionnaire were used to collect information on patient-reported symptoms before and after surgery. The NOSE scale is a quality-of-life instrument specifically designed for NAO that has been validated for septoplasty and functional rhinoplasty28,29 and used recently as a primary outcome measure of surgical success.30,31 Patients are asked to rate, over the past month, their feelings of (1) nasal congestion or stuffiness, (2) nasal blockage or obstruction, (3) trouble breathing through the nose, (4) trouble sleeping, and (5) ability to get enough air through the nose during exercise or exertion on a 0–4 scale with 0 = not a problem, 1 = very mild problem, 2 = moderate problem, 3 = fairly bad problem, and 4 = severe problem. Each score is multiplied by 5 and when the 5 scores are added together, total scores of 0 and 100 represent the best and worst cases, respectively.
Bilateral and unilateral VAS scales have also been used to assess NAO symptoms in previous studies.9,26,32 The unilateral VAS scale used in this study rated airflow sensation on each side of the nose individually. Patients were asked to cover one nostril, breathe gently through the other nostril, and rate their sensation of airflow on the uncovered side from 0 = completely blocked to 10 = completely open
Patients and Treatment
The research described here was approved by the Institutional Review Board at the Medical College of Wisconsin and written informed consent was obtained. Diagnosis of NAO and surgical treatment decisions were made by the surgeon (JR) based on clinical presentation and the standard of medical care. Patients were recruited who were at least 15 years old, had a clinical diagnosis of nonreversible, surgically treatable cause for nasal obstruction (deviated septum, turbinate hypertrophy resistant to medical treatment, or lateral nasal wall collapse), elected to have nasal surgery, and provided informed consent. In all subjects, modified contiguous computed tomography (CT) scans in the axial plane of the entire nasal cavity and external nasal soft tissue were performed preoperatively and 5–6 months postoperatively to allow adequate time for healing. All scans were done in 0.6-mm increments with a pixel size of 0.313 mm.
To minimize potential effects of nasal cycling on modeling results and avoid selection bias, the first two subjects in whom mucosal thickness was generally symmetrical in both pre- and postsurgery CT scans were included in this analysis. Subject 1 was a 37-year-old, 81.7-kg, white male nonsmoker with significant leftward caudal anterior septal deviation along with external nasal deformity. The patient underwent an open septorhinoplasty consisting of reconstruction of the deviated anterior and caudal portions of the septum with autologous septal cartilage, mild dorsal hump reduction, lateral osteotomies, and reconstitution of the nasal tip. The patient had an uneventful postoperative course.
Subject 2 was a 27-year-old, 72.6-kg, white female smoker with external nasal deformity, significant rightward midseptal deviation with displacement of the caudal end of the maxillary crest to the left side and compensatory left inferior turbinate hypertrophy. The patient underwent an open septorhinoplasty consisting of transposition of the displaced caudal septum and placement of a left spreader graft to help straighten the deviated dorsal septum. The patient also underwent left inferior turbinate reduction via submucosal resection. This patient also exhibited an uneventful postoperative course.
CFD Analyses
CT scans were imported into medical imaging software (Mimics 13.1; Materialise, Plymouth, MI). Three-dimensional reconstructions of the nasal airspaces were created, excluding the paranasal sinuses, and the nasopharynxes were extended with a straight tube (Fig. 1) to increase the distance between the inlet and the outlet, a common procedure in CFD simulations to aid numerical stability. Extending the nasopharynx had a negligible effect on the transnasal pressure drop because of the larger cross-sectional area of the nasopharynx when compared with the main nasal cavity.
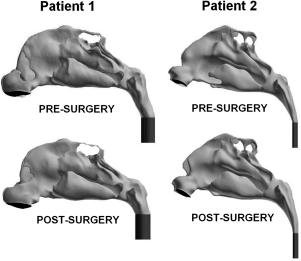
Lateral views of the pre- and postsurgery computational fluid dynamics (CFD) models of subjects 1 and 2 with left nostril surfaces shown in black and tubes added to the nasopharynxes to improve simulation convergence in dark Gray.
For visualization of results, 3D reconstructions were made of the soft tissue surrounding the nasal cavity including the external nares, the lateral walls and turbinates, and the nasal septum (Fig. 2). For coregistration of pre- and postsurgery models, a 3D reconstruction was made of the skull in each scan set and each postsurgery skull reconstruction was registered with the corresponding presurgery skull using Mimics. The resulting transformation was then applied to each reconstruction of postsurgical airspaces and surrounding tissues.
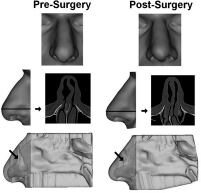
Three-dimensional reconstructions of the nasal soft tissue of subject 1. (Top, face view; middle, axial computed tomography (CT) scan image of anterior nose with side view of external nose showing level of scan image; bottom, left septal wall with semitransparent external nose. Light gray indicates airspace; arrow indicates region of septal deviation.
The coregistered nasal cavity reconstructions were imported in stereolithography format into computer-aided design and meshing software (ICEM-CFD 11.0; ANSYS, Inc., Canonsburg, PA). Planar nostril and outlet surfaces were constructed and computational meshes of the nasal cavities were created using graded tetrahedral elements. A mesh density study indicated that meshes with ∼4 million cells provided mesh-independent numerical results.
Steady-state inspiratory airflow was simulated under pressure-driven conditions using commercial CFD software (Fluent 12.0; ANSYS, Inc.). The following boundary conditions were used to calculate airflow vectors: (1) a stationary “wall” condition with air velocity set to zero at all airway walls, (2) a “pressure-inlet” condition with gauge pressure set to 0 at the nostrils, and (3) a “pressure-outlet” condition with gauge pressure at the outlet set to a negative value in pascals that generated a target steady-state flow rate. The target airflow rate for each subject was based on minute volume (amount of air exhaled in 1 minute), which was estimated from body weight using gender-specific power law curves 33 :
male subjects (sitting awake):
female subjects (sitting awake):
where
NR derived from the CFD simulations (CFD-NR) was calculated as Δp/Q, where Δp was the transnasal pressure drop in pascals between the nostrils and the posterior end of the nasal septum, and Q was the flow rate in milliliters per second, for both sides of the nose together (bilateral CFD-NR) or for each side separately (unilateral CFD-NR). Airflow allocations to left and right nasal cavities were calculated and reported as percentages of total inspiratory flow.
Results
NOSE and VAS scores improved with surgery in both subjects (Table 1). Simulations predicted that surgery decreased both bilateral CFD-NR and unilateral CFD-NR on the affected side (Table 1). Unilateral NR was consistently higher than bilateral NR reflecting the smaller airflow rate flowing through a single nasal cavity.
NOSE and VAS survey results and CFD-NR estimates
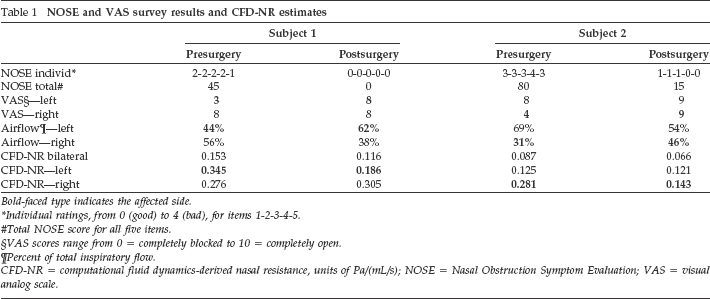
Bold-faced type indicates the affected side.
Individual ratings, from 0 (good) to 4 (bad), for items 1-2-3-4-5.
Total NOSE score for all five items.
VAS scores range from 0 = completely blocked to 10 = completely open.
Percent of total inspiratory flow.
CFD-NR = computational fluid dynamics-derived nasal resistance, units of Pa/(mL/s); NOSE = Nasal Obstruction Symptom Evaluation; VAS = visual analog scale.
A comparison of NOSE scores with unilateral CFD-NR on the affected side showed a moderate positive trend (Fig. 3A). A plot of NOSE scores versus. bilateral CFD-NR showed the individual decreases in both variables from pre- to postsurgery states for each subject as described previously and a lack of relationship when the data from both subjects was taken together (Fig. 3B).
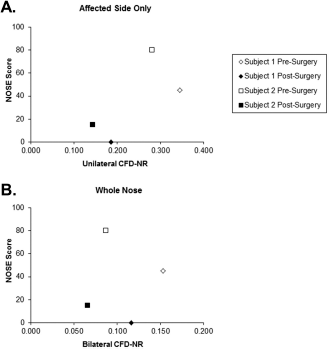
Comparison of Nasal Obstruction Symptom Evaluation (NOSE) scores with computational fluid dynamics–derived nasal resistance (CFD-NR). Low NOSE scores indicate reduced symptoms. (A) NOSE scores and unilateral CFD-NR on the affected side only. (B) NOSE scores and bilateral CFD-NR.
Unilaterally, CFD-NR values on the affected side tracked strongly with VAS scores on that side (Fig. 4A). A plot of VAS scores and unilateral CFD-NR for both sides of the nose taken together showed a general negative trend (Fig. 4B) that was weaker than the affected side trend (Fig. 4A) because neither VAS nor unilateral CFD-NR was very different after surgery on the unaffected side (Fig. 4C).
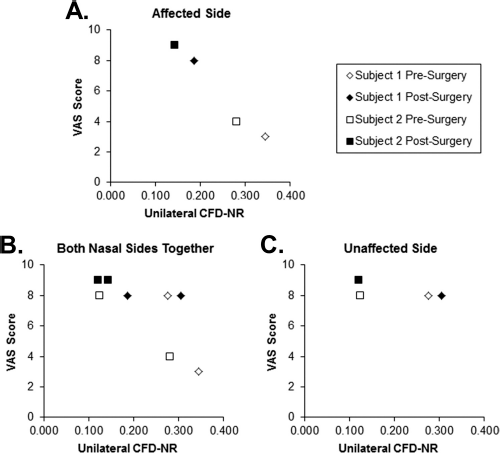
Comparison of visual analog scale (VAS) scores with unilateral computational fluid dynamics–derived nasal resistance (CFD-NR). Low VAS scores indicate more severe symptoms. (A) VAS versus CDF-NR on the affected side. (B) VAS and CFD-NR from both sides of the nose graphed together. (C) VAS versus CDF-NR on the unaffected side only.
Simulations also predicted that less inspiratory airflow was allocated to the affected side than the unaffected side before surgery and that surgery increased the amount of air flowing through the affected side in both subjects (Table 1).
Discussion
The potential ability of CFD technology to help with nasal surgical planning has been recognized for some time, but other than the recent work on atrophic rhinitis by Garcia and colleagues, 16 studies showing the ability of CFD-derived variables to predict symptom changes due to surgery are lacking. Before CFD tools can be used to influence patient care decision making, the ability of these models to predict surgical outcome must be confirmed by determining model outputs that can be reliably associated with symptoms and are sensitive to symptom abatement or exacerbation. CFD simulations provide a way to better understand and quantify nasal airflow and function, but a “gold standard” association of CFD variables with patient-reported symptoms still has to be established.
The objective of this preliminary study was to compare NR computed using pre- and postsurgery CFD models with patient-reported subjective measures of NAO in the form of NOSE and VAS surveys administered pre- and postsurgery. A relationship between NOSE scores and bilateral CFD-NR was not evident for the two subjects together in agreement with previous reports, probably because of interindividual differences in self-evaluation, dominance of congestion sensations on self-reported symptoms, and dilution of congestion effects on NR by the unaffected side. When NOSE scores were compared with unilateral CFD-NR from the affected side, a positive trend emerged, also in agreement with previous reports. 11
The one-sidedness of these subjects’ symptoms was studied further by comparing VAS scores with unilateral CFD-NR on each side of the nose. Separate plots of VAS versus unilateral CFD-NR for the affected and unaffected sides of the nose showed very different behaviors. The removal of data from the unaffected side revealed a strong trend between VAS and unilateral CFD-NR on the affected side, indicating dilution of the affected side by the unaffected side, which underwent little change in both symptom reporting and NR.
Simulations predicted that unilateral NR is higher than bilateral NR, which is consistent with previous measurements.26,39 However, the NR values reported in Table 1 are lower than rhinomanometry measurements. For example, Cole 40 categorized patients as “unobstructed” if their bilateral NRs were <0.25 Pa/(mL/s), Moore and Kern 41 described the range of normal NRs as ∼0.15–0.30 Pa/(mL/s), and Canakcioglu and colleagues 42 reported an average bilateral NR of 0.32 Pa/(mL/s) in healthy subjects. In contrast, CFD-derived NRs for normal subjects ranged from 0.039 to 0.082 Pa/(mL/s) in a study by Garcia and collaborators, 16 and were near 0.05 Pa/(mL/s) in a study of septal deviation, 17 with which the simulations presented here agree. This discrepancy between CFD-derived and rhinomanometry-derived NRs is a matter of definition. Rhinomanometry-derived NR is “defined as the pressure gradient of 150 Pa divided by the airflow rate at this pressure gradient,”43,44 whereas the CFD-derived NRs presented here were calculated at much lower pressure drops that correspond to resting breathing, consistent with the likely breathing state of patients during self-evaluation of symptoms. Because the pressure–flow relationship for nasal airflow is nonlinear, the NR value depends strongly on the pressure drop selected for its computation.17,45
The airflow simulations presented here were limited to steady-state, laminar conditions, meaning that the cyclic nature of airflow and turbulence were not modeled. There is theoretical evidence supporting the use of steady-state simulations to approximate cyclic breathing.36,46 In addition, nasal airflow has been described as laminar for resting flow rates in healthy noses,36,46–49 but it is possible that airflow is more turbulent in the abnormal nasal passages of NAO patients. Presurgically, the nasal passages in subjects 1 and 2 showed narrowing typical of NAO, but because the narrow parts of normal noses tend to redirect air to other more open parts of the nose, as opposed to creating jets or other turbulent flow features, it can be argued that similar redirection occurred in the simulations presented here. Thus, it is likely that for resting breathing, turbulence modeling is not necessary to obtain useful results.
To date, this study represents the first report of comparisons between a CFD-derived variable and patient-reported symptoms using a survey instrument validated for NAO in two actual pre- and postsurgery NAO patients. These preliminary results agree with previous studies suggesting a correlation between unilateral NR and patient-reported symptoms in NAO and suggest that analyses should focus on the affected side when obstruction and symptoms are unilateral. However, this study is based on only two individuals. A formal investigation of a series of additional subjects is needed to provide an appropriate statistical basis for further evaluation of CFD-NR predictive ability.
Many symptoms and potential causes of blockage are interrelated and depend heavily on each patient's individual anatomy and physiology. Knowing which factors are most important would provide clinicians with enhanced insight into the best therapies for each patient. 50 Specific CFD-derived variables or combinations of variables that can be reliably associated with symptoms still have to be determined. However, studies addressing these issues are underway and once appropriate variables are identified, CFD tools may help optimize patient treatment planning.
Footnotes
Acknowledgments
The authors thank Nikki Stelse, Brent Senior, Kibwei McKinney, and Jeffry Schroeter for contributions to this work.