
Abstract
Background
Results of several studies showed that blood lead concentration is positively associated with total immunoglobulin E (IgE) value. However, no study has investigated whether allergic sensitization could be responsible for the association between lead exposure and total IgE value.
Objective
We investigated whether there was difference in the association between lead exposure and the total IgE value, depending on the presence or absence of Dermatophagoides farinae sensitization.
Methods
We used data obtained from the Korea National Health and Nutrition Examination Survey. Serum levels of heavy metals, such as mercury, cadmium, and lead, were measured. Total and D. farinae specific IgE levels were measured, and the urinary cotinine level was investigated. Information about sex, age, body mass index, and household income were also obtained. We analyzed the association between serum lead and total IgE levels, after adjusting other variables.
Results
In an multivariate linear regression analysis, only the serum concentration of lead among the three heavy metals was positively associated with logarithmic transformed total IgE (coefficient [B], 0.026 [95% confidence interval {CI}], 0.008–0.044). When we performed the same analysis on groups divided by allergic D. farinae sensitization status, we found a significant positive association between serum lead and logarithmic transformed total IgE values in subjects with D. farinae sensitization (B, 0.043 [95% CI, 0.014–0.071]) but not in subjects without D. farinae sensitization (B, 0.015 [95% CI, -0.008 to 0.039]).
Conclusions
A positive association between the serum lead and total IgE levels was statistically significant in subjects with D. farinae sensitization, which indicated that the immunologic effects of lead exposure may be greater in people with allergic sensitization.
Allergic sensitization (atopy) is associated with Th2 inflammation, and activation of Th2 cells induces an increased secretion of interleu-kin 4 and interleukin 13, which, in turn, induces the production of IgE. 10 This predisposition of Th2 responses in persons with atopy could result in different immune responses between subjects with atopy and subjects without atopy; therefore, a strong IgE response to allergic stimulation could occur in persons with atopy compared with persons without atopy. 11 Several studies demonstrated that lead exposure is associated with elevated total IgE levels in adults and children.9,12–14 However, these studies did not consider whether allergic sensitization had a role in the association between serum lead and total IgE levels. Therefore, we analyzed whether there was a difference in the association between lead exposure and total IgE levels, depending on the presence of Dermatophagoides farinae sensitization, by using data obtained from the Korea National Health and Nutrition Examination Survey (KNHANES).
Methods
The KNHANES is a national survey conducted annually by the Korea Centers for Disease Control and Prevention. The KNHANES investigates the health and nutritional status of a representative Korean population. The overall survey consists of a health interview survey, a health examination survey, and a nutrition survey. We used the data from the KNHANES conducted in 2010. Among the 8958 people who participated in KNHANES 2010, 6621 subjects without blood metal concentration data were excluded as were a further 153 participants with incomplete data for other variables. Data from a total of 2184 participants were analyzed. Smoking history was divided into two groups: nonsmoker (never smoked or smoked fewer than five packs in a lifetime) and smoker (smoked five packs or more in life time). Body mass index (BMI) was calculated by using the following formula: BMI = weight (kg)/height (m2). Household income per month was categorized into four groups: lowest (<$918.30), medium-lowest ($918.30–$1836.50), medium-highest ($1826.60–$3213.90), and highest (≥$3214.00).
Blood samples were collected in standard commercial evacuated tubes that contained sodium heparin (Vacutainer; Becton, Dickinson and Co, Franklin Lakes, NJ) after fasting for at least 8 hours. Samples were immediately processed, refrigerated, transported in cold storage, and analyzed within 24 hours. Analyses of blood metal concentrations (lead, mercury, and cadmium) and serum IgE levels were performed by the Neodin Medical Institute (Seoul, South Korea). All of the participants from KNHANES 2010 signed an informed consent form, and the institutional review board of Jeju National University Hospital approved these analyses. J.H. Kim and J.H. Chang contributed equally. Authors’ contributions included the following: J.H. Kim (study concept and design, manuscript revision, approval of final version of the manuscript to be published), J.H. Chang (writing of the manuscript, analysis, and interpretation of data), H.S. Choi (analysis and interpretation of data), H.J. Kim (analysis and interpretation of data, writing of the manuscript), and J.W. Kang J (study concept and design; drafting of the manuscript; acquisition, analysis, and interpretation of data; approval of final version of the manuscript to be published).
Blood Heavy Metal Concentration
Graphite-furnace atomic absorption spectrometry with Zeeman background correction (AAnalyst 600; PerkinElmer, Turku, Finland) was used for the measurement of blood lead and cadmium concentration. A gold-amalgam collection method with a DMA-80 (Milestone, Bergamo, Italy) was used for the measurement of blood mercury concentration. For internal quality assurance and control, commercial reference materials were used (Lyphochek Whole Blood Metals Control; Bio-Rad, Hercules, CA). The coefficients of variation for blood cadmium, lead, and mercury were within 0.95–1.82%, 2.656.50%, and 1.59–4.86%, respectively. A detailed method of internal quality assurance and control was used as previously described. 15
Total IgE and Dermatophagoides farinae Specific IgE
The total IgE level was measured by immunoradiometric assay by using a 1470 WIZARD γ-Counter Analyzer (PerkinElmer, Turku, Finland) and ImmunoCAP100 (Phadia, Uppsala, Sweden). The D. farinae specific IgE level was measured with the same method. The detection ranges of total and D. farinae specific IgE levels were 2.00-5000.00 kU/L and ≥100.0 kU/L, respectively. A total IgE level of <2.00 was scored as 1.99 and >5000.00 as 5000.01. A D. farinae specific IgE level of >100.0 kU/L was scored as 100.01 kU/L. D. farinae sensitization was defined as a D. farinae specific IgE level of ≥0.35 kU/L.
Statistical Analysis
Serum total IgE levels were not normally distributed. Therefore, we investigated the correlation between the total IgE level and various continuous variables, such as age, BMI, blood metal concentration, and urine cotinine, by using the Spearman correlation coefficient. Next, we calculated the logarithmic total IgE (LogTIgE) with a base of 10 to perform a linear regression analysis. Unadjusted and multivariate linear regression analyses were used. All data were analyzed with the Statistical Products and Service Solutions package for Windows (release 17.0) (SPSS, Chicago, IL). A p of <0.05 was considered statistically significant.
Results
Demographic data of the study population are shown in Table 1. Five participants had a blood lead concentration of >10 μg/dL, which is considered the cutoff level for elevated blood lead. 1 One hundred and thirty-eight participants had serum mercury levels of ≥10 μg/L, which is considered elevated. 16 Only one participant had a blood cadmium level of >5.0 μg/L, which is within the normal limits of blood cadmium concentrations indicated by the American Conference of Governmental Industrial Hygienists. 17
Demographic data of study population
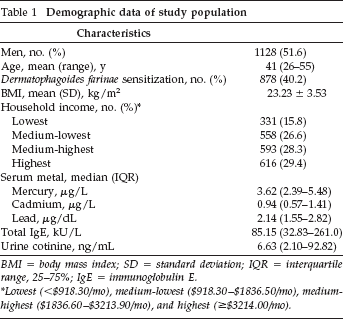
BMI = body mass index; SD = standard deviation; IQR = interquartile range, 25–75%; IgE = immunoglobulin E.
Lowest (<$918.30/mo), medium-lowest ($918.30–$1836.50/mo), medium-highest ($1836.60–$3213.90/mo), and highest (≥$3214.00/mo).
The correlation between total IgE and several possible confounding variables, such as age, BMI, and blood heavy metal and urine cotinine levels, are shown in Table 2. Among them, blood mercury and lead concentrations were positively correlated with the total IgE level (Spearman rho (ρ) = 0.103 and ρ = 0.150, respectively). BMI and urine cotinine level also were significantly correlated with total IgE level. We compared the difference of mean total IgE between the groups divided according to sex and household income. Men had significantly higher mean total IgE levels compared with women. However, there was no difference observed in mean total IgE levels among the four household income groups.
Correlation between continuous variables and total IgE values
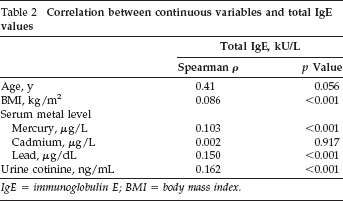
IgE = immunoglobulin E; BMI = body mass index.
We investigated the unadjusted and adjusted association between LogTIgE and confounding variables by using a linear regression analysis (Table 3). Blood lead concentration was significantly associated with total IgE value (coefficient [B], 0.026 [95% confidence interval (CI),0.008–0.044]; coefficient of determination [R 2 ], 0.377). However, blood mercury value did not have a significant association with total IgE level in the multivariate linear regression analysis in contrast to the unadjusted regression analysis. Subject age was significantly associated with Log TIgE (B, 0.002 [95% CI, 0.001–0.004]). Subject sex and urine cotinine level were also significantly associated with Log-TIgE. As we expected, D. farinae sensitization status was strongly associated with LogTIgE.
The association between variables and logarithmic total IgE concentration
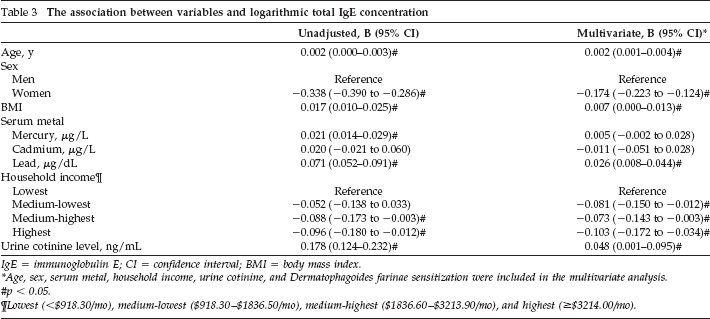
IgE = immunoglobulin E; CI = confidence interval; BMI = body mass index.
Age, sex, serum metal, household income, urine cotinine, and Dermatophagoides farinae sensitization were included in the multivariate analysis.
p < 0.05.
Lowest (<$918.30/mo), medium-lowest ($918.30–$1836.50/mo), medium-highest ($1836.60–$3213.90/mo), and highest (>$3214.00/mo).
We divided all the subjects into two groups according to D. farinae sensitization status. The total IgE level was significantly higher in the D. farinae sensitization group than in the group without D. farinae sensitization (data not shown). However, there was no significant difference in the mean blood lead level between these two groups (data not shown). We analyzed the correlation between total IgE and blood lead concentrations in these two groups by using the Spearman correlation test. The correlation between total IgE and blood lead concentrations was greater in the D. farinae sensitization group (ρ = 0.244, p < 0.001) compared with the group without D. farinae sensitization (ρ = 0.115, p < 0.001) (Fig. 1). Also, we investigated the adjusted association between subject variables and LogTIgE in the two groups (Table 4). We found a significant association between total IgE and blood lead levels in the D. farinae sensitization group (B, 0.043 [95% CI, 0.014–0.071]; R 2 = 0.122) but not in those without D. farinae sensitization (B, 0.015 [95% CI,-0.008 to 0.039]; R 2 = 0.044).
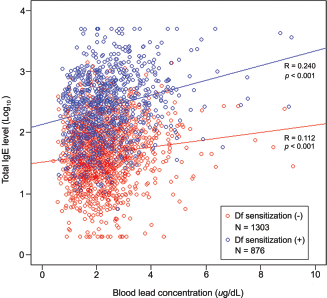
Scattered distribution of logarithmic total immunoglobulin E (IgE) according to serum lead concentration in a population with (blue circle) or a population without Dermatophagoides farinae sensitization (red circle). A logarithmic transformation based 10 was performed to generate a scattered plot, because total IgE level had a skewed distribution. Data from five outliers were excluded from the scatter plot.
Independent association between variables and total IgE concentration*
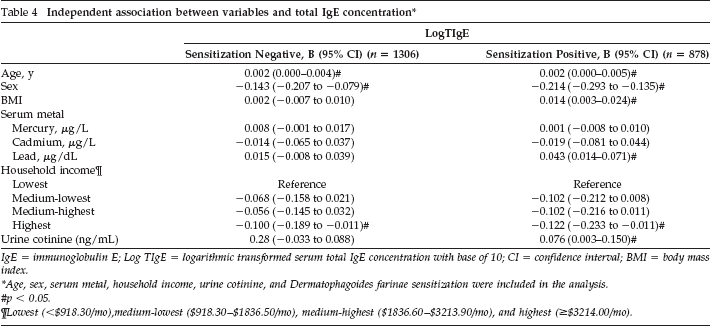
IgE = immunoglobulin E; Log TIgE = logarithmic transformed serum total IgE concentration with base of 10; CI = confidence interval; BMI = body mass index.
Age, sex, serum metal, household income, urine cotinine, and Dermatophagoides farinae sensitization were included in the analysis.
p < 0.05.
Lowest (<$918.30/mo), medium-lowest ($918.30–$1836.50/mo), medium-highest ($1836.60–$3213.90/mo), and highest (≥$3214.00/mo).
Discussion
Our study found a significant correlation between blood lead and total IgE levels; this result was consistent with those of previous reports.9,12–14 In addition, we identified that the positive association between serum total IgE and lead levels was significant only in subjects sensitized to D. farinae and that the serum lead level was not significantly associated with total IgE level in subjects without D. farinae sensitization. We also observed a significant association between urine cotinine and total IgE levels in subjects with D. farinae sensitization but not in those without D. farinae sensitization. This result indicated that allergic sensitization might potentiate the immune response induced by environmental pollutants, such as lead and smoking.
Previous studies showed that Th2 immune responses could present differently according to the presence of allergic sensitization. Vidal et al. 18 showed that the serum total IgE level was correlated with alcohol consumption in both atopic and nonatopic groups. However, the positive association between alcohol consumption and the serum total IgE level was stronger in the atopic group compared with the nonatopic group. 18 Also, Annesi-Maesano et al. 12 demonstrated that the cord blood IgE level was more strongly correlated with hair lead levels in mothers with allergy than in mothers without allergy. Our results supported the theory that allergic sensitization might potentiate the Th2 response induced by nonallergic stimulation, such as alcohol, smoking, and environmental pollutants. However, there was a conflicting report. Lynch et al. 3 reported that the increase of the total IgE level after Ascaris infection was significantly higher in children without atopy than in children with atopy. Interestingly, specific anti-Ascaris IgE concentration was higher in children with atopy compared with children without atopy. 3
We do not know the clinical significance of the association between elevated total IgE and serum lead levels. Wells et al. 9 showed that the blood lead level was significantly associated with serum IgE and eosinophils but not with the prevalence of allergic diseases, such as allergic rhinitis, atopic dermatitis, and asthma. However, other reports showed an association between an elevated serum total IgE level and development of allergic diseases and symptoms.19–22 Therefore, we postulated that nonallergic stimulation, such as smoking and heavy metal exposure, would induce a more severe response in persons with atopy compared with persons without atopy.
The serum lead level of most subjects in our study was <10 μg/dL, which was considered as the reference level of elevated blood lead concentration. Only five persons showed blood lead levels of >10 μg/dL. Our results demonstrated that the significant immunologic association was present at blood lead concentrations below the reference level. There was a report that showed that various toxicities could occur even at blood lead levels of <10 μg/dL. 23 Another study reported that the immune system was more vulnerable to lead toxicity than were other systems, such as the liver or kidneys. 7 Our study demonstrated that the immune system responded to lead exposure in persons with allergy, even at concentrations below the reference level.
This result could indicate that stricter regulations regarding lead exposure might be needed for people with allergic sensitization.
We considered the possibility that an elevated serum lead level was related to D. farinae sensitization. However, serum lead concentration was not associated with D. farinae sensitization in an multivariate logistic regression analysis (data not shown). There was no significant association between D. farinae specific IgE and serum lead levels (p = 0.016, p = 0.453). We postulated that increased serum lead did not affect the risk of D. farinae sensitization but that the association between lead exposure and total IgE was influenced by allergic sensitization. There were reports that support the positive association between smoking and the risk of allergic diseases.24,25
Also, our results also showed that an elevated serum total IgE level was associated with the urine cotinine level in persons with atopy but not in persons without D. farinae sensitization. Even though the urine cotinine level could not represent the past smoking status enough, 26 our results supported the results of Nadif et al. 27 They reported that smoking was associated with a decreased fractional exhaled nitric oxide level and that this association was stronger in participants with atopy than in participants without atopy. 27
Conclusion
Our study has several limitations. First, in our retrospective study, we could use only D. farinae specific IgE levels to determine the presence of allergic sensitization. The results of other common allergen tests, such as the skin-prick test or additional specific IgE tests, would allow a stronger conclusion. Second, house dust might be the important source of allergens and lead exposure 28 ;therefore, the exposure level of house dust and allergens should be considered to investigate the immunologic effect caused by lead because the simultaneous elevation of exposure to allergens and lead might mask the effect of each factors. However, we could not consider these in this analysis. Third, we could find an only weak association between serum lead and total IgE but could not ascertain whether this weak association was clinically significant; therefore, further study is needed to reveal the clinical significance of this weak relationship. Fourth, we do not know the clinical significance of an increased total IgE level in allergic disease. Previous reports showed that an elevated total IgE level is associated with an increased risk of developing allergic disease and more severe symptoms. 29 Therefore, an investigation of the allergic symptoms of subjects should be included in further studies. The serum lead level was positively associated with the total IgE level. However, this correlation was statistically significant in subjects with D. farinae sensitization. This result indicated that the immunologic effect of lead exposure may be greater in persons with allergic sensitization.
Footnotes
Acknowledgments
We thank Myong Hee Kim, Suan Kang, and Iaan Kang for assistant in drafting and revising manuscript.