
Abstract
Background
Exposure to fine particulate matter (particulate matter ≤2.5 μm [PM2.5]) increases the risk of allergic rhinitis (AR), but the underlying mechanisms remains unclear. Thus, we investigated the roles of T-helper (Th)1–Th2 cytokines and nasal remodeling after ambient PM2.5 exposure in a rat model of AR.
Methods
Female Sprague-Dawley rats were randomized into six groups: a negative control group, a group of healthy rats exposed to 3000 μg/m3 PM2.5, an ovalbumin (OVA) induced AR model, and three PM2.5-exacerbated AR groups exposed to three different concentrations (200, 1000, and 3000 μg/m3) of PM2.5 for 30 days via inhalation. Nasal symptoms, levels of Th1–Th2 cytokines, the degree of eosinophilia in nasal lavage fluid (NLF), and the messenger RNA (mRNA) expressions of transcription factors GATA-3 and T-bet in the nasal mucosa were measured in each individual rat. Hyperplasia of globet cells and collagen deposition were examined by histology.
Results
PM2.5 significantly increased the number of sneezes and nasal rubs in rats with AR. PM2.5 also significantly decreased interferon gamma and increased interleukin (IL) 4 and IL-13 expressions as well as the number of eosinophils in NLF. The mRNA expression of GATA-3 in the nasal mucosa of rats with AR was upregulated by PM2.5, whereas T-bet was significantly downregulated. Statistically significant differences in OVA-specific serum immunoglobulin E, goblet cell hyperplasia, collagen deposition, and transforming growth factor beta 1 levels were observed between the PM2.5-exacerbated AR groups and the AR model group.
Conclusion
Analysis of our data indicated that an increase in the immune response with Th2 polarization and the development of nasal remodeling may be the immunotoxic mechanisms behind the exacerbation of AR after exposure to PM2.5.
The immune system is a sensitive target for toxicologic environmental factors. An optimal balance of T-helper (Th) 1 and Th2 responses is essential for a normal immune response. Transcription factor T-bet regulates the secretion of Th1 cytokines, and its expression is strongly correlated with interferon (IFN) γ levels, and is specifically upregulated in primary Th cells that differentiate along the Th1 lineage. 6 The transcription factor GATA-3 is expressed in Th2 cells and plays a role in inducing the gene expression of Th2 cytokines such as interleukin (IL) 4 and IL-13. 7 Remodeling is the reorganization or renovation of existing tissues. This process is required to maintain normal tissue homeostasis and to repair damaged tissue. Remodeling occurs in all inflammatory responses, and the mechanism and severity vary, depending on the disease. 8 Th2 immune response and airway remodeling are well-known mechanisms responsible for AR9,10; however, little is known regarding how PM2.5 exposure affects Th2-related cytokines and the extent of nasal remodeling in AR.
We hypothesize that the further polarization of the Th1–Th2 imbalance toward a Th2 immune response and increased tissue remodeling are potential mechanisms behind the effects of PM2.5 on AR in an in vivo rat model. The aim of the study was to explore the expression of Th1–Th2-related cytokines and procollagen gene transforming growth factor (TGF) β in nasal lavage fluid (NLF) as well as to assess nasal remodeling changes in rats with AR exposed to different concentrations of PM2.5 to further understand the pathogenesis of AR after PM2.5 exposure.
Methods
PM2.5 Sample Preparation and Chemical Analysis
PM2.5 was prepared as previously described. 11 Briefly, the particulate matters were collected by using Whatman 41 filters (Whatman, Maidstone, U.K.) with TSP/PM10/PM2.5-2 samplers (Dickel, Beijing, China) at a flow rate of 77.59 L/min. The obtained PM2.5 suspension was concentrated by using a vacuum-freeze dry method, and the final product obtained was weighed and stored at -20°C. Concentrated PM2.5 was diluted with sterile 0.9% saline solution according to experimental concentrations. The diluted PM2.5 solution was stored at 4°C, and 10 mg/mL of PM2.5 was used for a liquid aerosol generator. Ten inorganic ions (F−, CH3COO−, HCOO−, Cl−, NO3−, SO42-, PO43-, Na+, NH4+, and K+) in PM2.5 samples were analyzed by ICS 3000 ion chromatography (Dionex). PAHs in PM2.5 were measured by gas chromatography-mass spectrometer (Agilent).
Animals
Forty-eight female Sprague-Dawley rats (4–5 weeks old) that were specific pathogen-free were purchased from the Experimental Animal Center of Fudan University (Shanghai, China). The rats were housed in Macrolon cages with a 12-hour light-dark cycle. The experimental protocols were approved by the institutional animal care and use committee of Fudan University. The rats were randomized into six groups (eight animals per group): a negative control group (NC group), a group of healthy rats exposed to 3000 μg/m3 of PM2.5 (NE group), an ovalbumin (OVA) induced AR model (AR group), and three PM2.5-exacerbated AR groups exposed to three different concentrations: 200, 1000, and 3000 μg/m3 of PM2.5 in ARL, ARM, and ARH groups, respectively, for 30 days via inhalation (Fig. 1).
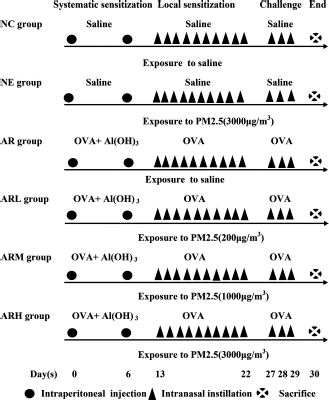
Experimental design for exposure regimen. The rats were randomly divided into six groups (eight animals per group) (1) a NC group, which was exposed to physiologic saline solution and then sensitized and challenged with physiologic saline solution; (2) a NE group, which was exposed to 3000 μg/m3 PM2.5 and then sensitized and challenged with physiologic saline solution; (3) an AR group, which was exposed to physiologic saline solution and then sensitized with OVA + Al(OH)3 and challenged with OVA; (4) an ARL group of rats with AR and exposed to a low concentration of PM2.5 (200 μg/m3) and then sensitized with OVA + Al(OH)3 and challenged with OVA; (5) an ARM group of rats with AR exposed to a moderate concentration of PM2.5 (1000 μg/m3) and sensitized with OVA + Al(OH)3 and challenged with OVA); and (6) an ARH group of rats with AR exposed to a high concentration of PM2.5 (3000 μg/m3) and then sensitized with OVA + Al(OH)3 and challenged with OVA. The systematic sensitizations with OVA and Al(OH)3 were administered through an intraperitoneal route. Local sensitizations and challenges were administered intranasally. The animals were exposed to PM2.5 on days 0–29. Nasal mucosa tissue was harvested on day 30. NC = negative control; NE = normal exposure; PM2.5 = fine particulate matter; AR = allergic rhinitis; OVA = ovalbumin; ARL, ARM, and ARH = 3 PM2.5-exacerbated AR groups exposed to 3 concentrations of PM2.5 (200,1000 or 3000 μg/m3, respectively).
AR Model
The rat model of AR was induced as previously described, 12 with minor adjustments (Fig. 1). Briefly, the rats were systemically sensitized with 1 mL of physiologic saline solution that contained 3 mg of OVA and 10 mg of Al(OH)3 through an intraperitoneal route on the first day. A booster dose was administered in the same manner 5 days later (day 6). Local sensitization was then performed via the intranasal instillation of 10 μL of OVA solution (1% OVA in physiologic saline solution) in each nostril for 7 consecutive days (from day 13 to day 22) by using a micropipette. After 5 days, the rats were challenged intranasally with 1% of OVA, 100 μL per nostril every day for 3 consecutive days (from day 27 to day 29).
PM2.5 Inhalation Exposure System
The PM2.5 inhalation exposure system used in this study was previously described and characterized with modifications. 13 Rats were exposed to PM2.5 in a quadrangular chamber (70 × 55 × 45 cm3) connected to air pumps (HSENG AS18–2; Beijing, China) with a liquid aerosol generator (HRH-WAG6; Beijing, China), which produces particles with aerodynamic diameters of <2.5 μm. The particle concentration was measured by using a PM2.5 detector (PC-3A; Jiangsu, China). A high-efficiency particulate air filter was placed at the outlet of the chamber designated for inside-outside air exchange. Four groups of animals were exposed to PM2.5 for 3 hours/day for 30 consecutive days, from day 0 to day 29, before nasal antigen challenge. The NC and AR groups were exposed to saline solution for 3 hours/day for 30 consecutive days.
Evaluation of Nasal Allergic Symptoms
The frequency of sneezing and nasal rubbing were counted for 15 minutes immediately after the last nasal challenge.
Nasal Lavage Procedure and Measurement of Cytokine Levels
Collection of the NLF was performed on day 30. 14 The pooled NLF was centrifuged at 2000 × g for 10 minutes at 4°C, and the number of eosinophils was counted by using a standard hemocytometer after staining with ethanol-eosin. The INF-γ, IL-4, IL-13, eotaxin-1, and TGF-β1 levels in NLF were measured by using their respective enzyme-linked immunosorbent assay (ELISA) kits according to the manufacturer's instructions (Gefan Biotech, Shanghai, China).
Measurement of OVA-Specific Serum Immunoglobulin E
On day 30, after performing nasal lavage, blood samples were drawn from the abdominal aorta. Individual serum samples were prepared via centrifugation of blood at 1000 × g for 15 minutes and the obtained serum was stored at -20°C until further analysis. The concentrations of serum OVA-specific immunoglobulin E (IgE) in rats were determined by using an ELISA kit (Gefan Biotech, Shanghai, China) by following the manufacturer's instructions.
Real-Time Quantitative Reverse-Transcription Polymerase Chain Reaction
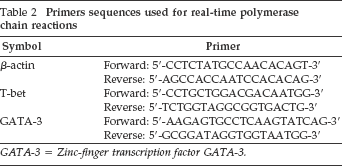
Total RNA was extracted from nasal mucosal tissues by using TRIzol reagent (Invitrogen, Shanghai, China) according to the manufacturer's protocols. The expression of the transcription factors T-bet and GATA-3 were quantified from synthesized complementary DNA by using an SYBR Green assay on a CFX96 Touch Real-Time Detection System (Bio-Rad Laboratories, Inc., Hercules, CA). All the primers were synthesized by Invitrogen, and their sequences are presented in Table 2. β-actin was used as an endogenous reference. Relative quantitation values (2-ΔΔCt) were expressed as the fold change over controls.
The ions and PAHs in PM2.5*
PAHs = polycyclic aromatic hydrocarbons; PM2.5 = fine particulate matter.
Data are means ± standard deviations of three independent experiments.
Primers sequences used for real-time polymerase chain reactions
GATA-3 = Zinc-finger transcription factor GATA-3.
Tissue Preparation and Histologic Assessment of Nasal Mucosa
On day 30, parts of the nasal septum mucosa were harvested immediately after the collection of the serum samples mentioned above. 15 The septum mucosa specimens were then fixated in 10% formaldehyde and embedded in paraffin. The histopathologic changes were evaluated in tissue sections under a light microscope. The specimens were sliced into 4-μm sections and stained with periodic acid–Schiff (PAS) and Masson-trichrome (MT) to assess goblet cell hyperplasia and collagen deposition in nasal mucosa, respectively. The hyperplasia of the goblet cells in the epithelial lining was graded by a score based on the percentage of the goblet cells in the epithelium. The scoring system was previously described. 16 A five-point scoring system (grades 0–4) was adopted: grade 0, no goblet cells; grade 1, <25% goblet cells; grade 2, 25–50% goblet cells; grade 3, 51–75% goblet cells; and grade 4, >75% goblet cells. As previously described, 17 three representative areas were chosen. At 400-fold magnification, the size of the collagen deposition areas (stained in blue) beneath the basement membrane were measured. The degree of collagen deposition was calculated as the percentage of blue areas in the nasal mucosa by using Image J software. 18
Statistical Analysis
The results were expressed as the mean ± standard deviation and analyzed with SPSS software (SPSS for Windows 18.0; SPSS Inc,). A one-way analysis of variance with the Tukey-Kramer post hoc test was used to test for significant differences among the groups. A p value of <0.05 was considered statistically significant.
Results
Analysis of PM2.5 Chemical Characteristics
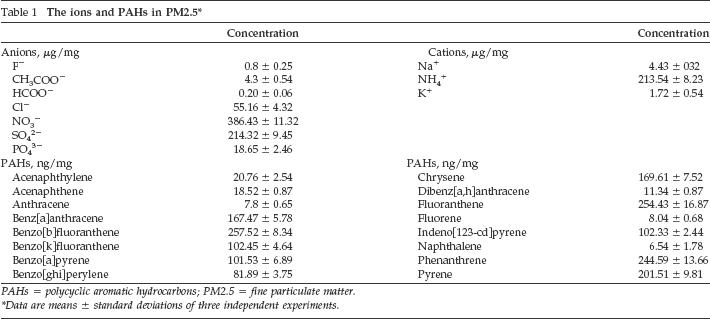
Ions and PAHs composition of PM2.5 are shown in Table 1. It can be seen that NO3−, SO42-, and NH4+ were the prevalent ions in PM2.5, whereas benzo[b]fluoranthene, phenanthrene, fluoranthene, pyrene, and chrysene represent the most abundant PAH in PM2.5 collected in Shanghai.
AR Symptoms in Rats
After antigen challenge, the PM2.5-exacerbated AR groups of rats (200, 1000, and 3000 μg/m3 of PM2.5) showed significantly more sneezes and rubs during the 15-minute observation period compared with the AR group. The numbers of sneezes and rubs of the NE group of rats was only slightly higher than but not significantly different from those in the NC group (p > 0.05) (Fig. 2).
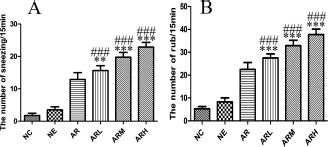
PM2.5 exposure aggravated symptoms in rats (n = 8). After the last challenge, the numbers of sneezes (A) and nasal rubs (B) in the individual rats were observed for 15 minutes. Data are expressed as the mean ± SD, n = 8. The AR group was exposed to physiologic saline solution and then sensitized with OVA + Al(OH)3 and challenged with OVA. The ARL, ARM, and ARH groups were three PM2.5-exacerbated AR groups exposed to three concentrations of PM2.5, of 200, 1000, and 3000 μg/m3, respectively. *p < 0.05, **p < 0.01, ***p < 0.001 (ARL, ARM, ARH groups versus the AR group), #p < 0.05, ##p < 0.01, ###p < 0.001 (ARL, ARM, ARH groups versus the NE group), Δp < 0.05, ΔΔp < 0.01, ΔΔΔp < 0.001 (NE group versus NC group). PM2.5 = Fine particulate matter; SD = standard deviation; AR = allergic rhinitis; NE = group of healthy rats exposed to 3000 μg/m3 of PM2.5; NC = negative control group; OVA = ovalbumin ARL, ARM, and ARH = 3 PM2.5-exacerbated AR groups exposed to 3 concentrations of PM2.5 (200, 1000 or 3000 μg/m3, respectively).
OVA-Specific IgE Levels in Serum
The PM2.5-exacerbated AR groups produced substantially higher levels of OVA-specific IgE compared with the AR and NC groups (Fig. 3 A). There were no significant differences in OVA-specific IgE between the NE and NC groups.
NLF Cytokine and Eosinophil Levels
The expressions of IL-4 and IL-13 were significantly increased in the NLF of rats with AR exacerbated by PM2.5, whereas the expression of IFN-γ in NLF significantly decreased (Fig. 3, B–E). Similar to the Th2 cytokine responses to PM2.5, the level of eotaxin-1 in NLF was also substantially higher in the PM2.5-exacerbated AR groups. Furthermore, the level of the profibrotic cytokine TGF-β1 was also dramatically increased after PM2.5 exposure in NLF (Table 3). The expressions of IL-4, IL-13, and TGF-β1 in NLF were increased in the NE group compared with the NC group. The numbers of eosinophils in the NLF (Fig. 3 F) from the PM2.5-exacerbated AR groups were significantly higher than those from the AR and NE groups. However, there was no significant difference between the NE and NC groups.
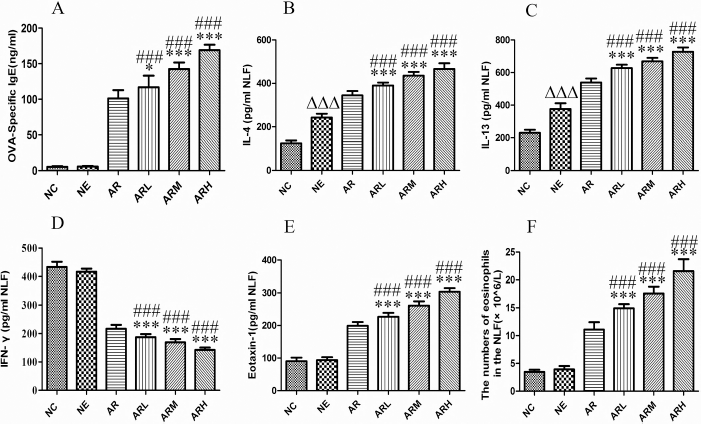
Sample size, n = 8. The effect of PM2.5 exposure on OVA-specific serum IgE (A), cytokine profile (B–E), and the number of eosinophils in NLF (F). The AR group was exposed to physiologic saline solution and then sensitized with OVA + Al(OH)3 and challenged with OVA. The ARL, ARM, and ARH groups are three PM2.5-exacerbated AR groups exposed to three concentrations of PM2.5 of 200,1000, and 3000 μg/m3 respectively. *p < 0.05, **p < 0.01, ***p < 0.001 (ARL, ARM, ARH groups versus AR group), #p < 0.05, ##p < 0.01, ###p < 0.001 (ARL, ARM, ARH groups versus NE group), Δp < 0.05, ΔΔp < 0.01, ΔΔΔp < 0.001 (NE group versus NC group). PM2.5 = Fine particulate matter; OVA = ovalbumin; IgE = immunoglobulin E; NLF = nasal lavage fluid; ARL, ARM, and ARH = 3 PM2.5-exacerbated AR groups exposed to 3 concentrations of PM2.5 (200,1000 or 3000 μg/m3, respectively). AR = allergic rhinitis; NE = group of healthy rats exposed to 3000 μg/m3 PM2.5; NC = negative control group.
Effect of PM2.5 on nasal remodeling in rats (N = 8)§
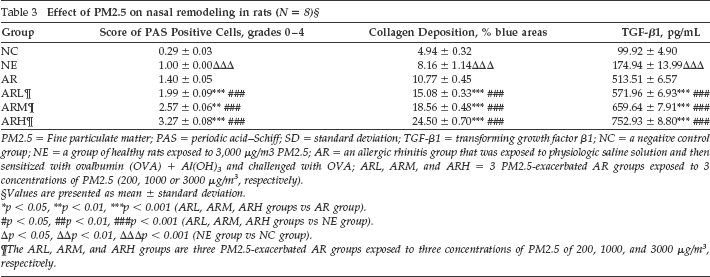
PM2.5 = Fine particulate matter; PAS = periodic acid-Schiff; SD = standard deviation; TGF-β1 = transforming growth factor β1; NC = a negative control group; NE = a group of healthy rats exposed to 3,000 μg/m3 PM2.5; AR = an allergic rhinitis group that was exposed to physiologic saline solution and then sensitized with ovalbumin (OVA) + Al(OH)3 and challenged with OVA; ARL, ARM, and ARH = 3 PM2.5-exacerbated AR groups exposed to 3 concentrations of PM2.5 (200, 1000 or 3000 μg/m3, respectively).
Values are presented as mean ± standard deviation.
p < 0.05,
p < < 0.01,
< 0.001 (ARL, ARM, ARH groups vs AR group).
p < 0.05,
p < 0.01,
p < 0.001 (ARL, ARM, ARH groups vs NE group).
p < 0.05,
p < 0.01,
p < 0.001 (NE group vs NC group).
The ARL, ARM, and ARH groups are three PM2.5-exacerabated AR groups exposed to three concentrations of PM2.5 of 200, 1000, and 3000 μg/m3, respectively.
Gene Expression Analysis of Th1- and Th2-Associated Transcription Factors
The expression of GATA-3 in the PM2.5-exacerbated AR groups increased significantly as the inhaled PM2.5 concentration increased. In contrast, the T-bet expression levels in the PM2.5-exacerbated AR groups were lower than those in the AR and NE groups. The expression of GATA-3 messenger RNA (mRNA) was increased in the NE group compared with the NC group. There were no significant differences in the expression of T-bet levels between the NE and NC groups. (Fig. 4).
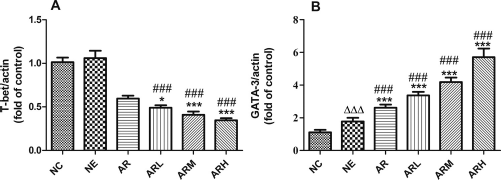
Sample size, n = 8. The effect of PM2.5 on the mRNA expression of Th1- and Th2-related transcription factors accessed by real-time PCR. The AR group was exposed to physiologic saline solution and then sensitized with OVA + Al(OH)3 and challenged with OVA. The ARL, ARM, and ARH groups are three PM2.5-exacerbated AR groups exposed to three concentrations of PM2.5 of 200, 1000, and 3000 μg/m3, respectively. *p < 0.05, **p < 0.01, ***p < 0.001 (ARL, ARM, ARH groups versus AR group). #p < 0.05, ##p < 0.01, ###p < 0.001 (ARL, ARM, ARH groups versus NE group), Δp < 0.05, ΔΔp < 0.01, ΔΔΔp < 0.001 (NE group versus NC group). PM2.5 = Fine particulate matter; mRNA = messenger RNA; Th = T helper; PCR = polymerase chain reaction; ARL, ARM, and ARH = 3 PM2.5-exacerbated AR groups exposed to 3 concentrations of PM2.5 (200, 1000 or 3000 μg/m3, respectively). AR = allergic rhinitis; NE = group of healthy rats exposed to 3000 μg/m3 PM2.5; NC = negative control group; OVA = ovalbumin.
Histopathology Results of PAS Staining and MT Staining
PAS staining (Fig. 5) and MT staining (Fig. 6) revealed increased goblet cells and collagen deposition, respectively, in the nasal mucosa of PM2.5-exacerbated AR groups compared with the AR and NE groups. As shown in Table 3, each score was significantly increased in the PM2.5-exposure groups in a dose-dependent manner. The goblet cells and collagen deposition in the NE group were significantly higher than those in the NC group.
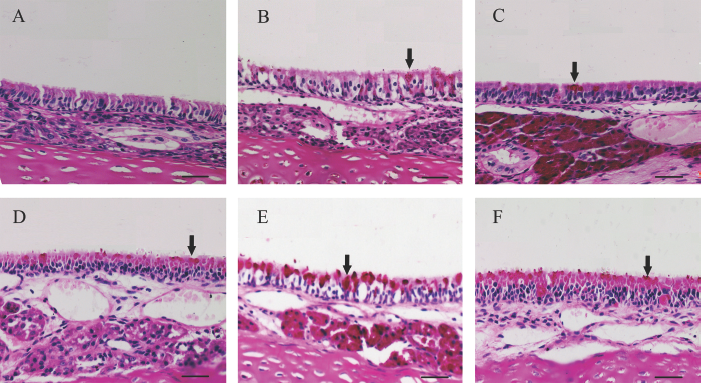
The effect of PM2.5 exposure on goblet cell hyperplasia of the nasal epithelium as detected by PAS staining. (A) NC group. (B) Group of healthy rats exposed to 3000 μg/m3 PM2.5 (NE group). (C) AR group that was exposed to physiologic saline solution and then sensitized with OVA + Al(OH)3 and challenged with OVA. (D–F). Images of three PM2.5-exacerbated AR groups exposed to three concentrations, 200, 1000, and 3000 μg/m3, of PM2.5 of ARL, ARM, and ARH groups, respectively) (B–F, arrows indicate sites of goblet cell) (scale bars = 50 μm, original magnification, X400). PM2.5 = Fine particulate matter; AR = allergic rhinitis; PAS = periodic acid-Schiff; NC = negative control; NE = a group of healthy rats exposed to 3000 μg/m3 PM2.5; OVA = ovalbumin; ARL, ARM, and ARH = 3 PM2.5-exacerbated AR groups exposed to 3 concentrations of PM2.5 (200, 1000 or 3000 μg/m3, respectively).
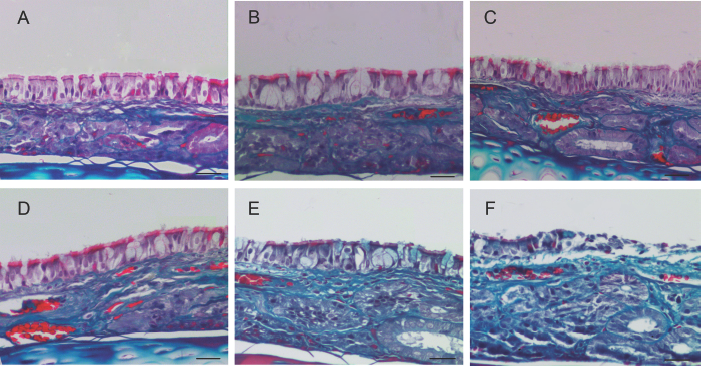
The effect of fine particulate matter (PM2.5) exposure on collagen deposition of the nasal mucosa detected by MT staining. (A) NC group. (B) Group of healthy rats exposed to 3000 μg/m3 PM2.5 (NE group). (C) AR group, which was exposed to physiologic saline solution and then sensitized with OVA + Al(OH)3 and challenged with OVA. (D-F). Images of three PM2.5-exacerbated AR groups exposed to three concentrations, 200, 1000, and 3000 μg/m3, of PM2.5 of the ARL, ARM and ARH groups, respectively. The collagen deposition areas were stained in blue (Scale bars = 50 μm; original magnification, X400). MT = Masson-Trichrome; NC = negative control; NE = a group of healthy rats exposed to 3000 μg/m3 PM2.5; AR = allergic rhinitis; OVA = ovalbumin; ARL, ARM, and ARH = 3 PM2.5-exacerbated AR groups exposed to 3 concentrations of PM2.5 (200, 1000 or 3000 μg/m3, respectively).
Discussion
In the current study, we investigated the effects of PM2.5 exposure to nasal mucosa in a rat model of AR. We demonstrated that PM2.5 exposure, especially at high concentrations, was associated with significantly increased clinical symptoms as well as an increase in the number of eosinophils in the NLF, serum OVA-specific IgE levels, Th2 cytokines, and TGF-β1 levels. In addition, goblet cell hyperplasia and collagen deposition were also aggravated. The upregulation of transcription factor GATA-3 mRNA expression and the downregulation of T-bet mRNA expression were demonstrated in the PM2.5-exacerbated AR groups. Previous studies on the effect of PM2.5 exposure frequently used the intratracheal instillation or oropharyngeal aspiration routes, although these routes of administration are not physiologic. 19
In this study, inhalation exposures of animals to PM2.5 mimicked the natural conditions of real-world exposure. The Sprague-Dawley rats were exposed to a low dose (200 μg/m3), medium dose (1000 μg/m3), and high dose (3000 μg/m3) of PM2.5 in a whole-body inhalation study. With assuming a minute-volume of 200 mL for a 300-g rat, 20 inhalational exposure to 200, 1000, and 3000 μg/m3 of PM2.5 for 3 hours/day and 30 consecutive days would deliver a total amount of 0.22, 1.08, and 3.24 mg of PM2.5, respectively. The total PM2.5 exposure levels in this study, therefore, were concordant with previous intratracheal instillation study, which defines a low dose as 0.2 mg/rat, medium dose as 0.8 mg/rat, and high dose as 3.2 mg/rat. 21 The levels of PM2.5 exposure in our study were ∼6- (ARL), 29-(ARM), and 86-fold (ARH) higher than those set by the U.S. Environment Protection Agency (24 hours averaging time, PM2.5, 35 μg/m3).
There is strong evidence that air pollution, including PM2.5, may exacerbate AR and increase the number of daily medical consultations related to AR. 22 In the present study, we observed that PM2.5 enhanced OVA-induced AR nasal symptoms such as sneezing and nasal rubbing. To further characterize the induced nasal pathology, we analyzed the specific cytokine pattern (Th1 or Th2) in NLF analysis and assessed nasal remodeling with histology. Eosinophilic inflammation is one of the primary characteristic features of AR. Analysis of recent data indicates that eosinophils substantially contribute to airway remodeling. 23 Effector functions of eosinophils include production of TGF-β1, IL-4, and eotaxin-1, which, in turn, further contribute to airway remodeling. 24 Eotaxin-1 binds with high affinity to the CC chemokine receptor 3 and is known to be enhanced by Th2 cytokines, such as IL-4 and IL-13.25,26
Analysis of our findings indicated that the increase of eosinophils in NLF may explain the Th2-dominant immune response and increased chemokine production caused by exposure to PM2.5. Analysis of recent data showed that exposure to PM2.5 in mice may lead to an Th1–Th2 imbalance and drive a Th2-biased immune response. 27 Thus, in accordance with our study, the enhanced IL-4 and IL-13 in the NE group indicated that PM2.5 may act as a pathogenic stimulant that leads to Th2 immune responses. The present study showed that the expression of the transcription factor GATA-3 was significantly upregulated by PM2.5 in the nasal mucosa of rats with AR. This may be the reason behind the accentuation of Th2-dominant inflammation observed in rats with PM2.5-exacerbated AR.
TGF-β1 is a central mediator of fibrosis that stimulates collagen production by fibroblasts. The production of TGF- β1 is partially regulated by Th2 responses 17 and/or eosinophils. 28 IL-13, a Th2 cytokine, has been shown to induce tissue fibrosis by stimulating the production and activation of TGF-β1. 29 The effect of PM2.5 on eosinophilia in the nasal mucosa and its effect on antigen-induced Th2 responses may act synergistically to increase TGF- β1, which led to the aggravation of remodeling and AR symptoms.
Epithelial cells of the nasal mucosa are the first line of defense in the respiratory tract and are constantly exposed to airborne pollutants. The nasal epithelium is not only a physical barrier but a dynamic host defense participant. Its sensors, signaling circuits, and effector molecules coordinate and execute a reaction to PM2.5. 11 The most significant nasal remodeling end point observed in this study was mucus cell metaplasia, which resulted in increased numbers of goblet cells that were readily detectable by PAS staining. Mucus cell metaplasia and subsequent enhanced mucus production by goblet cells are hallmark features of AR. Collagen is a major structural framework for tissue, and collagen deposition is crucial for tissue remodeling after injury or inflammation. Remodeling in AR includes pseudothickening of reticular basement membrane with increased deposition of collagen types I and III. 30 In the nasal mucosa of mild and severe persistent AR, the distribution pattern of collagen, proteoglycans, and lymphatic vessels are altered to modulate the remodeling process. 31 In the present study, both the degree of collagen deposition and TGF-β1 levels were significantly enhanced in the rats with AR exposed to PM2.5 compared with rats with AR not exposed to PM2.5, as well as nasal remodeling (Fig. 7).
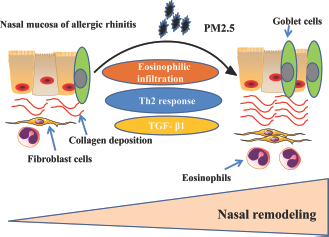
A schematic diagram of nasal remodeling in AR after exposure to fine particulate matter (PM2.5). AR = Allergic rhinitis; PM2.5 = fine particulate matter.
Conclusion
Results of the present study indicated that inhalation exposure to three different concentrations of PM2.5 increased AR symptoms, the degree of nasal remodeling, and the release of Th2-type cytokines in rats with OVA-induced AR. The inhibition of Th2 cytokine production, goblet cell hyperplasia, and collagen deposition may at least partially prevent the pathologic process of AR exposure to PM2.5.