
Abstract
Quantitative analyses of maize cupule measurements from the Malpaso Valley, Zacatecas, Mexico, suggest that high-status households had preferred access to distinct maize varieties or maize with morphological traits that might be interpreted as high quality. Through a combination of cluster analysis, Principal Components Analysis, and chi-square tests, this study demonstrates the utility of examining the differential distribution of morphological traits, even when the remains occur primarily in the form of detached cupules. This study does not address the role of genetics and environment in the morphological variation of maize cobs, but it does show that an analysis of morphological variability in maize cobs can contribute to our understanding of social or economic differences both within and among archaeological settlements.
Introduction
Throughout Mesoamerica and the North American Southwest, maize (Zea mays L.) played a central role in virtually all prehispanic communities, providing a large part of the required calories and playing an important ideological and social function. Ethnographic studies demonstrate that maize ears used for ceremonial purposes were selected for specific morphological attributes, such as larger ears, pure colors, high row number, and straight rows (Bohrer 1994; Ortiz 1969; Steinberg 1999; Stross 1994; Whiting 1966). Prehistoric studies demonstrate that similar attributes of maize may also have been used to exhibit social identity and status (Doebley and Bohrer 1983; Gumerman 1994; Toll 1991). Thus, the ability to use even fragmented archaeological maize remains to distinguish between maize varieties and maize of variable quality has the potential to contribute to an understanding of how prehistoric social groups identified and distinguished themselves from each other. An examination of the distribution of groups of maize cupules with similar morphological attributes proves to be especially useful in identifying differential access to resources in regions such as the Malpaso Valley. There, members of the La Quemada/Malpaso Valley Archaeological Project (LQ/MVAP) have found strong evidence for social complexity, even though social differences between households are difficult to discern due to a scarcity of prestige items and individual burials (Berney 2002; Nelson et al. 1992; Turkon 2002, 2004).
Maize Morphology and Sources of Variability
Sources of Maize Morphological Variability
As arguably the most important New World plant, maize has received a great deal of attention. Interest in its morphological variation originated in the controversy over maize's wild ancestor. Some scholars think that the variation reflects the genetic history of the different races of maize (Beadle 1980; Galinat 1983; Mangelsdorf 1986; Toll and Huckell 1996; Wellhausen et al. 1952). If racial characteristics of maize are reflected in morphological variability, then careful measurement of key traits should enable one to discern the similarities between races that could point to ancestral relationships (Benz 1994; Bird 1994; Johannessen et al. 1990; King 1994; Sanchez et al. 1993). Alternatively, others think that morphological variability is also a result of growing conditions or other environmental and cultural factors (Adams et al. 1999; Benz 1994; Goette et al. 1994; Goodman and Paterniani 1969; Johannessen et al. 1990; King 1994; Mackey 1983, 1985; Sanchez et al. 1993). Modern field experiments show that varying the environmental conditions, particularly the amount and timing of watering, can obscure race-identifying characteristics and, at best, provide conflicting results about the effects of these variables on cupule morphology (Adams et al. 1999; Mackey 1983, 1985; Sanchez et al. 1993). For archaeological specimens, pre- or post-depositional treatment of maize, such as charring, for example, may also affect morphology (Benz 1994; Goette et al. 1994; Johannessen et al. 1990; King 1994).
In addition to genetics and growing conditions, morphological variation occurs through conscious selection by farmers as a symbol or a reflection of social status and identity (Hastorf and Johannessen 1994). For example, ethnographic data suggest that great lengths were often taken to conserve or create ears that contained pure colored kernels with very straight rows (Ortiz 1969; Sahagun 1969; Steinberg 1999; Whiting 1966). These ears, culturally deemed to be of high value and near perfect, were important for ceremonial or ritual uses (Sahagun 1969).
Social Meaning of Maize Morphological Variability
Maize is also used as a symbol or a reflection of social status and identity (Hastorf and Johannessen 1994). In some archaeological studies, the possession and consumption of large quantities of maize correlates with high status (Clark and Blake 1994; Costin and Earle 1989; Fritz 1994; Hastorf and Johannessen 1993; Wymer 1994). In other studies, cultural or social affiliation may be expressed by specific maize varieties (Doebley et al. 1983:108; Dunavan 1990; Toll 1991; Whiting 1966:46). Greater wealth and social contacts might be responsible for some social groups having access to more diverse maize varieties; social groups that controlled the resources, such as water supplies or good soil, might grow maize with different morphological attributes than social groups that have access to poorer growing conditions; and elite social groups might also consume maize with morphological characteristics distinct from non-elite groups because they receive the highest quality maize as a form of tax or tribute.
The social and ceremonial value of maize may be seen archaeologically in the greater frequency of maize relative to presumably lower value foods in macrobotanical assemblages from high status or ritual deposits. Status differences, such as differential access to resources or food tribute, might also be reflected in the morphological characteristics of maize.
Morphological Attributes
Various maize ear, kernel, and cupule measurements are frequently used to describe morphological variability. However, not all of these measurements are useful for archaeological maize collections, which usually contain an assemblage of cob fragments, individual cupules, kernels, and kernel fragments but few whole cobs (without kernels) or ears (with kernels). Because they are composed of fairly dense tissue and are often charred as a result of burning dried cobs for fuel, cupules tend to preserve particularly well and are well represented in archaeological collections (Figure 1). In addition, they are the waste products, not the focus, of human consumption and are more likely to be found in occupation debris.

Cross section of maize cob showing location of maize cupules. Cupules are shaded black and gray.
The studies mentioned in the section above demonstrate that environmental variability and intentional and unintentional cultural treatment do not affect all traits equally and that some traits may be more affected (and therefore less representative of genetic variety) than others. For example, measurements such as row number, which can be estimated based on the cupule angle, seem to vary least by environmental conditions and may, therefore, be most diagnostic of variety (Adams et al. 1999; King 1994; Sanchez et al. 1993; although see Mackey 1983 for significant variation). Similarly, cupule measurements tend to vary less than other maize parts, suggesting that cupules are potentially a good representation of genetic variability and cultural selection. Although it is unlikely that people selected directly for cupule characteristics, they did select for color, size, and shape of kernels (Ortiz 1969; Sahagun 1969; Steinberg 1999; Whiting 1966). Since cupule morphology is directly related to the size and shape of the kernels at the point where the kernels attach to the cob, it is reasonable to expect that cultural selection of maize traits could also be reflected in cupule morphology.
Despite the difficulty in pinpointing the sources of morphological variation in specific maize populations, morphological studies can provide significant and useful information identifying differential access to resources in the archaeological record. The differential distribution of maize, whether it is due to genetics, environment, cultural selection, or a combination of these variables, can contribute to an examination of the relationships between social groups within prehistoric societies. The results can provide useful starting points from which to examine the basis of social inequality.
Malpaso Valley
Geography and Subsistence
The Malpaso Valley region is one of the northernmost and larger areas that comprise the Mesoamerican frontier. It is located in the southern end of the modern state of Zacatecas, Mexico, in the eastern foothills of the Sierra Madre Occidental at 2,140–2,350 m above sea level. This semiarid region is situated on an ecotone between the arid Mesa del Norte to the north and east and the more tropical highlands to the south and west (Trombold 1985). The most archaeologically visible prehispanic occupation (A.D. 500–900) is centered on the Malpaso River drainage and its tributaries, which provide seasonal water for agriculture. Precipitation in this region is highly variable but averages less than 400 mm per year, 75% of which falls between the months of June and September. Because the presence of water is primarily seasonal, much of the vegetation is also seasonal, which converts the dry season desert into a subtropical steppe (Comisión Nacional de Agua n.d.; Secretaría de Programación y Presupuesto 1981; Schoenwetter 1963).
The few macrobotanical studies conducted in the region that are contemporary with the Malpaso Valley occupation (A.D. 500–900) reveal that the primary plant foods consumed were corn, beans, and squash, with the addition of a few other wild resources such as Agave sp., Opuntia sp., and wild legumes (Brooks et al. 1962; Toll 1990; Trombold 2000; Turkon 2002; Weintraub 1992). The nearly 90% ubiquity of maize cob and kernel fragments in macrobotanical samples, in addition to the fact that no other taxon is consistently represented in such high frequencies, suggests that maize was the most important plant food resource (Turkon 2002). The low average rainfall and its unpredictability, combined with the high ubiquity of maize indicates that access to water and field location were important factors in productivity (Elliott 2001) and are potential sources of morphological variability. The economic importance of agriculture and, in particular, of maize suggests that maize also played a central role in ideology and in social identification.
Social Organization
The only sedentary prehispanic occupation in the Malpaso Valley is Mesoamerican in character and dates to approximately A.D. 500–900, although there is some evidence that mobile foragers lived there before and after that period. In addition to overlapping radiocarbon dates that demonstrate the contemporaneity of valley sites (Nelson et al. 1997; Turkon 2002) and ceramic stylistic similarities, social or political links among sites are suggested by the presence of a three-tier settlement hierarchy. Many of the third-tier sites are physically linked to first- and second-tier sites by a complex road system (Medina González 2000; Nelson 1995; Trombold 1991). Mesoamerican style monumental architecture, such as I-shaped ballcourts and pyramids, implies that some people had enough power to organize and direct the labor and resources of others. Together with the strong Mesoamerican character of the region, these features make a strong case for the presence of a social hierarchy in the Malpaso Valley.
However, despite more than ten seasons of field research, there is a low frequency of prestige items or other evidence for significant wealth (Nelson 1995; Nelson et al. 1992), limited evidence for craft specialization (Darling 1998; Kantor 1995; Strazicich 1995; Trombold 1985; Wells 2000), and a near-absence of individual burial treatment (Falhauber 1960; Nelson et al. 1992; Nelson et al. 1993; Nelson et al. 1995; Nelson and Schiavitti 1992; Pijoan and Mansilla 1990; To 1999). In an effort to better understand the social relationships among household groups in the Malpaso Valley, I conducted a cluster analysis using the few prestige goods present and frequencies of decorated ceramics (Turkon 2004). Prestige variables include those indicators most often cited as markers of wealth and social status, such as frequencies of worked blue-green stone and shell and percentages and diversity of decorated ceramics. The analysis of prestige items suggests that highly ranked households tend to be located closest to the public ceremonial part of La Quemada, and low status households tend to be at outlying sites or middens distant from the La Quemada core structures. However, this correlation is weak and the frequency of prestige items is so low that, while these patterns do suggest some variable access to resources that probably correlates with social position, they also suggest that prestige indices alone cannot accurately identify and define status. The analysis is strengthened by a second cluster analysis using variables related to food preparation and consumption, such as frequencies of ground stone, macrobotanical diversity, and ratios of processing waste to edible remains (Turkon 2004). This second analysis shows that those households with more material wealth were the same households that were less involved in food preparation and had access to a greater diversity of foods. The results demonstrate that, in the Malpaso Valley, variation in domestic activities correlates with social differences and may have been important status markers. The resulting ranking of middens is used as a general indicator of status and as a comparative base for examining the distribution of maize cupules (grouped by morphologic traits). Each midden's ranking is discussed below.
The difference in the way in which status was exhibited between groups in the Malpaso Valley and Mesoamerica might have been due to local factors. The distance between the Malpaso Valley and the Mesoamerican core, for example, may have made acquisition of prestige items difficult. Or, the erratic rainfall may have prevented the production of predictable maize crops, impeding the development of an economic base that elite needed to acquire prestige items and increasing the value of those crops produced. Alternatively, Malpaso Valley elite may have exhibited their status differently from the rest of Mesoamerica as a way to symbolically distance themselves. For whatever reason, these data suggest that involvement in everyday domestic activities was related to socioeconomic status. It is a short leap from these findings to the expectation that people's access to high quality or distinct varieties of maize may also have been related to socioeconomic differences between households.
Analytical Contexts
The study discussed above (Turkon 2004) provides a baseline ranking of analytical units against which to compare the differential distribution of maize morphological attributes. Each analytical unit from which the data are derived is a separate midden deposit associated with households from the sites of La Quemada, Los Pilarillos, and El Potrerito (Figure 2). Each site represents a different level in the 3-tier settlement hierarchy. In all cases except for Los Pilarillos (see below), excavation units were located in middens defined from a dense surface scatter of artifacts. Units were dug in stratigraphic and arbitrary levels, usually about 15 cm in depth and rarely exceeding 20 cm. When stratum changes or architectural features were encountered, a new level or locus was formed to keep artifacts analytically separate. All soil was screened through ¼-inch mesh screen. Ten-liter bulk soil samples were taken for macrobotanical analysis from every level and locus, except from the uppermost disturbed levels. All cupules used in this research come from these samples. Due to a lack of a reliable ceramic typology and overlapping radiocarbon dates, the basic analytical unit used in this paper is the midden, so that all units, levels, and loci within the middens are combined. These analytical units are described in more depth below. More details of stratigraphy, dating, and associated artifacts are available in Turkon (2002) and Nelson (1997).

Plan of Malpaso Valley showing sites analyzed and road network. Adapted from Berges (1934) and Trombold (1991).
La Quemada
La Quemada (LQ) is at the top of the settlement hierarchy and is by far the largest site in the Malpaso Valley (Figure 3). It is located on a high rocky mountain outcrop 230 m above a flat plain (Trombold 1977), 1 km from the Malpaso River. It contains more than 60 artificial terraces on the mountain slope. Excavations of the LQ/MVAP have revealed the presence of extensive domestic complexes on the terraces and middens below the terraces. Public or ceremonial architecture at La Quemada is concentrated in the two core areas at either extreme of the site. Smaller-scale examples of ceremonial architecture are evident on some of the residential terraces. Maize cupules come from middens located below these domestic terraces.

Plan of La Quemada. Middens used in this research are numbered and highlighted in black. Map is adapted from unpublished 1987–88 map of structures made by B. Nelson, which includes topographic contours taken from the 1970 unpublished Armillas-Weigand map (with permission from Phil C. Weigand).
La Quemada Midden 6 is roughly equidistant from the two ceremonial cores. It is associated with a small terrace, that probably contained only one household, with little architecture. The midden is more than 1.5 m deep and stratified into layers, two of which contained dense cultural material. The ten measured cupules from Midden 6 are clustered in these two layers. Based on the composition of the artifacts throughout the deposit, specifically the relatively few prestige items and decorated ceramics, more evidence of food preparation than other La Quemada household, and a low diversity of foods, the household at Midden 6 is interpreted as a low status residence.
La Quemada Midden 7 is located downslope from Midden 6 and associated with the Western raised patio complex (henceforth called a banquette) of Terrace 18, one of the larger terraces at La Quemada (Nelson 1997). The West Banquette is adjacent to a small temple and ballcourt and is one of three patio complexes on Terrace 18. The midden is about 2 m deep, well stratified, dense with cultural material, and contains high frequencies of botanical remains. The 36 measurable cupules from Midden 7 are well-distributed, primarily in the middle and lower levels of the midden. Midden 7 is ranked as among the highest status at La Quemada because it contains the highest relative frequencies of prestige items and decorated ceramics, the least evidence of food preparation, and a wide variety of plant remains.
La Quemada Midden 11 is at the base of a steep natural slope, the top of which is located near the architectural core of La Quemada. Midden 11 was probably formed from trash related to activities that occurred in households associated with the monumental core. It is well-stratified, more than 2 m deep, has the highest densities of cultural material that extended throughout the midden, and has the best preservation of all middens excavated (even some glumes on the cobs were preserved). The 45 measurable cupules recovered from Midden 11 are well-distributed throughout the middle levels. Midden 11 is ranked as high status because it contains moderately high frequencies of prestige items and decorated ceramics, relatively less evidence of food preparation than most other La Quemada middens, and a wide variety of plant remains.
La Quemada Midden 13 is located about 50 m north of Midden 11 and is associated with activities that occurred on terraces to the west that have since collapsed. The midden is about 1.5 m deep, well-stratified, has good botanical preservation, and has a high density of cultural material. The 22 measurable cupules from Midden 13 are concentrated in the lower and middle levels. Perhaps due to its proximity to Midden 11, Midden 13 has similar frequencies of material remains and is also ranked as high status.
Los Pilarillos
Los Pilarillos is the second largest site in the valley and represents the second tier in the Malpaso Valley settlement hierarchy. Los Pilarillos is situated on the valley bottom, approximately 5 km southwest of La Quemada. It is connected to a large number of outlying sites by the road system, suggesting that it served an important function within the valley. Mounds visible from the surface indicate that Los Pilarillos contains one large patio-banquette complex and a larger mounded area of public or ceremonial architecture (Figure 4). The majority of maize cupules from Los Pilarillos (21 of 25) come from fill in these mounds at the northeast edge of Mound 1. Although there is no way to determine the origins of this fill, it does contain relatively high frequencies of domestic debris, prestige goods, decorated ceramics, and a high diversity of plant remains. This combination of variables supports our categorization of the midden as associated with high status residents. Unlike other middens in high status parts of La Quemada, however, the Los Pilarillos midden also contains relatively high frequencies of food preparation debris. This may indicate that elite at Los Pilarillos were involved in different activities than elite at La Quemada.

Plan of Los Pilarillos.
The remaining four cupules come from midden deposits at the southern edge of the site. These middens are unstratified, have fairly high densities of materials, less than a meter of deposit, and have poor preservation of botanical remains.
El Potrerito
El Potrerito is an example of a third-tier settlement. It is located about 4 km southwest of Los Pilarillos along the edge of the Arroyo de los Coyotes (Nelson et al. 2002). The midden areas associated with its two small, low mounds were excavated (Figure 5). Each mound and its surrounding midden deposits are assumed to represent a single household. The small area of the site and its presumably modest architecture suggests that it probably functioned as a small farmstead. Like the Los Pilarillos middens, the El Potrerito middens are shallow (usually less than a meter deep) and unstratified, have fairly high densities of unperishable materials, and have very low densities of perishable materials. All eleven of the measurable cupules come from a large pit, dug into the sterile soil adjacent to Mound 1. The provenience of these cupules, below the natural bedrock level, probably facilitated preservation. El Potrerito is ranked as very low status because both middens at El Potrerito contain low frequencies of prestige and decorated ceramics, a low diversity of plant remains (perhaps a function of preservation), and high frequencies of food preparation tools.

Plan of El Potrerito.
Overall the differential distribution of prestige goods and ceramics, broadly representative of social status, resulted in a basic ranking of middens. La Quemada Middens 7, 11, 13, and Los Pilarillos have high rankings and La Quemada Midden 6 and El Potrerito have low rankings. Unfortunately, the two lowest ranked middens produced only 21 of the 151 measurable cupules, under representing the lowest status households.
Analysis and Results
Ten-liter bulk soil samples were taken from every analytical unit excavated and analyzed for macrobotanical remains. Samples were processed using a variation of the SMAP flotation machine (Watson 1976) and were exported to Arizona State University for analysis. In the greater than 1 mm fractions, all maize fragments found were separated and weighed. Only 151 whole cupules were complete enough for measurement.
All whole maize cupules were measured using variables suggested by Bird (1994), Adams et al. (1999), and Goodman and Paterniani (1969). In total, seven measurements were taken (Figure 6). In addition to these measurements, ratios were used to quantify the general shape of the cupule. For example, the ratio of external height to external width would differentiate between a cube-shaped cupule and an elongated cupule. These measurements provide an indication of cob size, shape, and row number. Cupules were measured using ImageJ1, which projects low-power binocular microscope images onto a video screen, allowing accurate measurements to be made with a cursor. The measurements were directly imported into an Excel spreadsheet for analysis.
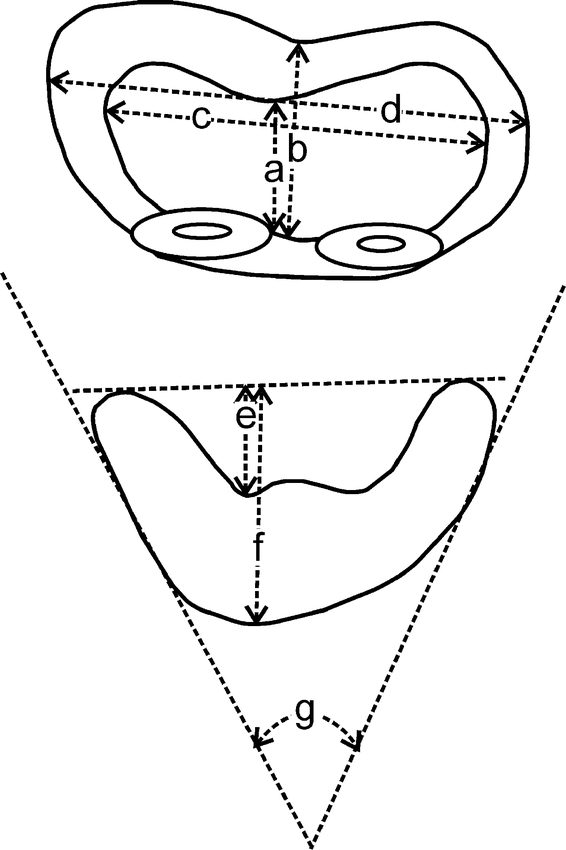
Cupule measurements: (a) internal height; (b) external height; (c) internal width; (d) external width; (e) depth; (f) thickness; (g) angle.
The means and standard deviations of each measurement divided by context are presented in Table 1 and Figure 7. These data show that the distributions of measurements from the different sites mostly overlap and that morphological variability among middens is negligible. However, the between site similarity of the maize may be misleading. Given the geographic distance between La Quemada households and field locations, it is possible that each household had access to maize from a variety of fields or farmers. These data, then, are better suited to an analysis that considers each cupule individually and forms groups based on similar characteristics of the cupules rather than the contexts.
Means and standard deviations (sd) of maize cupule measurements by Malpaso Valley midden.

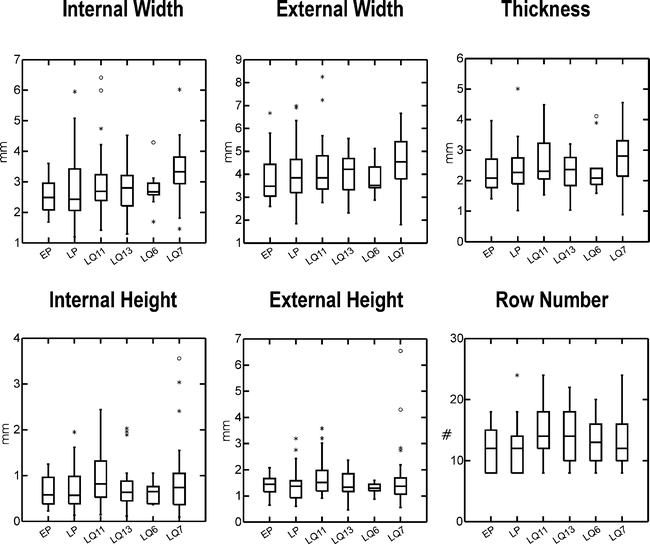
Boxplots of cupule morphology by midden. The boxes in the boxplots contain 50% of the cases. The whiskers extend to the most extreme observed value within 1.5 times the midspread (1.5 times the length of the box that contains the values of the middle 50% of the observations). Values that are more extreme than 1.5 times the midspread are noted with asterisks.
The KMEANS cluster analysis (Kintigh 1994) forms clusters of individual cases based on a process of minimizing the sum-squared error (SSE) associated with individual cases and their respective cluster centroids. The SSE is “the sum of the squared distances from each unit to its cluster centroid” (Kintigh 1994:20). The program allows for the standardization of the data, which transforms the observations so that each variable has a standard deviation of one and all variables carry equal weight in the analysis (Kintigh 1990:23). The program also provides an estimate of the degree of natural clustering in these data by scrambling the observed data within columns so that the means and standard deviations remain the same, but associations to specific cases are lost. If the resulting clusters are well defined, then the observed SSE should be small relative to SSEs generated by the random runs and should be located in the lower end or entirely outside the range of the distribution of random SSEs.
The KMEANS analysis was run on the Malpaso Valley cupule data with different combinations of measurements. Because including ratios in the analysis would double the weight of the measures from which the ratios were derived, ratios were not included in the KMEANS analysis. Cupule depth was also removed due to the difficulty of inserting a measuring device inside the cupule. Row number had little effect on cluster formation in any of the runs, thus it was also removed from the analysis. Despite the many configurations of variables run and because most of the variable sets resulted in roughly the same clusters, the final analysis included all the initial measurements except cupule depth and row number. Because cluster analysis forms clusters, regardless of the nature of the data, the Monte Carlo analysis provides a means to test the degree of meaningful clustering by generating randomized data with the same means and standard deviations as the real data (Shennan 1997:64). For each KMEANS analysis, 200 randomized runs were specified (Figure 8). The position of the solid line for the observed data below the dotted lines for the random runs indicates that the Malpaso Valley data cluster more than the confidence interval formed by 90% of the randomized runs and suggests that there is some meaningful clustering in the data. The inflection point of the solid line on the KMEANS plot, or the point at which relatively less of the SSE is explained by adding another cluster, is most frequently used to determine the best solution to the cluster analysis. In this case, the location of the inflection point for the cupule data is nearest to the three-cluster solution.
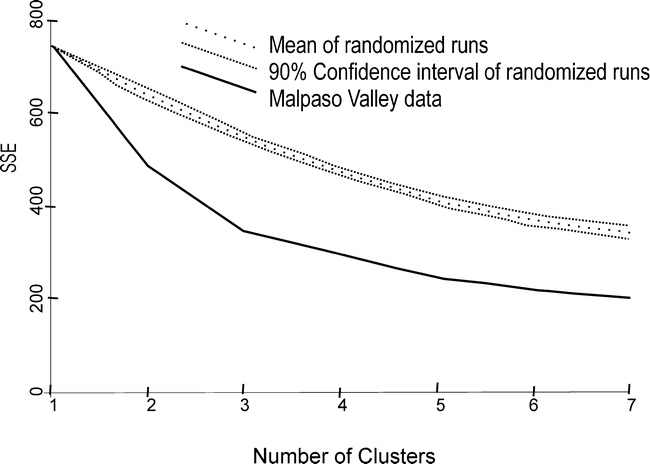
KMEANS plot of maize morphology variables. Solid line is Malpaso Valley data. Dotted lines represent mean, high and low confidence interval limits of simulated data.
A principal components analysis (PCA) provides an independent validation method to verify the resulting cluster solution (Aldenderfer 1982:68). Like cluster analysis, principle components analysis measures the covariation between variables (Shennan 1997:269). The PCA creates new synthetic variables out of the original variables to explain the variation. A PCA was run on all six original variables. The analysis shows that the same five variables all contribute to the factors (Table 2). Factor 1 is primarily affected by the width and thickness variables. Factor 2 is primarily affected by the height variables. A plot of the component loadings of the first two factors shows that a factor analysis done independently of the cluster analysis results in three fairly distinct clusters that correlate with the clusters defined by the KMEANS analysis (Figure 9). Although not presented here, a very similar plot results when the ratio variables are included in the PCA.
Component loadings of factor analysis run on six basic maize variables.


Plot of component loadings of factor analysis.
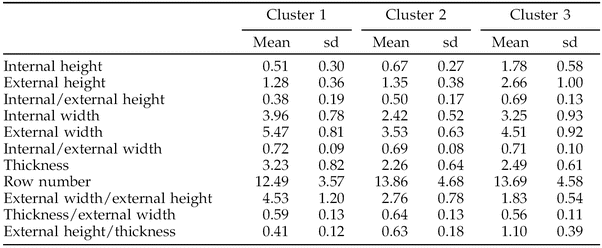
Although there is slight overlap between the clusters, there is perceptibly less overlap in the means. There are also smaller standard deviations when variables are grouped by cluster than when these same variables are grouped by midden or status (Table 3 and Figure 10). An examination of the individual variables and ratios helps to reveal the morphological traits of each cluster. Cluster 1 cupules have low internal and external width, high thickness, and low internal and external height. Cluster 1 cupules, then, tend to be short and moderately shallow. Cluster 2 cupules have high internal and external width, high external width to external height, high thickness, and low internal and external height. Cluster 2 cupules tend to be elongated, narrow, and deep. Cluster 3 cupules have high internal and external widths, high internal and external heights, and moderate thickness. Cluster 3 cupules have more of a cube-shape, are less elongated, with moderate depth. These differences are most obvious in Figure 11, where the means and standard deviations were used to create schematic size and shape outlines.
Means and standard deviations (sd) of morphological variables by cluster.

Box and whisker plots of cupule morphology by cluster.
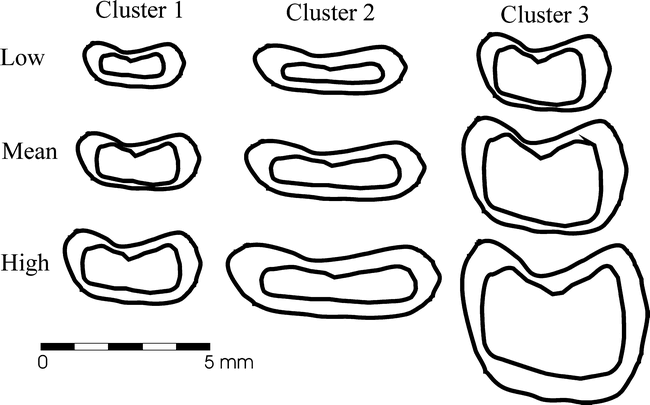
Schematic drawings of maize cupules by cluster. Low is mean minus one standard deviation. High is mean measurement plus one standard deviation.
Discussion
Morphology
By examining the box plots grouped by cluster (Figure 10) in conjunction with the schematic drawings of the means of each cluster (Figure 11), we can begin to visualize which variables are most responsible for the differences among clusters. Cluster 1 cupules are generally much smaller than cupules from clusters 2 and 3, as is most evident by the external width variable. Clusters 2 and 3, however, can be well distinguished by overall shape, as illustrated by the external width to external height and external height to thickness ratio variables. Cluster 1 cupules are generally much smaller than cupules from Clusters 2 and 3, although they are intermediary between Clusters 2 and 3 in shape because they have higher external width to height ratios.
The three variables for which the boxes overlap the least include internal height, external height/thickness, and external width/height. A closer examination of these three variables shows that they are representative of overall cupule shape. Internal height is the distance between the cupule lips, which, because it is so much broader in Cluster 3 than the other two clusters, is related to the overall shape of the cupule. The external height/thickness variable is an indication of the three dimensional shape of the cupule. External width to height is related to the internal height and measures the shape of the top view of the cupule.
Four other variables are fairly well separated but show more continuous distribution. For example, the boxplots for the internal and external width variables distinguish Cluster 1 from Clusters 2 and 3. The boxplots for the internal and external height variables distinguish Cluster 3 from Clusters 2 and 3. These four variables are more representative of overall size than shape. External width is related to the longest part of the cupule with internal width closely correlated (internal/external width variables show more or less the same ratios by cluster). The overlap in the boxplots suggests that the groupings of these variables are not based on discrete attributes but are more continuously distributed. Overlap in the width variables could result from great intervarietal morphological variation among some races as well as variation within single cobs (Johannessen et al. 1990:187). If that is the case, then, minor differences in the width variables of the Malpaso Valley cupules could be accounted for by some combination of intravarietal variability, uneven growing conditions, or maturity at harvest.
Variability in environmental or growing conditions does not affect all morphological characteristics equally. For example, cob and kernel size, as well as cupule width, are affected by amount and timing of moisture (Adams et al. 1999). Since the difference between Clusters 1 and 2 is primarily related to size, perhaps the distinction between Clusters 1 and 2 can be explained by differences in either growing conditions or intervarietal variation. In contrast, variation in row number (which could affect angle, thickness, relative cupule width ratios, and overall shape of cupules) is least affected by growing conditions (Adams et al. 1999; Sanchez et al. 1993) and more affected by genetic factors. So, because shape variables appear, at present, to be more likely representative of genetic variation, it is likely that the cluster most distinguished by shape, Cluster 3, could represent a distinct genetic variety.
Distribution
By examining the distribution of the clusters by midden, we can return to the question of differential access by social groups. La Quemada Middens 11 and 13 and Los Pilarillos units have roughly the same percentages of cupules from each cluster (Figure 12). La Quemada Midden 7 has relatively more cupules from Cluster 1 and relatively fewer cupules from Cluster 2. El Potrerito and La Quemada Midden 6 have lower than average percentages of cupules from Cluster 1, relatively greater percentages of cupules from Cluster 2, and a complete absence of cupules from Cluster 3.
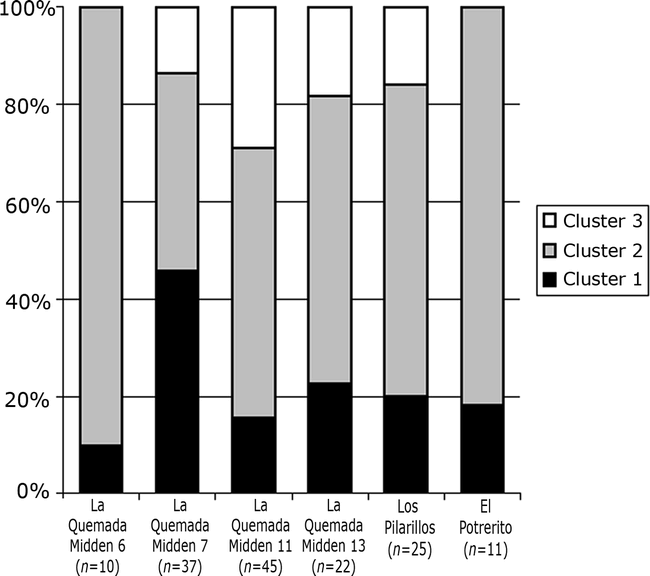
Distribution of cluster-assigned cupules by midden.
Assuming that the observed patterning is representative of variation in the distribution of maize varieties or quality and not sampling error (see below), these data provide some intriguing interpretations of social variation in the Malpaso Valley. First, only the highest ranked households had access to ears with cupules from the most morphologically distinct cluster, Cluster 3. If Cluster 3 does represent a distinct genetic variety, as proposed above, then it can be inferred that distinct genetic varieties of maize may have been used as status markers or reflections of social identity. Second, of the two remaining clusters, Cluster 2, which contains the larger cupules, is found in relatively lower frequencies in the low status middens than in high status middens. The larger size of these cupules might represent access to better growing conditions, specifically to water received at critical times in the growth cycle (Adams et al. 1999; Mackey 1983, 1985). Since water is the most critical factor in maize productivity in the Malpaso Valley today, it is likely that this was also the case during the prehispanic occupation. Therefore, the higher frequency of larger cupules in high status middens indicates that high status households also had differential access to high quality maize. This higher quality could be a result of preferential access to water, which resulted in larger cobs and kernels. The relatively larger size and greater frequencies of cupules from Clusters 1 and 3 in highly ranked contexts suggests that elite members of Malpaso Valley society may have received high quality food as tribute, had access to better growing conditions, and/or had exclusive use of specific genetic varieties.
Sample Size
The uneven sample size from each midden might explain some of the patterning discussed above. The four highest-ranked middens (Los Pilarillos, La Quemada Middens 7, 11, 13) have a greater density and better preservation of botanical remains than the two lower-ranked middens (La Quemada Midden 6 and El Potrerito). The first four middens contained 129 of the 150 cupules measured (86%). Samples from the high status contexts, then, are overrepresented. The small sample size from the lowest status middens (El Potrerito and La Quemada Midden 6) might be responsible for the absence of Cluster 3 cupules in those contexts. In addition, due to the sometimes clustered distribution of cupules within each midden, the possibility that some cupules come from the same cobs cannot be ruled out and might explain even more of the clustering by midden.
The sampling problems discussed above should not, however, deter analyses of the type presented here. Archaeologists always have to deal with low sample size, especially when working with extremely fragile or perishable materials like macrobotanical remains. Leaving the presentation of data in list form, as is often done with macrobotanical data, does not provide any real cultural information other than what plants were used. Given the option to present the raw data alone, or to subject it to a rigorous set of analyses that could potentially point to or reinforce more in-depth studies of social relationships, I suggest that these analyses should be attempted and interpreted, although cautiously, and with sample sizes and other post-depositional conditions made explicit.
In addition, statistical tools can be used to help determine the strength of the identified patterns. For example, for the Malpaso Valley cupules, a chi-square test, at the 0.025 level of significance, demonstrates an association between the cluster assignments (and therefore the morphological characteristics that formed the clusters) and the middens from which the cupules derive. This finding suggests that cultural factors are at least partially responsible for the differential distribution of morphological variants of maize in the Malpaso Valley.
Conclusion
A cluster analysis and a principal components analysis of a series of measurements of maize cupules from La Quemada middens independently confirm the separation of maize cupules into three groups. However, much of the variability appears more continuously distributed than representative of discrete characteristics. Clusters 1 and 2, in particular, are primarily distinguished by size. Cluster 3 is noticeably distinguished by shape. Although previous research demonstrates the problems with determining the source of morphological variation, I suggest that size variability is indicative of growing conditions, and shape may be more representative of distinct genetic variety. Even if the source of variability is uncertain, the distribution of cupules in different middens provides some information about differential access to resources in a society where status differences are not easily identified.
Assuming that Cluster 3 does represent a distinct variety, then the significantly higher frequency of Cluster 3 cupules in high status middens in the Malpaso Valley is intriguing evidence that elite may have distinguished themselves by the varieties of maize they consumed. These elite middens also have significantly higher frequencies of larger cupules from Cluster 2. Assuming that larger cupules correlate with larger kernels and larger ears, elites seem to have had access to higher quality, more socially valued, or more productive, ears of corn.
Both these findings provide starting points from which to derive more specific questions about sociopolitical organization in the Malpaso Valley. At the most basic level, these data show that the ways members of the elite and commoners acquired food differed—whether in labor sources (servants, slaves, household members), field locations, access to irrigation, or variety of maize consumed remains uncertain. Future studies (e.g., phytolith analysis) may be able to address the genetic differences between clusters. Other methods, such as the identification of chemical signatures of agricultural fields and produce (Cordell et al. 2001), may be able to address the possibility that maize from each cluster was produced in different agricultural fields.
Despite the low sample size and poor representation of cupules from low status middens, the compatibility of the results of this study with studies of the distribution of other artifacts related to food preparation and consumption (Turkon 2004) suggests that cupule distribution is an indicator of socioeconomic differences between households. With larger sample sizes and better representation, this method might prove to be a fairly easy way to examine access to or control of critical agricultural resources, one of the most frequently cited means to acquire social status.
Footnotes
Acknowledgments
This work could only have been completed with the assistance of many people, though I alone am responsible for any errors. The maize morphology study originated at the paleoethnobotany laboratory at the University of Minnesota under the direction of Christine Hastorf, who also provided advice throughout the study. Ian Robertson kindly read and provided statistical advice on early drafts. Cupule measurements used here were taken on equipment housed at the Archaeological Research Institute at Arizona State University. Chris Garraty, Ben Nelson, Michael Ohnersorgen, Barbara Stark, Kristin Sullivan, and three anonymous reviewers all provided comments on early drafts of this paper. Maize samples come from the Malpaso Valley Archaeological Project collections. Joaquín García Bárcena, Alejandro Martínez Murial, Lorena Mirambell, and José Francisco Román Gutiérrez, members of the Consejo de Arqueología, Peter Jimenez Betts, Baudelina Garcia, and many other archaeologists from the Instituto Nacional Antropología y Historia facilitated permits and logistics in Zacatecas. Field and laboratory work were supported by grants to Ben Nelson from the National Science Foundation, the National Endowment for the Humanities, the Foundation for the Advancement of Mesoamerican Studies, the Wenner-Gren Foundation for Anthropological Research, and the College of Liberal Arts of Arizona State University. Funding for the El Potrerito fieldwork was supported by grants to the author from the Wenner-Gren Foundation for Anthropological Research (grant #6169), the Research and Development Fund of the Department of Anthropology at Arizona State University, and the Graduate College at Arizona State University. Oralia Cabrera prepared the Spanish abstract.