
Abstract
Employing longitudinal, multisite comparative mixed-methods, we describe patterns of reclassifying and not reclassifying eligible English learner (EL) students to fluent English proficient, and we identify factors impeding and facilitating reclassification. Analyses of administrative data for 7 cohorts of students over 3 years in one district and 2 years in another revealed a considerable number of students meeting all criteria, and a nonoverlapping group meeting at least standardized-test criteria, were not reclassified, implicating this practice in the production of long-term EL status. However, the rate of not reclassifying was more than 2 to 5 times higher in one district than the other. Analyses of policy documents, reclassification decision forms, staff interviews, and surveys revealed that undergirding these differences were distinct reclassification policies and practices. We discuss policy, practice, and research implications, including issues of opportunity to learn, equity, and the need for a common definition of ELs involving a common set of specific criteria and standardized processes for reclassification statewide.
Keywords
Nationwide, English learner students (ELs) represent the fastest growing proportion of K–12 enrollment (Ruiz Soto, Hooker, & Batalova, 2015b). Among students with a primary language other than English in the home, ELs comprise the subset who at school entry do not score proficient on an initial state assessment of English language development (ELD). ELs are overwhelmingly Spanish speaking, U.S. born, and poor (EdSource, 2008; Flores, Batalova, & Fix, 2012; Ruiz Soto, Hooker, & Batalova, 2015a). In California, where 33% of the nation’s ELs reside (ED Data Express, 2011), ELs constitute roughly one-quarter of K–12 students. Of these, 75% are K–6 students (California Department of Education [CDE], 2014a).
EL status legally confers instructional support (U.S. Department of Education/Department of Justice [USDOE/USDOJ], 2015) for developing English language proficiency (ELP) and accessing core curriculum until ELs can participate meaningfully in the standard program without such support. Reclassification to fluent English proficient (FEP) signifies reaching that milestone. Despite the desirable intent of EL designation, delayed entry into the mainstream might be harmful if it delays access to core and more advanced curricular offerings.
The CDE’s (2014b) goals for ELs are achievement of full English proficiency and grade-level content standards within a reasonable time period. Yet we are falling short of those goals. Because EL status is defined by not meeting ELP criteria (and in some states, including California, other content standards), it is not surprising that ELs on average perform lower on standardized tests (National Center for Education Statistics, 2011) and are less likely to complete high school than their non-EL counterparts (CDE, 2014a; Ruiz-de-Velasco & Fix, 2000). These differences in outcomes are in part an artifact of excluding from the EL group higher performing former ELs who have reclassified FEP (Saunders & Marcelletti, 2013).
For a significant proportion of Els, we are also failing at the goal of full ELP within a reasonable time period. The majority of California’s ELs enter school in kindergarten (Hill, 2012). Yet roughly 30% to 50% fail to reclassify after 7 to 9 years of enrollment (Flores, Painter, Harlow-Nash, & Pachon, 2009; Thompson, 2015a; Umansky & Reardon, 2014), becoming ELs in long-term status as they enter secondary school (Olsen, 2010). Of Grade 6–12 ELs, 74% has been in California schools for 7 years or more (Californians Together, 2015). Unfortunately, recent research shows that secondary ELs in long-term status often experience diminished opportunity to learn (OTL) (Callahan & Shifrer, 2012; Dabach & Callahan, 2011; Estrada, 2014a, 2014b; Estrada & Wang, 2015). Turning around this trend will require assisting far more ELs to develop the ELP (and often content achievement) necessary for reclassifying; reclassifying all eligible students; and identifying and ameliorating impediments to reclassifying.
Employing longitudinal, multisite comparative mixed-methods, we describe patterns of reclassifying and not reclassifying ELs meeting all criteria and a subset of ELs meeting at least standardized-test criteria, using administrative data for seven cohorts of students over 3 years in one district and 2 years in another. To identify facilitating and impeding factors undergirding these patterns, we use policy documents, reclassification forms, interviews, and surveys.
Conceptual and Empirical Framework
This research is grounded in case studies of EL programs (Estrada, 2014a) and the observation of the apparent discrepancy between the substantial percentage of ELs who meet state guidelines for ELP (37%) and English language arts (ELA) content standards achievement criteria (60%) and the much smaller percentage reclassified FEP (11%) (CDE, 2011a). One premise is that reclassification matters because it can function as a gateway to OTL, particularly at the secondary level (Estrada & Wang, 2015). OTL includes access to core content and school resources and conditions such as track placement, course-taking patterns, and teacher and instructional quality (Guiton & Oakes, 1995; McDonnell, 1995). Using the notion that policy implementation results from the interplay of state-, district-, and school-level factors, including clarity of policies; capacity; local agendas and initiative; monitoring; and inducements (O’Day & Smith, 2016; Fuhrman & Elmore, 1990), we investigate another proposition: Reclassification policies and practices may be implicated in the production of long-term EL status.
Research That Informs How Not Reclassifying Eligible Students Can Be Detrimental
The available evidence indicates that withholding reclassification from students meeting criteria may be detrimental. First, any withholding will necessarily lead to delays in reclassifying, which can result in permanent EL status because students must meet multiple criteria in alignment each time. Second, delaying reclassification can result in long-term status and, at the secondary level, placement in separate EL Curricular Streams ([CSs] the whole of the patterned sets of ELD, content, and intervention courses; EL and non-EL peers in these courses; entry, placement, and exit criteria; and access to core content; see Estrada, 2014a). EL CSs often diminish OTL by omitting or curtailing ELD instruction, limiting access to mainstream core content and the full curriculum, and increasing remedial instruction, linguistic and social isolation, and stigmatization (Callahan & Shifrer, 2012; Dabach, 2014; Dabach & Callahan, 2011; Estrada, 2014a, 2014b; Estrada & Wang, 2013, 2015; Thompson, 2015b). Such placement often limits access to core curricula necessary for graduation, college eligibility, and exiting EL status (Callahan & Shifrer, 2012; Estrada, 2014a). Several studies demonstrate such placements are common (Dabach, 2014; Estrada, 2014a; Estrada & Wang, 2015; Olsen, 2010) and that such course taking is related to lower achievement (Callahan, 2005; Callahan & Shifrer, 2012; Mosqueda, 2012; Wang & Goldschmidt, 1999). Finally, in a district serving 89% of ELs with Structured English Immersion, a quasi-experiment examining EL entry at kindergarten, reclassification, and academic achievement revealed small academic gains for kindergartners at the margin who received services (Pope, 2016). ELs reclassified in Grades 2–4 (but not later) showed large gains in ELA test scores and GPA for 7 subsequent years. Pope concluded that providing EL services initially and shortening the length of service could increase academic achievement. These findings raise the possibility that the mixed results of the few other extant quasi-experimental studies on the effects of reclassifying (Cimpian, Thompson, & Makowski, 2017; Robinson, 2011; Robinson-Cimpian & Thompson, 2015) may be due at least in part to focusing on later grades and shorter term outcomes.
Research on the Discrepancy Between ELs Meeting Criteria and Actually Reclassifying
Little research focuses on the extent to which a discrepancy exists between ELs meeting criteria and actually reclassifying. Beyond those cited above, previous studies of reclassification have involved primarily cross-sectional or retrospective analyses of administrative data, focusing on time to reclassification (Grissom, 2004; Thompson, 2015a), variation in reclassification patterns by language program (Umansky & Reardon, 2014), and the relation between stringency of criteria, reclassification rates, and EL performance (Hill, Weston, & Hayes, 2014). This work shows that the road to reclassification is long and that it slows for secondary students.
Three investigations reported a discrepancy between the percentage of ELs meeting criteria and the percentage reclassifying. An audit of eight school districts found that in a subsample of 180 ELs, 62% were not reclassified despite meeting their district’s criteria (California State Auditor [CSA], 2005). In a single year across these districts, 42,000 candidates for reclassification were not reclassified. The CSA did not report whether it included only state standardized-test ELP and content criteria or all criteria districts use. In one district, Robinson (2011) found the reclassification rate among ELs meeting standardized-test criteria diminished across cohorts, from 91% in Grade 4 to 64% in Grade 10. Robinson surmised that staff discretion was the root of the discrepancy. Umansky and Reardon (2014) reported the opposite pattern in a different district, with 50% of ELs meeting standardized-test criteria by the end of Grade 5 but 38% reclassifying, compared with less than 70% of Grade 11 ELs meeting those criteria but 75% reclassifying. They speculated that elementary staff may not sense the urgency of reclassifying that secondary staff perceive. Because these published studies omitted additional district criteria and qualitative data on reclassification policy implementation, they provide a useful but incomplete view. The sparse research leaves a void regarding rates of eligibility and reclassifying ELs meeting all criteria—both standardized-test and local district criteria, how those rates compare for ELs meeting at least standardized-test criteria, factors facilitating or impeding reclassification, and variation by district context. Reclassification policies and practices that support meeting the dual goals of ELP and grade-level achievement require a more robust view of reclassification of ELs meeting criteria. This study begins to fill these gaps.
State Policy Context and Conjectures
The California Education Code (Section 313-313.5; California Legislative Information, 2013) identifies criteria for reclassifying ELs: (a) assessment of ELP, including but not limited to the California English Language Development Test (CELDT); (b) comparison of performance in basic skills; (c) teacher evaluation, including but not limited to review of curriculum mastery; and (d) parental opinion and consultation. The first three criteria involve student performance; the latter does not. During this study, CDE reclassification guidelines indicated districts should consider reclassifying ELs meeting the CELDT criterion for proficient and scoring basic to midbasic (300–324) on the California Standards Test (CST)-ELA. However, California is a local control state, and districts are free to operationalize the four broad criteria (CSA, 2005).
State policy and the available literature lead to several conjectures about the apparent discrepancy between the percentage of ELs meeting state guidelines for ELP and ELA criteria and the much lower reclassification rate. One conjecture is that the percentage of ELs meeting both criteria is smaller because state data are not linked at the student level. A second conjecture is that local criteria may be more stringent and numerous than state guidelines, thus reducing eligibility. In fact, Hill et al. (2014) found that more than 90% of California districts use more stringent criteria. A third conjecture is that when ELs meeting all—or at least all standardized-test criteria—are not reclassified, school staff judgments are involved. Aside from the guidance that teacher evaluation include review of curriculum mastery and academic performance, specifics are missing from the Education Code and CDE guidelines, leaving it open to interpretation (Hill et al., 2014). A final conjecture is that when these students are not reclassified, schools may fail to notify parents or seek participation.
District Reclassification Criteria and Research Questions
Consistent with CDE guidelines, District 1 students met all criteria when they (a) scored CELDT proficient, (b) scored basic or higher on the CST-ELA, and (c) earned an ELA mark of C or better, which instantiated teacher evaluation. The district addressed parent opinion and consultation via a notification letter when students reclassified.
District 2 ELs met all criteria when scoring proficient on the CELDT, the CST-ELA, and the CST-Math (CST-Math was dropped in Year 2). Teacher participation, but not approval, was required. Signatures ostensibly instantiated teacher participation, parent opinion and consultation, and district approval. Alternative criteria required scoring (a) CELDT proficient, (b) mid- to high basic on the CST-ELA, (c) mid- to high basic on the CST-Math, and (d) at threshold levels on curriculum embedded reading, writing, and math assessments (CEAs) (see Appendix in the online version of the journal). We defined the group of ELs meeting the alternative CELDT and CST criteria as meeting at least standardized-test criteria because CEA data were incomplete and inaccurate, rendering them unusable for determining whether these ELs met CEA criteria: CEAs were not recorded in the administrative data; in the available CEA data, staff often misapplied or failed to apply CEAs appropriately and/or used CEAs that did not match those specified.
Taken together, the available research indicates that reclassification to FEP merits scrutiny and points to compelling questions:
What percentage of ELs meets district reclassification criteria singly and in combination?
What percentage of ELs is and is not reclassified of those meeting: (a) all required criteria; and (b) at least standardized-test ELP and content achievement criteria (a District 2 subset)?
What district and school factors facilitate or impede reclassification for two nonoverlapping groups: (a) ELs meeting all required criteria, and (b) ELs meeting at least standardized-test ELP and content achievement criteria?
Methods
Design Overview
This comparative, mixed-methods study describes reclassification patterns and factors undergirding those patterns. Using administrative data, we identified ELs in Grades 2–8 in the baseline year (2009–2010) and then followed these seven cohorts for 3 years in District 1 and for 2 years in District 2, which ceased participating thereafter. To determine the percentage of ELs meeting each district’s criteria and the percentage reclassified and not reclassified, we linked student performance and language status data. Documents, completed reclassification decision forms, and staff interviews and surveys provided information on policies, practices, and beliefs, pointing to factors facilitating or impeding reclassification. Triangulation across complementary data within districts and comparative analysis across districts facilitated discernment of patterns of reclassification and how and why they occur (Goldenberg, Gallimore, & Reese, 2005).
Sample
Districts
From the northern and southern regions of California, we recruited districts with characteristics that increased our capacity to detect systematic rather than idiosyncratic patterns and to investigate conjectures: (a) average or above EL populations, (b) experienced in developing and implementing reclassification policies, and (c) variation in reclassification policies. Both districts were in the process of completing and implementing new EL Master Plans, yielding another point of comparison. District 1 was large and District 2 was medium-sized, together enrolling 18% of California’s ELs. Both were high-poverty, urban districts: Roughly three-quarters of students were free- and reduced-price lunch eligible, compared to about half of all California students (CDE, 2010). Compared to the state EL average (24%), District 1 had a higher percentage of ELs (32%) and District 2 had a similar percentage (25%). Compared to the state, District 1 had more Latinos (73% vs. 49%) and Spanish-speaking ELs (94% vs. 85%), whereas District 2 had lower concentrations of Latinos (33% vs. 49%) and Spanish-speaking ELs (56% vs. 85%) and a substantial proportion of Hmong-speaking ELs (21%).
Student analytic samples
Grade 2–8 ELs with complete data in the baseline year (2009–2010) comprised the analytic sample (see Table 1). We selected this grade range because CSTs began in Grade 2, reclassification rates are flat until Grade 3 (Flores et al., 2009), and the longitudinal design captured the critical school transitions (elementary to middle school; middle school to high school). Aside from the higher percentage of Hmong speakers in District 2, both samples were similar to nationwide and statewide EL trends: The vast majority was poor and U.S. born, and secondary ELs were overwhelmingly in long-term status (see Table 2).
Student, School, and Staff Samples in Districts 1 and 2 in Years 1, 2, and 3
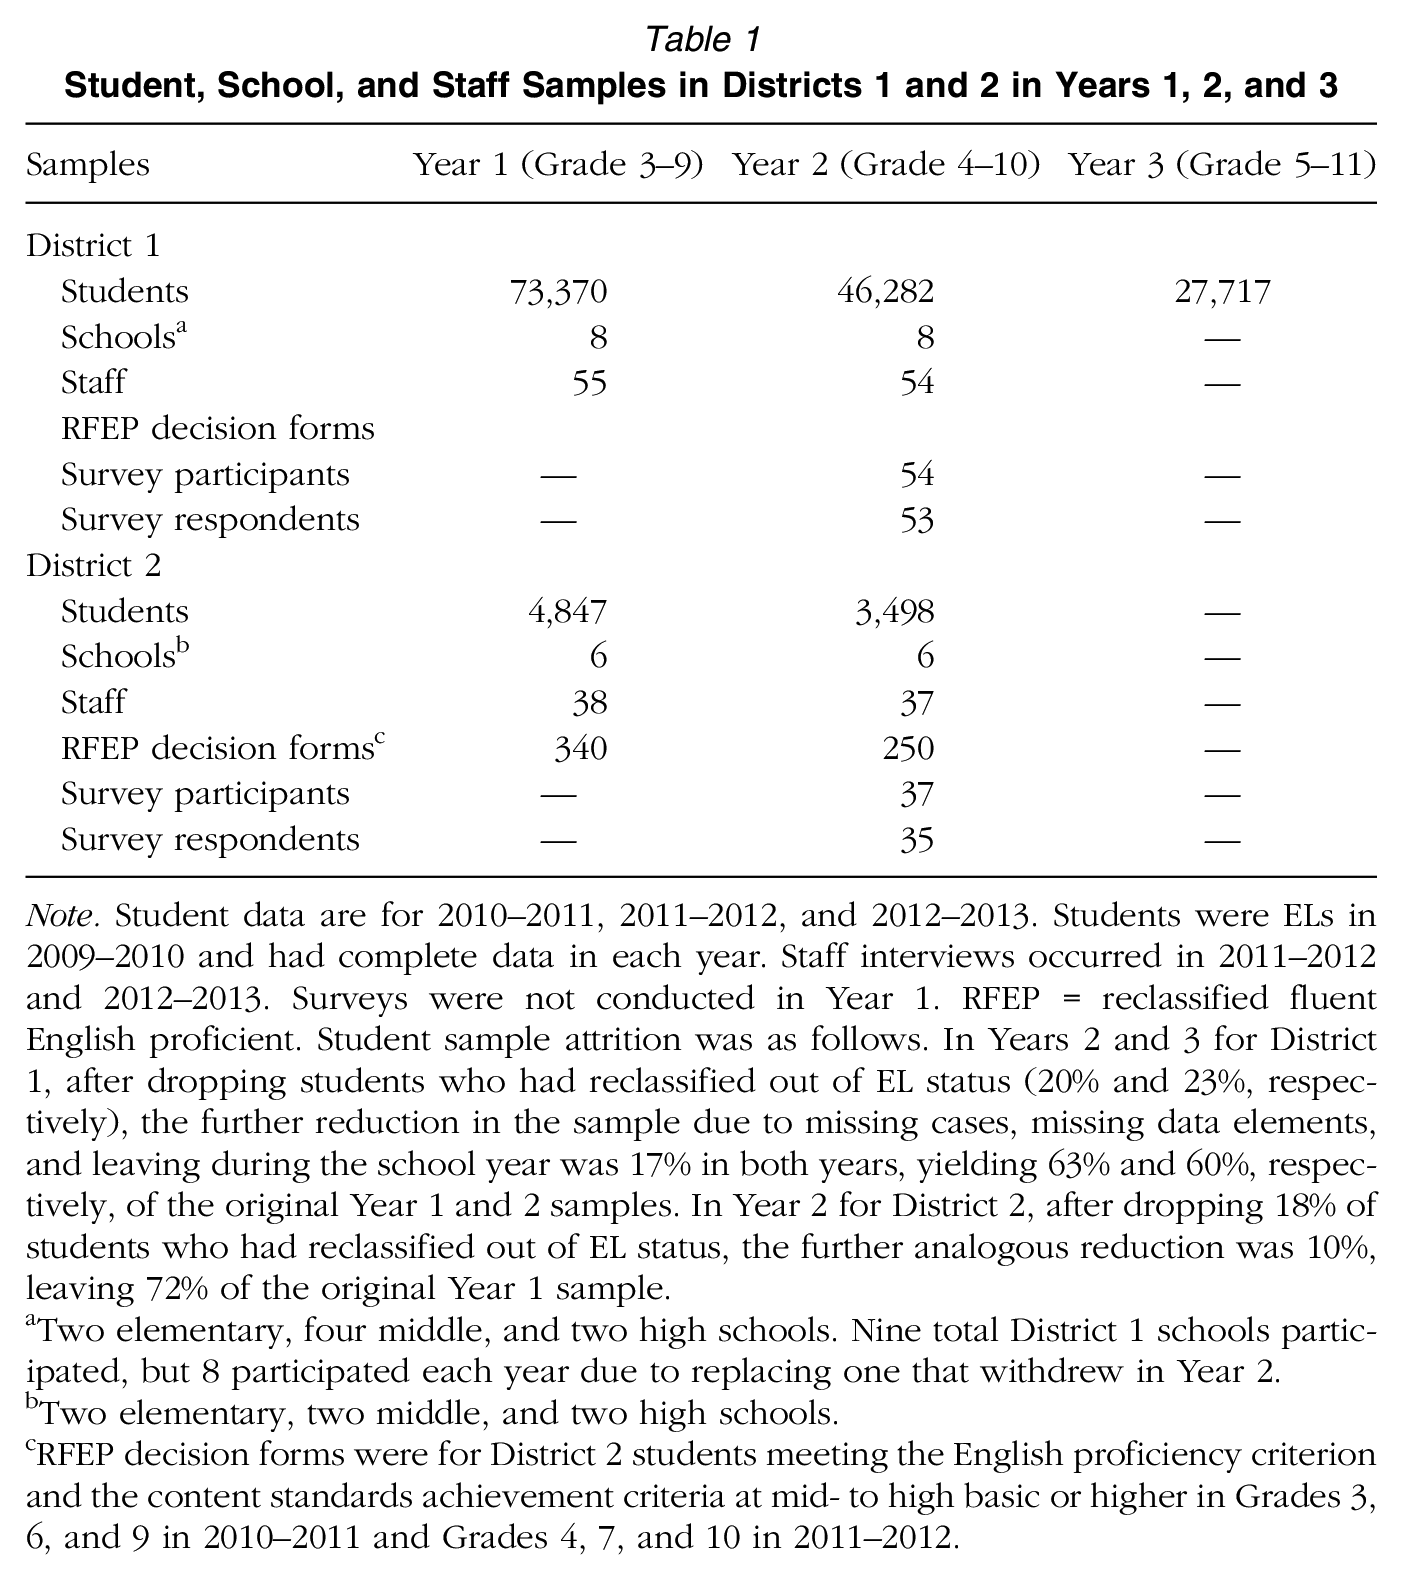
Note. Student data are for 2010–2011, 2011–2012, and 2012–2013. Students were ELs in 2009–2010 and had complete data in each year. Staff interviews occurred in 2011–2012 and 2012–2013. Surveys were not conducted in Year 1. RFEP = reclassified fluent English proficient. Student sample attrition was as follows. In Years 2 and 3 for District 1, after dropping students who had reclassified out of EL status (20% and 23%, respectively), the further reduction in the sample due to missing cases, missing data elements, and leaving during the school year was 17% in both years, yielding 63% and 60%, respectively, of the original Year 1 and 2 samples. In Year 2 for District 2, after dropping 18% of students who had reclassified out of EL status, the further analogous reduction was 10%, leaving 72% of the original Year 1 sample.
Two elementary, four middle, and two high schools. Nine total District 1 schools participated, but 8 participated each year due to replacing one that withdrew in Year 2.
Two elementary, two middle, and two high schools.
RFEP decision forms were for District 2 students meeting the English proficiency criterion and the content standards achievement criteria at mid- to high basic or higher in Grades 3, 6, and 9 in 2010–2011 and Grades 4, 7, and 10 in 2011–2012.
Demographic Characteristics of Analytic Samples of English Learners in Districts 1 and 2
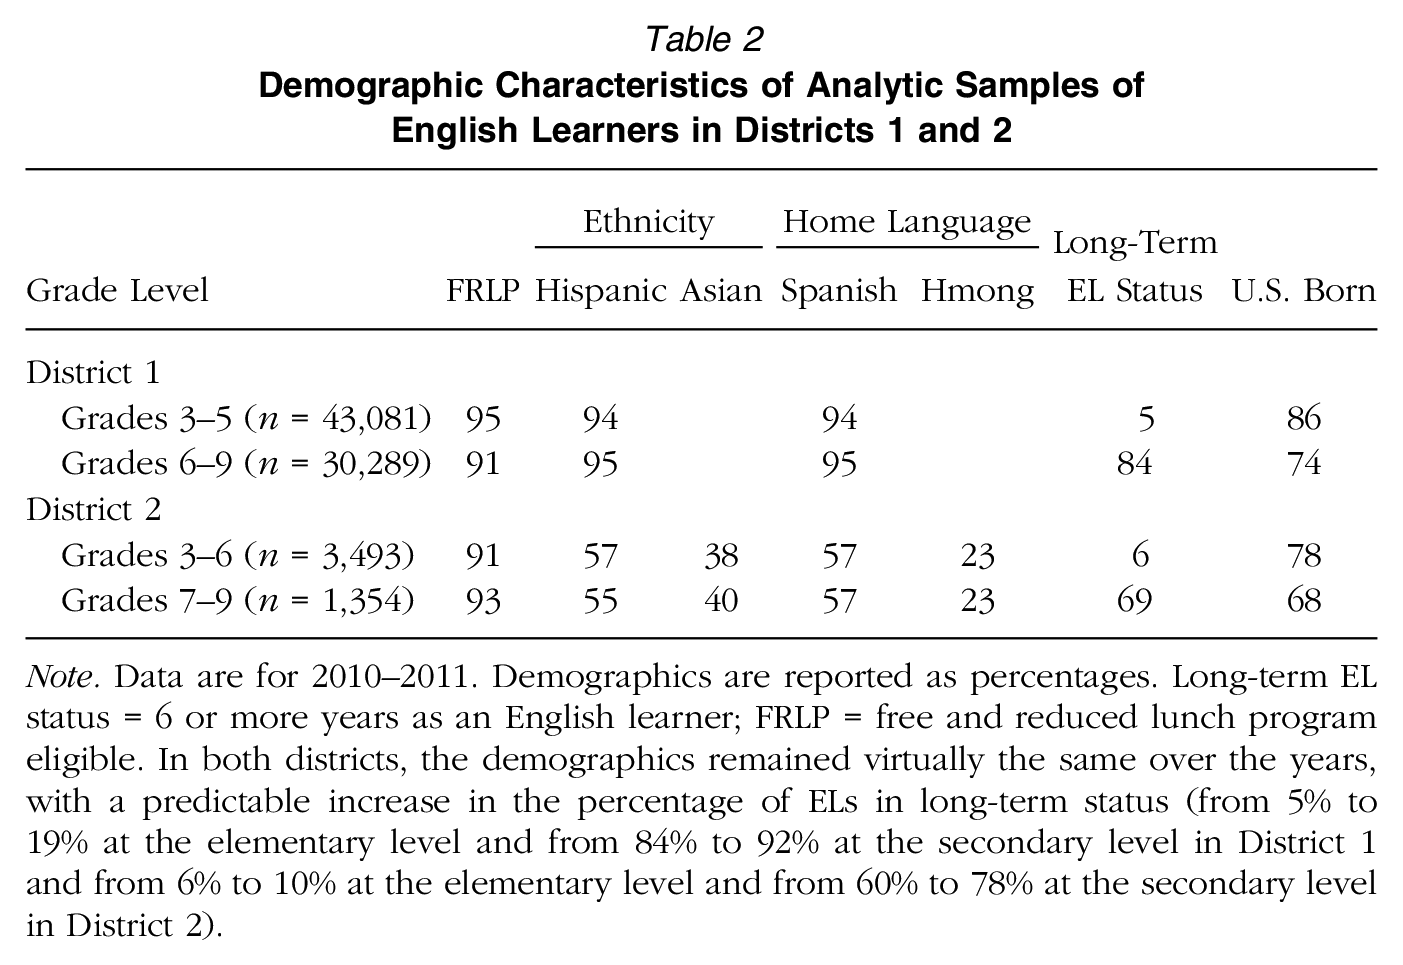
Note. Data are for 2010–2011. Demographics are reported as percentages. Long-term EL status = 6 or more years as an English learner; FRLP = free and reduced lunch program eligible. In both districts, the demographics remained virtually the same over the years, with a predictable increase in the percentage of ELs in long-term status (from 5% to 19% at the elementary level and from 84% to 92% at the secondary level in District 1 and from 6% to 10% at the elementary level and from 60% to 78% at the secondary level in District 2).
School samples for interviews
To study policies and practices where most ELs were enrolled and where EL subgroup outcome data were available, we restricted the pool to schools with greater than 10% ELs and more than 100 ELs. This strategy yielded a target pool containing 94% of District 1 ELs and 85% of District 2 ELs. We excluded charter schools due to lack of data. To select four elementary and four middle schools in each district, we stratified by reclassification rate (high/low) and EL-Academic Performance Index (EL-API) (high/low) (see CDE, 2015b, for an explication of this school performance measure), within school level (elementary, middle, and high school). To select two high schools in each district, we stratified by EL-API (high/low). Within school level for each stratification factor, we defined high as the highest of the state and two district medians and similarly defined low as the lowest of the three medians (available from the first author). This approach avoided a crossover effect in high/low categorization (e.g., high in one district is low in the other). We drew random samples for each cell. Of 11 invited District 1 schools, 9 total participated and 6 of 10 District 2 schools did so.
Staff samples for interviews and surveys
In both districts, we interviewed two to four district administrators and program coordinators who were experienced with ELs (10 to 19 years) and involved in EL policy development and implementation and/or accountability. With the exception of District 1 administrators in Year 1, these staff tended to be recent to their positions (1 to 2 years), corresponding with implementation of new EL Master Plans. We adopted districts’ protocols for contacting principals, soliciting participation, and arranging site visits. At each school, we interviewed six to eight staff once yearly: the principal or academic vice principal, the English language coordinator (ELC) or representative (ELR), four teachers, and occasionally instructional coaches and Title 3 coordinators (see Table 1 for staff sample sizes). Both districts permitted direct contact with teachers only during the interview and after for survey completion follow-up. Therefore, principals or ELCs facilitated site visits and selected teachers for interviews, based on the characteristics we were targeting: Elementary teachers typically taught multiple subjects and ELD to Grade 3-5 ELs (across years, in District 1 three did not teach ELD and five taught Grade 2 or lower; in District 2, all taught ELD and two taught Grade 2 or lower). At the secondary level, we interviewed primarily ELD and sheltered core content teachers because EL curricular placement was in these courses. Across years, secondary teachers were fairly evenly distributed among sheltered English, math, and science (71% total in each district). Another 20% in District 1 and 26% in District 2 taught ELD or both ELD and English. School staff had been in their positions 6 to 13 years and had worked with ELs for 10 to 18 years (detailed staff demographics are available from the first author). For continuity, we endeavored to interview the same staff across years, although it was not always possible. The same participants comprised interview and survey samples in Year 2.
Student Data
Each fall districts provided student demographics, performances, and language status, including year of U.S. school entry. Through 2012–2013, CST administration occurred in spring with scores reported in August. Annual CELDT administration occurred July through October with scores reported in late January to early February (CDE, 2015a). CST scale scores ranged from 150 to 600; 300–349 = basic; 350 = proficient. CELDT performance included overall score, domain subscores (listening, speaking, reading, and writing), and ELP level (beginning, early intermediate, intermediate, early advanced, or advanced). The criterion for proficiency is scoring at early advanced or advanced overall with no domain subscore below intermediate. District 1 ELA marks’ range was 1–4 and A–F for elementary and secondary ELs, respectively.
Reclassification Decision Forms
Yearly, District 2 produced and sent to schools reclassification forms only for ELs meeting the ELP criterion and the CST criteria at mid- to high basic or higher. District pre-populated data included (a) demographics, (b) CELDT proficiency level overall and for each subdomain, and (c) CST scores. School staff ostensibly input the following: (a) CEA scores for ELs scoring mid- to high basic on CSTs (because they were not recorded in administrative data, decision forms contained the only available CEA data, providing a view of their use); (b) teacher participation indicating (yes/no) whether the student could “complete grade-level coursework without the need for additional ELD and/or sheltered content instruction”; (c) school reclassification recommendation/decision; (d) comments; (e) date and mode of parent consultation/opinion (meeting, phone call, letter); and (f) teacher, resource teacher, principal, and parent signatures. District staff ostensibly reviewed completed forms, and their signatures signified accurate implementation and approval. Thus, the forms provided a close-up window into the reclassification process, participants, and outcome. For 2 years, we received completed forms for the Grade 3, 6, and 9 cohorts.
EL Policy Documents and Staff Interviews and Surveys
Annually, we developed/revised policy document, interview, and survey queries, driven by a common set of analytic categories. For example, reclassification criteria and staff roles in reclassification decisions were categories probed and analyzed across these data sources. We began by creating and applying a master set of queries to policy documents and analyzing reclassification decision forms. We used the policy and implementation knowledge gained to tailor interviews for district and school staff at different levels (e.g., elementary, secondary) and in different roles (e.g., administrator, teacher). Piloting in local districts followed, along with revisions. Finally, for more in-depth understanding of policies and implementation, we interviewed district staff first, wrote debriefings summarizing responses for each analytic category, and further revised school staff protocols.
Interviews (60–90 minutes for nonteaching staff; 50 minutes for teachers) began with solicitation of demographics, roles, responsibilities, and a brief school description (school staff). Interviews and survey queries focused on (a) reclassification policies, processes, criteria, timing, and decision making (e.g., Administrator/ELC: “If you are familiar, can you describe the reclassification process, its timing, the criteria used, and how eligible students are identified?”); (b) extent of staff, student, and parent participation and knowledge of EL status; reclassification criteria and processes; and curricular placement consequences of EL status (e.g., Teacher: “To what extent are you aware of the reclassification process and what role, if any, do you play?”); and (c) other possible impediments or facilitators (e.g., District 2, All: “For students who meet the CELDT proficiency criterion and the CST-ELA and CST-Math at proficient or above, what factors, if any, impede reclassification?”). Year 1 staff reports spurred further questions and working hypotheses, which drove Year 2 interview protocol revisions and further piloting. Additional areas probed in Year 2 included (a) districts’ rationales for reclassification criteria and (b) school staff roles in reclassification decisions. Interviews occurred in winter and spring of Year 1 and late fall of Year 2. They were audiotaped and transcribed. Each year, District 2 participants received a $50 gift card. District 1 did not permit such compensation.
To increase efficiency and systematic responses to topics staff had raised in Year 1, we developed and administered in Year 2 a 25-minute, paper-and-pencil survey (97% response rate across districts). Staff provided write-in information (demographics) and Likert ratings (strongly disagree [1] to strongly agree [4]) on topics such as the role of teachers in reclassification decisions (e.g., District 1: “A student meeting all criteria should be reclassified, even when the teacher recommends against it.”). No opinion and Not applicable to my role were also options. Across years, six researchers collected interview and survey data.
Data Analysis
Analyses of administrative data
Each year we analyzed each district’s data separately and, to match policy, adopted the stipulation that students meet all criteria in alignment. To answer Research Question (RQ) 1, we calculated the percentage of students meeting criteria singly and in combination. To answer RQ2, we calculated the percentage reclassified and not reclassified for ELs meeting all criteria in each district and the subset of ELs meeting at least CELDT proficiency and the CSTs at mid- to high basic in District 2.
Analyses of reclassification decision forms
One of the ways we identified factors facilitating or impeding reclassification (RQ3) was by analyzing District 2 forms of ELs who scored CELDT proficient and either mid- to high basic or proficient or higher on the CSTs. Disaggregating by school and CST performance level, we calculated the number of ELs school staff recommended to (a) reclassify and (b) not reclassify; we also tallied the percentage of ELs with (c) CEA scores reported and (d) parent signatures.
Analyses of policy documents, staff interviews, and surveys
We summarized answers to each policy document query, analyzing them for clarity, and as noted above, used the knowledge gained for developing interview protocols. For each survey item, we collapsed across strongly disagree and disagree responses to report the percentage of staff disagreeing and, similarly, across agree and strongly agree to report the percentage of staff agreeing. Because patterns of responses within school levels were similar across teaching and nonteaching staff, we aggregated their responses and note when they varied.
We conducted descriptive analysis of interview data as follows. We developed a debriefing guide that mapped the interview questions onto our analytic categories, which functioned as a template for writing a description of findings for each school (e.g., Teacher Role in Reclassification: For students meeting criteria, what is staffs’ philosophy and rationale regarding the role of teachers and assessments in reclassification decisions?). For each analytic category, researchers read across all interview transcripts at a school, making systematic notes regarding trends, anchoring synthetic and summary statements in evidence and exemplary quotes, and noting exceptions. Each year, we also developed a themes document: After completing school debriefings, researchers recorded emergent themes for the corresponding analytic categories. For 6 months researchers debriefed bi-weekly, sharing emerging themes and contesting with confirming and disconfirming evidence until reaching consensus. We iterated across all schools and then used the themes to summarize findings within each district.
Triangulation and comparative analyses
Quantitative data revealed patterns of reclassifying and not reclassifying ELs meeting all criteria in each district and, for a subset in District 2, ELs meeting at least standardized-test criteria. To identify facilitating and impeding factors, we triangulated findings across policy documents, interviews, surveys, and reclassification forms (District 2 only) within districts and school levels (Miles & Huberman, 1984). For example, for the role of teachers in reclassification decisions, we compared consistency of interview themes with survey responses and with patterns of teacher participation in the reclassification decision forms. Comparative analyses across districts helped us discern whether distinct policies and practices co-occurred with distinct reclassification patterns.
Results
Reclassification Criteria Rationales, Windows, Assessments, and Alignment
District 1
According to staff, District 1 selected criteria and performance thresholds based on state guidelines, state test and classroom performances indicating readiness, and the average performance of its general student population. Hence it set the CST-ELA criterion at basic. ELA marks provided teacher input on curriculum mastery. The parental notification letter complied with state guidelines without delaying reclassification.
By providing five reclassification windows for elementary and four for secondary students, District 1 somewhat ameliorated the challenge of meeting criteria in alignment. However, CELDT and CST scores straddled 2 academic years and were separated by 7 to 9 months, and ELA grades were on yet another schedule, making timing challenging (see Figure 1). Figure 1 illustrates that if in the first reclassification window an elementary student met the spring 2010 CST-ELA and the spring 2010 Marking Period 3 ELA grades but not the fall 2009 CELDT, then to be eligible in January 2011, she would need to meet the fall 2010 CELDT criterion. If she indeed met the fall 2010 CELDT criterion, but her Marking Period 1 ELA grades dropped, she would remain ineligible. She would be able to reclassify, if her grades improved in the next two marking periods; if not, she would remain EL for at least another year. If in the next testing periods she failed to meet all criteria in alignment, EL status would be prolonged further.
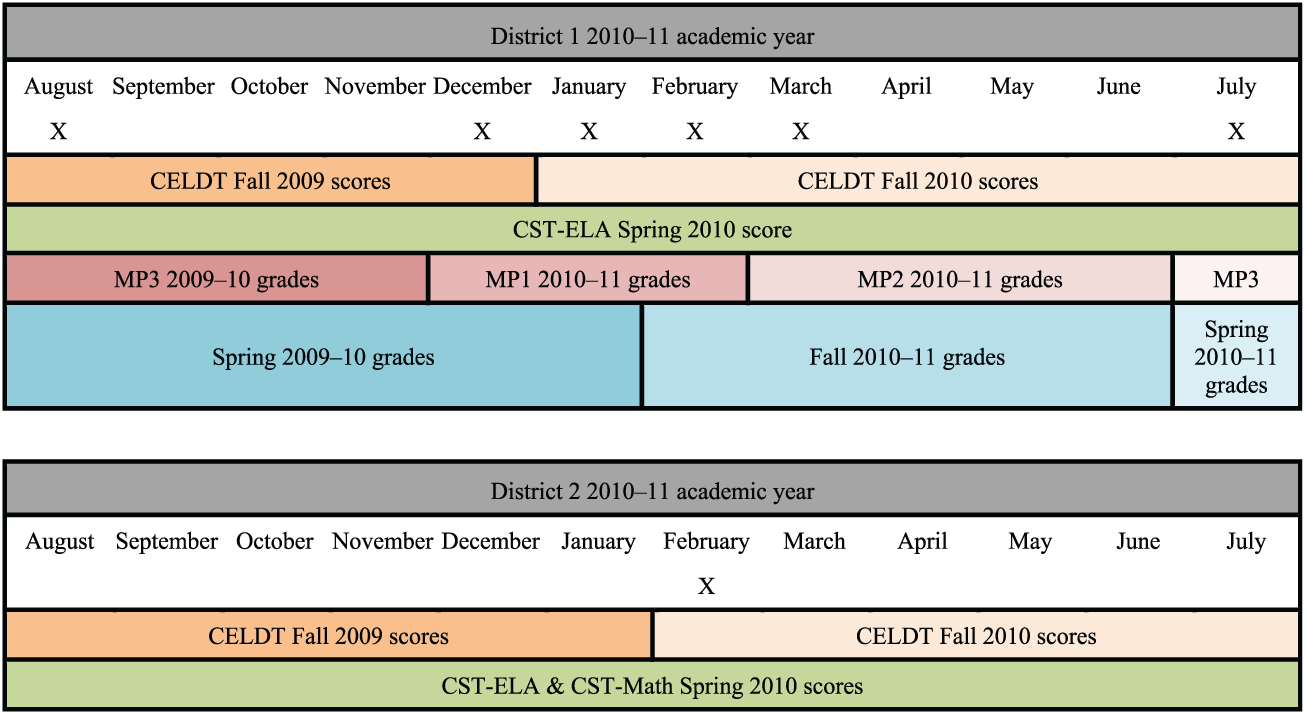
Alignment of reclassification windows and assessments.
District 2
As noted above, ELs met all criteria when they scored proficient on the CELDT, the CST-ELA, and the CST-Math (CST-Math was dropped in Year 2). For these ELs, CEAs were neither required nor intended for use because their ELP and ELA proficiency demonstrated their ability to function in the mainstream: “350 [proficient] is what we are looking for … We reclassify … That’s why the guidelines for those scores are proficient, not basic … They’re [CEAs] not necessary.” Senior staff asserted that not reclassifying such ELs should be rare and required strong justification and evidence, including student work and review by multiple staff, including one language expert: “[We] need to have some very strong evidence … work sample that multiple eyes have been on, at least one person with expertise in language … that shows this [proficient] score was not reflective of this kid’s abilities … not just one [teacher] ‘deciding.’” For ELs we defined as meeting at least standardized-test criteria, senior staff clarified that because these CELDT-proficient ELs with mid- to high basic CSTs had not demonstrated ELA proficiency, CEAs were required for positive and negative decisions: “If they are a little bit below 350, we can use the curriculum embedded assessments to justify that yes they are proficient [or not].” Finally, for both sets of ELs, teacher participation, but not approval, was required and teachers were not to override student performance nor function as decision arbiters: “It’s [teacher participation] … like that confirmation part of the process, not that you could deny or approve either way. It’s just that you were informed, you validate.”
In Year 1, District 2 provided a single opportunity during winter for reclassifying, using the prior spring 2010 CSTs, the fall 2010 CELDT, and ostensibly CEAs for CELDT proficient ELs meeting CST criteria at mid- to high basic (see Figure 1). To comply with state monitors’ requirements, beginning in Year 2 District 2 reclassified in the fall as well.
Despite sharply contrasting criteria and processes, the majority of staff surveyed in both districts agreed that reclassifying signifies readiness for the mainstream (see Table 3).
Survey Responses Regarding School Staff Participation, Philosophy, and Awareness of Reclassification Criteria in Districts 1 and 2 in Year 2
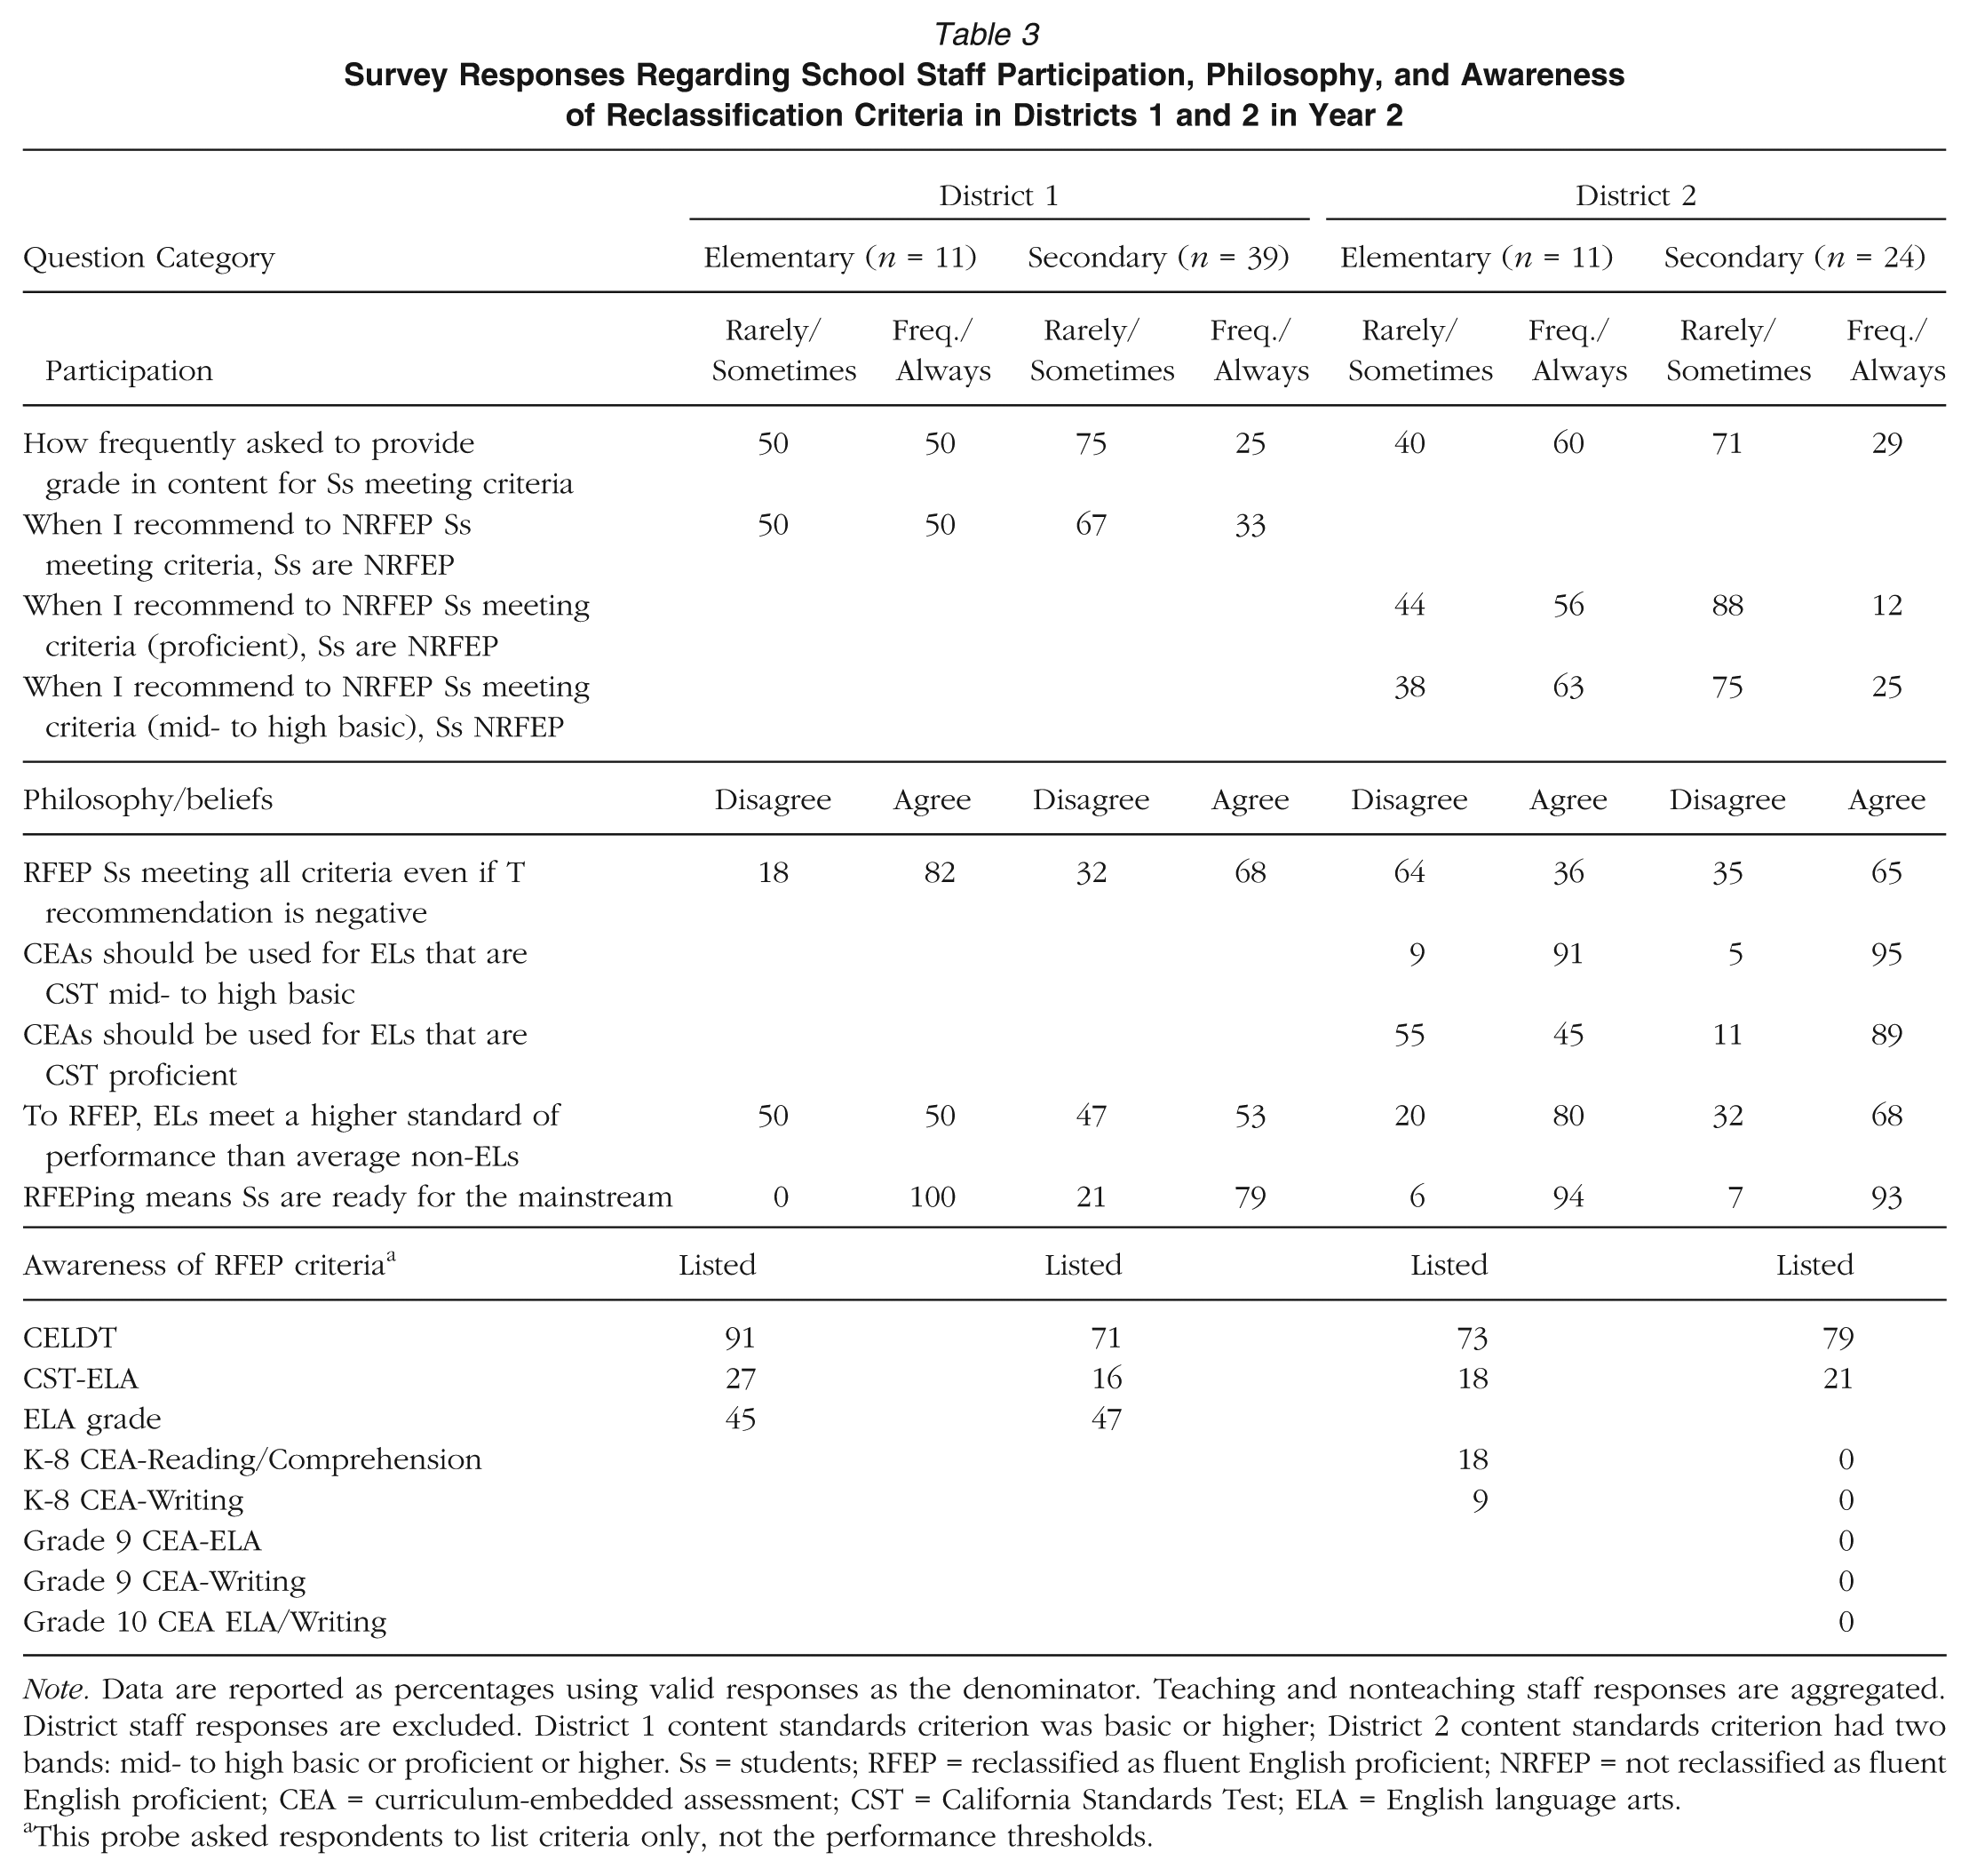
Note. Data are reported as percentages using valid responses as the denominator. Teaching and nonteaching staff responses are aggregated. District staff responses are excluded. District 1 content standards criterion was basic or higher; District 2 content standards criterion had two bands: mid- to high basic or proficient or higher. Ss = students; RFEP = reclassified as fluent English proficient; NRFEP = not reclassified as fluent English proficient; CEA = curriculum-embedded assessment; CST = California Standards Test; ELA = English language arts.
This probe asked respondents to list criteria only, not the performance thresholds.
Meeting Criteria Singly, in Combination, and Reclassifying
As conjectured, linking student data reduced the percentage meeting multiple criteria.
District 1
In Year 1, whereas more than a third of students met the CELDT criterion and roughly two-fifths met the CST-ELA criterion, about a quarter met both (see Table 4). The additional ELA grades criterion resulted in reclassification eligibility for about one-fifth of students. Years 2 and 3 showed a similar pattern. Over time, the percentage of ELs meeting CELDT and ELA grades criteria increased to over one-half and nearly three-quarters, respectively, whereas the percentage meeting the CST-ELA criterion remained stable at about two-fifths. Over 3 years in District 1, ELs meeting all criteria increased from 21% to 26%, a positive trend in the face of increasing sample restriction each year to lower performing students. Likewise, the percentage of ELs reclassified increased from 19% to 25% (see Table 4).
Percentage of English Learners Meeting Criteria and Reclassifying in Districts 1 and 2 in Years 1, 2, and 3
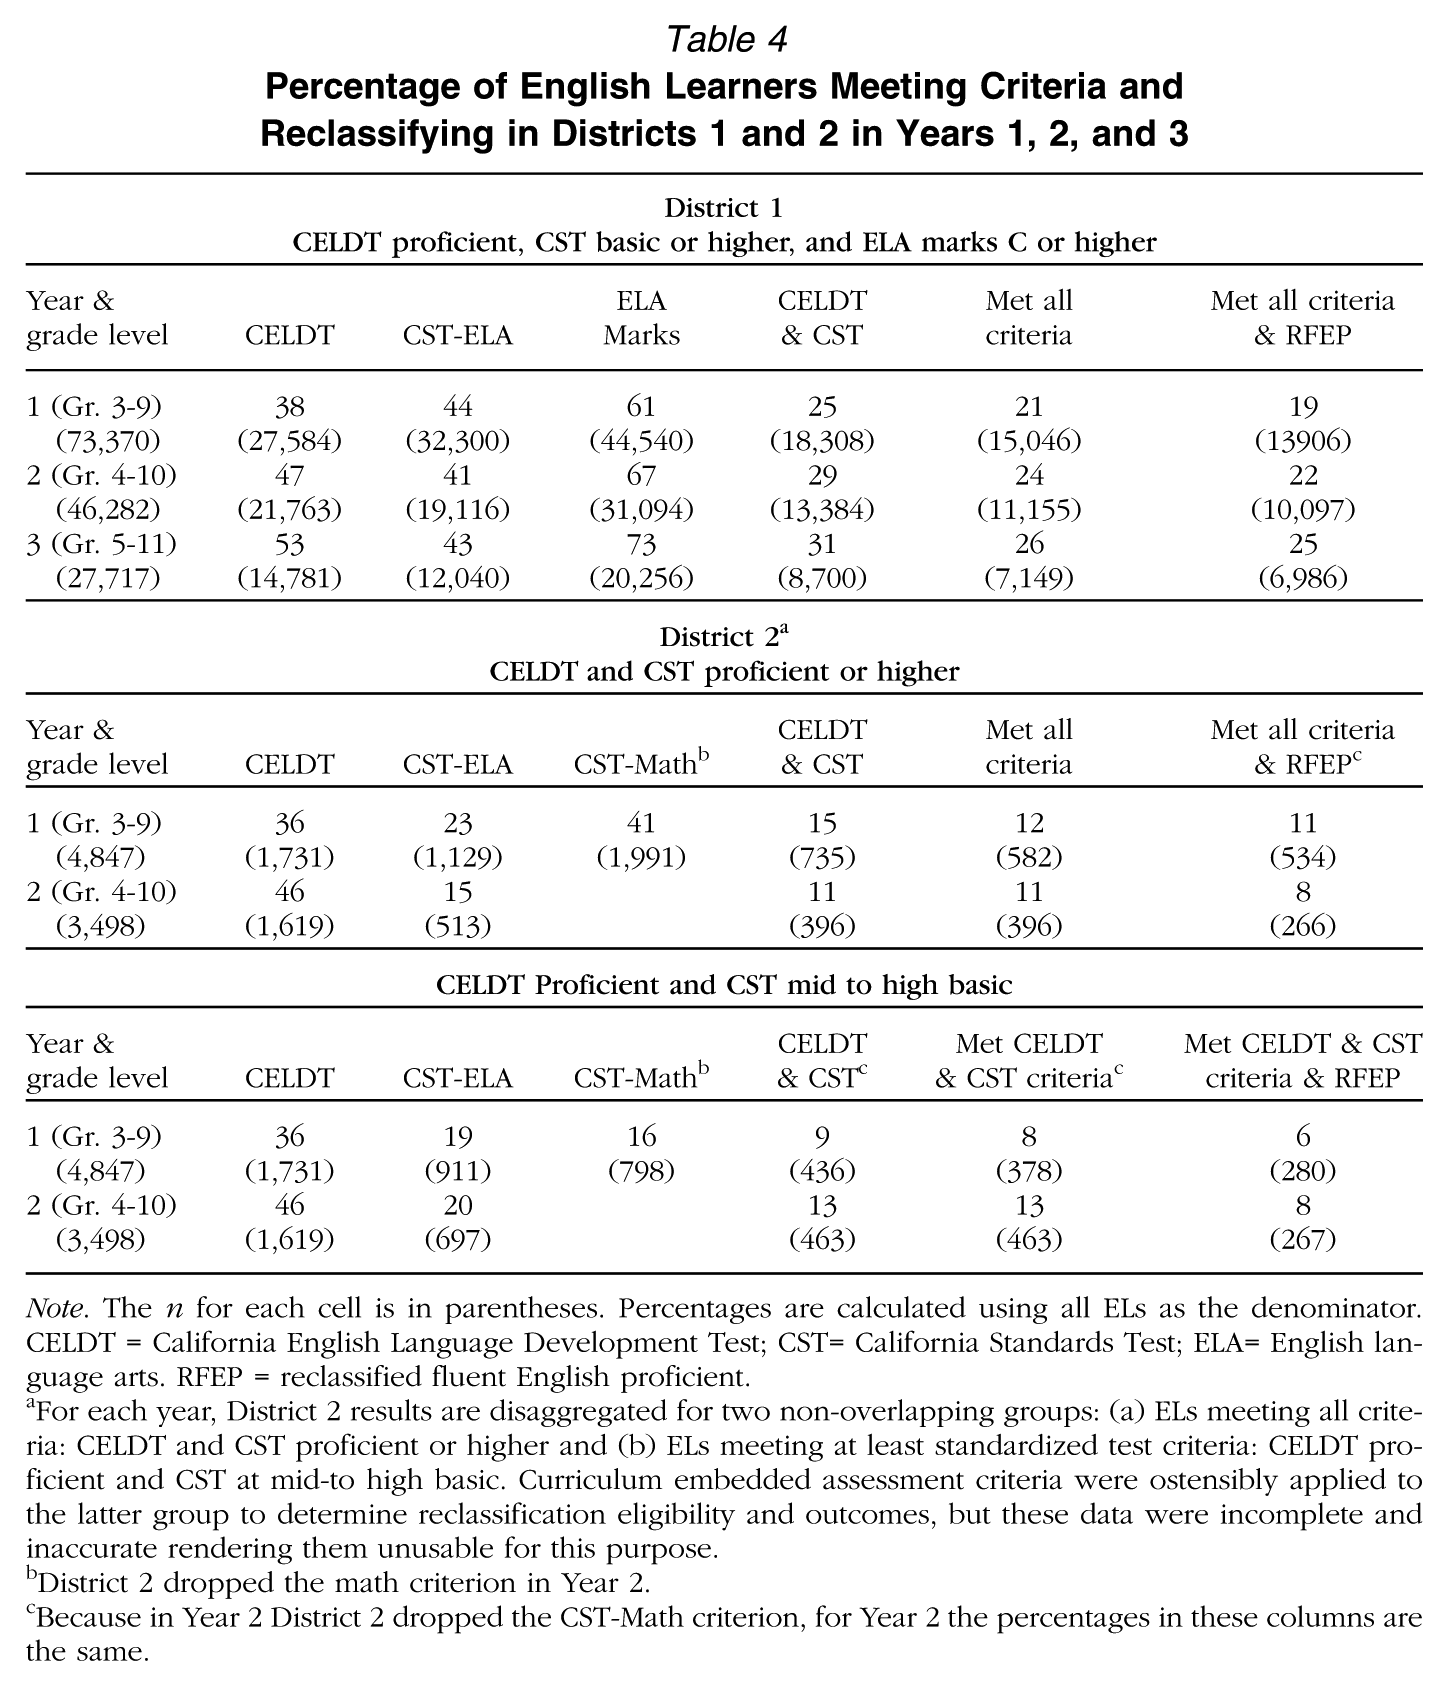
Note. The n for each cell is in parentheses. Percentages are calculated using all ELs as the denominator. CELDT = California English Language Development Test; CST= California Standards Test; ELA= English language arts. RFEP = reclassified fluent English proficient.
For each year, District 2 results are disaggregated for two non-overlapping groups: (a) ELs meeting all criteria: CELDT and CST proficient or higher and (b) ELs meeting at least standardized test criteria: CELDT proficient and CST at mid-to high basic. Curriculum embedded assessment criteria were ostensibly applied to the latter group to determine reclassification eligibility and outcomes, but these data were incomplete and inaccurate rendering them unusable for this purpose.
District 2 dropped the math criterion in Year 2.
Because in Year 2 District 2 dropped the CST-Math criterion, for Year 2 the percentages in these columns are the same.
District 2
We disaggregated results for the two nonoverlapping groups: ELs meeting all criteria (CELDT and CST proficient) and ELs meeting at least standardized-test criteria (CELDT proficient and CST mid- to high basic; see Table 4). CEAs were ostensibly applied to the latter group to determine reclassification eligibility and outcomes, but these data were incomplete and inaccurate, rendering them unusable for this purpose. Because disaggregation splits and truncates the distribution, we compare and contrast findings for the two groups. About a third of ELs met the CELDT criterion in Year 1, increasing to nearly half in Year 2, similar to District 1. In Year 1, more students met CST criteria at proficient versus mid- to high basic: roughly a quarter versus a fifth for the CST-ELA and two fifths versus a sixth for the CST-Math. In Year 2, the pattern reversed: A sixth of students met the CST-ELA at proficient versus a fifth at mid-basic, likely due to a combination of higher performers exiting EL status and increasing test difficulty in Grades 4–10. In both years for both groups, each additional criterion reduced the percentage meeting criteria. Across years, the percentage of ELs meeting all criteria remained nearly the same (12% and 11%), yet the percentage reclassified dropped from 11% to 8%. The percentage of ELs meeting at least standardized-test criteria increased from 8% to 13%, yet the percentage reclassified remained similar at 6% and 8% across years (see Table 4).
Meeting All Criteria, Meeting at Least Standardized-Test Criteria, and Not Reclassifying
The data revealed a discrepancy between the percentage of ELs meeting all criteria and the percentage reclassified, which was greater in District 2 than in District 1 (see Table 5). In District 2, a similar discrepancy occurred for ELs meeting at least all standardized-test criteria.
Percentage of English Learners Meeting All or at Least All Standardized-Test Criteria and, of Those, the Percentage Not Reclassified in Districts 1 and 2 in Years 1 and 2
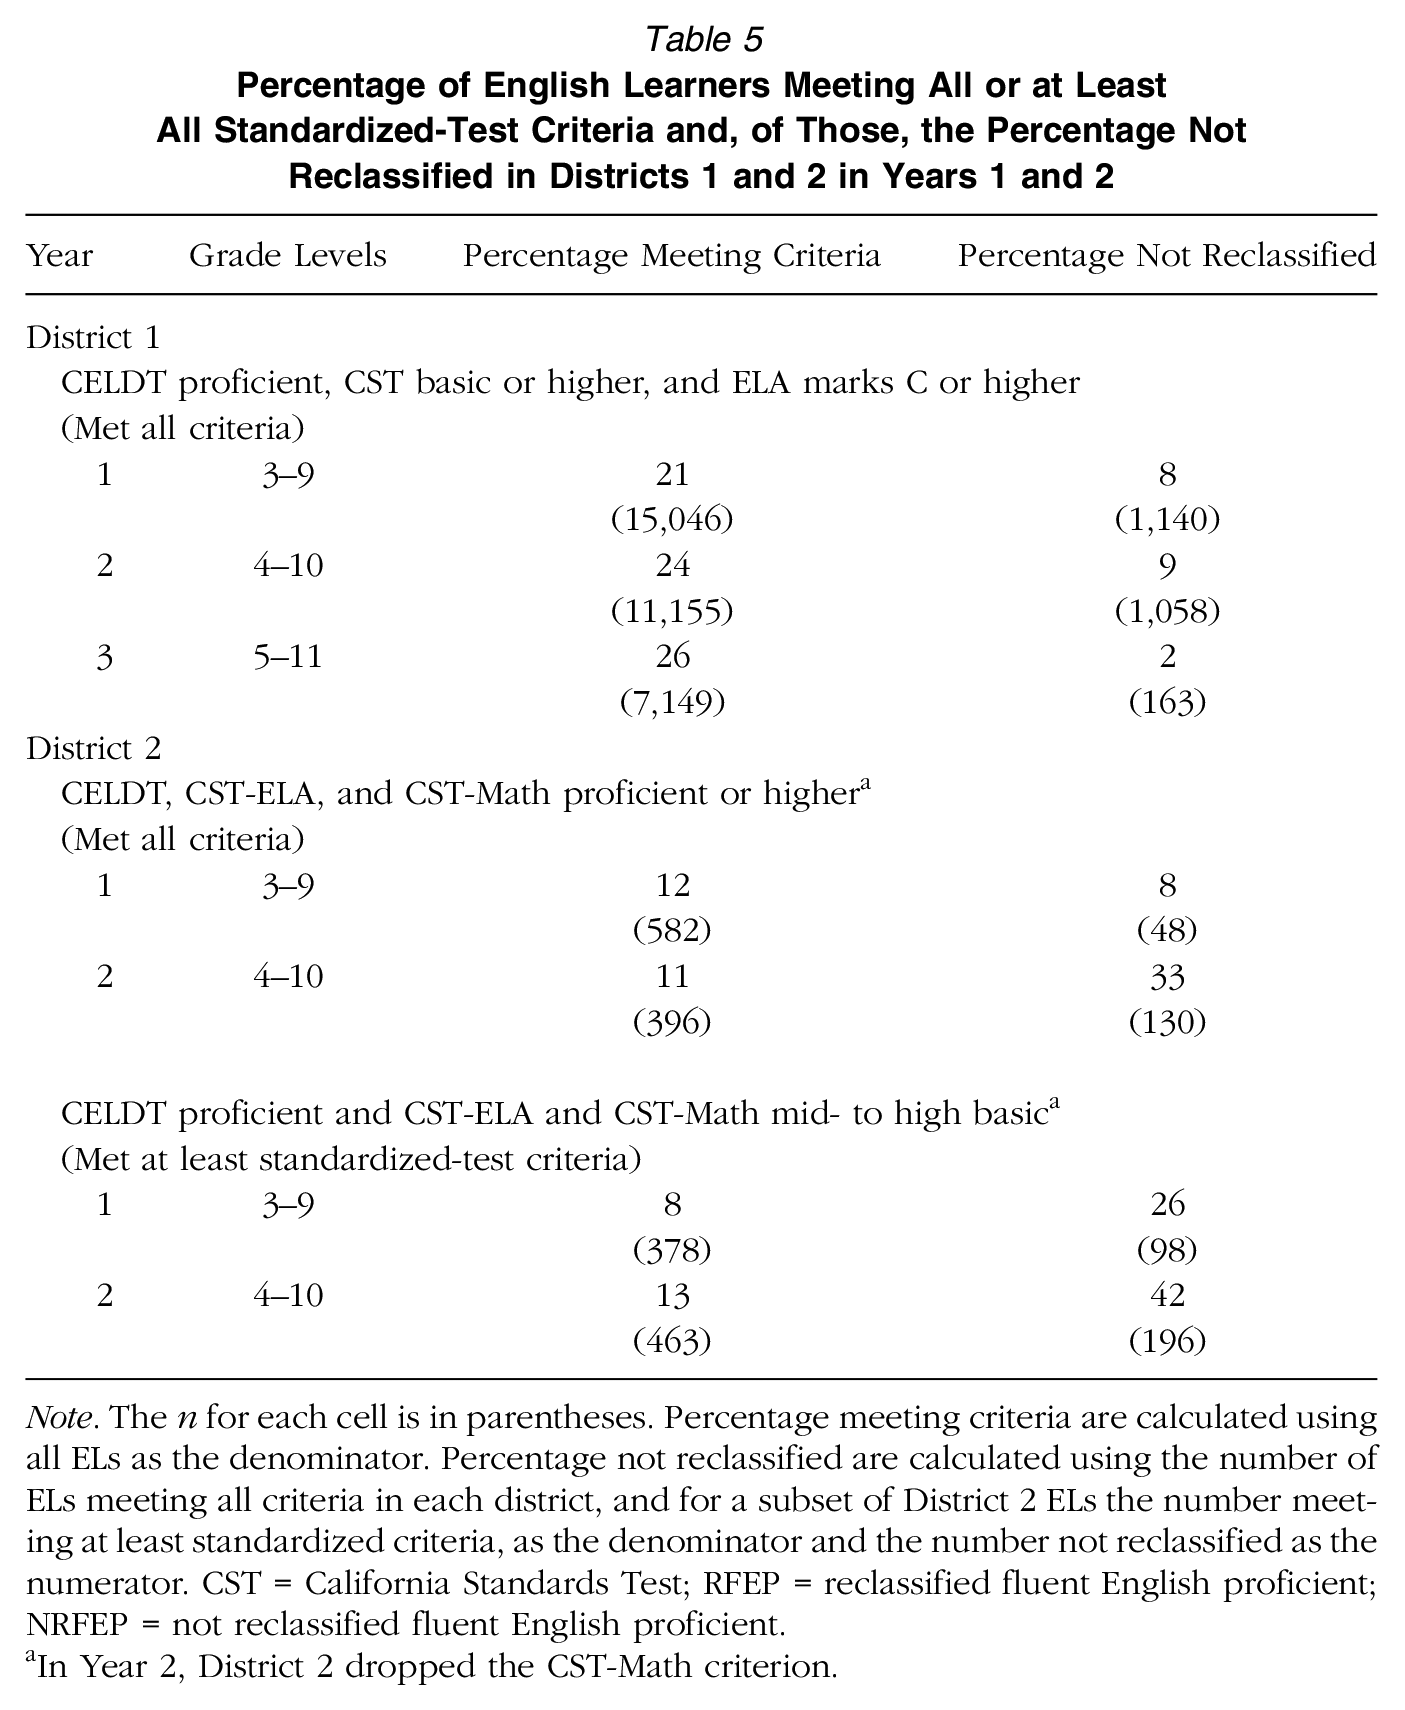
Note. The n for each cell is in parentheses. Percentage meeting criteria are calculated using all ELs as the denominator. Percentage not reclassified are calculated using the number of ELs meeting all criteria in each district, and for a subset of District 2 ELs the number meeting at least standardized criteria, as the denominator and the number not reclassified as the numerator. CST = California Standards Test; RFEP = reclassified fluent English proficient; NRFEP = not reclassified fluent English proficient.
In Year 2, District 2 dropped the CST-Math criterion.
District 1
Rates of not reclassifying ELs meeting all criteria were 8% and 9% in Years 1 and 2 but fell sharply to 2% in Year 3 (see Table 5). Across years, comparisons of reclassified and not reclassified ELs on demographic, performance, and initial language proficiency revealed that those reclassified had higher overall CELDT scores (p < .001) and, among middle school ELs, higher ELA marks (p < .001).
District 2
Of ELs meeting all criteria, 8% in Year 1 and 33% in Year 2 were not reclassified (see Table 5). Those reclassified compared to those not reclassified did not differ in performance but were more likely to be Asian (p < .05), indicating possible ethnic bias. Of ELs meeting at least standardized-test criteria, 26% in Year 1 and 42% in Year 2 were not reclassified (see Table 5). Higher academic GPA (p < .01 and p < .001 in Years 1 and 2, respectively) among those reclassified versus not reclassified was the only difference. (Detailed reclassification results by grade are available from first author.)
Factors Impeding or Facilitating Reclassification
District policy clarification, capacity building, monitoring, and inducements
Patterns of reclassifying and not reclassifying ELs co-occurred with the extent to which districts invested in clarifying policy, capacity building, monitoring, and inducements, all key factors in implementation (Fuhrman & Elmore, 1990; O’Day & Smith, 2016). After completing its new EL Master Plan in 2011–2012, District 1, where rates of not reclassifying ELs meeting all criteria plummeted, invested in these activities (Estrada, Hayes, & Maldonado, 2016). During the transition year (2012–2013), it clarified policy and implementation with a series of memos and bulletins and increased capacity by providing professional development to school administrators and ELCs, furnishing a compact disc for site-level staff professional development. Full implementation of the Master Plan occurred in 2013–2014. Simultaneously, the superintendent created inducements, prioritizing EL outcomes on par with general population outcomes by creating a public chart with historic performance data and targets for improvement over a 3-year period. Goals included improving reclassification rates and ELP progress and reducing ELs in long-term status. District 1 monitored and posted progress on these metrics on its website. In Year 2, to support schools’ efforts further, it began providing data charts to each, profiling different patterns of meeting criteria (e.g., meeting CELDT and CST, but not ELA marks).
In contrast, District 2, where not reclassifying both ELs meeting all criteria and those meeting standardized-test criteria increased over the years, did not invest in these activities. It too had recently completed its EL Master Plan, but no staff reported policy clarification, professional development, or monitoring. On the contrary, district and school EL staff cutbacks increased responsibilities and diminished capacity. In all but one school in Year 1, staff functioned in dual roles as teacher- or assistant principal-EL representative. Moreover, staff at all levels reported a district-wide focus on implementing the Common Core State Standards (CCSS) with little emphasis on implications for ELs. Senior district staff explained, “the specific needs of English learners is not top priority. … The thought is that, if we can get really strong classroom instruction … teachers who can differentiate and identify specific student needs, that will work for all kids.” Regarding monitoring, district staff offered, “There’s not a lot of monitoring at the district level … just CELDT and CST … once a year.”
Reclassification automation, transparency, and monitoring
District 1’s lower rate of not reclassifying co-occurred with a substantially automated reclassification process that was data transparent and lent itself to monitoring. District and school staff consistently described that during each reclassification window school sites accessed district-generated electronic rosters listing ELs meeting CELDT and CST criteria. On site, EL coordinators verified that students had met the ELA grades criterion and then pushed a button in the data system, which changed EL status to reclassified and printed out a parent notification letter for mailing. Administrative data systems containing all pertinent reclassification criteria performance and language status data increased transparency and monitoring capacity. School staff explained district- and school-level monitoring, “… the district has us … on our toes … they have this principal’s portal … so every month we have certain [compliance] areas … reclassification is one of them. … So we have to look at all of them [ELs], but certainly the ones that are ready [met criteria] to go and switch over [reclassify] … we have to … show data that says they’ve moved on [reclassified] … because they’re [district] monitoring.” During summer, District staff were also able to locate and reclassify eligible students who had been missed.
In contrast, District 2’s much higher rates of not reclassifying ELs meeting all criteria, and those meeting at least standardized-test criteria, co-occurred with a complex, labor-intensive reclassification process and a data system that lacked pertinent data (CEAs, teacher/staff input) and hindered monitoring. The Multilingual Department (MD) initiated reclassification by identifying ELs meeting the CELDT and CST criteria and sending forms to schools. School sites were to convene the Reclassification Decision Team (principal, EL representative, teachers, and other support staff) to review students’ performances, apply CEAs if needed, recommend reclassifying or continuing EL status, report the nature of parent participation (meeting attendance or phone call), and obtain wet parent signatures. Schools were to mail completed forms to the MD for final review, signatures, and entry of the decision into the data system.
Findings from all data sources indicated that at any point in the long chain of staff and actions, human error or inaction, lack of monitoring, or excessive burden could prevent reclassification for the two groups of ELs. Senior District 2 staff pointed to lack of monitoring—of district-generated reclassification forms outgoing to schools and of completed forms incoming from schools—as a major source of implementation and reclassification decision discrepancies during the 2 years of study. Senior staff explained: “… nobody … cared to look at it before. It was just trusted that it was done correctly.” For example, these staff discovered that, due to applying the wrong criteria, District 2 had generated only three forms for eligible K–2 ELs, when the correct number was 120. Similarly, staff in 4 of 6 schools reported that requiring wet parent signatures on the forms was overly burdensome and could delay reclassifying and sending in forms for eligible ELs, resulting in continuing EL status from fall to spring or the following year. An EL representative, who in spring had yet to obtain parent signatures for ELs recommended for reclassification in fall, resorted to drastic measures: “I go, ‘You need to get this [parent signature on form] back … [Or] you’ll have lunch detention until we get it.’ That’s how I got it.” In Year 2, of the 382 Grade 3, 6, 9 cohort ELs who met either set of criteria and for whom we were supposed to receive reclassification forms, we received only 260. Reports of lack of district monitoring, errors in applying criteria, and school overburden coincided both with the gap in reclassification forms and the sharp rise in not reclassifying the two groups of ELs in Year 2.
Clarity and staff knowledge of criteria
The extent to which criteria were clear and unambiguous, processes were transparent and fostered accountability, and staff were knowledgeable was associated with policy implementation and reclassification patterns. Staff reports and surveys indicated that—apart from the CELDT—inadequate knowledge of criteria was common across districts, but the issue was more pronounced in District 2 (see Table 3).
In District 1, where rates of reclassifying eligible ELs declined over the years, clearly defined criteria and threshold performances, combined with administrative data transparency and automaticity (discussed above), reduced ambiguity and increased standardization. ELCs, the most knowledgeable staff, were responsible for reclassification. Even so, across Years 1 and 2, staff at one elementary school reported erroneously that ELD portfolio marks was a criterion. District staff speculated that confusion may have arisen due to continuing use of the ELD portfolio as a progress measure. By Year 3, these reports dwindled to zero.
In District 2, inadequate knowledge, coupled with ambiguous criteria, greater staff involvement, and lack of administrative data transparency co-occurred with misapplication of criteria and unstandardized site-specific processes, resulting in high rates of not reclassifying both groups of ELs. Use of two CST performance levels and CEAs fostered ambiguity, exacerbating these errors, including raising the bar and applying additional nonrequired criteria. Staff reports exhibited confusion. For example, among erroneous claims for the CELDT proficiency criterion were that it (a) was “flexible” and (b) required scoring advanced with only one domain subscore at early advanced. Erroneous CST criteria claims included scoring proficient 2 years consecutively. Similarly, staff reports revealed that CEAs (a) were often misapplied to ELs meeting all criteria, (b) were not systematically applied to ELs meeting at least standardized-test criteria, and/or (c) did not match those specified in the reclassification forms. Instead, staff used a variety of content assessments (reading, writing, math), types of assessments (curriculum-based, teacher-made), performance periods (weekly averages, unit tests, grading period), and performance levels. An EL representative’s direction to teachers exemplifies how CEA criteria implementation veered off course: “I ask the teachers, ‘do the best you can … [with] whatever kind of assessments you use (italics added) look at your grade book this … year, and see what percentages the students hit… put down their average score.’”
Echoing staff reports, reclassification forms illustrated criteria ambiguities, staff confusion, and irregularities in application. The form stated that CEAs were required for CELDT proficient and CST mid- to high basic students but not for CELDT and CST proficient students. Yet lack of explicitly prohibiting their use for proficient ELs who met all criteria invited staff interpretation. Among the reclassification forms, for roughly a third of ELs meeting all criteria, school staff erroneously applied CEAs (see Table 6), and the CEAs often deviated from those specified. For ELs meeting at least standardized-test criteria, CEAs were required to substantiate all positive and negative recommendations. Yet for these ELs: CEA substantiation fell far short of 100%, even though we counted any CEA used (see Table 6); and when applied, the CEAs were often not those specified. The lack of CEA uniformity raised concerns about their validity among district staff and a school administrator: “Is the curriculum [CEA] standards based? Is it measuring the same things? Is … one teacher’s score more difficult than another teacher?”
District 2 School Staff Reclassification Recommendation/Decision and Use of Curriculum-Embedded Assessments by Students Meeting All Criteria, or at Least Standardized-Test Criteria
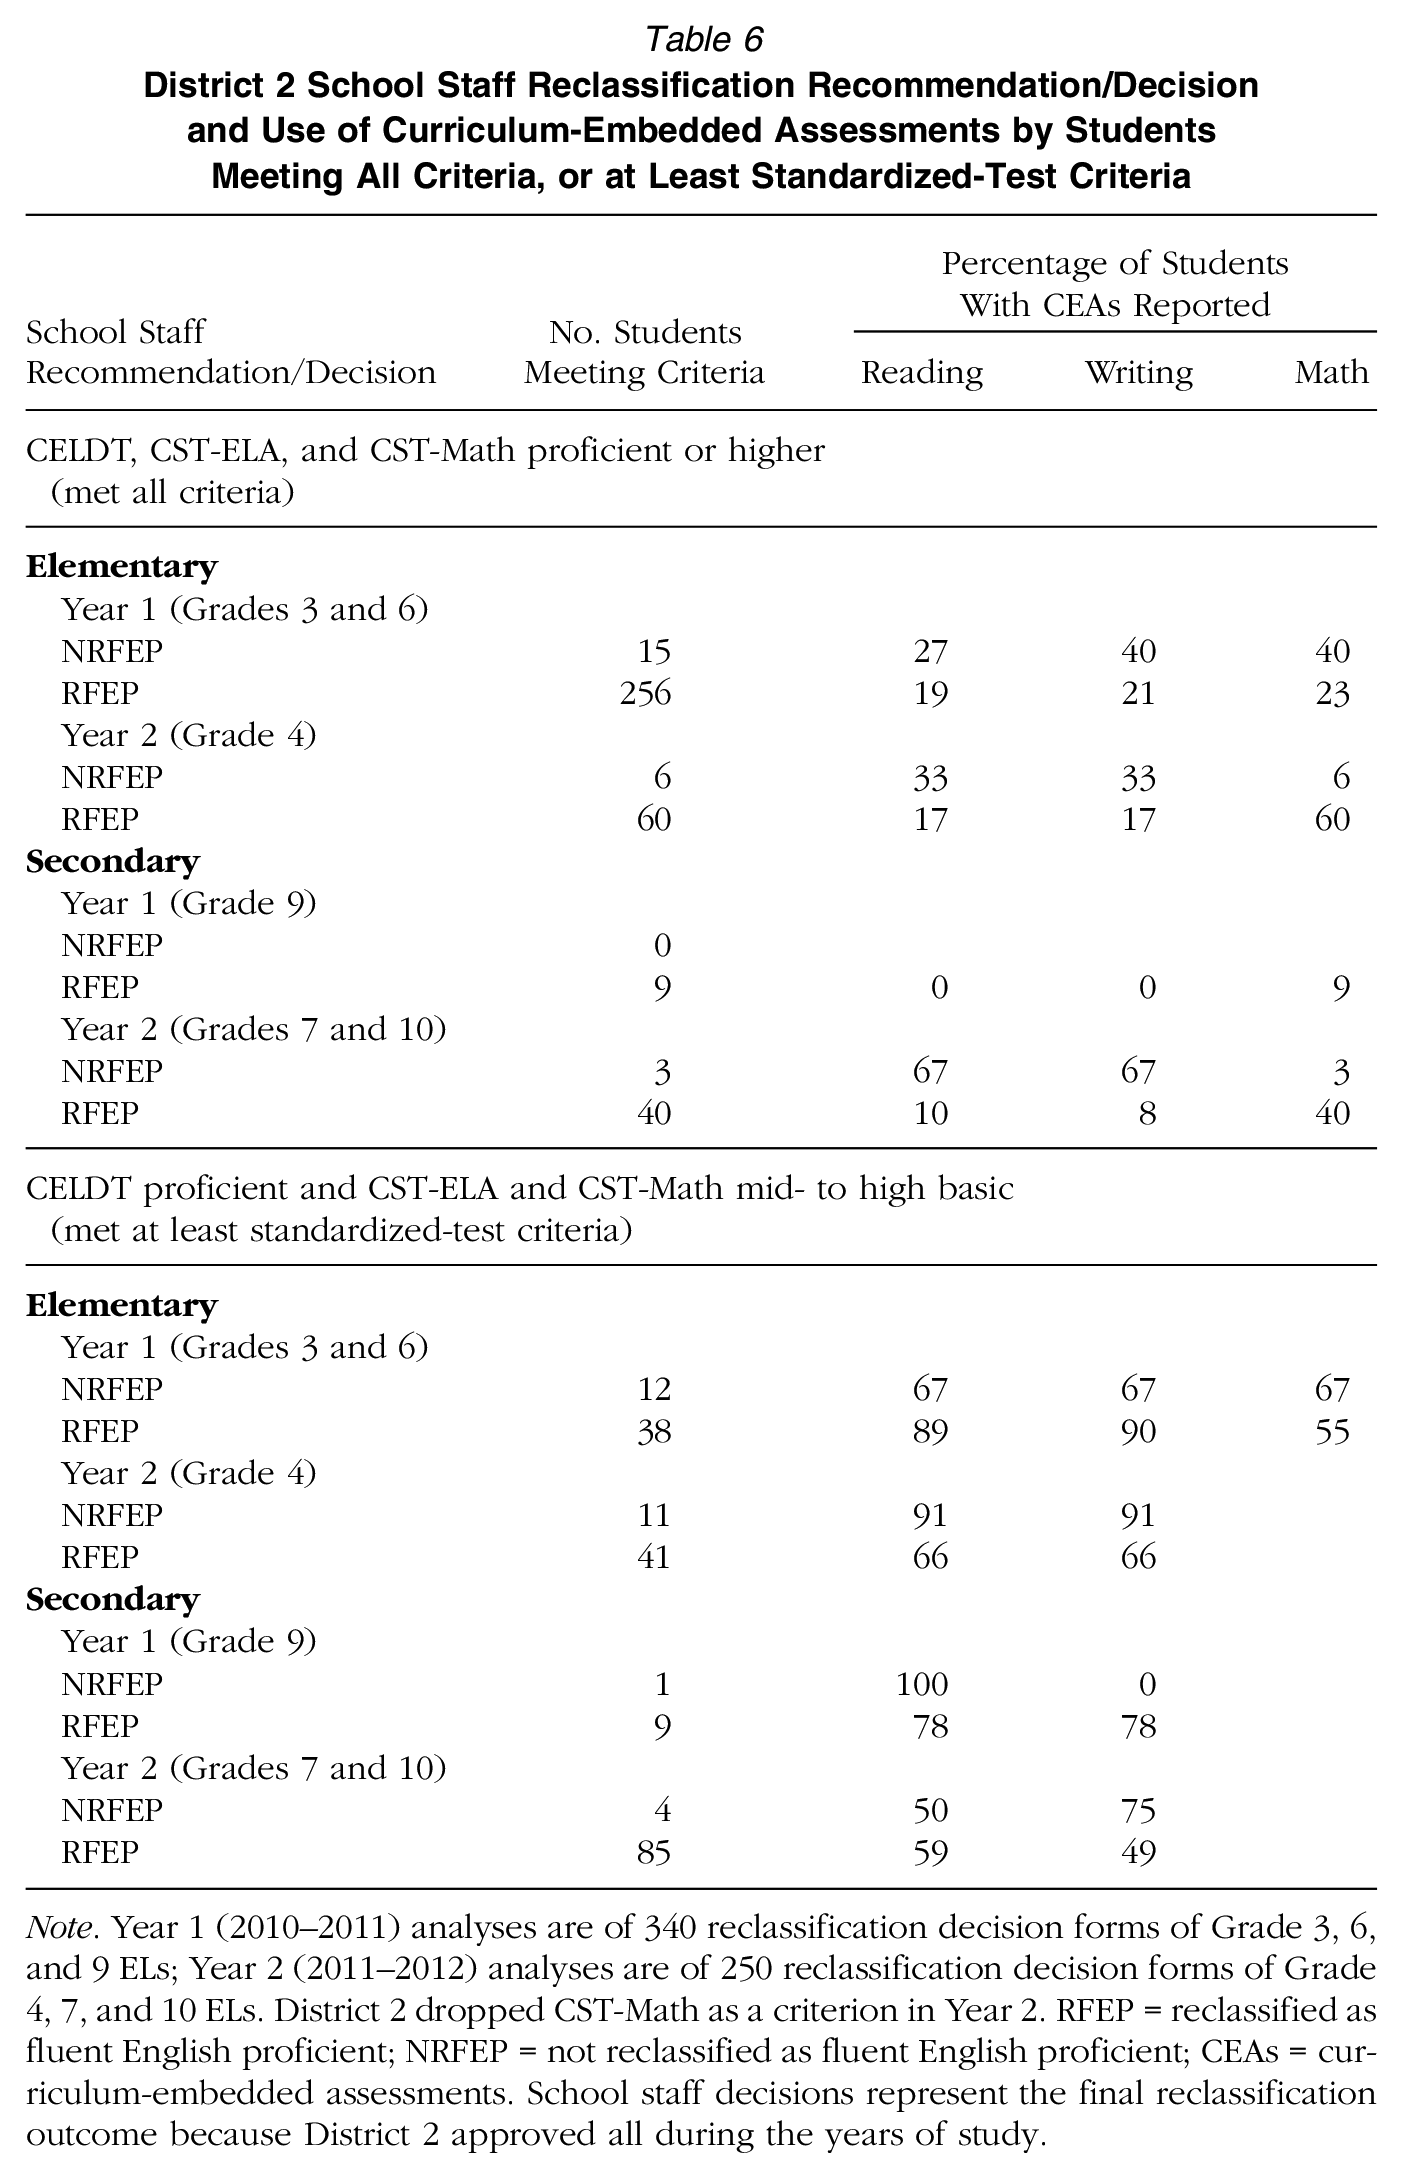
Note. Year 1 (2010–2011) analyses are of 340 reclassification decision forms of Grade 3, 6, and 9 ELs; Year 2 (2011–2012) analyses are of 250 reclassification decision forms of Grade 4, 7, and 10 ELs. District 2 dropped CST-Math as a criterion in Year 2. RFEP = reclassified as fluent English proficient; NRFEP = not reclassified as fluent English proficient; CEAs = curriculum-embedded assessments. School staff decisions represent the final reclassification outcome because District 2 approved all during the years of study.
Consistent with the notion that policies and practices inform staff views, survey responses showed that nearly all staff agreed that CEAs should be used for CELDT proficient students scoring CST mid- to high basic. Regarding CELDT and CST proficient students, who by definition had met all criteria, and for whom CEAs were unintended, nearly all secondary staff agreed that CEAs should be used. Elementary staff opinions were fairly split (see Table 3), but disaggregation showed that the majority of teachers agreed.
Tacit authority at the school level
Findings across districts supported the conjecture that school staff judgments are involved when ELs meeting all and those meeting at least standardized-test criteria are not reclassified. Rates of not reclassifying were associated with the extent to which policy and monitoring practices allowed school staff to exercise tacit authority.
In District 1, where rates of not reclassifying ELs meeting criteria declined to 2% over the 3 years, school staff had no formal role in recommending for or against reclassification; rather, teachers’ input came via ELA grades. In Year 1 only, one elementary school reported not pushing the button to reclassify eligible ELs if staff deemed them “not ready.” Similarly, one teacher in another elementary school reported lowering ELA grades for such students. On the survey, about one half of elementary compared to one-quarter of secondary staff reported frequently or always being asked for a content grade for ELs meeting CELDT and CST-ELA criteria (see Table 3). The lower rate for secondary staff was expected because ELA was the only relevant content area. Interestingly, half of elementary and a third of secondary staff indicated that when they recommended against reclassifying, eligible students were not reclassified.
In contrast, in District 2 where not reclassifying rates were higher and increased sharply, school staff exercised a formal recommendation role. Teachers indicated whether ELs could complete grade-level coursework without additional ELD or sheltered instruction and school staff recommended for or against reclassifying. The reclassification forms showed that, when ELs meeting all criteria were not reclassified, teacher/school staff recommendation not to reclassify trumped CELDT and CST proficient performances, preventing reclassification. This phenomenon included CELDT-proficient ELs who scored advanced on CSTs. Moreover, none of the forms provided the evidence senior district staff indicated was necessary for a negative school staff recommendation to prevail. When ELs meeting at least standardized criteria were not reclassified, the forms also showed that teacher/school staff recommendation prevented reclassification in all instances regardless of whether CEAs (a) substantiated not meeting criteria, (b) substantiated meeting criteria, (c) deviated from the specific CEAs, or (d) were missing. In the latter two cases, neither school or district staff nor researchers could determine whether these ELs met all criteria. Yet school recommendations were the final outcome for both sets of ELs.
In Year 2, all but one District 2 elementary teacher reported recommending continuing EL status for some students meeting all criteria. A single secondary teacher reported doing so, basing it solely on in-class performance, without knowing the student’s CELDT or CST scores. Survey responses indicated that about three-fifths of elementary compared to a little more than one-quarter of secondary staff were frequently or always asked for a content area grade for students meeting CELDT and CST-ELA criteria. Associated with their greater participation, for both ELs meeting all and for ELs meeting at least standardized-test criteria, a majority of elementary staff indicated that when they recommended against reclassifying, students were not reclassified, whereas a minority of secondary staff did so (see Table 3).
Elementary teacher rationales for not reclassifying students meeting all criteria fell into various categories. Teachers often said ELs would benefit from another year of support; three each cited concerns about in-class ELA and math (not a criterion in Year 2) performance. However, to reclassify, teachers expected ELs to possess “native English speaker skills” in listening, speaking, reading, and writing with few errors—an indication of inadequate understanding of second-language learning (CDE, 2015a; Kibler & Valdes, 2016). A teacher who had recommended not reclassifying a CELDT and CST proficient Grade 3 EL said “… in her writing pieces, lots of details, lots of description in her writing, good vocabulary in her writing, but lots of subject-verb issues, lots of phonemic spelling issues and tense issues. She was making errors.” A second rationale imposed higher than required performance on multiple criteria: “She scored overall advanced on the CELDT [in grade 4] … [but] she was intermediate [in the] reading [subtest]. On the CST, she scored proficient [in grade 3], but … basic in second grade.” A third rationale was that ELs should not reclassify too early: “… second grade is … at a level that hasn’t shown their true colors … You should not reclassify until they’re third grade and above.” Another rationale involved nonacademic factors such as being “off task,” “not showing a lot of effort,” or being a “high performer, but spacey.” One teacher cited school and subgroup accountability concerns: “I think it’s important to not reclassify all of our top language learners because ELs are a subgroup at the school and high performers contribute to the EL-API.” Across years, three staff mentioned that schools received additional funds for ELs. Finally, one principal worried that language needs would be overlooked after reclassifying.
Senior district staff attributed the many irregularities to lack of professional development and monitoring during the years of the study: “The additional piece to [reclassification] would be when the … forms come in, we have to … review them. It doesn’t appear that that was happening. … If I am [currently] getting [a form] where they’re early advanced or advanced on all their subscores on CELDT, and then they have 415 [advanced] for their CST, and teacher recommendation is no, and they have continue EL [status], I’m calling those schools and requesting additional documentation. … 90% of them are just deciding to reclassify, just by … asking for … documentation. They’re saying … ‘I didn’t realize they scored that high’ … I’ve gotten some [advanced] CST in the 400[s] … advanced on the CELDT, and … a note saying that they’re not motivated and don’t complete their work. This is not a motivational … [or] behavioral management tool. This is how we decide the kinds of services that this kid needs.”
Divergent philosophies regarding reclassifying ELs meeting all criteria, the role of teachers, and the validity of state ELP and ELA content standards tests
Divergent staff philosophies appeared to facilitate or impede reclassification for ELs meeting all criteria in both districts. Characterized at the two ends of a continuum as “Reclassifying is urgent” coupled with “teacher as advisor” versus “reclassification can wait” coupled with “teacher as decider,” these philosophies coincided with the extent to which district policy tacitly allowed school staff to withhold reclassification from such ELs and the extent to which that authority was exercised.
In both districts, staff who viewed reclassification as urgent worried about the negative OTL-related academic and social consequences of long-term EL status, including curricular and social isolation beginning in middle school, and in high school, enrollment in courses lacking graduation or 4-year university eligibility credit. Expressing a common concern about remaining in sheltered courses, a staff member said, “The pacing is completely different, and the level of rigor seems to be completely different [than mainstream core courses].” Consequently, according to staff, students fell increasingly behind “… even when they reclassify, they’ll enter a regular English ten classroom, and be behind …”. Describing secondary ELs’ social and language isolation, another staff said, “I don’t want to say segregated, but they traveled in a pack. They were not exposed to the main[stream]. They didn’t really have social skills outside of those [peers].” A related concern was that EL separation meant “not interacting with non-ELs and higher achieving peers who could push them academically.”
Academically, without the success reclassification signifies, these staff asserted that long-term EL status led to stigmatization by staff and peers alike and negative EL academic self-efficacy. One staff reported, “They get classes where … expectations are … ‘you’re not as smart as everyone else.’” Another said, “You also have [other] students where they think that [sheltered English] is for stupid people.” Describing how ELs could internalize a sense of failure and stigmatization and give up, a staff shared, “I’m finding … their joy of learning is gone. ‘I’ve always gotten kind of like a fail,’ … so they’ve checked out.”
In both districts, these staff reported reclassifying students as soon as they met criteria. Expressing confidence that independent performances on the CELDT and CSTs were valid indicators of readiness for reclassification and mainstreaming, they reported not allowing negative teacher recommendations to trump this evidence. District 1 secondary staff on this end of the continuum sometimes mainstreamed (and monitored) ELs meeting CELDT and CST criteria, although they could not reclassify them until they also met ELA grades. District 2 secondary staff adhered to policy and reclassified such students, without considering CEAs.
At the other end of the continuum were staff whose philosophy was “reclassification can wait” and “teacher as decider.” Due to their view that teachers’ daily contact and familiarity with ongoing performances was a better measure of EL readiness for the mainstream, they relied on teacher recommendations almost exclusively. In the face of teacher recommendations not to reclassify, they tended to disregard proficient or advanced scores as “single” performances, “luck,” possibly “cheating,” or an indication that some students “are just good test takers.” A principal said, “They [teachers] may not even look at the CST proficiency and the CELDT proficiency. Or they just think, ‘That may not be true about the student,’ and then consider reclassification based on their interaction with the kid.” A teacher indicated, “I didn’t see any reason to hurry it … I wanted to wait and see how her fourth grade CELDT scores came back and to see if she could maintain proficient on the CST-ELA.”
Triangulating across reclassification form, interview, and survey data, we found the latter philosophy was held primarily by District 2 elementary staff, who more often exercised tacit authority. All District 2 elementary staff reported that teachers should be the ultimate deciders of reclassification, which coincided with their survey responses indicating both greater teacher participation in reclassification and more frequent disagreement with the notion that eligible ELs should be reclassified, even if teachers recommended against it (see Table 3). In contrast, when staff did not have or did not exercise such tacit authority (all District 1 and secondary District 2 staff), the majority reported in both interviews and surveys that ELs meeting all criteria should reclassify (see Table 3). These staff acknowledged teacher input, but due to subjectivity and often nonacademic factors, they indicated that it should not trump objective performance.
Inadequate parental and student knowledge and participation
As conjectured, in both districts, when ELs were not reclassified, neither parents nor students were usually notified, thus restricting information and corrective action. District 1 notified parents only when students reclassified. District 2 parents were to participate regardless of the outcome. However, markedly lower rates of parent signatures on forms of not reclassified versus reclassified ELs (36% versus 87% in Year 1 and 33% versus 99% in Year 2) demonstrated failure to inform parents under these circumstances; staff reports concurred. Also across districts, staff tended to report that, notwithstanding state-mandated forms of communication and participation (district and school English Learner Advisory Committees), parents and students (especially elementary ELs and secondary long-term status ELs) typically did not participate and were not knowledgeable about their EL status and the reclassification process, criteria, and curricular placement implications.
Discussion
District Commonalties
Three common findings emerged. Linking student data across ELP, content standards, and local criteria greatly reduced potential eligibility, as expected. A substantial number of ELs who met all criteria were not reclassified. The same was true for the subset of ELs meeting at least standardized-test criteria, consistent with other research (Robinson, 2011). As conjectured, when meeting criteria does not result in reclassification, school staff are involved and lack of informed participation is a likely impediment to parents or students taking corrective steps.
Distinct District Policies and Practices That Impede or Facilitate Reclassification
District differences in reclassification criteria and policies and in implementation-enabling investments appeared to produce distinct reclassification patterns and to shape staff philosophies. Despite the common goal of providing services until ELs can participate meaningfully in the standard program, District 1’s criteria matched state minimums, while District 2’s exceeded them greatly. Yet for the majority of both districts’ staff, reclassification signified mainstream readiness—suggesting that policy and practice shape beliefs.
Prioritizing EL outcomes and investing in policy implementation appeared to pay off. In District 1, increases in eligibility and reclassification and the steep drop in its rate of not reclassifying ELs meeting all criteria co-occurred with policy clarification, capacity building, inducements, and outcome monitoring. Absent these conditions in District 2, although the percentage of ELs meeting all criteria stayed similar and increased for those meeting at least standardized-test criteria, the percentage not reclassified for both groups increased sharply over 2 years. These findings support the argument that faithful policy implementation requires such investments (Fuhrman & Elmore, 1990; O’Day & Smith, 2016) and that reclassification rates are linked to practitioners’ understanding of policy (Mavrogordato & White, 2017).
Differences in districts’ rates of not reclassifying and staff philosophies were also linked to distinct reclassification processes and practices. District 1’s clearly defined criteria and threshold performances, combined with a largely automated process, data transparency, and school implementation monitoring reduced ambiguity, increased standardization, and decreased the rate of not reclassifying ELs meeting all criteria. Second, omitting a formal recommendation role for teachers and other school staff reduced exercising of tacit authority to not reclassify and avoided negative decisions based on lack of knowledge about second language learning or perverse incentives. Under these circumstances, staff more often held the philosophy “reclassification is urgent/teacher as advisor.” Finally, data systems containing all pertinent performances and teacher input made the process transparent and enabled monitoring. These factors appeared to facilitate reclassifying for ELs meeting all criteria by buffering implementation from errors due to inadequacies in knowledge, overburden, or staff philosophies.
In contrast, District 2’s ambiguous criteria, inadequate staff knowledge, burdensome processes, and a formal recommendation role for teachers/school staff, often exercised as tacit decision-making authority, was combined with lack of district monitoring. In this context, staff more often held the philosophy “reclassification can wait/teacher as decider.” These conditions led to misapplications of criteria and unstandardized site-specific practices, which co-occurred with high rates of school staff effectively denying reclassification to ELs meeting all criteria. For ELs meeting at least standardized criteria, reclassification went further astray because staff did not record CEA criteria in administrative data, did not systematically apply nor record CEAs in reclassification forms, and/or applied incorrect CEAs—making whether these ELs met these criteria indeterminable for district staff and researchers alike. The increased opacity co-occurred with even higher rates of not reclassifying this subset of ELs. Thus, for both sets of ELs, faithful reclassification policy implementation was vulnerable to compromise at multiple points.
Reclassification Policy, Practice, and Research Implications
Policies and practices that prolong EL status for those meeting reclassification criteria are implicated, albeit unintentionally, in the production of ELs in long-term status. This phenomenon is consequential because these ELs often experience restricted OTL (Dabach & Callahan, 2011; Estrada & Wang, 2015; Umansky, 2016a). Beginning in middle school in both districts, reclassification was the gateway to the mainstream core, more advanced courses, the full curriculum, and non-EL peers (Estrada & Wang, 2015).
Current policies and practices also raise issues of fairness and equity. For exiting from EL status, the USDOE/USDOJ (2015) emphasize whether students have reached “… a level [of English proficiency] that enables students to effectively participate in grade-level content instruction in English without EL services.” They require only a valid and reliable ELP assessment for demonstrating proficiency. Without a common definition, however, EL status is state and/or district and school dependent. California requires demonstrating English proficiency and ELA standards achievement and teacher evaluation of curriculum mastery. Due to local control, districts freely operationalize, append, and exceed criteria (Hill et al., 2014). Our findings demonstrate that an EL in one district who garners the mantle of success that reclassification signifies might, in another, enter long-term status and garner the mantle of failure. No other students must demonstrate these competencies to be considered mainstream ready.
On a positive note, many impediments to reclassifying ELs meeting criteria are within state, district, and/or school control and therefore changeable; staff philosophies also appear malleable. Our findings point to policies and practices with high potential for facilitating reclassification for ELs meeting criteria and reducing the possibility of it morphing into district- and school-site specific processes. Foremost is the need for a common definition of EL statewide, involving clearly defined criteria and processes for reclassification that are within the capacity of districts and schools (cf., Linquanti & Cook, 2013). Although the Every Student Succeeds Act (ESSA, 2015) calls for statewide standardized EL identification and exit procedures, it does not call specifically for standardized criteria (Council of Chief States School Officers, 2016). Simultaneously, automating and standardizing reclassification criteria and processes across the state would increase equitable treatment of ELs and diminish overtaxing staff capacity (see Fuhrman & Elmore, 1990). School staff who face ever-increasing demands might welcome such a step that could free up time to focus on instruction in the context of new ELD standards and CCSS. Notably, some states use only the ELP assessment and an automated system (e.g., Wisconsin Department of Public Instruction, 2011). State and district prioritization of EL services and outcomes, coupled with capacity building, along with state and district monitoring and public reporting of fidelity of reclassifying eligible students, could serve as powerful inducements (see Furhman & Elmore, 1990). Maintaining ELs and former ELs in an ever-EL group for reporting outcomes and accountability purposes could counter some of the perverse incentives staff reported for denying reclassification to ELs meeting all criteria. Our findings also indicate that use of additional reclassification criteria should be empirically based. Similarly, continued use of teacher input on curricular mastery should be advisory and based on a common, reliable, and valid metric. Asking teachers to make judgments, without building their capacity to do so is unwarranted. Finally, increasing staff, parent, and student knowledge of EL status, reclassification criteria and processes, and curricular placement consequences is essential for meaningful participation.
The findings provoke compelling questions for further investigation. Are current EL identification and reclassification criteria and processes supporting the goal of providing services only as long as needed? Or are they holding ELs to a higher standard and more scrutiny than average non-EL students? These questions are critical in light of recent studies. For students at the margin of being identified EL, one study found a negative impact of the EL label on state content standards tests of ELA and math (Umansky, 2016b). A CDE (2011b) study showed that 74% of English only-speaking kindergartners administered the CELDT would have been identified as ELs had they reported a primary language other than English in the home. Carroll and Bailey (2015) showed that both initial proficiency and reclassification decision rules impact identification and continuing EL status. Nonproficient classification for ELs ranged from 21% using compensatory rules to 57% using conjunctive rules. For non-ELs, it ranged from 5% to 37% for compensatory and conjunctive rules, respectively. High-performing ELs and non-ELs (scoring proficient or advanced on state tests of reading, language usage, mathematics, and science) were also classified nonproficient, though at lower rates. The impact of these decisions on ELs is severely understudied and researchers rarely include non-ELs for comparison. How would non-ELs identified as nonproficient fare under our varied reclassification policies?
Importantly, what are the performance thresholds that empirically indicate readiness for the mainstream in the context of the CCSS? What is the empirical value of additional criteria, which can be ambiguous and subjective? Is a content standards criterion necessary in addition to an ELP criterion? Recently, researchers have found converging evidence that it may be possible to identify empirically an appropriate ELP range that predicts ELA and math content achievement similar to non-EL peers (Cook, Linquanti, Chien, & Jung, 2012). Yet regarding reclassification, Carroll and Bailey (2015) found an ELP proficient first criterion, aggregated with content achievement at or above standard, resulted in 59% ineligibility for all ELs and 30% ineligibility for academically high-performing ELs. Combined with our results, these findings prompt the question, is high academic performance (e.g., scoring proficient or higher on a state test of ELA) sufficient evidence that an EL is participating meaningfully in the standard program. Thus, would ELs be better served with an ELP or content achievement compensatory rule? Finally, what kinds of school structures would increase staff, student, and parent knowledge and participation for reliable and fair implementation in the best interest of ELs?
A central strength of this study is the use of longitudinal, multisite comparative mixed-methods, which yielded quantitative patterns of reclassifying and not reclassifying ELs and complementary qualitative evidence about factors undergirding those patterns in two districts with distinct policies and practices. Uniquely, reclassification forms provided invaluable insight into the process, the use of CEA criteria, participants, and outcomes. Moreover, we contribute a more veritable and nuanced view of these phenomena because, with the exception of CEAs in District 2, we had data on all reclassification criteria rather than standardized-test criteria only. Thus, for 100% and 90% of the sample in Districts 1 and 2, respectively, we accurately calculated the percentage of ELs meeting all criteria. To our knowledge, this is the first published study that does so. Like all studies, this one has limitations, including a single-state focus. Also, across the multiple types of data, we identified multiple reasons for not reclassifying ELs meeting all criteria and the subset of ELs meeting at least standardized-test criteria, however we could not determine their relative distribution across school levels. The higher occurrence of elementary staff overriding qualifying performances is consistent with our speculation that the reasons varied across levels.
Our findings are timely. In addition to outlining broad patterns, we provide a ground floor view into the complexities of reclassification, which contribute uniquely to the discussion of EL policies and practices, including a common definition of EL status. The matter is urgent. EL designation and reclassification are decisions with high-stakes educational consequences.
Footnotes
Acknowledgements
We thank Patrick Shields, Claude Goldenberg, and Timea Farkas for thoughtful feedback on this paper; Aleshia Barajas, Soyoung Park, Claudia Rodriquez-Mojica, Claudia Rivas, Timea Farkas, Hyemin Han, and Victoria Tse for research assistance; Paul Hu for programming assistance; and our research partners and the school staff who shared their knowledge and experiences and enriched our understandings. Finally, we thank the reviewers.
Notes
P
H
References
Supplementary Material
Please find the following supplemental material available below.
For Open Access articles published under a Creative Commons License, all supplemental material carries the same license as the article it is associated with.
For non-Open Access articles published, all supplemental material carries a non-exclusive license, and permission requests for re-use of supplemental material or any part of supplemental material shall be sent directly to the copyright owner as specified in the copyright notice associated with the article.