
Abstract
The public narrative surrounding efforts to improve low-performing K–12 schools in the United States has been notably gloomy. But what is known empirically about whether school improvement works, which policies are most effective, which contexts respond best to intervention, and how long it takes? We meta-analyze 141 estimates from 67 studies of post–No Child Left Behind Act turnaround policies. On average, policies had moderate positive effects on math and no effect on English Language Arts achievement on high-stakes exams. We find positive impacts on low-stakes exams and no evidence of harm on nontest outcomes. Extended learning time and teacher replacements predict greater effects. Contexts serving majority-Latina/o populations saw the largest improvements. We cannot rule out publication bias entirely but find no differences between peer-reviewed versus nonpeer-reviewed estimates.
Americans view their public school system as the government’s primary program for combating inequality (Hochschild & Scovronick, 2004). However, both the income gap between wealthy and poor families and academic outcome gaps between high- and low-income children appear to have grown over the past three decades (Carter & Reardon, 2014; Duncan & Murnane, 2011). These growing gaps are found in test scores (Reardon, 2011) as well as longer term outcomes including years of schooling (Duncan & Murnane, 2011) and college going (Bailey & Dynarski, 2011; Gamoran, 2015). Even scholars finding that income-based gaps have remained stable or gotten smaller, still conclude there is significant work to be done to reduce these substantial inequalities (Hanushek et al., 2019; Hashim et al., 2020). One potential strategy for ensuring that schools play a greater role in narrowing these gaps is the rapid and dramatic improvement, sometimes called the “turnaround,” of the country’s lowest performing public K–12 schools that serve high concentrations of low-income students and disproportionate numbers of students of color.
Unfortunately, the public narrative surrounding the effectiveness of school turnaround in the current era of test-based accountability has been notably pessimistic. Observers assert that either nothing works or—at best—the literature is without quality evidence to guide the field. Pundits suggest that we simply do not have examples of effective school turnaround from which to learn. Michael Petrilli, President of the Fordham Institute, has argued, “We don’t know what to do about chronically low-performing schools. Nothing has worked consistently and at scale” (Brown, 2017). Andy Smarick (2010), a former U.S. Department of Education official, has observed, “overall, school turnaround efforts have consistently fallen far short of hopes and expectations. Quite simply, turnarounds are not a scalable strategy for fixing America’s troubled urban school systems” (p. 21). Stuit (2010) argues that given how rare successful turnaround is empirically, it is “easier to close a low-performing school than to turn one around” (p. 10).
Many of these remarks came in the wake of the Obama administration’s unprecedented investments in school turnaround—which included some of the largest federal education grant programs in history (Dragoset et al., 2017). Criticisms of Obama-era policy efforts to turn around chronically underperforming schools have come from both sides of the political spectrum. Those on the right often argue that turnaround efforts have been either too prescriptive, too expensive, or both. Those on the left criticize the focus on standardized test-based sanctions, the disruptive nature of reforms, and the limited supports these policies provide to address the out of school challenges that many students in turnaround contexts confront. Others point to supply-side considerations, arguing that the staff replacements central to many turnaround efforts can only be effective insofar as there is some untapped supply of highly effective educators ready to replace the educators currently working in these challenging settings.
Perhaps most illustrative of the seeming unanimity, assessments of the Obama turnaround efforts represent a rare point of agreement between U.S. Secretary of Education Betsy DeVos and American Federation of Teachers President Randi Weingarten. DeVos was blunt in her 2017 address before the Conservative Political Action Conference, criticizing the School Improvement Grant program: “They tested their model, and it failed . . . miserably.” Weingarten referred to the program as a “terrible investment,” calling instead for community-based and career and technical education programs to address students’ wholistic needs (Layton & Brown, 2015).
Scholars of educational leadership have also been skeptical of turnaround, particularly in the post-No Child Left Behind Act (NCLB) era of universal test-based accountability. In fact, several argued that reforms required by the Obama administration’s school improvement policies were likely to actually reinforce the very conditions that promote persistent low performance in the first place, including high staff turnover, the use of inexperienced staff, limited financial investments, lack of focus on curriculum and instruction, limited parental engagement, and continued racial and socioeconomic segregation (e.g., Murphy & Bleiberg, 2019; Trujillo & Renee, 2015). Several scholars have focused specifically on reconstitution and mass staff replacements—a key component of common turnaround models in this period—as particularly likely to generate unintended consequences (Malen et al., 2002; Malen & Rice, 2016; Rice & Croninger, 2005; Rice & Malen, 2003). Other criticisms focused on the limited evidence of effectiveness among partner organizations that implement turnaround efforts (Meyers & VanGronigen, 2018; Peurach & Neumerski, 2015).
Researchers and leaders have also disagreed on the durational aspect of turnaround. In their seminal 2007 report, “The Turnaround Challenge,” leaders at Mass Insight Education and Research Institute define school turnaround as, “a dramatic and comprehensive intervention in a low-performing school that produces significant gains in student achievement within two academic years” (Calkins et al., 2007). However, there is an active debate regarding the amount of time necessary to achieve “turnaround”; indeed, one lesson emerging from the research on “comprehensive school reform” prior to NCLB was that such reforms tend to need more than 3 years of implementation to demonstrate substantial results (e.g., Berends et al., 2002; Borman et al., 2003; Desimone, 2002; Gross et al., 2009; Hochbein, 2012). More recently, Sun et al. (2020) find that effects of School Improvement Grants increase after the first year of intervention. Peurach and Neumerski (2015) go even further, arguing that although gains can be realized within 3 years, the establishment of school-level improvement infrastructure is more of a 7-year process and system-level infrastructural improvement requires decades.
But what is known empirically about the effectiveness of efforts to improve low-performing schools and districts? Does rigorous quantitative research confirm the pessimistic narrative? Have the school turnraound programs enacted in the period between the passage of NCLB and the Every Student Succeeds Act (ESSA) generated improvements for children served by these schools? If so, how long has it taken for gains to materialize, which programs have been most successful, and does the effect of these programs depend on features of the contexts in which they are implemented (e.g., the demographics of the student populations)? What guidance does the literature provide for leaders seeking to improve low-achieving systems? In this article, we comprehensively review and meta-analyze the existing impact evaluation studies of school and district improvement interventions implemented between NCLB and ESSA passage to tackle the following research questions:
Research Question 1 : What has been the effect of efforts to improve low-performing U.S. K–12 school and districts on student academic achievement?
Research Question 2 : How many years has it taken for these improvement interventions to demonstrate results?
Research Question 3 : Are particular contexts associated with larger effects?
Research Question 4: Have particular intervention features been associated with larger effects than others?
Our study would not have been possible 10 years ago. The authors of a 2008 federal Institute of Education Sciences-sponsored report, “Turning Around Chronically Low-Performing Schools,” wrote that they were unable to uncover a single study that met What Works Clearinghouse standards for high-quality experimental or quasi-experimental evidence (Herman et al., 2008). In more recent years, a series of studies of school improvement efforts have emerged relying on methods designed for making credible causal inferences. Collectively, the findings from these studies have been described as “mixed” (Barnum, 2017). Complicating matters further, each of these studies evaluates different policy approaches implemented in different settings. Therefore, despite the proliferation of empirical work in this area, there is still confusion about what—if anything—works overall or in specific contexts. Efforts to examine the mechanisms behind successful turnaround have been rare (e.g., Sun et al., 2019).
The one recent meta-analysis of turnaround evaluations examined a subset—52%—of the studies included in our sample, focusing exclusively on interventions explicitly described as “turnaround.”Redding and Nguyen (2020) find promising results for turnaround interventions, on average, but did not analyze the features of interventions that were under evaluation. This leaves open major questions of interest to policymakers about which components of reform (e.g., staff replacements, professional development, extended learning time, funding, choice, governance change, and wraparound services) drive gains. Additionally, there are many rigorous studies of interventions targeting support to low-performing schools that are not explicitly labeled as “turnaround” programs. An important next step is to broaden the scope of research under examination in order to understand what specific practices work best for improving struggling schools, regardless of the terms ascribed to the interventions. Our review aims to do just this, by comprehensively analyzing the research to help the field draw conclusions about how to design effective policies for improving low-performing schools. We also go beyond the Redding and Nguyen (2020) analysis by examining the demographic characteristics of contexts in which school improvement has been most effective and examining the effect of these policies on low-stakes exams that are less susceptible to gaming.
Overall, we find more room for optimism than the public narrative might suggest. Even with our expanded definition of turnaround policies, we find that reforms have generated moderate—although hardly transformational— positive gains in math achievement as measured by high-stakes standardized tests, as well as several low-stakes measures. We find no strong evidence of average effects on high-stakes English language arts (ELA) achievement. Our results also highlight more granular intervention features—teacher replacements and extended learning time—associated with more effective improvement efforts. Perhaps surprisingly, principal replacements do not appear to be a particularly valuable component of school improvement efforts, on average. We find no strong evidence of differential effects between the four major types of policy response to low-performance (turnaround, labeling, charter conversion, and closure), though we uncover suggestive evidence that charter conversion may generate larger gains, and the average reforms do not require 3 years of implementation to demonstrate results. While we are not able to entirely rule out the possibility of publication bias in this literature, we find no differences in estimates from working papers versus peer-reviewed sources and provide a plausible explanation for the patterns of effects we observe in the absence of publication bias. Next, we briefly describe the key federal policies during the time period that is the focus of our study.
School Improvement Policy From NCLB to ESSA
No Child Left Behind
The 2002 passage of NCLB in the early years of the George W. Bush administration began an era of universal test-based educational accountability that brought a new approach to improving low-performing schools. To receive increased Title I funding, states were required to establish grade-level standards, test students annually, set criteria to determine “proficiency” on standards, and ultimately achieve universal proficiency in math and reading by 2014 (McGuinn, 2006). Schools that did not demonstrate “adequate yearly progress” (AYP) toward the proficiency goal were subject to sanctions that increased in severity each year a school failed to make AYP. This culminated in school restructuring, including state takeover of the school, closure and reopening as a charter school, contracting with a private school operator, replacing staff deemed relevant to the failure (often called “reconstitution”), or any other major reorganization. Not surprisingly, a large majority of schools chose the least disruptive option (“any other major reorganization”) and very few schools that entered restructuring were ever able to exit (Murphy & Bleiberg, 2019; Scott, 2009; Smarick, 2010). A review of successful turnaround case studies from this era highlights the importance of signaling a genuine commitment to improvement, leadership, committed staff, and instructional focus (Herman et al., 2008). In more recent years, a series of studies with higher internal validity have revealed mixed results on the effects of the school improvement interventions of this period.
American Recovery and Reinvestment Act
The 2009 American Recovery and Reinvestment Act, passed at the start of the Obama administration, dedicated unprecedented federal resources for school turnaround, establishing the School Improvement Grant (SIG) program targeting the lowest performing 5% of schools within each state. The new $3 billion allocated to fund the program represented a considerably more substantial investment than the similar School Improvement Fund program begun in 2007 (Dee, 2012; Trujillo & Renee, 2015). SIG investments were also accompanied by $4 billion in Race to the Top competitive grant funding that was awarded in part based on states’ plans for turning around their lowest achieving schools (McGuinn, 2012; Murphy & Bleiberg, 2019; Smarick, 2010).
Schools accepting SIG funds were required to implement one of four federally prescribed models. The “transformation” model required replacing the school’s principal and implementing whole-school reform efforts, such as performance-based HR decisions, data-driven instruction, extended learning time, professional development, technical assistance, and wraparound supports. The “turnaround” model required replacing the principal and at least half of the teachers, providing the new leader with operational flexibilities, and implementing “comprehensive instructional reforms.” The “restart” model involved converting a traditional public school into one run by an outside management organization such as a charter operator (Dee, 2012; Dragoset et al., 2017; Murphy & Bleiberg, 2019). The fourth and final model was school closure. A large majority of SIG schools relied on the least extreme “transformation” model. Second most popular was “turnaround” while charter conversions and closures were least common (Hurlburt et al., 2011). While a handful of rigorous studies have shown SIG grants had positive achievement effects (e.g., Carlson & Lavertu, 2018; Dee, 2012), others have generated more disappointing results (e.g., Dickey-Griffith, 2013). Studies of average effects nationwide have not shown the kind of dramatic improvements that would constitute the kind of successful “turnaround” at scale that the program was designed to produce (Dragoset et al., 2017).
No Child Left Behind Waivers
Although NCLB had been due for reauthorization as of 2007, political gridlock prevented this from occurring until 2015. In the meantime, the U.S. Department of Education encouraged state education agencies to apply for waivers from some NCLB requirements, contingent on adopting a particular system of interventions for low-performing schools. Thirty-nine states received waivers in 2012 (Derthick & Rotherham, 2012) and were required to classify schools based on performance and implement reforms targeting the lowest performing 5% (called “priority schools”) and the 10% of schools with the largest achievement gaps or lowest performance among subgroups of students (called “focus schools”). While focus schools were given substantial flexibility, the reforms required of the priority schools largely mirrored those embraced by Race to the Top and the SIG program. These included restart and closure, but most schools implemented something similar to what had been labelled “transformation” under SIG. Most evaluations of waiver policies in individual states have generated null or negative results (e.g., Dee & Dizon-Ross, 2019; Dougherty & Weiner, 2017; Hemelt & Jacob, 2020). However, Bonilla and Dee (2018) reveal more optimistic evidence from the focus school reforms as implemented in Kentucky. Again, these mixed results highlight the need for a synthesis of the empirical work in this area.
Every Student Succeeds Act
At the end of the Obama administration, Congress formally revisited NCLB, reauthorizing the law as the ESSA. Partly in response to criticism that SIGs and NCLB waivers represented an overly prescriptive overreach of federal authority, ESSA devolved greater responsibility for turnaround to states and localities (Mann Levesque, 2016). States are still required to identify their lowest performing 5% of schools—and this identification can now be based in part on nontest measures of achievement—and must remedy low performance using evidence-based reforms. However, the federal government no longer mandates particular interventions and many states delegated further turnaround authority to districts (Barone, 2017). Given this new freedom to select interventions, it is all the more important that scholars identify effective turnaround practices for policymakers.
Methods
Literature Search
We began with an electronic database search using Academic Search Premier, ERIC, Ed Abstracts, and ProQuest Dissertations & Theses, for January 2000 to January 2018 due to our interest in the post-NCLB era. Search terms included both turnaround content- and methodology-related keywords to capture experimental and quasi-experimental designs and are provided in the Supplemental Figure A1 (available in the online version of the journal). Our search uncovered 11,120 studies, as we show in Supplemental Figure A2 (available in the online version of the journal) flowchart of our search, screening, and inclusion process. Though our database search only covered studies published prior to January 2018, we continued to monitor publications during the coding phase (e.g., AERA-sponsored journals, Journal of Policy Analysis and Management, Education Finance and Policy) to ensure we did not miss recently published research (through summer 2019). Next, we searched within websites of research firms as well as several working paper collections. We searched programs for education and policy conferences (2016–2019) to capture unpublished working papers. These steps allowed us to identify 2,090 sources.
After removing duplicates, we netted a total of 4,041 records for screening. A single team member then reviewed the titles and abstracts of all 4,041 studies to determine whether they were potentially relevant for our sample. Questionable studies were brought to the lead author who made a final determination. We also scanned the reference lists of each study that made it to the inclusion review phase to identify additional studies for review. Through this process, we identified 207 studies that appeared to be relevant impact evaluations of school or district turnaround interventions based on titles and abstracts alone and excluded 3,834 records.
Inclusion Review
The 207 studies were assessed against six inclusion criteria. First, the study needed to constitute an impact evaluation of a policy effort to substantially improve outcomes for students in low-performing schools or districts. We chose to define school improvement broadly—beyond the four federal SIG models—to ensure we could capture the most effective policy options for addressing underperformance of struggling schools (regardless of whether they had previously been federally endorsed). Therefore, we included studies as long as the intervention targeted low-performing schools or districts for improvement. Interventions that met our definition include reconstitution, transformation, restart, charter conversion, labeling (e.g, A–F grades, “warning” designation), accountability pressure (e.g., not making AYP under NCLB), comprehensive school reform, conversion to a community school model, technical assistance, state takeover, districtwide turnaround, and school closure. Although school closure may seem distinct from the rest of the interventions, we included these interventions because closure was one of the four federally defined models under the SIG program and is a common possible response to persistent low performance. In all, we excluded 33 studies because they did not evaluate a low-performing school or district improvement effort.
Second, the intervention under study must have been implemented after the passage of NCLB. We focus on this era because universal test-based accountability could influence the effectiveness of turnaround interventions and because there have already been comprehensive reviews of research prior to this period (including Borman et al., 2003; Corallo & McDonald, 2001; Figlio & Loeb, 2011; Lee, 2008; Wong & Meyer, 1998). We ultimately excluded 17 studies that examined interventions prior to NCLB.
Third, the study authors must have used a comparison group to estimate the impact of the intervention. We included both experimental and quasi-experimental research methods, including randomized controlled trials, regression discontinuity, difference-in-differences, instrumental variables, and matching or multivariate regression (including fixed-effects). We excluded pre- and postintervention comparisons without a counterfactual—a total of 23 studies.
Fourth, studies must have examined at least one academic outcome such as test scores, suspensions, attendance, graduation, or grade progression. Fifth, the studies needed to report standardized effect sizes or provide enough information for our team to calculate standardized effect sizes on at least one outcome, such that we could compare treatment effects across very different contexts, different endline exams, and so on. Sixteen studies did not meet these criteria.
Finally, given differences in turnaround approaches across sectors and nations, the intervention must have targeted K–12 schools or districts in the United States. Three studies did not meet this criterion. We also excluded 33 duplicative records (e.g., an interim report of an eventually published paper), and nine studies we were unable to accces, even after emailing study authors.
Expert Review
Next, we contacted at least one author of each study, as well as a handful of turnaround experts who had not authored studies on our list, following Cooper (2010). Via survey, we asked them to review our list of studies, confirm we had the most up-to-date versions, suggest additional studies for our sample, and provide feedback. In total, we heard back from 51 people, representing authors from 87% of the studies. Experts generally confirmed that our tracking was comprehensive and provided information for six additional studies that met the inclusion criteria described above. Our ultimate analysis sample includes 67 studies.
Study Coding
Our codebook included 328 codes that we grouped into four categories. First were codes related to the study itself, such as publication type and year, author affiliations, funder, identification strategy, covariates included, and sensitivity checks. The second category related to the study’s sample, including sample sizes and demographic characteristics, the geographic region, and grade level of the intervention. The third category of codes covered features of the interventions. At the highest level, this meant distinguishing between major categories of school improvement reforms: (1) turnaround, (2) labeling, (3) charter conversion, or (4) closure, and coding for the length of the intervention. Additionally, we coded for a wide-ranging set of intervention components based on the intervention descriptions in the study or public record. We consolidated our codes into 14 common intervention features and ensured each study was represented by at least one feature:
New funding: there was a documented source of additional funding.
Governance change: governance of schools was transferred from the traditional locally elected school board to another party, such as a state takeover of a district.
Change in school manager: day-to-day management of treated units was transferred to a new group, such as a charter management organization.
Human resource changes: there were changes to how teachers were managed, paid, or evaluated, including flexibility from collective bargaining agreements.
Teacher professional development: teachers were provided with professional development.
Administrator technical assistance: school or district administrators received supports in the form of professional development or technical assistance.
Teacher replacements: at least 35% of teachers were replaced or the study authors otherwise called out teacher replacements as a major part of the intervention.
Principal replacements: at least 50% of school principals were replaced or leadership replacement was explicitly described as a major part of the intervention.
Extended learning time: students received additional hours or days of instruction.
Tutoring: some students in treated schools received small group or individualized tutoring.
Curricular change: schools changed their curricula as part of the intervention.
Data use: school staff used student data to inform instruction.
Wraparound services: schools or districts provided noninstructional services to students and families, such as counseling, health services, or food support.
School choice: parents could send select schools other than that assigned by neighborhood.
Our list of consolidated intervention feature codes does not include separate codes for the federal SIG models (e.g., “transformation,”“restart”). Instead, we opted to capture the core substantive features of these models (e.g., principal replacements) so SIG studies could be examined alongside interventions with similar features but not formally part of the SIG program.
The fourth and final category of codes were effect estimates (effect sizes, standard errors, and p values) by outcome domain. Our primary domains of interest were academic achievement on state math and ELA exams used for accountability. However, we also examined effects on a number of low-stakes exams grouped into two categories: (1) science, technology, engineering, and mathematics (STEM) exams and (2) humanities (English and social studies). We also analyzed effects on three nontest outcomes: attendance, discipline, and graduation. For the small number of effect sizes for which authors did not report standard errors, we imputed standard errors using the reported p values from a two-tailed t test with the appropriate degrees of freedom.
Our team included six coders, five held graduate degrees in either public policy or education policy and one with a bachelor’s degree in statistics and public policy. Initially, all coders read and coded the same three studies and then reconciled our coding as a group, resolving differences and tracking decision rules. We then assigned each remaining study to two coders who coded the study independently and then reconciled as a pair. We convened the larger group regularly to resolve outstanding questions and to ensure consistency across coders.
Meta-Analytic Methods
The majority of studies in our sample reported impact estimates using model-based, standardized mean differences between the treated and control units derived from linear regression of outcome variables that were standardized by the original authors using unadjusted standard deviations. Where authors had not already standardized their outcomes, we did so using unadjusted pooled standard deviations. This practice was consistent for all outcomes, including dichotomous outcomes such as graduation, which were analyzed using linear probability models in the original studies. One benefit of relying on this approach for both randomized controlled trials and quasi-experimental studies is that all analyses adjusted for baseline covariates, providing for comparable effects between these different types of studies. We used these model-based point estimates to calculate Hedge’s g effect sizes where possible. The use of models to provide estimates of standardized mean differences ensures that the standard errors provided by original authors typically accounted for the clustered nature of the data, as recommended by Hedges (2007). Additional corrections were applied to standard errors that did not account for the clustering of observations within treatment units, following Littell et al. (2008). Where outcomes had not already been standardized, we used reported sample standard deviations to standardize effects and their associated standard errors. For all estimates, we applied the following correction to minimize the slight upward bias found in Hedges’s g effects with small sample sizes (Borenstein et al., 2009):

where
All analyses use robust variance estimation (RVE, Hedges et al., 2010), a flexible meta-analytic approach that accounts for the nesting of impact estimates within clusters (in our case, evaluations nested in studies). RVE typically adjusts for one of two common types of dependencies between effect sizes (Tanner-Smith et al., 2016): (1) “correlated effects,” or multiple effect size measures for the same sample or multiple outcome measures for the same treatment-control contrast and (2) “hierarchical effects,” multiple evaluations with distinct samples within studies. While our sample contains occasional examples of correlated effects, we follow the advice of Tanner-Smith and Tipton (2014) and model the most prevalent type of dependency observed in our sample, the “hierarchical effects.” We specify the following model for an impact estimate from evaluation i in study j in each of our outcome domains k:

where

where
We implement RVE in Stata using the Robumeta package (Tanner-Smith & Tipton, 2014) parameterized for hierarchical effects. This approach includes a small-sample correction designed to correct for the anticonservative bias in standard error estimation in a meta-analysis with a small number of impact estimates (Tipton, 2015). For our two primary outcome domains (high-stakes math and ELA test scores), we use RVE to estimate several meta-regression models that include a vector of multiple evaluation- and/or study-level moderators represented as Xi/j:

Meta-regressions allow us to address potential concerns about multiplicity and isolate relationships between a moderater and the impact estimates, controlling for other factors.
Results
Describing Included Studies
In Table 1, we describe the 67 studies included in our analytic sample and the populations under study. These studies provide a total of 141 estimates across seven available outcome domains. Studies containing evaluations of multiple distinct interventions or effects among multiple samples (e.g., same intervention in two different states) were coded as multiple observations (one for each evaluation/estimate). Each row in our data set represented an intervention within a study. Most interventions contributed estimates for multiple outcomes (e.g., 92% of the 114 observations contributed estimates on both math and ELA).
Characteristics of Studies in the Sample
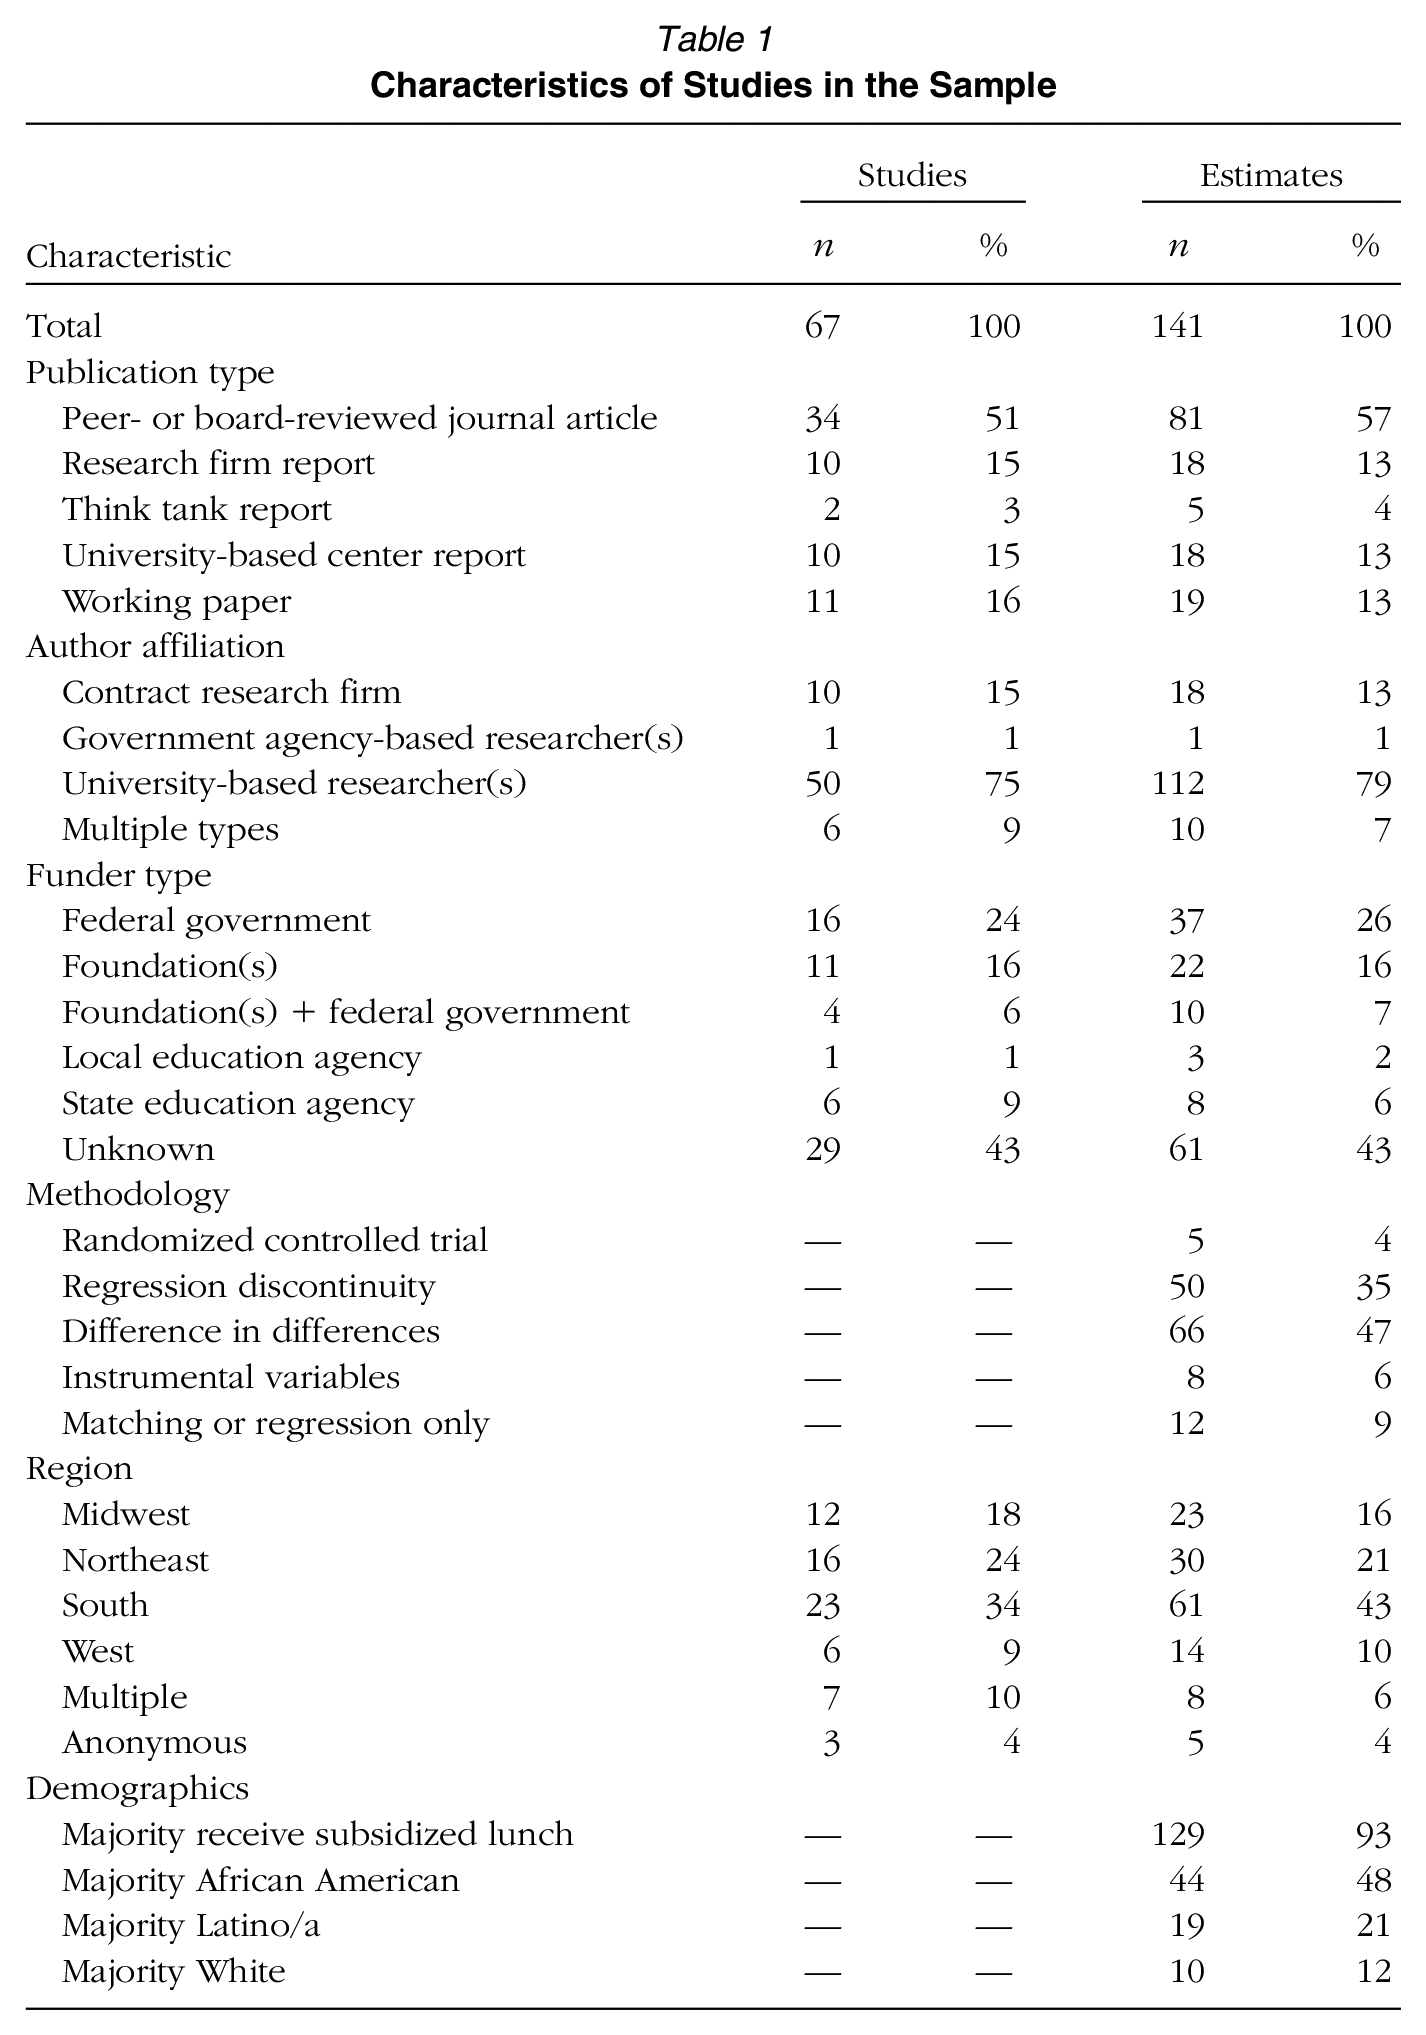
The majority of studies were published in peer-reviewed journals (51%), and the remainder were divided evenly among university-based center or think tank reports, working papers, and research firm reports. By far the most common type of author was a university-based researcher. A large share did not report a funder (43%), but others reported receiving funds from federal or foundation sources or state or local agencies. The most common research design was difference-in-differences (47%). Our sample also included a fair number of regression discontinuity analyses, as well as a smaller set of randomized controlled trials, instrumental variables, and matching or regression-based designs. All major regions of the United States were represented. Ninety three percentage of estimates come from contexts where a majority of students qualify for subsidized lunch. Nearly half were from contexts serving majority-African American student populations while 21% were from majority-Latina/o communities. Finally, the interventions targeted a range of school grade levels.
We characterize the interventions that the studies evaluated in Table 2. The large majority examined school-level interventions while only 12% examined districtwide efforts. Approximately half of estimates examined interventions after 1 year of implementation, 18% after 2 years, and 35% after 3 years or more. The majority of estimates (54%) evaluated “turnaround” interventions designed to dramatically improve existing schools. A total of 23% of estimates studied “labeling” interventions that encouraged improvement by creating public labels reflecting a school’s performance (e.g., F-grades on school report cards or failing AYP). Third most common (17%) were estimates examining the closure of low-performing schools. Our estimates in this category include estimates of the effect of being displaced by a school closure (i.e., being in a school that closes) as well as the effect of being in a school that receives new students from closed schools. Finally, 6% evaluated efforts to convert low-performing traditional public schools to charter schools.
Characteristcs of Interventions Evaluated by Studies in the Sample
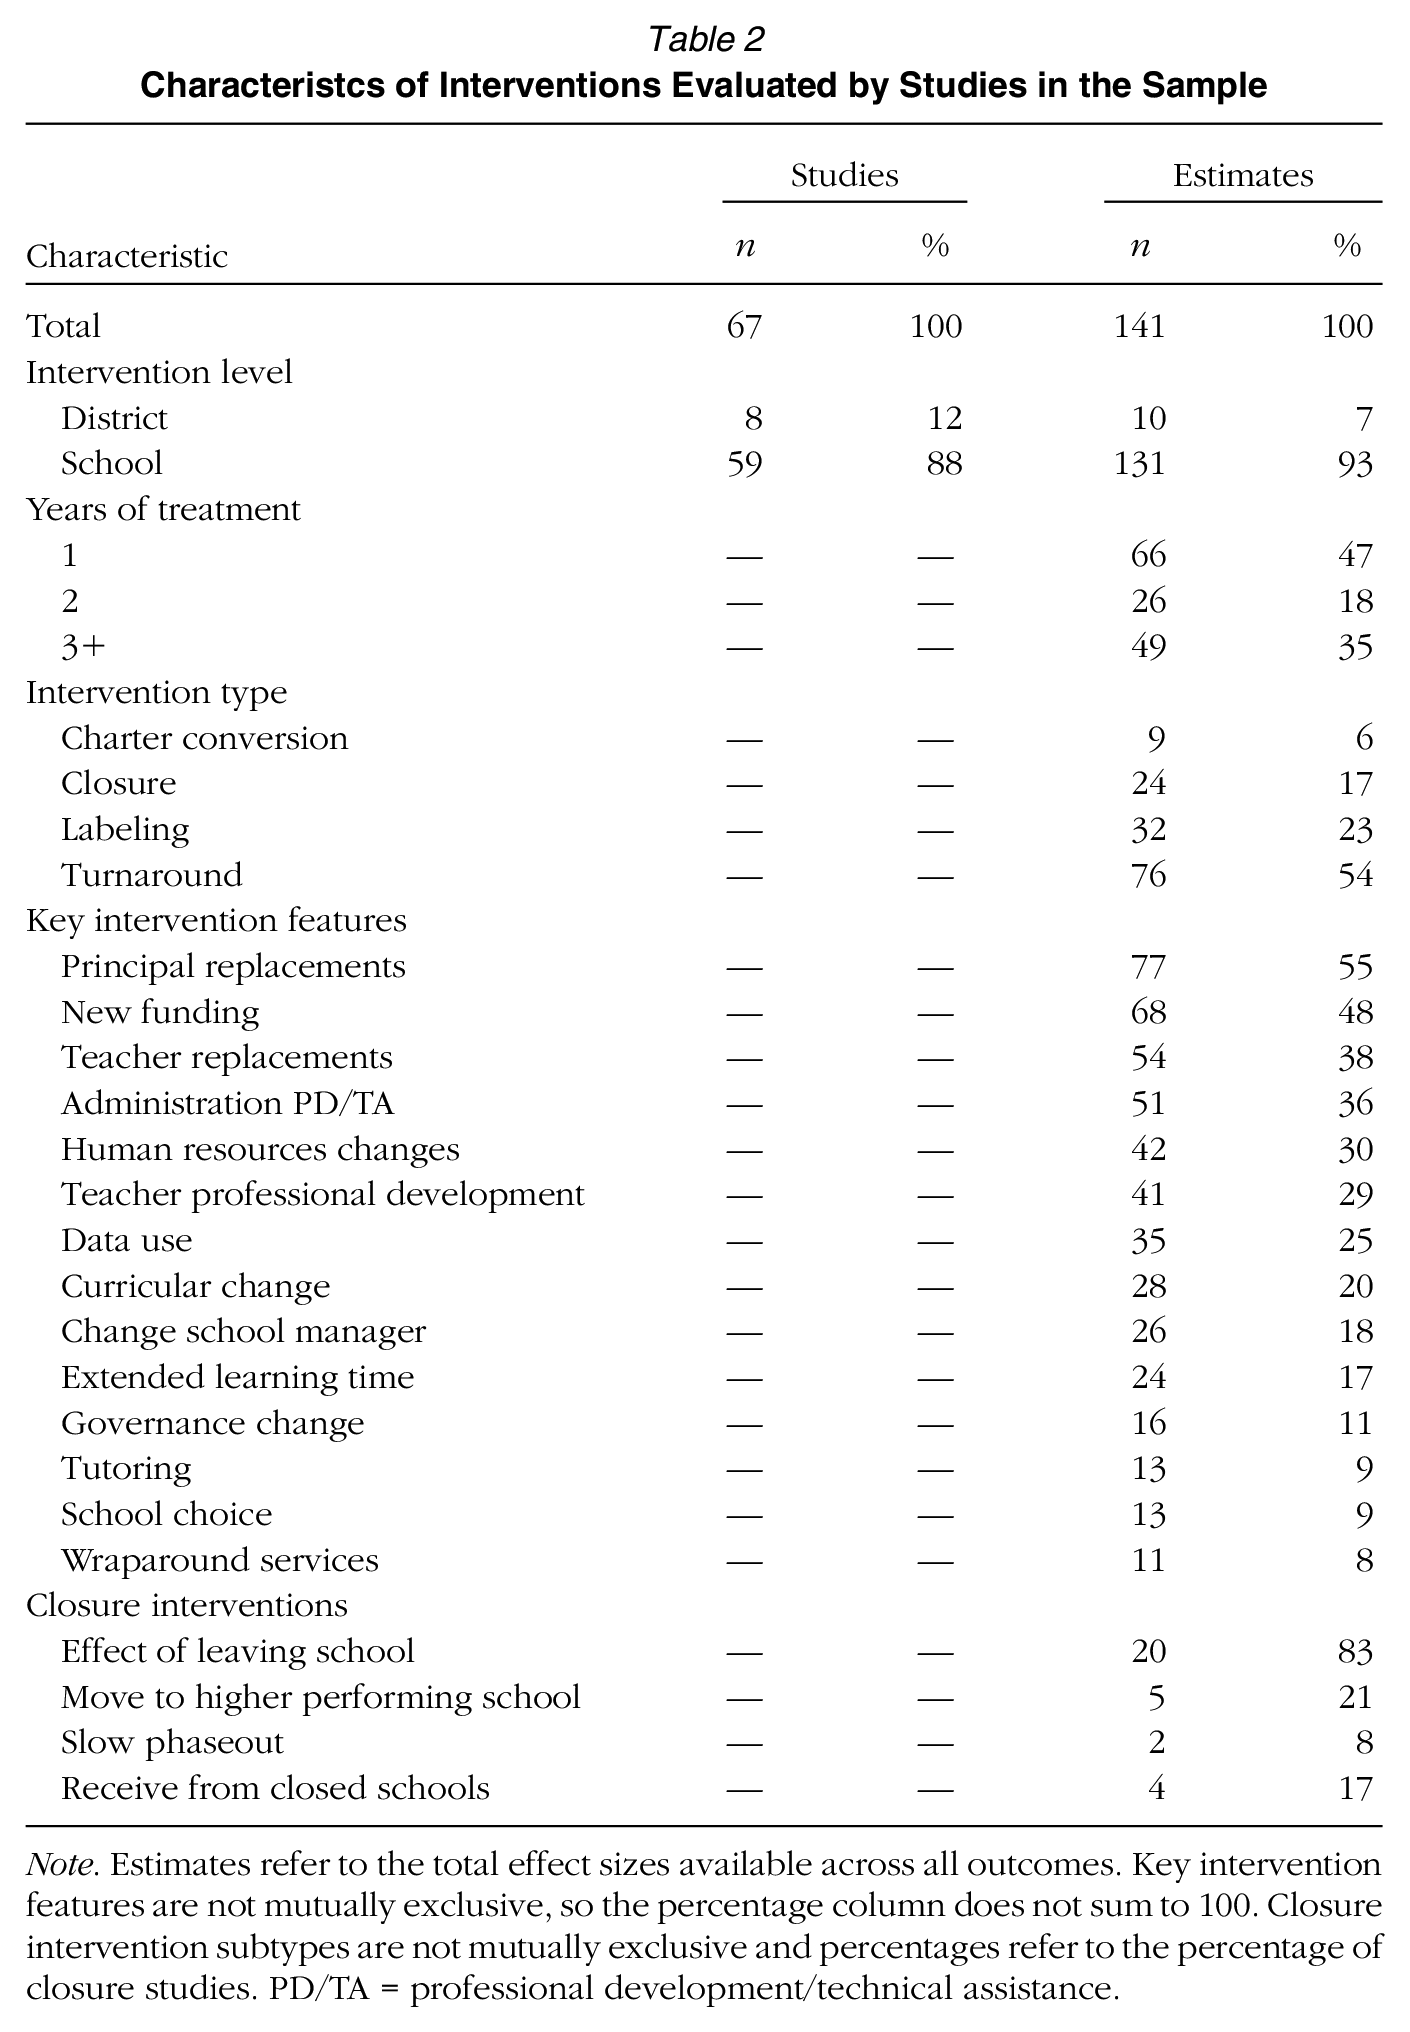
Note. Estimates refer to the total effect sizes available across all outcomes. Key intervention features are not mutually exclusive, so the percentage column does not sum to 100. Closure intervention subtypes are not mutually exclusive and percentages refer to the percentage of closure studies. PD/TA = professional development/technical assistance.
We found substantial variation in the features of the interventions that were tested. The most common intervention feature highlighted by authors of our studies was principal replacements. Other common features included new funding, teacher replacements, professional development or technical assistance for administrators, human resource changes, and teacher professional development. Less common were data use, curricular changes, changes in school managers, extended learning time, governance changes, tutoring, and wraparound services. At the bottom of Table 2, we show the variation in treatment among school closure estimates. A large majority estimated the average effect of being in a school that is closed (83%). Among these, some focus on the effect of closure for a subset of displaced students who transferred to a higher performing school than the closed school (21%), and 8% estimate the effects of closure in a phaseout model (eliminating one grade at a time). Overall, 17% study the effect of attending a school that receives students from a closed school.
Effects on Academic Achievement
We present pooled effect size estimates for our full sample in the first column of Table 3. We find that school improvement efforts had a significant average effect of 0.062 standard deviations (SD) on high-stakes math achievement (p < .05) and a smaller positive effect of 0.016 SD on high-stakes ELA achievement, though the ELA estimate is not statistically significant. We also examine pooled effects on low-stakes exams, finding statistically significant effects of 0.068 SD in STEM and 0.088 SD in humanities. This is notable given the smaller sample we have to estimate these effects (25 estimates from 15 studies in STEM and 20 estimates from 11 studies in ELA). These results suggest that on average—at worst—school improvement has not superficially boosted high-stakes math scores at the expense of true learning. We also report between-study variation metrics (tau) of 0.071 SD in math and 0.045 SD in ELA, showing evidence of heterogeneity in effects similar in magnitude to the overall effects. The implied prediction intervals (Borenstein et al., 2017) suggest that some individual interventions will have large positive effects whereas some could have negative effects. This variation motivates the heterogeneity analyses we discuss below.
Pooled Effect Size Estimates of School Improvement on Academic Outcomes
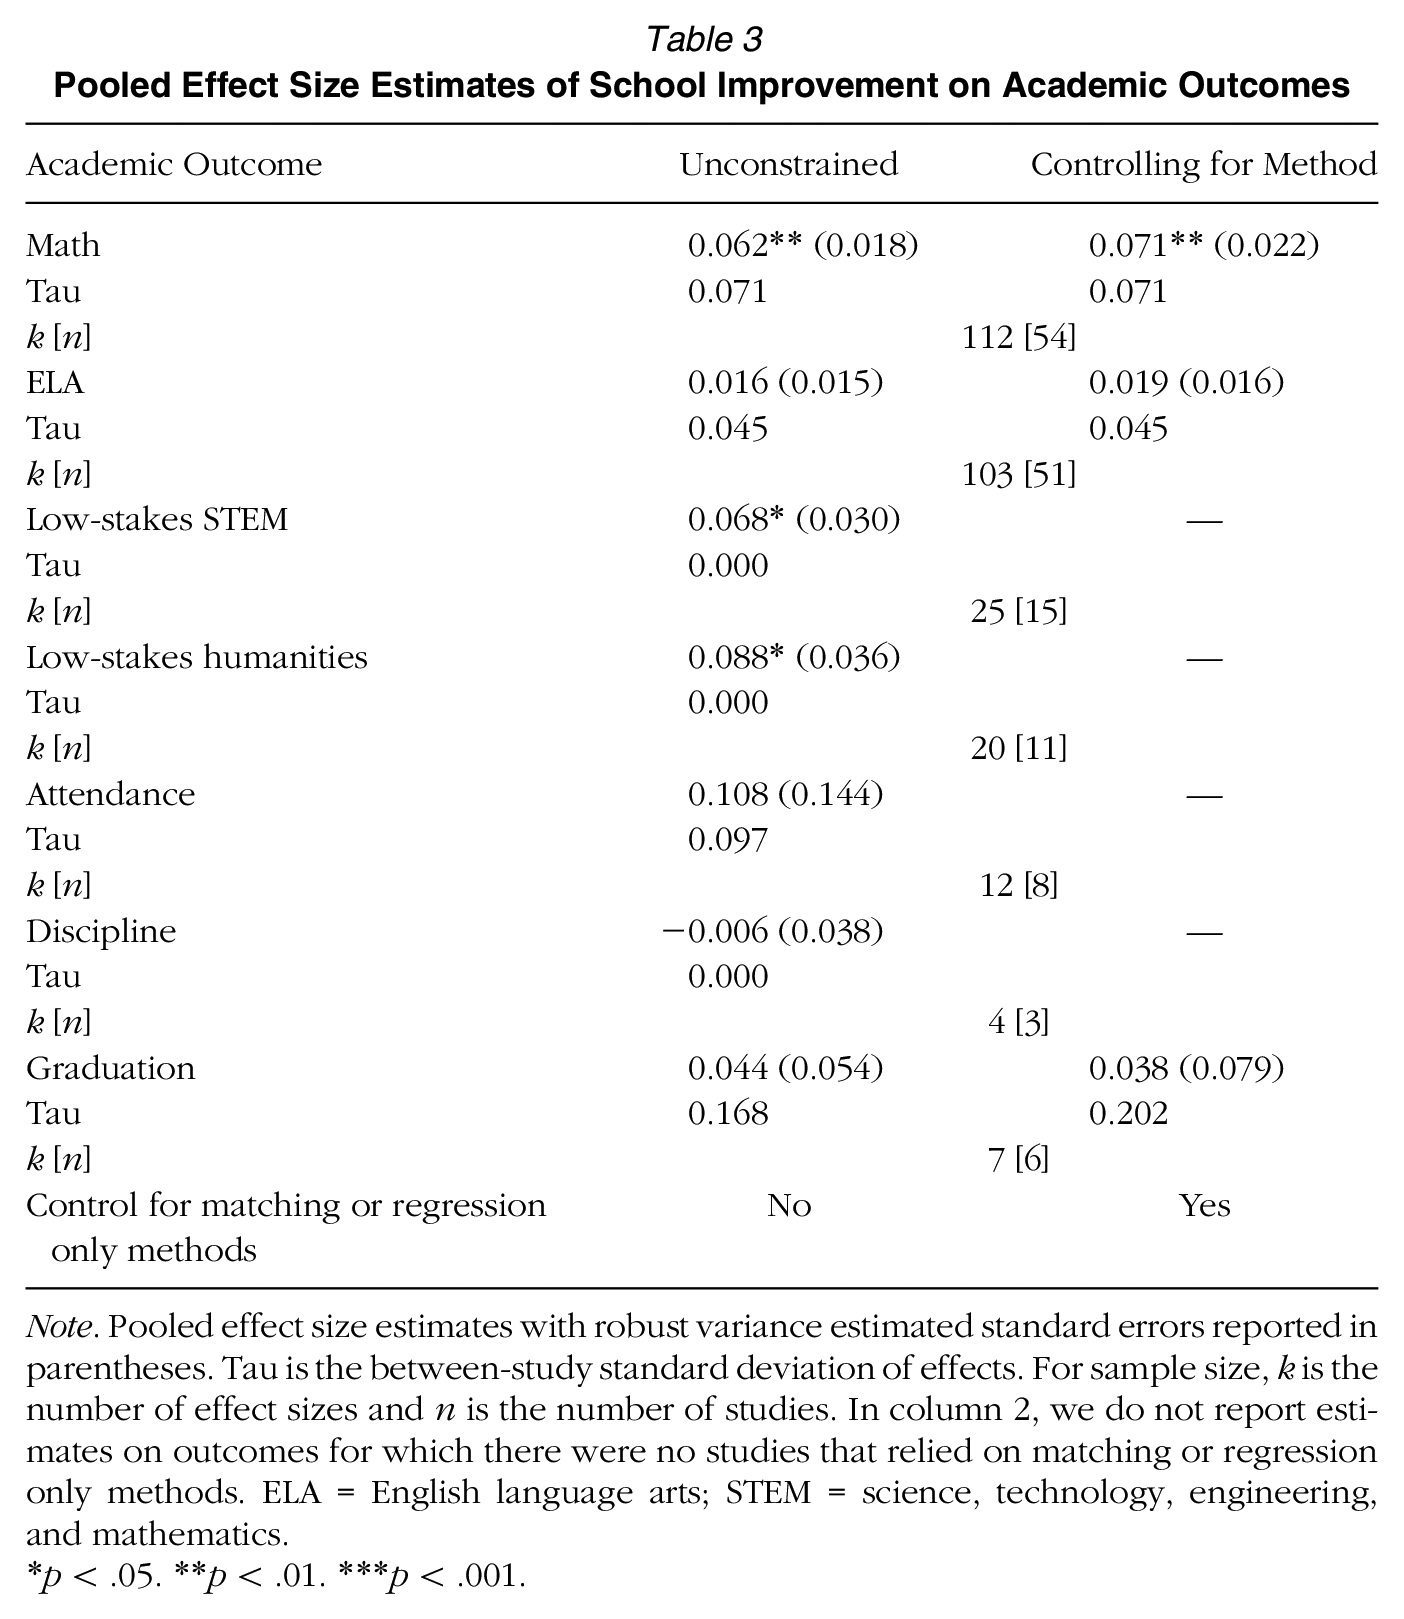
Note. Pooled effect size estimates with robust variance estimated standard errors reported in parentheses. Tau is the between-study standard deviation of effects. For sample size, k is the number of effect sizes and n is the number of studies. In column 2, we do not report estimates on outcomes for which there were no studies that relied on matching or regression only methods. ELA = English language arts; STEM = science, technology, engineering, and mathematics.
p < .05. **p < .01. ***p < .001.
Effects on Nontest Outcomes
A subset of the studies reported effects on academic attainment or behavioral outcomes. In Table 3, we show suggestive evidence that school improvement has had positive effects and no evidence of negative impacts on nontest outcomes. On average, school improvement has had a 0.108 SD effect on school attendance, has somewhat reduced disciplinary infractions by 0.006 SD and has increased graduation rates by 0.044 SD. However, none of the effects on nontest outcomes achieve statistical significance. This is not surprising given these estimates were calculated with smaller samples than the test score estimates (between four and nine estimates from between three and six studies).
Study Characteristics
We also test whether results vary depending on the methodology deployed as well as other study characteristics (see Table 4). We include all study features in a single meta-regression model in case features of studies are correlated (Tipton et al., 2018, 2019). Using randomized controlled trials published in peer-reviewed journals, by university-based authors, not reporting a funding source as the reference group, we find no significant differences for effects using quasi-experimental designs. However, studies using only matching or regression methods show differences in effects that are large in magnitude in both subjects (−0.38 SD in math and −0.24 SD in ELA). Due to these differences and because we consider these methods less credible for generating causal estimates, we control for the use of this method in all future results and confirm that the effects on test and nontest outcomes are not driven by the use of matching or regression methods (see Table 3). We find no differences in effect size estimates based on author(s) affiliations or source of study funding and no differences between working papers and peer-reviewed publications.
Pooled Effect Size Estimates by Study Characteristics
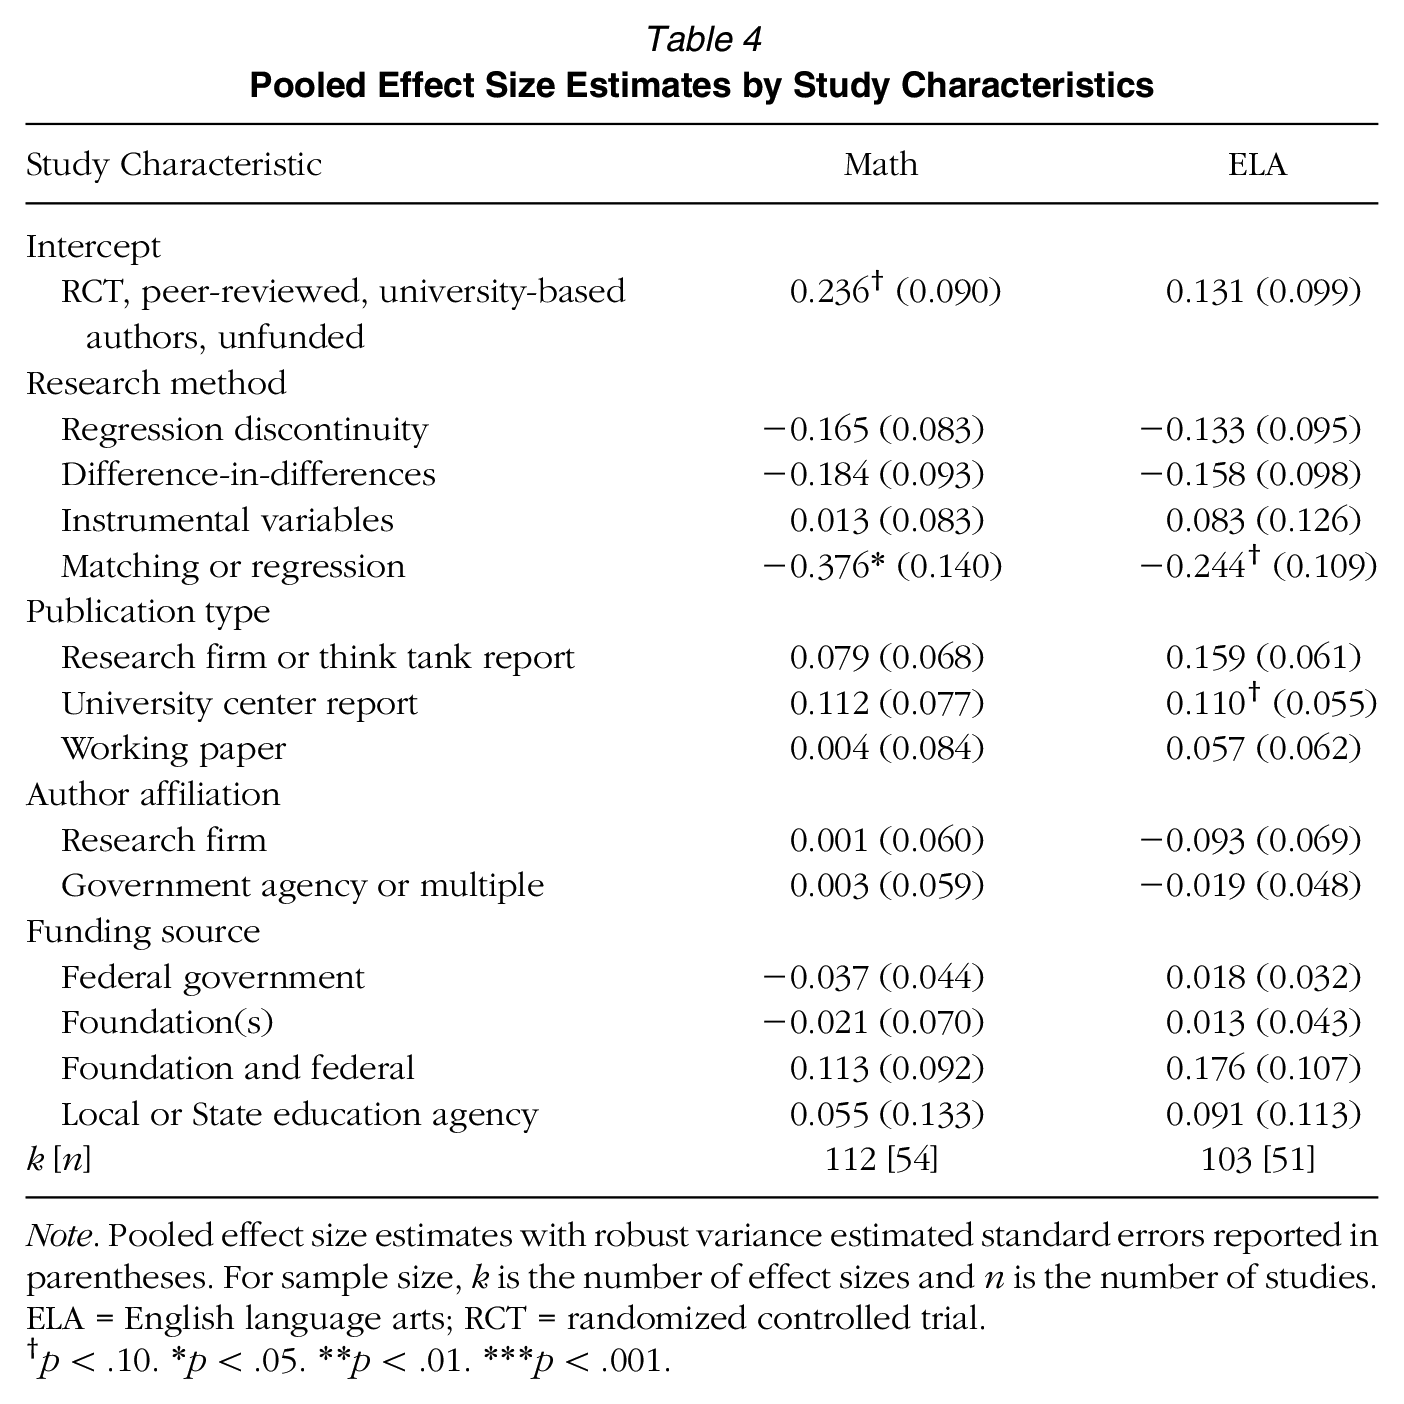
Note. Pooled effect size estimates with robust variance estimated standard errors reported in parentheses. For sample size, k is the number of effect sizes and n is the number of studies. ELA = English language arts; RCT = randomized controlled trial.
p < .10. *p < .05. **p < .01. ***p < .001.
Features of Effective Interventions
We next explore whether various features of the interventions that our studies evaluated meaningfully predict variation in effects on test scores. First, we compare the four major intervention categories: turnaround, labeling, charter conversion, and closure, and display results in Table 5 where turnaround studies serve as the comparison group. Charter conversion appears more effective in both subjects than turnaround while closure appears somewhat less effective in math, though none of the differences achieve statistical significance. Closure estimates here include both effects for students in closed schools and in schools receiving students from closed schools. Though our sample is not large enough to formally test differences, the qualitative pattern of results suggest closure effects are more positive on displaced students when they transfer to higher value-added schools (than closed schools). We also test whether effects vary for school- versus district-level interventions by adding a control for whether an estimate corresponded to a district-level policy. While these coefficients are not significant, possibly because few studies evaluated districtwide interventions, results suggest district interventions generate larger results on the order of 0.089 to 0.105 SD than school-level interventions. Differences in average effects between the four intervention categories are not explained by differences in intervention level.
Effect Size Estimates by Treatment Type
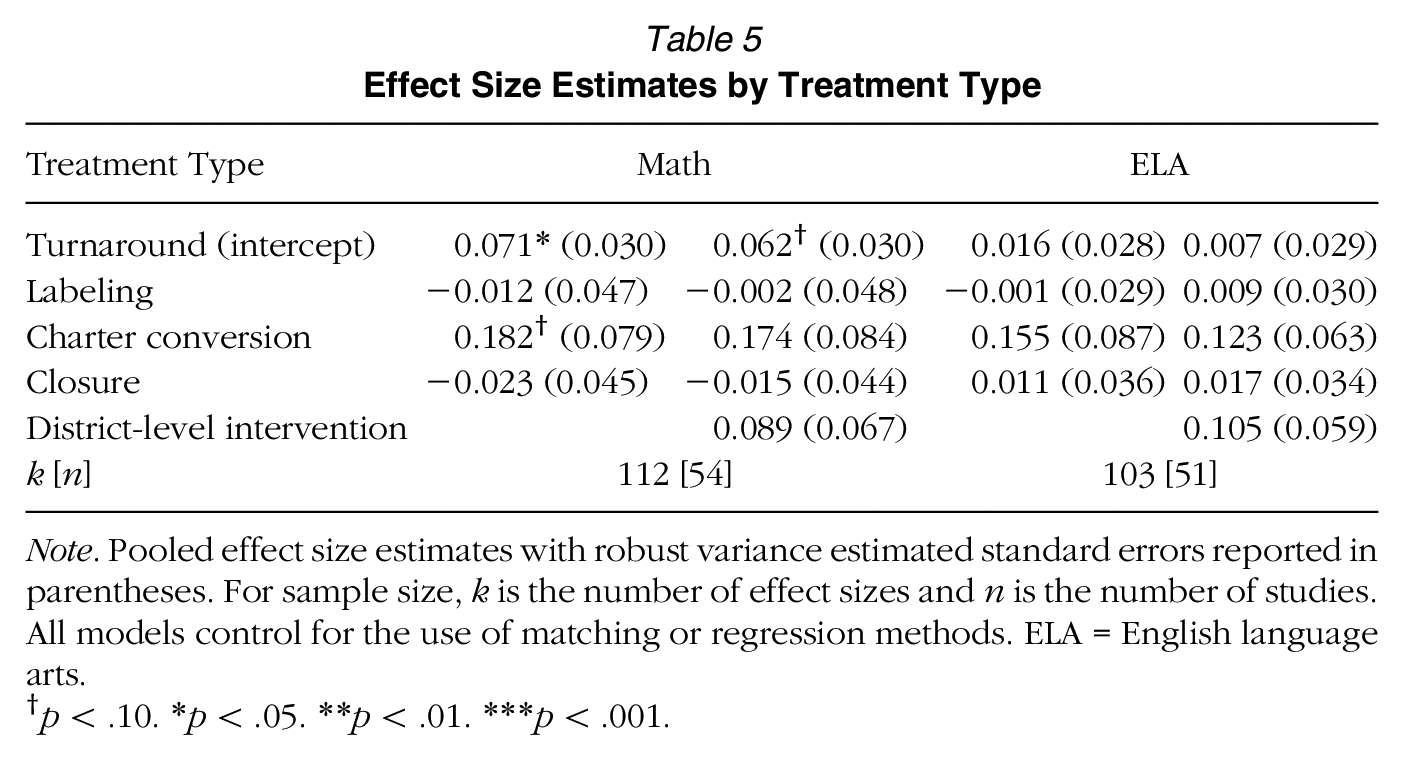
Note. Pooled effect size estimates with robust variance estimated standard errors reported in parentheses. For sample size, k is the number of effect sizes and n is the number of studies. All models control for the use of matching or regression methods. ELA = English language arts.
p < .10. *p < .05. **p < .01. ***p < .001.
Next, we turn to the more specific features of the interventions that our studies evaluated regardless of which of the four major categories of intervention was under study. We conduct a meta-regression model including all 14 intervention features. We display these findings visually in Figure 1—which provides an overarching summary of what we view as the key findings and contribution from our analysis—where we plot the “overall” average effect of school improvement interventions from Table 3, as well as the implied coefficients in the presence of each intervention feature. The bars colored grey represent differences where p < .10 when comparing the presence of that feature with evaluations without that feature. The features are sorted based on the magnitude of the differential feature effect in a given subject. We find two intervention features that appear to be particularly associated with greater reform effectiveness: extended learning time and teacher replacements. These findings are consistent across subjects. We find no significant differences in effects for reforms that included school choice, professional development or technical assistance for teachers or administrators, HR changes, tutoring, governance change, wraparound services, curricular changes, new funding, change in manager, and data use. Principal replacements are associated with negative effects when controlling for all other intervention features, though the coefficient only achieves statistical significance for ELA.
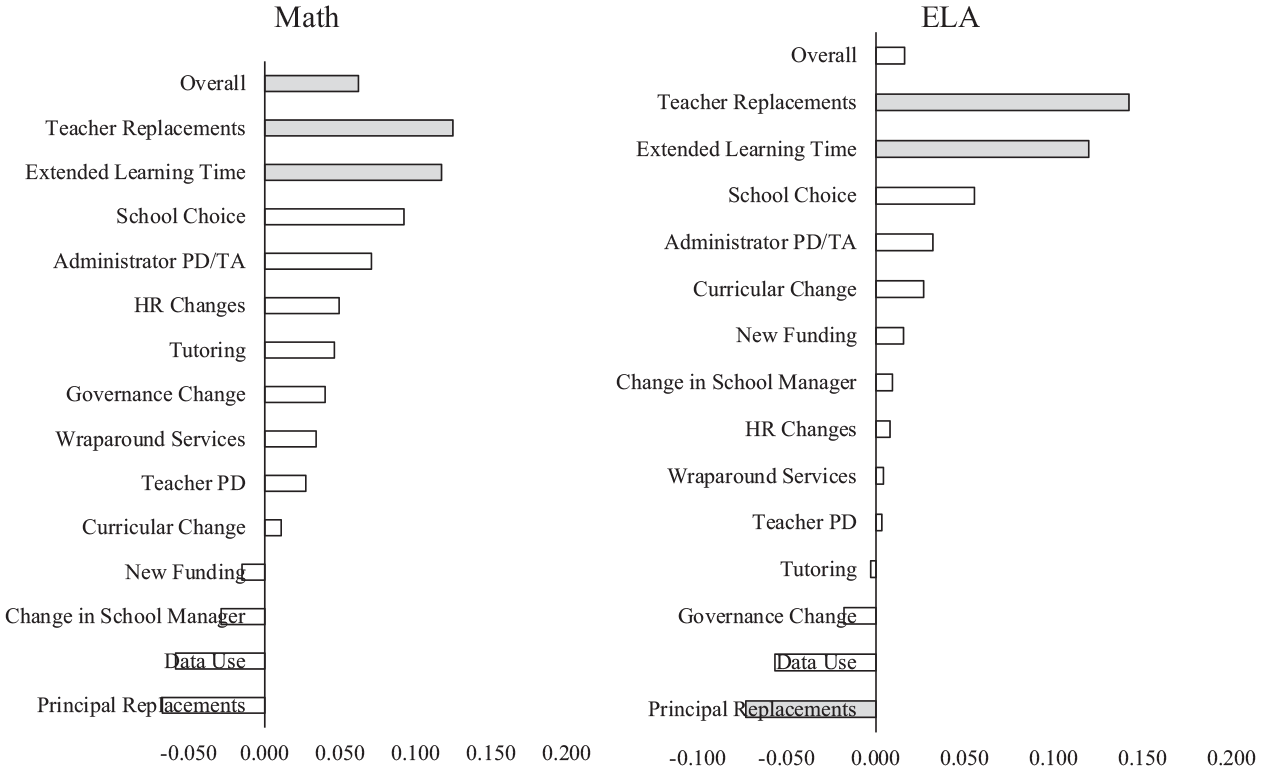
Effects overall and by school improvement intervention features.
Features of Effective Intervention Contexts
In Table 6, we display results on whether improvement efforts were more successful in some contexts than others. We find that efforts were more effective at improving math achievement in schools or districts serving majority-Latina/o student populations, even after controlling for whether a majority of the population qualified for subsidized lunch, producing effects 0.229 SD larger than those interventions implemented in majority White, nonmajority subsidized lunch contexts. ELA effects are also larger in majority-Latina/o contexts by 0.082 SD, though this difference is not statistically significant. Effects are also somewhat larger in districts serving majority-African American student populations by 0.070 SD in math and 0.033 SD in ELA though neither of these coefficients are statistically significant. We do not find that interventions produced different effects for populations where a majority of students qualify for subsidized lunch.
Effect Size Estimates by Demographics of Student Population and Intervention Features
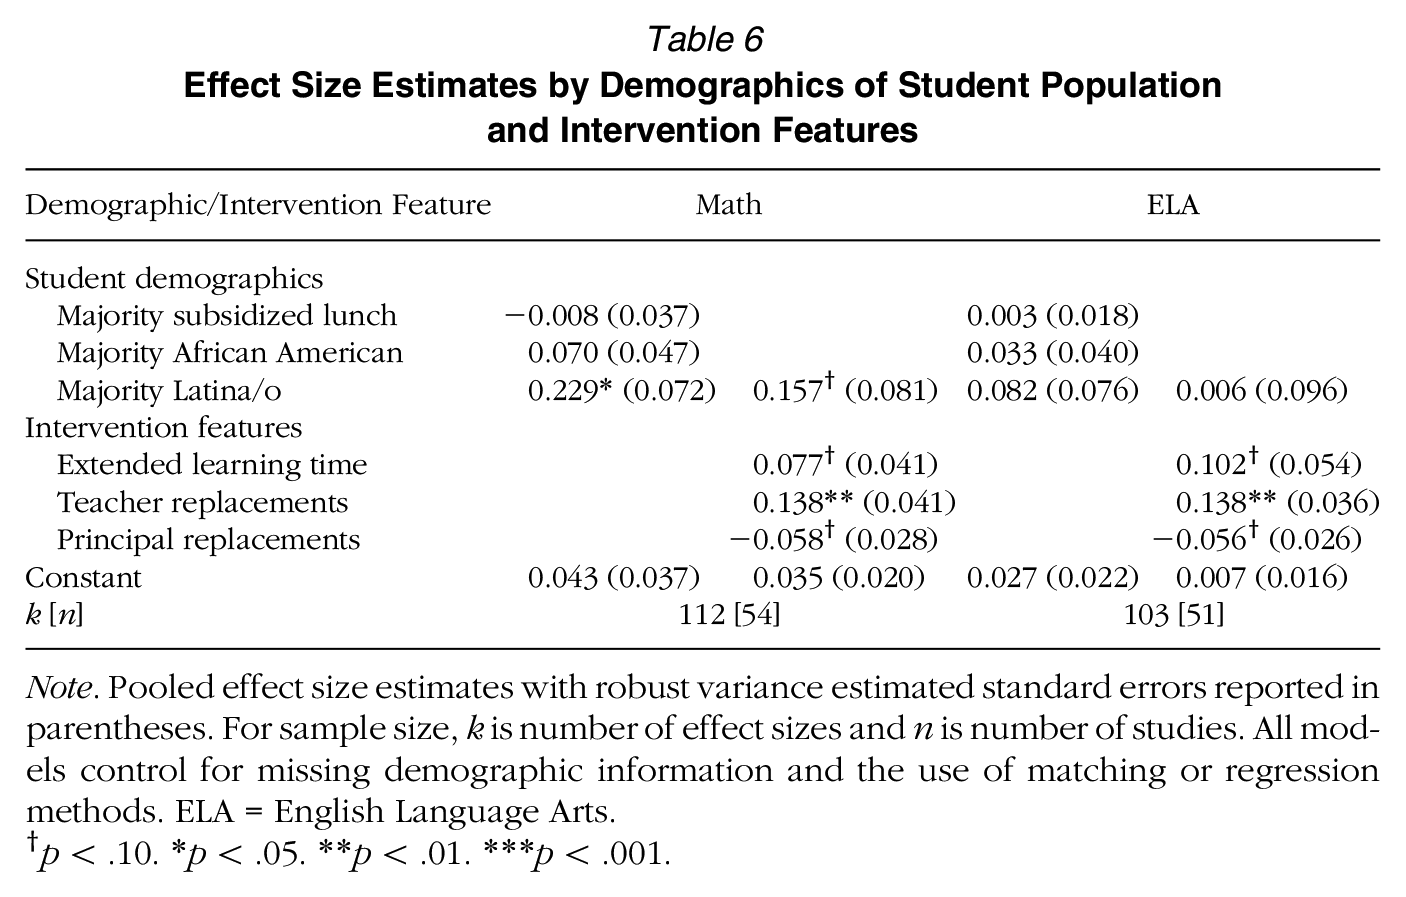
Note. Pooled effect size estimates with robust variance estimated standard errors reported in parentheses. For sample size, k is number of effect sizes and n is number of studies. All models control for missing demographic information and the use of matching or regression methods. ELA = English Language Arts.
p < .10. *p < .05. **p < .01. ***p < .001.
Next, we include both the contextual factors and the intervention features that appear to be most predictive of achievement gains in a meta-regression to see whether these relationships hold up given the possibility of confounding. For example, it may be that teacher replacements were more common in majority Latina/o districts, not that demographics predicted policy impacts. We display results in columns 2 and 4 of Table 6. We find that both extended learning time and teacher replacements continue to predict achievement gains in both math and ELA when controlling for whether the intervention was implemented in a majority Latina/o context. The negative relationship between principal replacements and achievement also persists in both subjects. In math, gains continue to concentrate in majority Latina/o contexts, even when controlling for the three key intervention features although the magnitude of the relationships is somewhat attenuated to 0.157 SD. In ELA, we see no relationship between the demographic makeup of the context and achievement gains when accounting for intervention features.
Dosage of Effective Interventions
Another important debate in the literature on school improvement is related to the length of intervention necessary to achieve results. In Table 7, we demonstrate that positive effects appear, on average, even among those interventions that have been implemented for only a single year in both math and ELA, however, none of these coefficients are statistically significant. In both subjects, the effects appear slightly larger for interventions implemented for longer periods of time (2 or 3 or more years), though again these differences do not achieve statistical significance. When we restrict the sample to those studies examining interventions we classified as “turnaround” (excluding labeling, closure, and charter conversion studies), we find that ELA gains do not emerge until Year 2 and even evidence of small negative effects in Year 1. However, again, none of these differences are statistically significant so we are limited in our ability to draw strong conclusions on this topic. We interpret these results to suggest that it is not impossible for school improvement efforts to demonstrate results within the first year of implementation, however, greater duration does appear to be associated with greater results. Finally, we test whether “less is more” when it comes to school turnaround and find the opposite—the larger the number of intervention features highlighted for a particular treatment, the larger the effects. In math, each additional intervention feature is associated with 0.03 SD larger effects (see Table 7). In ELA, the difference is 0.02 SD. The relationship between number of features and effects does take on a linear functional form and remains present among the subset of estimates evaluating turnaround interventions.
Effect Size Estimates by Treatment Dosage
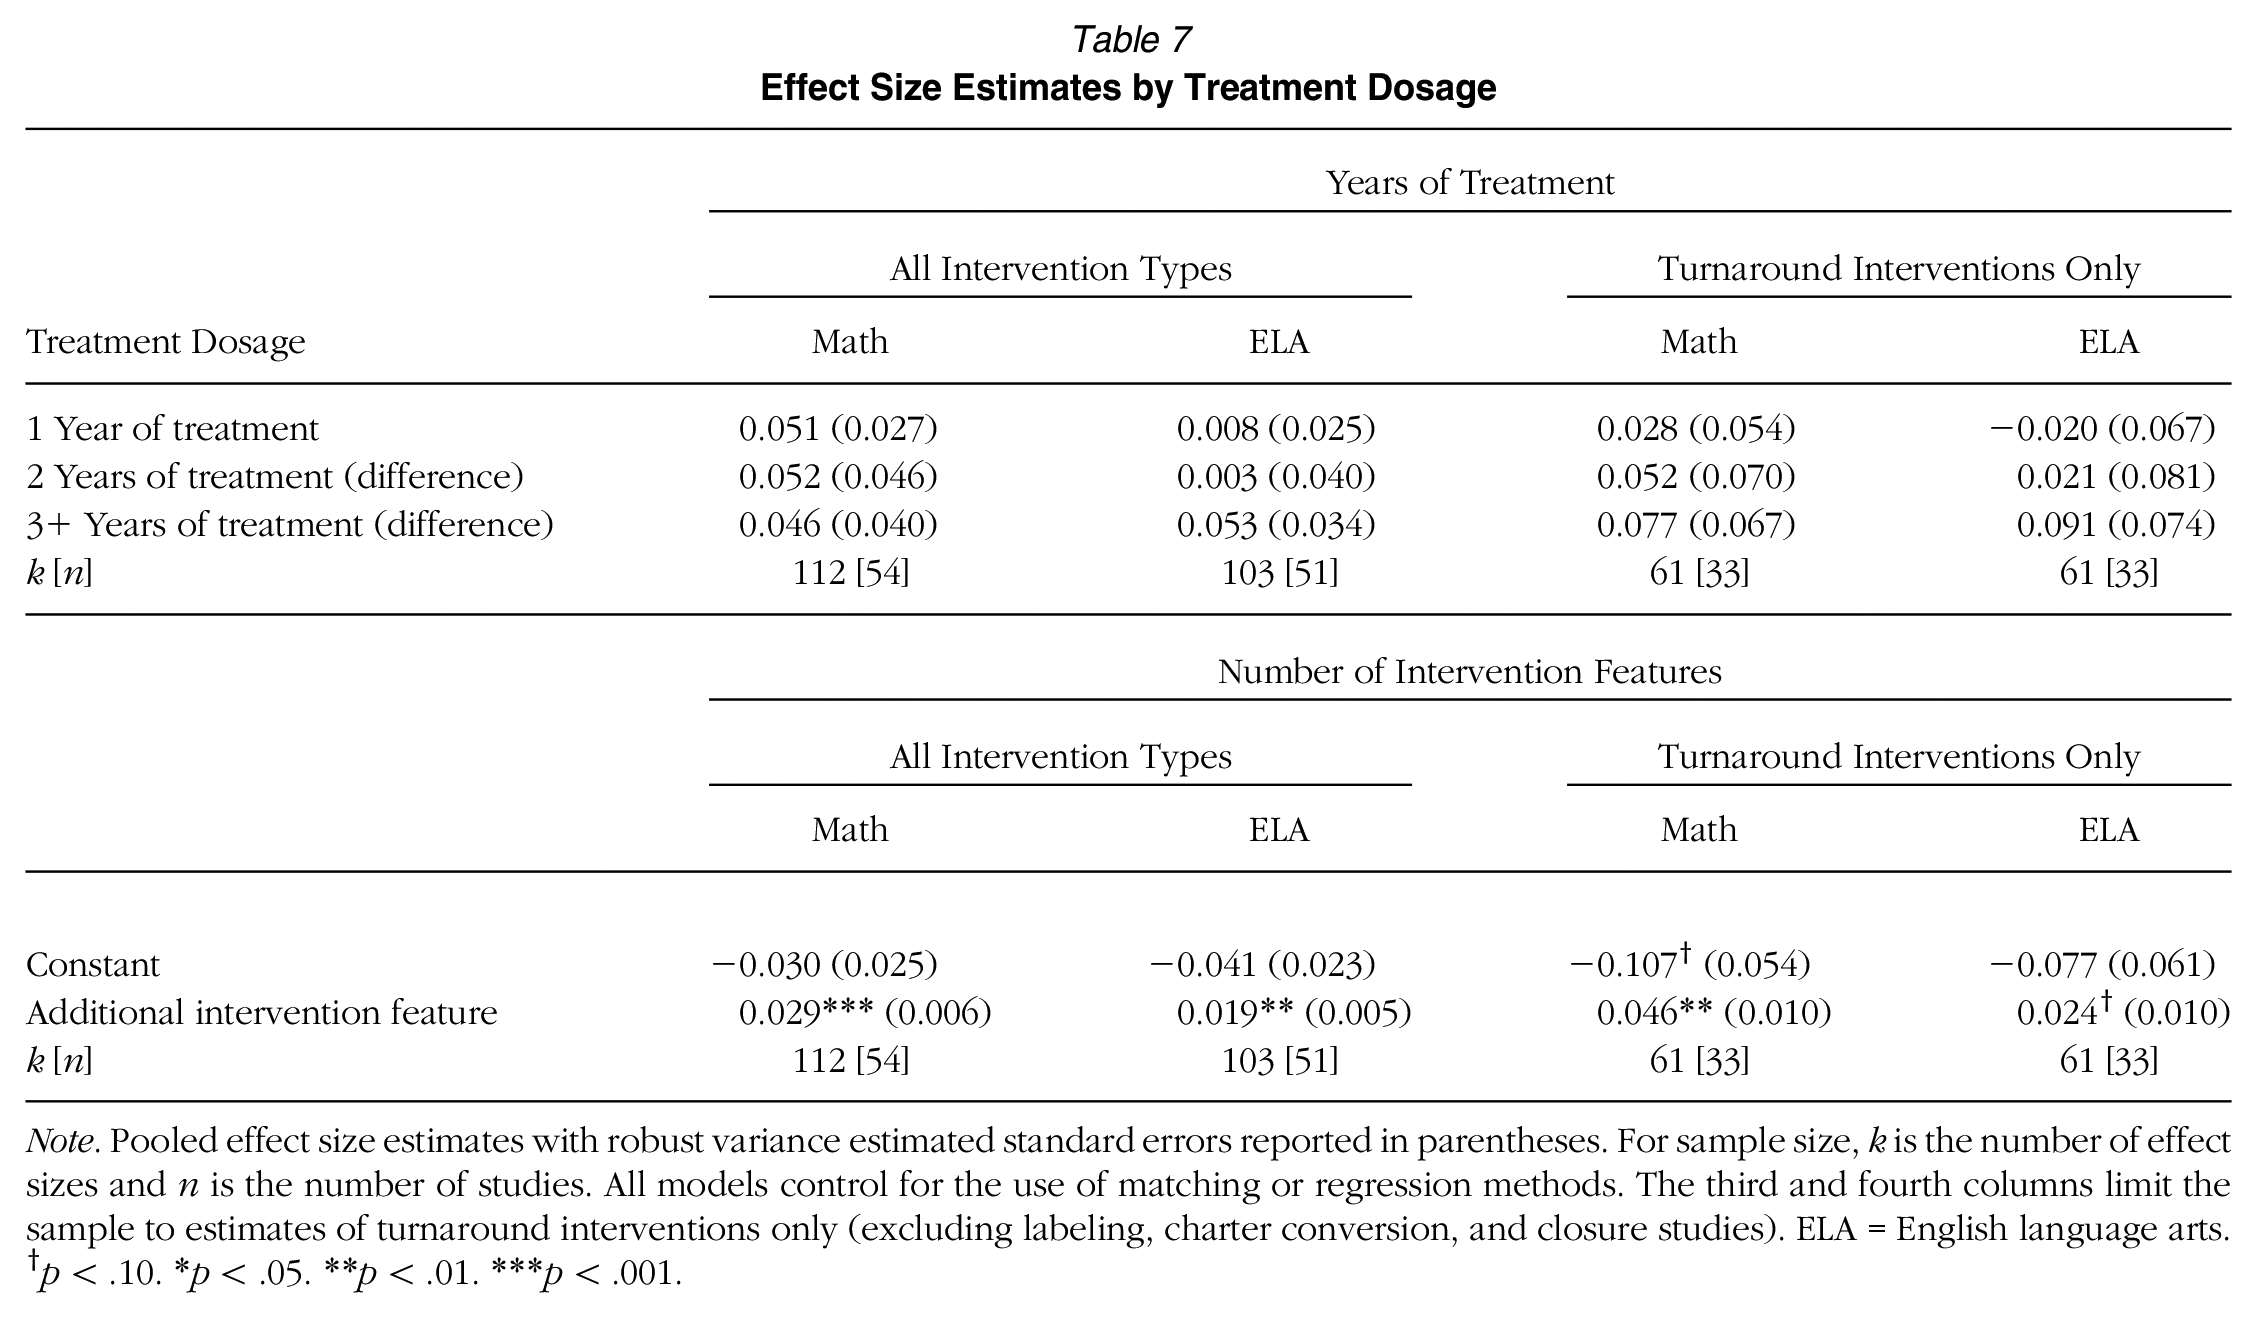
Note. Pooled effect size estimates with robust variance estimated standard errors reported in parentheses. For sample size, k is the number of effect sizes and n is the number of studies. All models control for the use of matching or regression methods. The third and fourth columns limit the sample to estimates of turnaround interventions only (excluding labeling, charter conversion, and closure studies). ELA = English language arts.
p < .10. *p < .05. **p < .01. ***p < .001.
Publication Bias
We next examine the extent to which our findings could reflect publication bias. For example, researchers may be less likely to report or submit null or nonsignificant results for publication and journals may be less likely to publish them. If these phenomena were occurring, we would expect the pooled effects in our sample coming from peer-reviewed journal articles to be larger than those from working papers or other nonpeer-reviewed outlets. As we saw in Table 4, estimates from working papers are not statistically different from peer-reviewed journal articles. If anything, effects from research firm and university-based center reports are somewhat larger than those from peer-reviewed journals, though these differences do not consistently achieve statistical significance.
In the absence of publication bias and conditional on the uniformity of interventions under study, we should expect to see a distribution of effect sizes and standard errors, with the most precise studies estimating effects near our average, and less precise studies showing a symmetric, wider spread of effect estimates (Duval & Tweedie, 2000). We plot this graphically in a series of funnel plots (see Supplemental Figure A3 in the online version of the journal) by major type of intervention. The symmetrical pattern is generally true of the estimates included in our sample although more so for the labeling and closure interventions than turnaround and charter conversion. We formally test for asymmetry using Egger’s test (Egger et al., 1997). Recent research has found that the traditional Egger’s test applied to standard mean difference outcomes can have inflated Type I error (Pustejovsky & Rodgers, 2019), particularly in the presence of dependent effect sizes and treatment effect heterogeneity (Rodgers & Pustejovsky, 2020). To address this, we considered two variations on the Egger’s test that have been shown in simulations to control Type I error—aggregation and application through RVE (Rodgers & Pustejovsky, 2020) Results (see Supplemental Table A1 in the online version of the journal) indicate the potential presence of publication bias for math and ELA using one approach but not the other.
In light of these mixed results, we highlight two reasons our studies’ estimates might differ from the expected pattern even in the absence of publication bias. First, publication bias tests assume a single “true” effect and variation across studies due to sampling. This is plausible for labeling or closure interventions, but “turnaround” is a broad category of intervention. We would thus anticipate these studies to have a wider range of “true” effects than many other subjects of meta-analysis. These differences are also reflected in the Egger’s test, which does not find evidence of bias when we limit to studies of labeling and closure. One typical motivation for meta-analysis has been to pool estimates from a series of small sample studies to improve statistical power. Many of our studies already have high statistical power because they rely on quasi-experimental methods and student-level administrative data. Thus, we see a larger congregation of precisely estimated effects than would be expected in a meta-analysis of small randomized controlled trials. In sum, we are not entirely able to rule out the possibility of publication bias. However, we are also unable to rule out the possibility that the patterns we observe are due to the diversity of interventions under study and resulting true variation in effects. Indeed, meta-analytic methodologists have found that it can be difficult, if not impossible, to disentangle publication bias from true heterogeneity of effects (Peters et al., 2010).
Robustness Checks
We test the sensitivity of our results to a number of coding decisions and display results (see Supplemental Table A2 in the online version of the journal). Overall, our findings are robust to these researcher decisions and consistent across specifications. First, a handful of studies did not report precise sample sizes at the intervention level, needed for the Hedges correction. We inferred sample size based on publicly available information. In other cases, authors reported p values and we inferred standard errors using the maximum possible t-statistic (Cooper, 2010). We also estimated pooled effect sizes after limiting our sample to studies for which we did not infer.
To ensure outliers were not driving findings, we estimate pooled effect sizes after excluding the top and bottom 5% of effects in our sample and again find our conclusions unchanged (though for ELA, the effect achieves statistical significance). Some studies examined similar interventions implemented with similar populations but with slightly different samples or methods. To test whether this potential “double counting” of interventions could influence findings, we estimated pooled effect sizes after limiting our sample to those studies that had no overlap in the samples under investigation. Finally, we considered methodological decisions made by our study samples’ authors. We tested whether results were consistent after limiting our sample to those studies using student-level data, using statewide data, correctly clustering standard errors at the level of treatment, and using methods that did not give us major cause for concern regarding internal validity.
Discussion
This comprehensive meta-analytic review of post-NCLB efforts to improve low-performing U.S. schools establishes that observers cannot credibly claim that nothing works for improving struggling schools. On average, school improvement policies that have been subjected to evaluation demonstrated positive effects on high-stakes math achievement and low-stakes performance in STEM and humanities subjects. These effects are medium in size—neither radically transformational nor trivial (Kraft, 2020), at least within the short-term periods for which most researchers working in this literature have documented intervention results. We find no evidence that these reforms hurt ELA achievement on high-stakes tests or nontest outcomes, although more should be done to examine long-term impacts. We also find suggestive evidence that it is indeed possible for school improvement efforts to generate gains after a single year of implementation, at least in the post-NCLB environment. However, gains do appear to increase the longer interventions are in effect and it remains unclear what is needed to sustain gains.
Additionally, the district-level interventions in our sample appear more effective than school-level ones, though the difference is not significant. This finding is consistent with theory identifying districts as important for supporting capacity building in schools (e.g., Carnoy et al., 2003; Cohen & Hill, 2008; Honig & Hatch, 2004; Johnson et al., 2015). Alternatively, it is possible the districts selected for districtwide intervention were more ripe for the reforms under study than the individual schools. We also find no evidence of the “less is more” theory; greater numbers of intervention features are associated with larger positive effects. However, we cannot rule out the possibility that authors highlighted more intervention features or reformers kept better track of those features in contexts where efforts were successful.
In terms of describing the policy features of effective school improvement efforts, our findings show that extended learning time and teacher replacements seem particularly promising—including for generating gains in reading. It is not surprising that one of these features relates to instructional quality given the well-established importance of teacher effectiveness in explaining student short and longer term success (e.g., Chetty et al., 2011). However, we cannot speak to the manner in which teacher replacements were instantiated, and the value of such a reform may be dependent on who is replaced and the existing supply of available higher performing teachers. Despite the literature on the importance of school leaders, we find that once controlling for other intervention features, principal replacements actually are associated with more negative program impacts. Our findings are also consistent with a literature on the value of additional learning time, particular for low-performing students.
Our results are largely consistent with recent work by Redding and Nguyen (2020) who found positive average effects for school improvement using a subset of the studies included here. They report positive effects for the federal “restart” model (consistent with our finding on charter conversions), the “turnaround” model which required principal and teacher replacements, as well as the “transformation” model which required principal but not teacher replacements. Because the federal “transformation” approach can include a wide range of features, it is difficult to interpret the positive effects that Redding and Nguyen (2020) find. For example, the authors conclude that their results, “do not indicate whether or not staff reconstitution is needed to bring about meaningful change . . . or whether replacing the principal is sufficient” (p. 510). We are able to isolate that teacher rather than the principal replacements are associated with the greatest gains, and also shed light on the promising role of extended learning time, relative to other common intervention features. These scholars also found no evidence of a significant relationship between school closure and test scores, again consistent with our results, though we highlight variation in closure effects depending on the relative quality of a student’s new school.
It is important to keep in mind that the studies in our sample often estimate the effect of intervention relative to the threat of intervention. Comparison groups are typically (intentionally) also very low performing. Therefore, our results should not be taken as a summary of the effects of broader accountability policies. For example, we do not find that governance changes are associated with greater effectiveness. That does not mean, however, that the threat of a state takeover or a charter conversion could not meaningfully improve school performance.
We are limited to studying the interventions that have been rigorously studied as a vehicle for improving low-performing schools. For example, race-based integration or redrawing of attendance zones could be effective methods for improving schools even though these are not typically described as “turnaround” policies. However, we did not come across studies of these approaches that met our inclusion criteria. Furthermore, we cannot fully rule out the possibility that our estimates overstate the true effect of the full universe of interventions that have targeted low-performing schools if researchers are more likely to study effective policies.
An important area for future research would be to use these impact estimates to explore which intervention features are most cost effective and scalable. Although school improvement efforts have on average generated gains, those who argue “nothing works” could still be correct in practice if the most effective interventions are cost prohibitive. However, our findings suggest the opposite is true given that interventions involving large amounts of new funding were not more effective than those without it—but this issue should be explored more thoroughly.
Many of the reforms evaluated in the studies included here focus on efforts to improve schools in the bottom of the performance distribution within a given state. A remaining question is whether turnaround impacts are larger (or smaller) among the very lowest performing schools in the country than among those schools that are low-performing relative to others in their state but not when compared with the country as a whole. For example, it may be easier to generate improvements to low-performing schools in the relatively low-performing state of Louisiana than low-performing schools in the relatively high-performing state of Massachusetts, as these schools are so low-performing that their performance has nowhere to go but up. On the other hand, it could be the case that low-performing schools in Massachusetts may start out more advantaged relative to the rest of the nation in such a way as to make them easier to improve. Because either scenario is plausible, future research should explore whether effects vary based on where turnaround schools’ baseline performance falls on the national distribution—to do this, of course, would require nationally normed data that allow for such comparisons.
Finally, the variation in school improvement effectiveness based on the racial/ethnic makeup of the student population raises important questions. Why is it that effective turnaround efforts have been concentrated in predominantly Latina/o communities as opposed to majority-African American or low-income school systems? Interestingly, this finding is consistent with another recent study examining variation in effects of state takeover of low-performing districts by community demographics (Schueler & Bleiberg, 2022). This review reveals an urgent need to better understand how policymakers can more successfully improve low-performing schools serving African American communities. The next generation of school improvement research should continue examining what works for whom so leaders can effectively tailor their policy efforts to the contexts in which the lowest performing schools are operating. This may require cross-context work given the often-homogeneous makeup of student populations within a given turnaround context. Understanding these issues is critical to improving the institutions serving some of our nation’s most vulnerable children and ultimately to narrowing persistent race- and class-based opportunity and outcome gaps.
Supplemental Material
sj-pdf-1-aer-10.3102_00028312211060855 – Supplemental material for Improving Low-Performing Schools: A Meta-Analysis of Impact Evaluation Studies
Supplemental material, sj-pdf-1-aer-10.3102_00028312211060855 for Improving Low-Performing Schools: A Meta-Analysis of Impact Evaluation Studies by Beth E. Schueler, Catherine Armstrong Asher, Katherine E. Larned, Sarah Mehrotra and Cynthia Pollard in American Educational Research Journal
Footnotes
Notes
B
C
K
S
C
References
Supplementary Material
Please find the following supplemental material available below.
For Open Access articles published under a Creative Commons License, all supplemental material carries the same license as the article it is associated with.
For non-Open Access articles published, all supplemental material carries a non-exclusive license, and permission requests for re-use of supplemental material or any part of supplemental material shall be sent directly to the copyright owner as specified in the copyright notice associated with the article.