
Abstract
Before the 2020–2021 school year, policymakers and parents confronted the uncertain trade-offs implied by the health, educational, and economic consequences of offering instruction remotely, in person, or through a hybrid of the two. Most public schools in the United States chose remote-only instruction, and enrollment fell dramatically (i.e., a loss 1.1 million K–12 students). We examine the impact of these choices on public-school enrollment using panel data that combine district-level information on enrollment and instructional mode. We find offering remote-only instead of in-person instruction reduced enrollment by 1.1 percentage points (i.e., 42% greater disenrollment). The disenrollment effects of remote instruction are concentrated in kindergarten and, more modestly, elementary schools. We do not find evidence that hybrid instruction had an impact.
Keywords
In the summer of 2020, educators and parents in the United States faced an exceptionally difficult choice with regard to how they should deliver instruction for the 2020–2021 school year (i.e., remote, in-person, or a hybrid of the two). The number of new confirmed COVID-19 cases had risen to record heights in July of 2020, and an even more substantial “second wave” of infections was (as it turned out, correctly) anticipated for the coming winter. In addition, at that time, the timeline for availability and the effectiveness of the currently available vaccines were highly uncertain. These factors motivated grave concerns about the health risks of bringing students, teachers, and staff together for a conventional academic year of in-person instruction. 1 However, the potentially serious consequences of not doing so were also widely discussed (e.g., Oster, 2020). In particular, for many parents, having children spend most or all of the 2020–2021 school year at home would seriously amplify the disruption to their labor force engagement and exacerbate household stress by denying childcare and other supports. Furthermore, there was wide concern that the absence of full-time, in-person instruction would dramatically harm both the intellectual development and the social and emotional well-being of children while conveying only modest health benefits to younger children who appeared less susceptible to COVID-19.
Faced with these difficult trade-offs, most states chose not to make a universal decision about reopening public K–12 schools and instead left the decision to local school districts, who largely chose to offer remote instruction (Kurtz, 2020). Specifically, in the fall of 2020, 57% of students in district public schools experienced remote-only instruction, with 24% in in-person instruction and 19% in a hybrid model (Henderson et al., 2021). By way of contrast, only 18% of private school students reported they were fully remote at this time (Henderson et al., 2021). Surveys also suggest that these instructional choices largely tracked both parents’ and teachers’ preferences at the time (Collins & Nuamah, 2020; Will, 2020). A contemporaneous report from the National Academies of Science, Engineering, and Medicine (NASEM; 2020) struck a contrarian note and emphasized the importance of in-person instruction for younger students. The report concluded, on the basis of competing health and educational risks, that schools “should prioritize reopening with an emphasis on providing full-time, in-person instruction in grades K–5.” However, the learning modes chosen by U.S. public schools exhibited relatively little variation by grade. For example, 48% of K–2 students were in remote-only models, while 37% were in-person (Henderson et al., 2021).
The short- and longer-term economic and educational consequences of these school-reopening decisions (and the COVID-19 pandemic, more generally) are important and will be carefully studied as diverse sources of relevant data become available. However, one important leading indicator reflects the enrollment decisions made by parents for the 2020–2021 school year. Public-school enrollment at the K–12 level, which typically increases by a fraction of a percentage point annually, fell by over 2% in the fall of 2020, a striking 1-year loss of roughly 1.1 million students (Goldstein & Parlapiano, 2021). 2 These declines were larger in elementary and middle school grades and particularly dramatic in kindergarten, which is not required in most states. This study examines the impact of the school-reopening decisions made by 875 public-school districts (i.e., remote only, in-person, or a hybrid) on their enrollment levels, drawing on unique data sources that track district enrollment trajectories by grade level as well as the instructional mode chosen by districts for the 2020–2021 school year. Our analytical sample encompasses over a third of the national K–12 population and oversamples higher-enrollment (and, by implication, urban) districts.
Parents balanced a variety of considerations (i.e., health, academic, and logistic concerns) when choosing whether to enroll their child in their public-school district in fall 2020. These varied factors imply that the effects of instructional mode on enrollment are theoretically uncertain. For example, some parents may have been comparatively likely to keep their child enrolled in a district that offered only remote (or hybrid) schooling if they viewed it as a way to safeguard the health of their children and their families (i.e., by reducing the risk of COVID-19 infection and household transmission implied by in-person schooling). Furthermore, district decisions to offer alternatives to traditional instruction could have reinforced this sort of response by creating a salient signal of the risks associated with face-to-face instruction (i.e., an inferred recommendation). Alternately, in the spirit of the “Peltzman Effect” (Peltzman, 1975), parents may have responded to the externally imposed risk reduction implied by a switch to hybrid and remote-only instruction with risk-compensating behaviors (i.e., disenrolling and seeking in-person instruction for their children).
Furthermore, the childcare burdens created when school districts did not offer in-person instruction may have encouraged some public-school parents to disenroll their children. This factor could be considerably more relevant in households with younger children to the extent that younger children require more intensive care and attention and were thought to be less likely to contract or transmit COVID-19 if attending in-person instruction (NASEM, 2020). For example, some parents opted to continue placing their kindergarten-aged children in daycare rather than formal schooling due to the burden created by remote-only instruction at home (Goldstein & Parlapiano, 2021).
Another potential mechanism involves perceptions of school quality. Parents of public-school students may have viewed virtual and hybrid schooling options as inferior and, as a result, disenrolled their children when face-to-face instruction was not offered. Such perceptions of the comparative appeal of remote-only instruction are likely to have been particularly acute among parents of younger children. Parents of the youngest students may have been uniquely concerned about their children’s capacity to engage in online instruction, the developmental harm of diminished socialization in these settings, as well as the loss of effective “day care.” Student engagement with online learning prior to the pandemic provides some indication of how parents viewed online and hybrid options. In particular, the prior take-up of remote-only schooling at the K–12 level was quite low. As of 2019, only 375,000 students (i.e., less than 1% of all public K–12 students) attended a fully online public school (Digital Learning Collaborative [DLC], 2020). Notably, most of this prepandemic take-up was among high school students. For example, only 4 of the 21 states with state virtual schools even offered online classes for elementary school students (DLC, 2020). The widespread introduction of remote-only instruction during the pandemic, therefore, constituted a radical shift in the scale of online learning, particularly for younger students.
Furthermore, strong concerns about the comparative effectiveness of full-time virtual and hybrid learning environments existed prior to COVID-19. While we know of no causal evidence on this question at the K–12 level, the available descriptive evidence is consistent with this concern. For example, graduation rates at remote-only high schools are 34 percentage points below the national average (Molnar et al., 2019). Other studies indicate that students experience poorer outcomes when taking a single course online at the high school level relative to receiving in-person instruction (Heinrich & Cheng, 2022; Heppen et al., 2017). Findings at the postsecondary level also suggest that remote instruction has negative effects on student learning (e.g., Bettinger et al., 2017), a result consistent with the limited evidence at the K–12 level.
Given these considerations, the impact of instructional mode on enrollment decisions is an empirical question that has policy relevance for two broad reasons. First, enrollment changes in response to the instructional mode chosen by school districts provide direct evidence on the revealed instructional preferences of parents across different grade levels and within the context of their local communities. Second, the enrollment effects of instructional modes can also provide insight into the varied educational consequences of these difficult policy choices. Such findings are relevant both for understanding the diverse educational consequences of the exceptional 2020–2021 school year and for informing the instructional challenges schools face in the coming years as they navigate ongoing debates over how to provide effective student instruction safely.
For example, the expectation that many, if not most, of the students who have left public schools will not return soon (or ever) has serious fiscal consequences for school districts. Districts with declining enrollment have already projected that “belt-tightening” and even school closures could be imminent once COVID-19 federal relief funds run out (Jacobson, 2022). Because most of the departing students appear to be younger, these financial consequences are also likely to be long-lived. Preliminary data for the 2021–2022 school year suggest that this is so. Most public-school districts continued to experience unusual enrollment loss in the 2021–2022 school year when compared with fall 2019 enrollment (Jacobson, 2022). To the extent that this disenrollment varies by location (e.g., urban vs. rural), or by racial and/or ethnic group, these COVID-19-era policies may also generate lasting changes to both the composition of public-school students and the underlying patterns of segregation among them.
The disenrollment from public schools also suggests how the pandemic and the policy responses to it have influenced students’ learning environments. More specifically, enrollment decline implies that, to some extent, students have either switched schools (e.g., to private schools or homeschooling), intend to skip or delay kindergarten, dropped out or become truant. Census and some state-specific data indicate that rates of homeschooling have increased dramatically during the pandemic (Eggleston & Fields, 2021; Musaddiq et al., 2021). The available research suggests that switching schools (in particular, moves that are “reactive”) has negative developmental consequences for student outcomes (e.g., Welsh, 2017). The negative consequences of dropping out of school are also well established (e.g., Card, 1999). The fact that enrollment declines during the pandemic were concentrated in lower grades suggests that dropping out of high school has not increased. However, in some states, the aggregate character of the enrollment declines creates some uncertainty. For example, a decomposition of the enrollment decline in Massachusetts suggests that more than 10% could be due to dropping out and truancy. This estimate reflects the residual decline that cannot be explained by prekindergarten and kindergarten disenrollment, transfers to private schools or homeschooling, out-of-state mobility, and demographic change (Dee & Murphy, 2021).
The grade-specific effects of school-reopening policies can also provide indirect evidence on their implications for teaching and learning. A broad consensus exists around the relevance of high-quality early-childhood education (e.g., Bassok et al., 2017; Heckman et al., 2010). The available evidence also indicates that spending more time in kindergarten (i.e., full-day vs. half-day) generally leads to improved student outcomes (Cooper et al., 2010). This suggests that students who skipped kindergarten may bring unique learning challenges to first grade (i.e., their first year of formal schooling). 3 However, if a substantial number of students “redshirted” into kindergarten in fall 2021 rather than attending first grade, it would instead imply an unusually large cohort with resulting consequences for the classroom context (i.e., older peers, large class sizes). In the long run, such “cohort crowding” combined with the relatively inelastic supply of higher education could attenuate postsecondary opportunities (Bound & Turner, 2007). In the next two sections, we describe the data and research designs we use to examine the enrollment effects of the instructional choices districts made for the 2020–2021 school year before turning to the results and conclusions.
Data
Our analysis relies on three broad types of data. First, using both state and federal sources, we constructed enrollment data by school district for each of the six school years from 2015–2016 through 2020–2021. The federal reporting requirements ask states to identify their enrollment counts on or close to October 1, a convention that is used in state-sourced data as well. For the first 5 years, these enrollment data are based on the federal source—the Common Core of Data (CCD) from the National Center for Education Statistics (NCES)—and state sources. Because of a reporting lag and some data quality considerations in the NCES reporting of district-by-grade enrollment data for the 2020–2021 school year, we relied on leading data collected directly from state-level departments of education (i.e., through web searches and staff contacts) nationally as part of the Stanford School Enrollment Project at Big Local News. Specifically, the key outcome measures are total district enrollment (i.e., K–12 and ungraded students, excluding prekindergarten and adult students) as well as enrollment by grade level (i.e., kindergarten, Grades 1–5, Grades 6–8, and Grades 9–12). This sample only includes traditional public-school districts and excludes administrative units and standalone charter-school networks. However, we note that these data include enrollment in charter schools authorized by traditional school districts.
In the data appendix in the online version of the journal, we describe these data in more detail. The appendix also discusses three overlapping quality-control assessments and the corresponding edits we implemented to ensure the accuracy and comparability of these data. First, we constructed year-on-year percentage changes in enrollment for every school district in our sample and examined individual districts where the absolute value of these changes met or exceeded a threshold of 10%. Second, we collected state-sourced district enrollment data for the 2019–2020 school year and compared these data to their federally sourced counterparts (Figure A1). Third, we compared state-sourced enrollment data for the 2020–2021 school year to a preliminary CCD release of 2020–2021 data, which only reported PK–12 totals at the district level. Fourth, as a robustness check, we replicated our main results using a CCD-only dataset on a consistent subset of districts. This check was feasible after the early 2022 release of provisional 2020–2021 district-by-grade enrollment from NCES. However, our main analysis continues to rely on a mix of state and federal data as the state-sourced enrollment totals in some states (e.g., Indiana, California) are more longitudinally consistent. Further details are provided in the data appendix. For most of the districts in our sample, these checks suggested both the reliability of within-district enrollment changes over time and a tight correspondence between data based on federal and state sources. However, this analysis also surfaced systemic differences in reporting conventions across these sources for school districts in 14 states as well as several instances of misreporting in specific district-year observations. We describe these issues and the corresponding edits in the appendix.
Our second key data source identifies district-level opening plans. Specifically, we rely on tracking data collected by Burbio, a private company. Burbio monitors the instructional mode status in nearly 1,200 school districts (including the nation’s largest 200 districts) by auditing data from “school district websites, Facebook pages, local news stories and other publicly available information.” They characterize districts by “the most in-person option available to the general student population” (i.e., in-person, remote-only, or a hybrid). Critically for our analysis, these data capture the differentiated adoption of grade-specific instructional modes within districts as well (e.g., in-person at the elementary level but remote-only at the high school level). Through an agreement with Burbio, we have acquired their raw district-level audit data on instructional mode at different points in time and by school level. 4
Burbio surveyed districts twice prior to the October 2020 enrollment census (i.e., August 24th and September 8th). Our variable construction reflects the fact that district opening plans changed over time and that we are interested in the district choice most relevant to parents’ fall enrollment decision. Therefore, we measure district opening plans using the audit on or directly preceding the school year start date recorded by Burbio. For districts that began instruction prior to August 24th (n = 264), we use the August survey. While other sources have assembled valuable data on instructional mode, the Burbio dataset has the broadest coverage of districts defined for our period of interest in late summer and early fall 2020. We also note that Burbio does not depend on self-reported data and that we compared the Burbio data to other independent sources on school-reopening polices and found it to be accurate (e.g., accurately identifying districts that received waivers from state policies).
Because our core analysis relies on the school-opening data collected by Burbio, their sampling strategy merits particular attention. The first stratum consists of the 232 most highly populated counties, which represent approximately 28% of all public-school enrollment in the nation. Within the counties in this stratum, they sampled school districts that represented about 90% of county enrollment (e.g., often the only school district in the county). The second stratum consists of another 228 highly populated counties, which account for 47% of all public-school students. Generally, Burbio audited 3 to 10 school districts in each of these counties. The final stratum consists of all other counties, which account for roughly 25% of the student population. Within this third stratum, Burbio audited a total of 130 school districts. This sampling strategy implies that the Burbio districts cover 47% of the public-school enrollment in the United States (i.e., roughly 35,000 schools in all 50 states). Our analytic sample includes, in turn, just over three quarters of the Burbio districts (i.e., those in states where 2020–2021 enrollment data are available; n = 875), which serve 35% of all public-school students. We discuss below how this sample compares to school districts nationally, as well as how our analysis explores the generalizability of the findings based on this sample.
Our third set of key data focuses on variables that varied over both location and time and may be relevant to district reopening plans and to parents’ decisions about public-school enrollment. We used measures from these data as controls in our main analysis and to explore the sensitivity of our findings to the inclusion of alternative covariates. To account for COVID-19 infection prevalence, we used a county-level rolling 7-day average of identified cases per 100,000 population from The New York Times Covid-19 data repository (2021), defined as of the district’s start date for the school year. As a check on this measure of COVID-19 prevalence, we also examined our results conditional on COVID-19 hospitalization data sourced from the U.S. Department of Health and Human Services (HHS) and found similar results (see the appendix in the online version of the journal). We also included state-level variables describing nonschool policy responses to Covid-19 compiled in the Oxford Covid-19 Government Response Tracker (OxCGRT) by the Blavatnik School of Government (Hale et al., 2021). These measures track state decisions with respect to stay-at-home orders, maximum gathering size, restrictions on public transportation and internal movement, workplace closures and other restrictions and recommendations that could influence school instructional mode and parent perception of local COVID-19 risk. As with the infection rate covariate, we estimated results using the policies in place at the school year start date.
Table 1 presents descriptive statistics for the key variables based on these three sources defined for our analytical sample of 875 districts observed over each of six school years (n = 5,250). We note that the enrollment data in our sample largely parallel national trends (i.e., slightly positive annual growth before declining roughly 3% in 2020–2021). In our sample, we found that half of the districts chose remote-only instruction, while the fractions choosing in-person and hybrid models were 27% and 23%, respectively. Most of these districts were also in states where some workplaces were closed and public events cancelled, while 39% had recommended restrictions on public transit. We relied on other time-invariant data to characterize the districts in our sample and to examine potentially heterogeneous responses to school-reopening choices. Specifically, we identified the share of children in poverty within each district using data from the Census Bureau’s Small-Area Income and Poverty Estimates (SAIPE) program defined for our baseline year, 2015–2016. We also used CCD data to identify the baseline racial and ethnic composition of each district’s students, as well as the prevalence of local education agency (LEA)–sponsored charter schools. More details on the construction of a supplementary dataset for enrollment disaggregated by racial and ethnic category can be found in the online appendix.
Descriptive Statistics
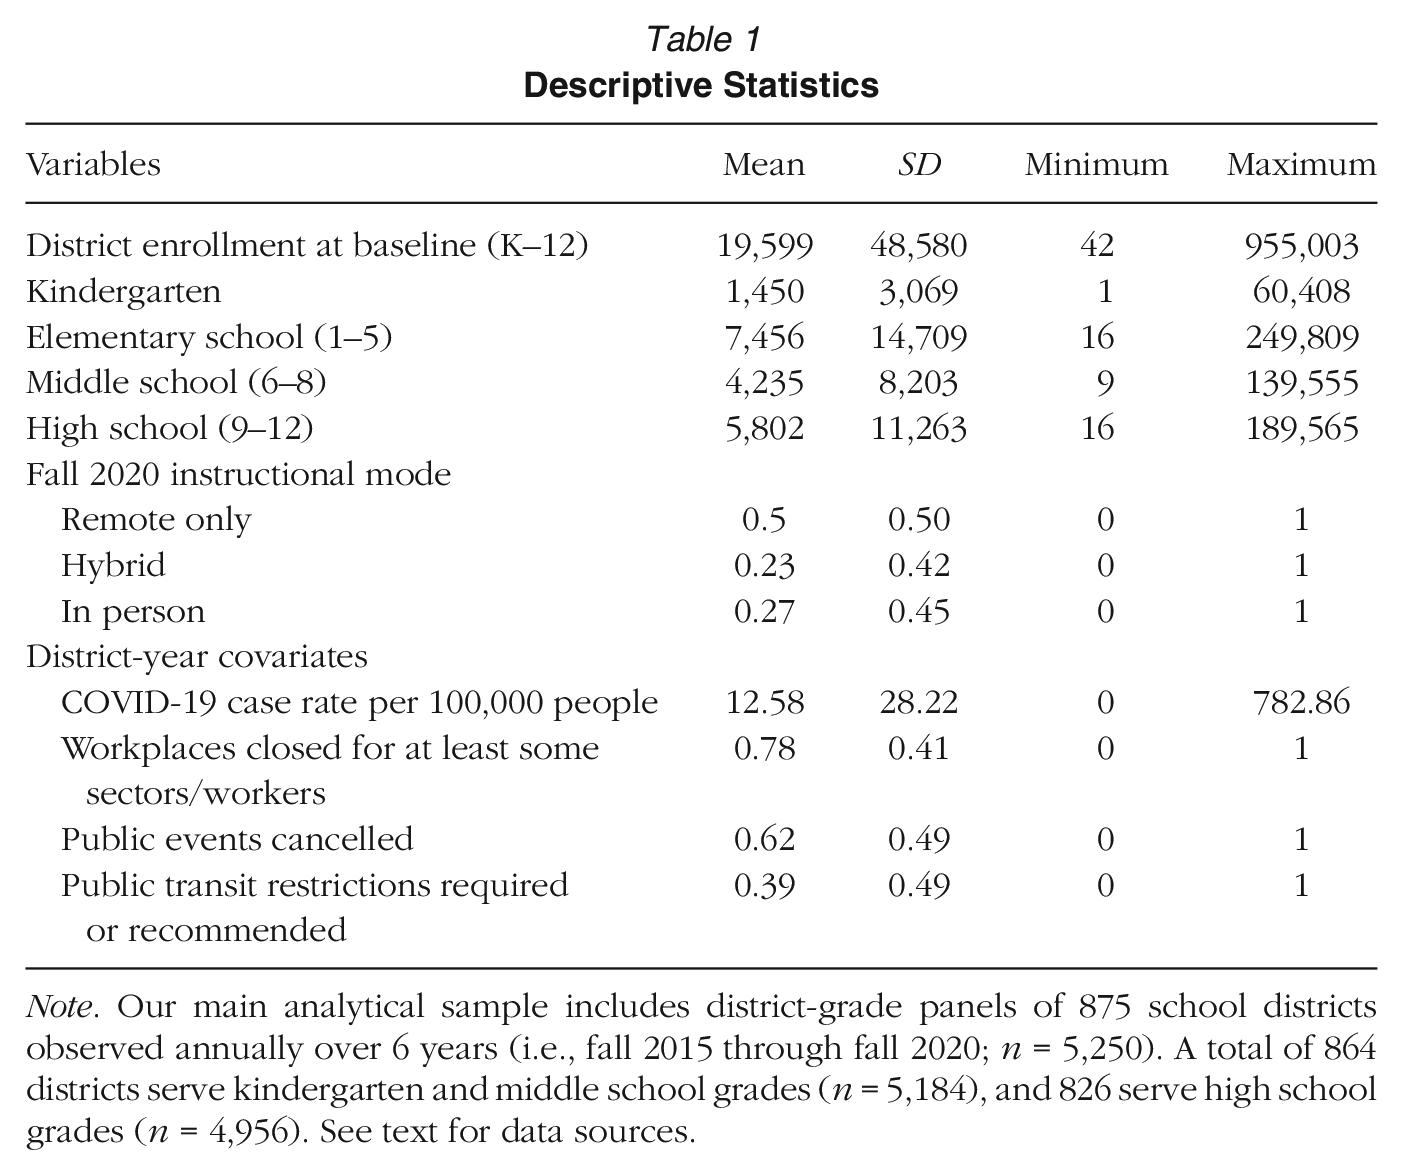
Note. Our main analytical sample includes district-grade panels of 875 school districts observed annually over 6 years (i.e., fall 2015 through fall 2020; n = 5,250). A total of 864 districts serve kindergarten and middle school grades (n = 5,184), and 826 serve high school grades (n = 4,956). See text for data sources.
We used the federal Education Demographic and Geographic Estimates (EDGE) data to classify district locales (i.e., urban, suburban, town/rural). Relative to the nation, the districts in our sample are more likely to be in urban or suburban settings (Table A1 in the online appendix). They also serve lower concentrations of white students and slightly higher concentrations of students in poverty (Table A1). We identified state-level kindergarten enrollment requirements using the Education Commission of the States (ECS) 50-State Comparison of K-3 Policies (ECS, 2020; Hale et al., 2021). We also used 2016 federal election data (i.e., the percentage of county votes for Donald Trump) from the MIT Election Data and Science Lab (MEDSL; 2018) to characterize partisanship in these communities. In ancillary analyses, we examined how our results vary across subsets of the analytical sample defined by these traits.
Method
Our first approach to examining the determinants of the natural log of enrollment in district d in year t (i.e.,
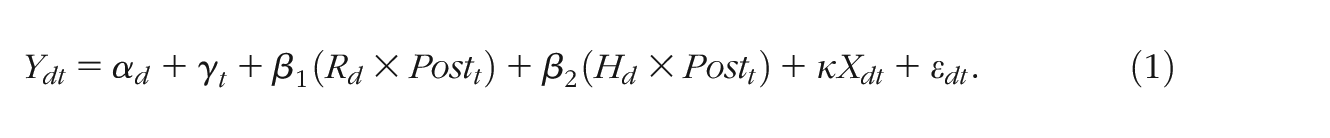
We allow remote-only (i.e.,
In this specification, the binary indicator,
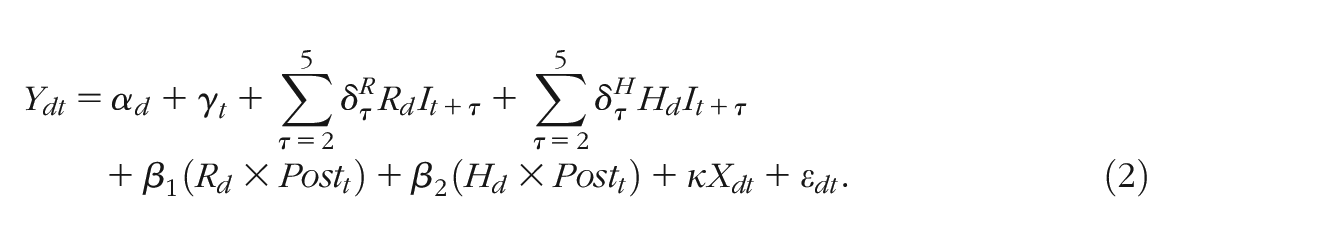
For the enrollment outcomes we study, we see clear evidence that the parallel-trends assumption is sometimes violated. In particular, school districts that chose remote-only instruction for the 2020–2021 school year tended to be larger, urban districts, which had distinctive comparative trends towards decreasing enrollment that preceded the COVID-19 pandemic (Figure 1; Table A2 in the online appendix). Failing to account for this prior trend could imply a negative bias in the estimated effect of remote-only instruction on enrollment. To address the implied internal-validity threat, we present estimates that control for prior, group-specific trends. In the program-evaluation literature, particularly in the fields of health and education, this approach is commonly understood as a comparative interrupted time series (CITS) design (Cook et al., 2002; Jacob et al., 2016). By way of contrast, the DD approach effectively relies on the comparison group’s change from its baseline mean as the relevant counterfactual. However, the CITS approach instead uses the comparison group’s change from its baseline trend. Specifically, a basic CITS specification for our context takes the following form:
where
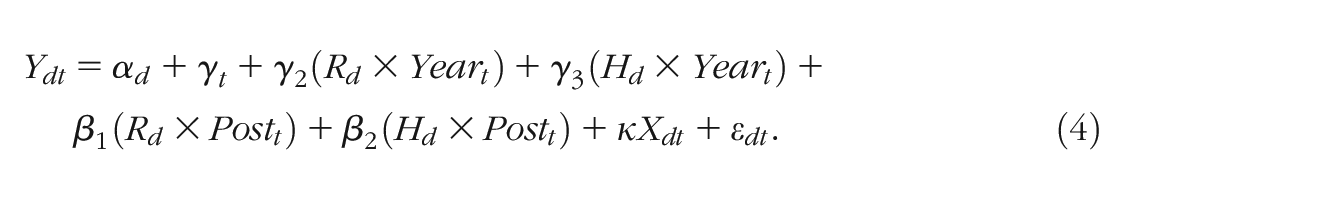
The coefficients of interest (i.e.,
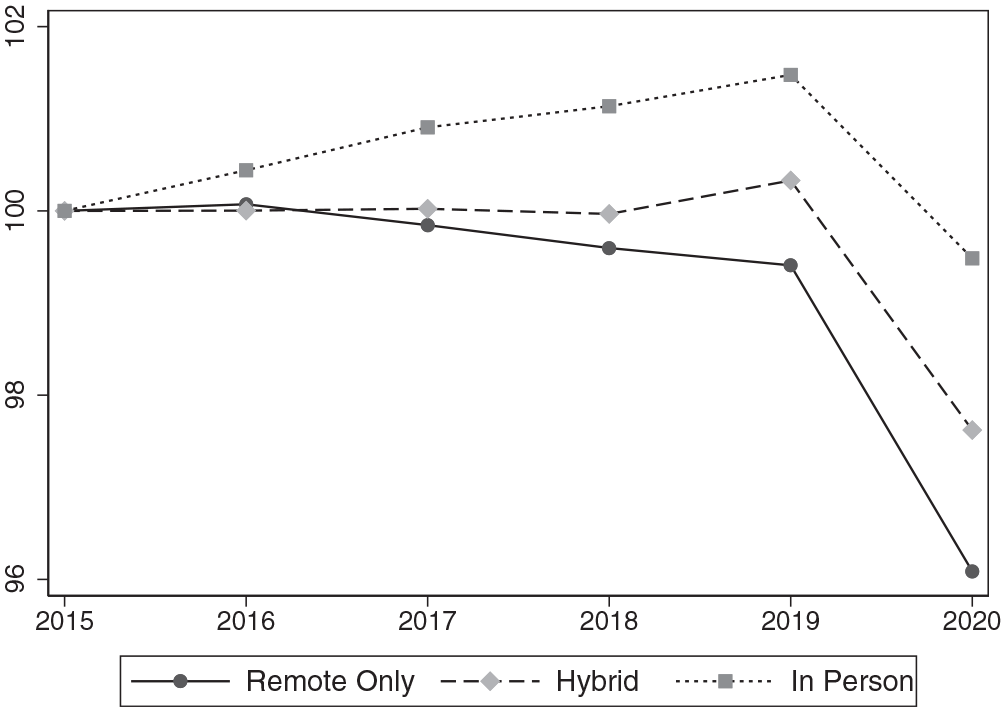
Annual district K–12 enrollment (Fall 2015 = 100).
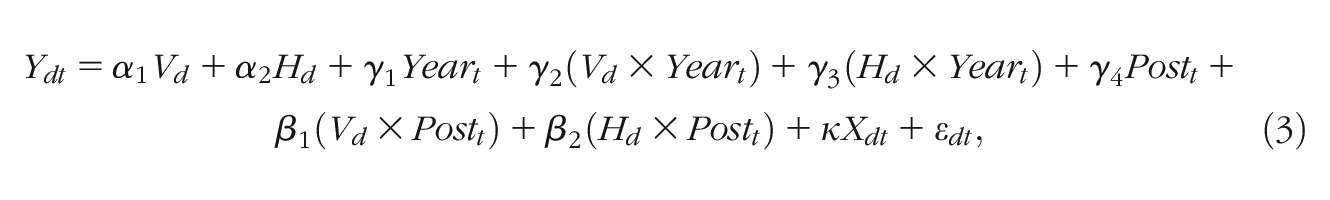
One potential limitation of the specifications in Equations (3) and (4) is the maintained assumption that the prior trends unique to remote-only and hybrid districts are indeed linear. We explore the validity and empirical relevance of this assumption in five ways. One is to consider visual evidence of the enrollment trends by district type both to assess the linearity of the prior, group-specific trends and the credibility of the impact estimates we report. Second, we also discuss the results of specifications that allow for a quadratic term in the group-specific trends. Third, as a falsification exercise, we discuss the estimated effects of a district’s chosen instructional mode on kindergarten enrollment across states where kindergarten was and was not mandatory. In the absence of specification error, we would expect the impact of district instructional mode on kindergarten to be attenuated in states where kindergarten was mandatory.
Fourth, we also explore the robustness of our findings by implementing the “Honest DiD” sensitivity analysis recently introduced by Rambachan and Roth (2022). This new procedure involves explicitly identifying how robust our main results are to potential nonlinearities of varying magnitudes in the counterfactual trend. A recent survey article on DD applications (Roth et al., 2022) recommends this sensitivity analysis as a part of the emerging standards of practice for this important quasi-experimental design. We implemented this analysis by calculating 95% confidence intervals for our key impact estimates under varying assumptions of the value, M (i.e., the largest allowable change between two consecutive time periods in the slope of an underlying linear trend). Our preferred estimates (i.e., Equation [4]) impose the assumption that M = 0 (i.e., a constant linear trend unique to districts that adopted remote-only instruction). However, these sensitivity analyses allow us to assess how wrong this assumption could be while still allowing us to reject the null hypothesis (i.e., the “breakdown” value of M).
Fifth, while our results generally suggest that inferences based on Equation (4) are valid, we also present complementary results based on a less restrictive generalized synthetic control (GSC) approach. The GSC estimation strategy incorporates both an interactive fixed effects (IFE) specification to model time-varying confounds as latent factors and builds on synthetic-control methods to form a unique counterfactual for each treated district in the treatment period (Bai, 2009; Liu et al., 2022; Xu, 2017). This approach, therefore, accommodates violations of the parallel-trends assumption by explicitly modeling time-varying confounds and has the affordances of a computational matching approach for creating “good” treatment-control comparisons (Liu et al., 2022; Xu, 2017). This new estimation procedure has four main steps. First, the time-varying factors are modeled in an IFE specification using only control-group observations. Next, these coefficients are used to estimate, for treated districts, the district-specific factor loadings on the shared, time-varying determinants of enrollment outcomes. Third, using the estimation results from the first two steps, a unique counterfactual outcome (i.e., a projected enrollment outcome if untreated) is calculated for each treatment district (Xu, 2017). Finally, the GSC estimate of the average treatment effect on the treated (ATT) is the average of the difference between the observed outcome and its counterfactual estimate for all the treated school districts. Inference is based on a parametric bootstrap procedure. We also employ two recommended checks to test the validity of our GSC results (Liu et al., 2022). First, we examine event-study estimates based on this counterfactual procedure to assess visually whether this approach produces estimates consistent with the “parallel trends” during the pretreatment period (Figure A3 in the online appendix; Liu et al., 2022). Second, as an additional and more formal check on the identifying assumptions in the GSC approach, we conducted an “equivalence” test. This test focuses on the null hypothesis that treatment estimates defined for the pretreatment periods (i.e., placebo estimates) exceed a prespecified range of values 5 (Liu et al., 2022). Rejection of this null hypothesis implies that placebo estimates for the pretreatment period fall within a narrow range, a finding consistent with the internal validity of the estimation approach. Both of these robustness checks suggest the reliability of this complementary counterfactual approach.
Results
Figure 1 illustrates average K–12 district enrollment by year and Fall 2020 reopening status (i.e., in-person, hybrid, or remote-only). In order to assess these comparative changes more clearly, these data are indexed so that enrollment for Fall 2015 equals 100. These conditional means show that Fall 2020 enrollment fell dramatically across all three types of districts. However, they also indicate distinct (and quite linear) trends across these district types prior to the focal 2019–2020 school year. In particular, between Fall 2015 and Fall 2019, the enrollment gap between in-person and remote-only districts grew by 2.07% (i.e., an annual differential trend of 0.52%). Between Fall 2019 and 2020, enrollment in in-person and remote-only districts fell by 1.99% and 3.32%, respectively. Combining these data suggests that enrollment in remote-only districts fell by 0.81% relative to in-person districts, after adjusting for their comparative trends. In contrast, districts that chose hybrid instruction show a more modest prior trend and a Fall 2020 decline in enrollment of 2.7%.
In Table 2, we present the key results of regressions that estimate these effects parametrically (i.e., Equations [1], [3], and [4]). A basic DD specification suggests that remote-only instruction reduced enrollment by a statistically significant 2.4% relative to in-person instruction while hybrid instruction had small and statistically insignificant effects. However, the preexisting trend towards lower enrollment in remote-only districts (i.e., more urban districts that were losing enrollment prior to the pandemic) implies that a DD estimator overstates the impact of this policy choice. 6 The remaining results in Table 2 are consistent with that DD bias. That is, spare CITS specifications and DD specifications that condition on remote-only and hybrid linear trends (i.e., columns 2 through 5) indicate that the estimated impact of adopting remote-only instruction is smaller but statistically significant (i.e., implying a 0.79% to 1.1% additional reduction in enrollment). These results also indicate that the preexisting remote-only trend (i.e., enrollment decreases by 0.52% per year relative to in-person districts) is statistically significant. However, neither of the variables related to hybrid instruction are statistically significant. And F-tests consistently reject the hypothesis that remote-only and hybrid instruction had similar enrollment effects.
Estimated Determinants of K–12 District Enrollment
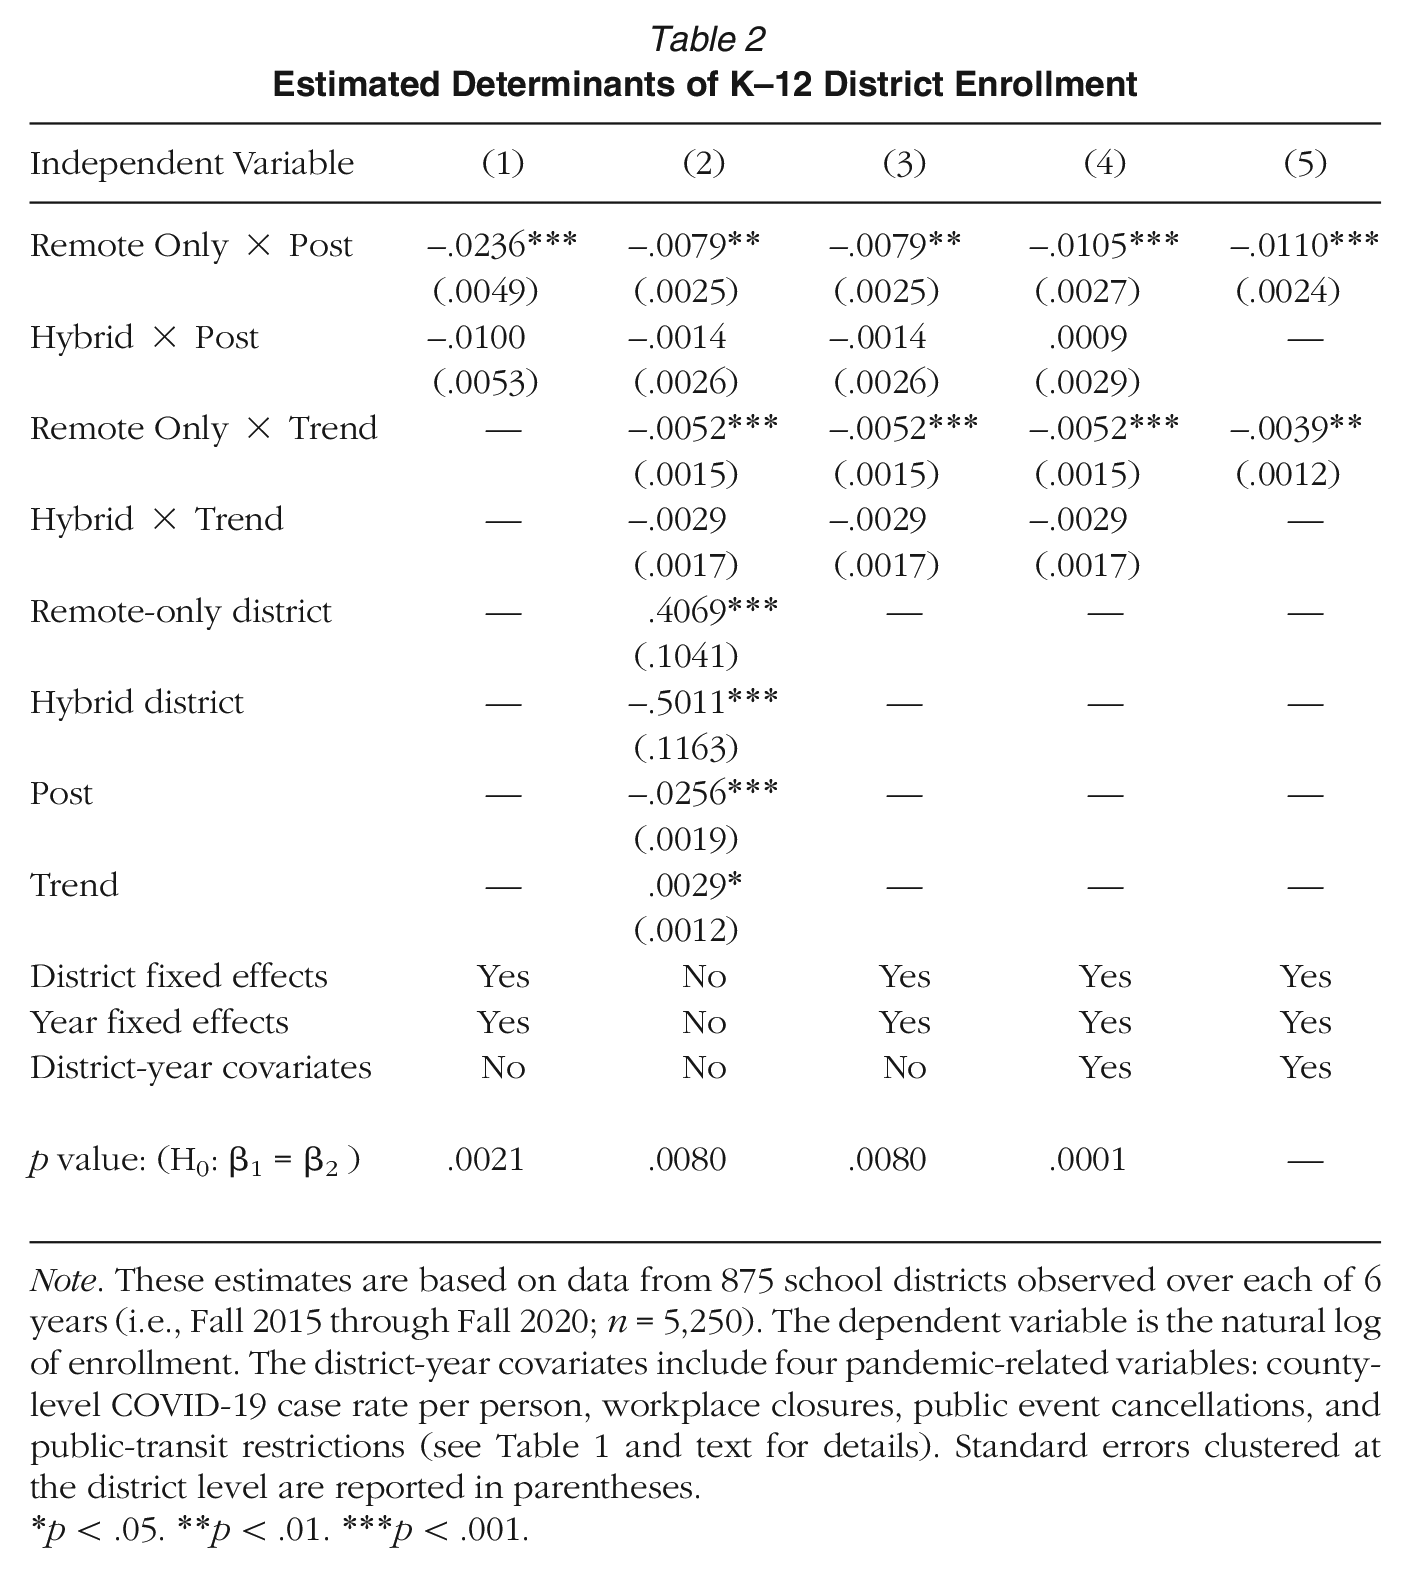
Note. These estimates are based on data from 875 school districts observed over each of 6 years (i.e., Fall 2015 through Fall 2020; n = 5,250). The dependent variable is the natural log of enrollment. The district-year covariates include four pandemic-related variables: county-level COVID-19 case rate per person, workplace closures, public event cancellations, and public-transit restrictions (see Table 1 and text for details). Standard errors clustered at the district level are reported in parentheses.
p < .05. **p < .01. ***p < .001.
The estimated effects of remote-only instruction are slightly larger in specifications that include the district-year controls (i.e., columns 4 and 5). The cancellation of public events, in particular, implied a statistically significant increase in district enrollment (i.e., 1.5%) and is positively correlated with the adoption of remote-only instruction. We consider the impact of using alternative control variables on our key results in Table A6 in the online appendix. We find that incorporating measures of COVID-19 hospitalizations rather than infection rates does not influence our main estimates. Additionally, while political partisanship is a strong predictor of instructional policy (i.e., Trump-leaning counties were more like to opt for in-person schooling; Grossmann et al., 2021; Harris & Oliver, 2021; Hartney & Finger, 2021), the 2016 presidential vote share for Donald Trump did not have a statistically significant effect on Fall 2020 enrollment in our fixed-effect specifications.
We explore the heterogeneity in these estimated effects by several baseline district traits. We find that the effects of remote-only instruction do not vary across districts serving lower and higher concentrations of students in poverty (Table A3, columns 4 and 5, in the online appendix). We also fail to identify a relationship between the prevalence of charter schools in a district and the remote-only effect (Table A7, column 2).
We also consider effect heterogeneity based on district locale type (i.e., urban, suburban, town and rural) in several ways. We consistently identify larger disenrollment effects from remote-only instruction in districts serving more rural communities under multiple specifications. 7 In Table A3, columns 1 through 3, in the online appendix, we present our key results in subsamples defined by urbanicity. The negative impact estimate of remote-only instruction on enrollment is at least weakly significant across all district types (e.g., |t|=1.84 among city-based districts). In Table A7, column 3, we instead use the full sample and introduce interactions that allow the effects of instructional mode to differ for more rural school districts. Consistent with the results in Table A3, these results indicate that the negative effect of remote-only instruction was statistically significant in urban and suburban districts but substantially larger in more rural districts. However, the larger estimated effect of remote-only instruction unique to rural districts is not statistically distinguishable from the estimated effect elsewhere. We also find that the patterns of treatment heterogeneity in both Table A3 and Table A7 are robust in specifications that also allow for quadratic trends.
The final type of potential heterogeneity in enrollment response we investigate is by race and ethnicity. In Table A3 in the online appendix, we subset our sample based on district-level concentrations of Black and Hispanic students in our baseline year. We find that disenrollment is greater in districts with higher concentrations of Hispanic students and lower concentrations of Black students. We also directly measure the remote-only effect for a substantial subset of our total sample using NCES-sourced enrollment data disaggregated by racial and ethnic category. Results from this analysis, presented in Table A8 shows that White students were more likely to disenroll if offered remote-only instruction compared with Asian and Hispanic students. In these results, White parents were twice as likely to disenroll their children from a school district that opted for remote-only instruction than the average parent (i.e., an approximate 2% vs. 1% effect size). The estimated impact of remote-only schooling on Black student enrollment was equally large but statistically imprecise. Meanwhile, the overall disenrollment effect was smaller for Hispanic and Asian students. We do note that White students are less likely to live in a remote-only district compared with non-White students. Only 44% of districts with an above-median share of White students at baseline offered only remote instruction to start the 2020–2021 school year, even though remote-only districts make up fully half of the total sample.
We explore the robustness of our main results based on linear group trends in three additional ways. First, we find that adding quadratic group trends results in a similar estimate (Table A4 in the online appendix). Second, we conducted the sensitivity analysis recommended by Rambachan and Roth (2022). This sensitivity analysis (Figure A2 in the online appendix) indicates that the enrollment trend unique to remote-only districts would have to deviate from linearity by about 150% of the largest slope change observed in the pretreatment period. This “breakdown” value for the underlying trend is also equivalent to 67% of the upper limit on a one-sided 95% confidence interval of the largest slope change in the preperiod. That is, our main estimate remains statistically significant unless the trend in the true enrollment counterfactual is substantially different from what is suggested by pre-period trends. Third, we find that GSC estimates also suggest the negative and statistically significant impact of remote-only instruction on enrollment with noticeably larger estimates for total enrollment (Table A5 in the online appendix). Event-study estimates based on the GSC results (Figure A3 in the online appendix) suggest this procedure performs well in addressing time-varying confounds, an inference supported by an equivalence test (Liu et al. 2022).
We turn next to the enrollment results by grade level. The comparative trend data in Figure 2 suggest that the enrollment declines attributable to remote-only instruction are concentrated in kindergarten and, to a lesser extent, elementary-school grades. The trends in kindergarten and elementary-school enrollment also suggest the existence of quite linear comparative trends by reopening status prior to fall 2020. 8 Table 3 presents the key results from corresponding regressions that control for these linear trends and other time-varying covariates (i.e., Equation [4]). These results suggest that remote-only instruction led to particularly large enrollment reductions in lower grades and that these effects diminished monotonically in higher grade levels. 9 Specifically, these estimates suggest that remote-only instruction reduced kindergarten enrollment by 3% to 4% and elementary-school enrollment by 1% while having smaller and statistically imprecise effects at the middle- and high-school levels. These results also suggest that hybrid instruction did not have statistically significant effects with the exception of a small, positive estimate for high-school enrollment, a finding that does not appear consistent with either the visual evidence (Figure 2) or the event-study estimates (Table A2 in the online appendix).
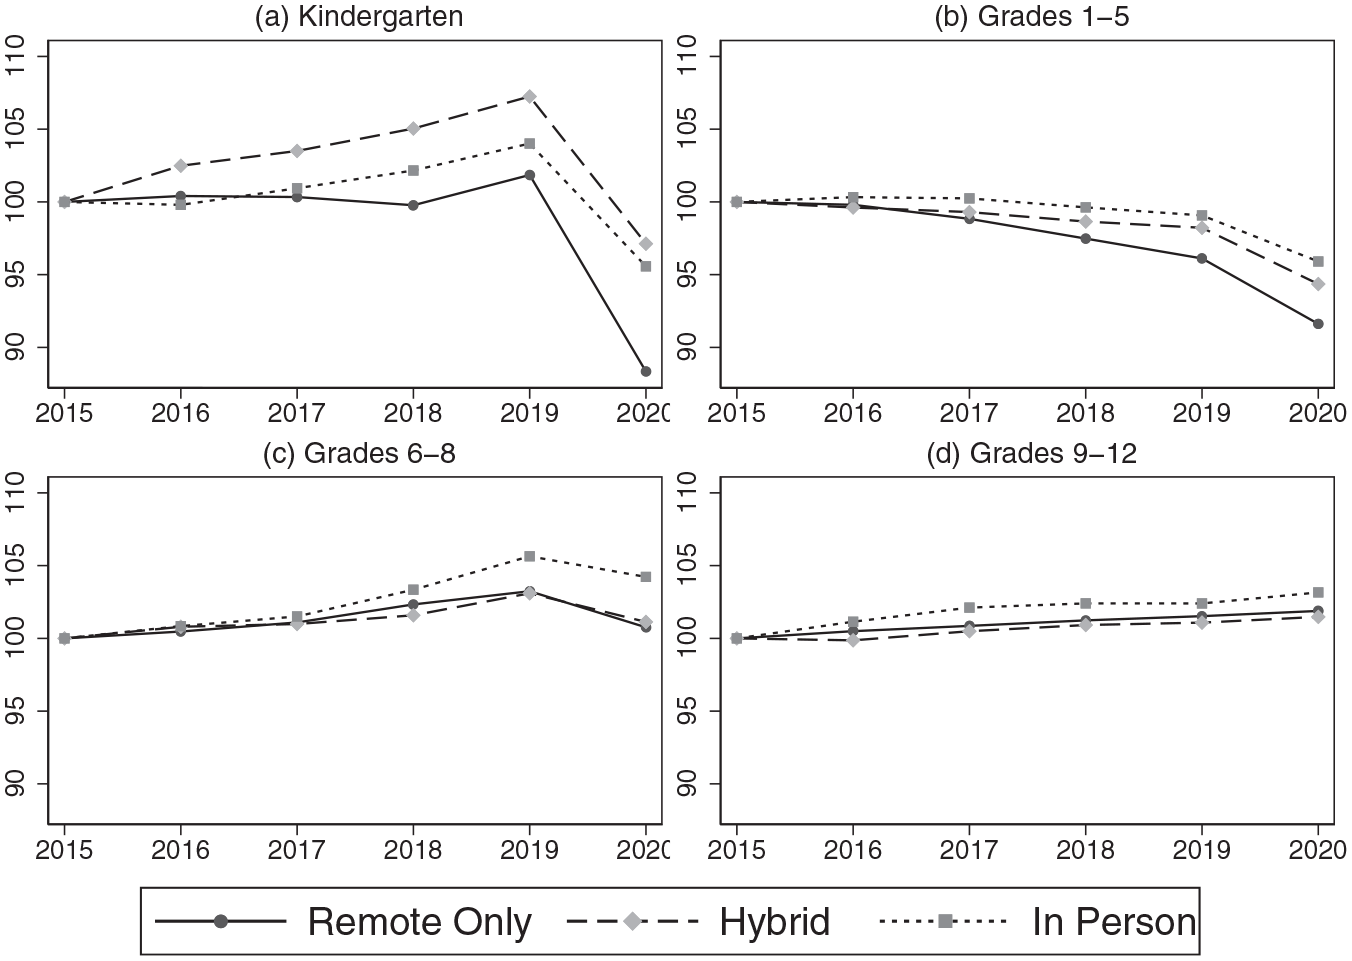
Annual district enrollment by grade level (Fall 2015 = 100).
Estimated Determinants of Enrollment by Grade
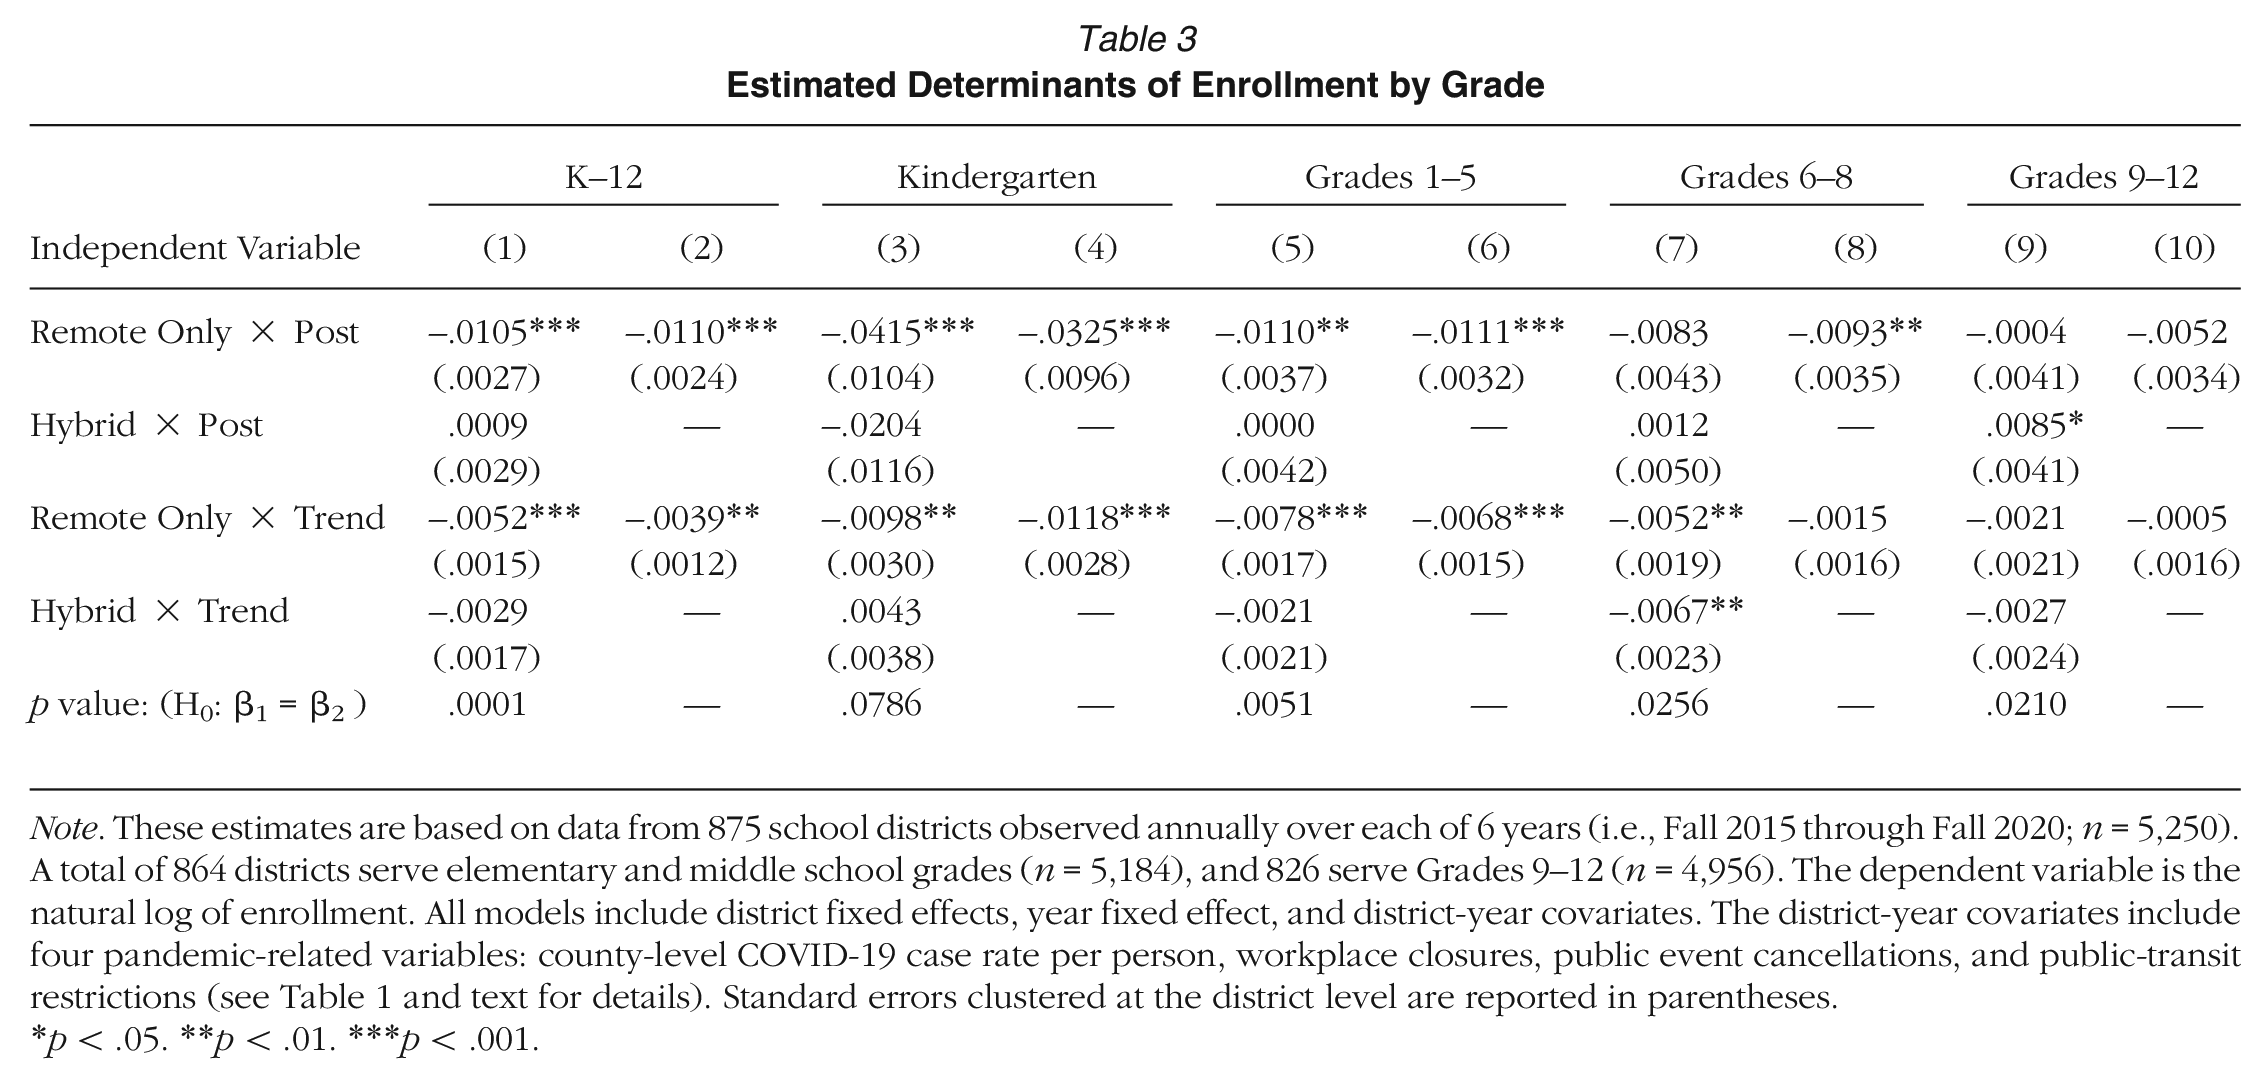
Note. These estimates are based on data from 875 school districts observed annually over each of 6 years (i.e., Fall 2015 through Fall 2020; n = 5,250). A total of 864 districts serve elementary and middle school grades (n = 5,184), and 826 serve Grades 9–12 (n = 4,956). The dependent variable is the natural log of enrollment. All models include district fixed effects, year fixed effect, and district-year covariates. The district-year covariates include four pandemic-related variables: county-level COVID-19 case rate per person, workplace closures, public event cancellations, and public-transit restrictions (see Table 1 and text for details). Standard errors clustered at the district level are reported in parentheses.
p < .05. **p < .01. ***p < .001.
We explore the robustness of these grade-specific results in several ways. First, we assess the credibility of the substantial kindergarten effect of remote-only instruction by estimating these effects separately for districts in states where kindergarten was mandatory and where it was not. We find that the remote-only instruction had a smaller and statistically insignificant enrollment effect in states where kindergarten is mandatory (i.e., a 3.9% decrease; p-value = .125). In contrast, in states where kindergarten is optional, remote-only instruction reduced enrollment by 4.6% (p-value = .0001). Similarly, in a specification instead based on the full sample and a treatment interaction (i.e., column 5 in Table A7 in the online appendix), we find that the reduction in kindergarten enrollment attributable to the adoption of remote-only instruction differs in a statistically significant and plausible manner across states where kindergarten enrollment is or is not mandatory. We also find that the main kindergarten result is robust to conditioning on quadratic group-specific trends (Table A4). The elementary-school enrollment effect of remote-only instruction is sensitive to conditioning on quadratic trends. However, this appears to be due to an increase in imprecision rather than a substantial decrease in the point estimate. For example, the point estimate from Table A4 (i.e., –0.87%) would be statistically significant with the corresponding standard error from Table 3.
The Rambachan and Roth (2022) sensitivity analysis also suggests the robustness of the kindergarten result (Figure A2 in the online appendix). Specifically, the deviation from trend linearity required to “breakdown” this result (i.e., M of roughly 0.0275 or larger) is nearly three times as large as the largest deviation from linearity observed in the pretreatment period (and roughly equivalent to the 95% upper confidence limit on this deviation). However, for higher grade levels (i.e., elementary, middle, and high school), this analysis does suggest more sensitivity to the presumed linearity of the group trends. Specifically, the results in Figure A2 indicate that rejection of the null hypothesis will no longer hold if deviations from linearity resemble the maximum deviations observed in the pretreatment period. GSC estimates (Table A5) provide complementary evidence on the robustness of these grade-specific estimates in Table 3. The GSC estimates also suggest a robust impact of remote-only instruction on kindergarten enrollment. These estimates also suggest that remote-only instruction led to smaller enrollment declines at higher grade levels, though some of these inferences are sensitive to the inclusion of district-year controls (Table A5). The corresponding GSC-based event-study figures (Figure A5) and equivalence tests suggest that this estimation procedure performs well (Liu et al., 2022).
Conclusions
During the first full school year after the onset of the COVID-19 pandemic, enrollment in U.S. public schools fell dramatically (i.e., a decline of 1.1 million students or 2% of prior K–12 enrollment). This enrollment decline is an important leading indicator of the educational impact of the pandemic. In particular, the existence and magnitude of this enrollment decline implies a myriad of potential consequences for schools and students. These include the likely fiscal strain on public schools of declining enrollment as well as the diverse developmental implications for students related to the underlying behaviors driving enrollment declines such as kindergarten skipping and redshirting, school switching, truancy, and dropping out. Arguably, the major policy lever relevant to these enrollment decisions was (and continues to be) the instructional mode states and districts choose for their schools (i.e., in-person, remote-only, or a hybrid). In the fall of 2020, policymakers confronted an exceptionally difficult choice about how to reopen schools, one that required them to balance the public-health risks to their students and communities with the educational and economic harm of remote instruction.
In this study, we rely on several unique data sources to construct quasi-experimental evidence on how their Fall 2020 reopening decisions influenced the disenrollment phenomenon. Our results suggest that the decision to offer remote-only instruction that fall contributed meaningfully to the historically unprecedented disenrollment from public schools. Specifically, our estimates, derived from a district-level sample encompassing 35% of all public-school students in the United States, suggest that offering remote-only instruction increased disenrollment by 42% (i.e., a change from 2.6% to 3.7%) relative to in-person instruction, while hybrid instruction had small and statistically insignificant effects. To frame these effect sizes against the national decline in public-school enrollment, we note that public schools previously enrolled roughly 49 million students and that roughly 57% of students faced remote-only instruction as of November 2020 (Henderson et al., 2021). The additional enrollment declines in remote-only districts (i.e., 1.1 percentage points) implies that public schools lost roughly 300,000 K–12 students because of these decisions (i.e., 49 million × 0.57 × 0.011). This implies that the widespread adoption of remote-only instruction explains roughly a quarter of the disenrollment from public schools. As a caveat, we note that the key estimates underlying this calculation are based on a sample that underrepresents rural districts. However, this is likely to imply that we understate the overall impact of adopting remote-only instruction given that the disenrollment effect of remote-only instruction was larger in rural areas (though not significantly so). Or this feature of our sample is of negligible empirical relevance given that rural districts were less likely to select remote-only instruction and enrolled comparatively fewer students. Notably, we also find evidence that the effects of remote-only instruction on the decline in public-school enrollment were particularly concentrated in kindergarten and elementary-school grades.
Overall, these results suggest that significant numbers of parents, particularly parents of younger children, did not want their children to participate in remote instruction. Notably, this pattern of revealed preferences corresponds strongly with the conclusions of a NASEM panel that recommended full-time, in-person instruction for students in Grades K–5 (NASEM, 2020). Beyond revealing these parental preferences, these results have at least two broad implications for understanding the consequences of school-reopening decisions. First, these results suggest that the decision to offer remote-only instruction will have negative fiscal consequences for school districts if disenrolled students do not return. In particular, because the disenrolled students are disproportionately younger, this effect may be long-lasting. Lingering uncertainty about how to ensure safe and effective instruction, dissatisfaction in schools’ COVID-era decision-making, and permanent switches to the private and homeschool sectors may contribute to sustained disenrollment. While comprehensive data for the 2021–2022 school year are not yet available, preliminary state data indicate that many districts experienced a second consecutive year of declining enrollment (Jacobson, 2022). This emergent evidence stresses the need for continued study on enrollment patterns following the onset of the COVID-19 pandemic.
Second, these results provide early evidence on the educational challenges created by these reopening decisions (and the pandemic, more generally). For example, the sharp drop in kindergarten enrollment suggests schools (i.e., particularly those that offered remote-only instruction) will face the challenge of educating rising first graders who are in their first experience of formal schooling. However, to the extent that a substantial number of students instead “redshirted” into kindergarten classes in Fall 2021, schools may face the staffing and pedagogical challenge of managing an unusually large, mixed-age cohort. In the longer run, students in crowded grade cohorts may experience greater competition in accessing postsecondary education options (Bound & Turner, 2007).
Clearly, there is still much to learn about the educational experiences of students who disenrolled from public schools during the pandemic (as well as those who remained in their schools). That will become increasingly feasible as richer data become available (Oster, 2021), in particular, data that allow us to track individual students longitudinally. However, we do not yet have comprehensive and consistent information on the changed destinations of the students who did not enroll in public schools (e.g., private schools, skipping or “redshirting” kindergarten, truancy, and dropping out). For example, recent administrative data indicate that Catholic school enrollment also declined over the first two full school years of the pandemic (Barnum, 2022), while a Census survey suggests that rates of homeschooling increased substantially (Eggleston & Fields, 2021). At the same time, the overall stability of public-school enrollment at the high-school level suggests that the pandemic did not increase dropout behavior. In fact, early evidence suggests high-school grauation rates have actually increased (Harris & Chen, 2022). The fact that we cannot yet fully identify the instructional environments experienced by students who did not enroll in public schools during the pandemic underscores the concern that some educationally vulnerable students may have become chronically truant (e.g., Dee & Murphy, 2021).
Finally, we note that community and family contexts may play an important role in moderating the enrollment impact of remote-only instruction. For example, the evidence that the disenrollment effects of remote-only instruction were larger in more rural communities raises questions about the sources of this heterogeneity (e.g., differential access to high-speed Internet connectivity and relevant devices). Yet our results also suggest the impact of this choice was a broad one. For example, we also find that remote-only schooling had significant effects in urban and suburban districts (Table A7, column 3, in the online appendix) as well as across school districts defined by several other contextual measures (e.g., higher- and lower-poverty communities). The broader issue of how pandemic-driven disenrollment from public schools may have influenced school segregation along different dimensions (e.g., income and race) is an important, emerging question for this literature. It will merit careful attention as more current and comprehensive data become available. Regardless, these results provide clear and leading evidence that offering remote-only rather than in-person instruction was a highly consequential choice for schools and students.
Supplemental Material
sj-pdf-1-aer-10.3102_00028312221140029 – Supplemental material for The Revealed Preferences for School Reopening: Evidence From Public-School Disenrollment
Supplemental material, sj-pdf-1-aer-10.3102_00028312221140029 for The Revealed Preferences for School Reopening: Evidence From Public-School Disenrollment by Thomas S. Dee, Elizabeth Huffaker, Cheryl Phillips and Eric Sagara in American Educational Research Journal
Footnotes
Supplemental Material
Supplemental material for this article is available online.
Notes
T
E
C
E
References
Supplementary Material
Please find the following supplemental material available below.
For Open Access articles published under a Creative Commons License, all supplemental material carries the same license as the article it is associated with.
For non-Open Access articles published, all supplemental material carries a non-exclusive license, and permission requests for re-use of supplemental material or any part of supplemental material shall be sent directly to the copyright owner as specified in the copyright notice associated with the article.