
Abstract
Perceptions of school quality affect many aspects of education policy and politics. Using two randomized survey experiments, we studied the factors that individuals use to evaluate school quality. Our surveys included two novel components: text analysis of open-ended responses and videos highlighting different perspectives on assessing school quality. While we found that individuals respond most strongly to test scores, we also found that a video explaining how standardized testing imperfectly reflects student learning led attentive respondents to reduce reliance on achievement status and to increase attention to growth. The results suggest that informational interventions may affect how individuals interpret school performance data. Yet, we also found evidence of political polarization and preferences for school characteristics not in standard reporting.
Introduction
Perceptions of school quality have the potential to affect the demographic composition of public schools’ student bodies, local real estate markets, and the policy decisions of public-school districts. Parents in many school districts have discretion over the public school that their child attends, and assessments of school quality influence enrollment decisions (Abdulkadiroğlu et al., 2020; Cohodes et al., 2022). Even in districts with more limited or nonexistent school choice, perceptions of public-school quality affect whether parents choose the local public school or opt instead to enroll their child in a private school or to provide home schooling (Figlio & Stone, 2001). Parents also have the ability to move their residence to an alternative school district. Moreover, beliefs about whether local schools are effective can influence voting decisions on school finance measures (Kogan et al., 2016) and school board elections (Holbein, 2016). These enrollment, residential location, and political choices have far-reaching impacts on the learning environment in public schools, property values in local housing markets and patterns of residential segregation, and the available resources and administrative priorities of school districts.
Given the importance of perceptions of school quality to many aspects of education policy and politics, we fielded two preregistered online survey experiments, with a combined sample size of about 11,500 respondents, to study the factors that individuals use to evaluate school quality. Through these surveys, we first used open-ended text responses to evaluate respondents’ top-of-mind considerations. Next, we measured the relative importance of school characteristics—such as test score levels, growth, and student demographics—in shaping respondents’ choices in a conjoint task (discrete-choice experiment). 1 Finally, we employed novel, randomly assigned video treatments to examine whether respondents’ choices are influenced by different perspectives on school quality publicized by government, academic, and nonprofit sources. The video treatments emphasized the importance of student test scores, growth as an alternative metric, peer effects, the crowding-out effects of standardized testing, or a noninformative control message.
We found that open-ended responses reflected either a quantitative or a qualitative view of school quality, and we additionally found variations in responses between individuals with and without school-aged children and by political partisanship. Based on the conjoint task, we found that individuals responded most strongly to test score averages, then to test score growth, and then to student demographic information. Within some subgroups of respondents, choices were also responsive to the racial composition of schools, even while holding fixed other school attributes. As for the video interventions, we found mixed results. On one hand, we found some evidence that the videos affected the characteristics that respondents used to evaluate school quality. In particular, the video emphasizing growth over academic achievement status led respondents to place less emphasis on student test scores and more on growth. Results were especially strong among respondents with a quantitative view of school quality. On the other hand, we found smaller impacts for less attentive 2 respondents and for the other informational interventions.
The study makes several contributions to the literature on measuring school preferences. First, as a methodologic contribution, we extend prior work employing conjoint tasks or discrete-choice experiments, such as Haderlein (2022), by using text analysis of open-ended survey responses and by employing informational treatments prior to a conjoint task. This enabled us to examine freely provided, unconstrained preferences regarding school quality as well as to assess the malleability of preferences to (potentially) new information.
Second, and relatedly, the results of our informational treatments suggest that the characteristics that individuals use in their assessments of school quality may change with new or more recent information. While there is well-documented evidence in the literature that “individuals are sensitive to relatively small interventions that shape the accessibility and presentation of [school] data” (Houston & Henig, 2021, p. 568), we provide evidence that individuals are further sensitive to interventions regarding how to interpret such data. This is a key takeaway for the many governments, nongovernmental organizations, and community organizations that devote significant time and resources to communicating with parents about how to interpret school performance information, Their interventions may have an impact, and arguments highlighting growth over achievement status may be most effective.
Lastly, however, our findings highlight some of the limitations of such interventions. For informational interventions regarding school performance metrics to influence parents and community members, these messages actually must capture their attention. Even then, attention may not be enough. The open-ended survey responses suggested that individuals may not be motivated to consume new information about school performance if they care about qualitative factors, such as class environment and teacher quality, that are not included in standard performance data. Additionally, we saw evidence of partisan differences in the open-ended responses, indicating that preferences may solidify and polarize as national political discourse further permeates local politics.
We note that perceptions of school quality and the degree of variation across schools may be systematically mistaken. For example, Kelly and Northrop (2013) argued that citizens dramatically overestimate the variation in school quality, whereas Kelly et al. (2020) similarly found exaggerated perceptions of the differences in instructional practices across schools. Understanding what school characteristics and framing devices contribute to differences in the perception of school quality is a critical step in understanding deviations between perceived and actual school quality.
Assessing School Quality: Prior Work and New Directions
Assessing the quality of a school is a complex exercise. Parents and community members have a wide variety of informational sources at their disposal when evaluating educational quality. Word-of-mouth reports, message boards, government-provided information on standardized test scores and student demographics, and privately provided quality assessments, such as the high-profile GreatSchools ratings, are just some of the information sources that individuals use to assess school quality and guide residential location and enrollment decisions. School districts report measures such as academic attainment and achievement, growth in standardized test scores over time, and chronic absenteeism. 3
Scholars have investigated how different components and features of the information provided in school profiles and ratings affect individuals’ assessments of school quality. This has included considering relative performance information over time and in comparison with other schools (Barrows et al., 2016; Charbonneau & Van Ryzin, 2015; Olsen, 2017), the presentation and format of the information (Choi & Gil-Garcia, 2022; Glazerman et al., 2020; Jacobsen et al., 2014), and the stated sources of the information (Mizrahi & Minchuk, 2020; Valant & Newark, 2020). Recent work has shown that parents are responsive to growth information, especially when considering high schools and schools for students with disabilities (Valant & Weixler, 2022). Along with academic performance information, families and community members also have access to information about school enrollment, including student demographics and measures such as the student–teacher ratio. Less is known about how parents and community members adjudicate between these multiple (and potentially conflicting) metrics and form their ultimate choices about school enrollment and residential location.
Recent studies thus have investigated the comparisons and tradeoffs that individuals make in their assessments of school quality. Houston et al. (2022), for example, explored how individuals responded to information about academic achievement status versus growth. They asked respondents in a survey experiment to estimate both the achievement status and growth of their school district and provided treatments with accurate information to allow for updating. They found that individuals’ evaluations shift to be “more in line” with district growth when provided with the relevant information and suggested that “the provision of growth information weakens the relationship between the public's perceptions of school quality and the economic background of the student body” (Houston et al., 2022, p. 107). This extended the finding of Houston and Henig (2021) and Houston and Henig (2023) that growth information leads individuals to choose less White and less affluent school districts. While the use of actual school districts heightened the external validity of these studies, respondents’ preexisting beliefs about their school district and the novelty of the growth information in Houston et al. (2022) potentially complicated our ability to learn about individuals’ relative responsiveness to school academic achievement status and growth. Our study design complements the insights from this work by asking respondents to consider hypothetical schools where we could completely randomize school characteristics.
Employing the same methodology as our study, Hailey (2022) used a conjoint experiment to explore the school preferences of parents of different races. Hailey found that White and Asian individuals rate schools according to a racial preference hierarchy such that White schools are most desirable, followed by mixed schools, and then Latinx and Black schools. Similarly, Billingham and Hunt (2016) found that White individuals are less likely to enroll a child in a hypothetical school with a larger share of Black students. Moreover, Haderlein (2022) also used an experiment to compare parent preferences for not only academic achievement and growth but also other indicators of school quality, including school leadership, graduation rates, absenteeism, and student demographic composition. Haderlein's experiment found that achievement status was the “most impactful predictor of parents’ school quality perceptions” and that White parents are significantly less likely than Black and Hispanic parents to prefer diverse schools and schools with mostly students of color (Haderlein, 2022, p. 399). We extend this work by assessing whether providing guidance about the value and use of different measures of school quality has the potential to reduce the importance of average achievement when choosing between schools. We also build on this work by examining how other dimensions of school demographic composition, such as the share of students who are low income or have limited English proficiency, affect the probability of choosing a particular school.
Our study also complements and supplements the contributions of research examining how real-world residential real estate markets, enrollment, and application choices are affected by school characteristics (Abdulkadiroğlu et al., 2017; Bayer et al., 2007; Black, 1999; Hastings & Weinstein, 2008). For example, Abdulkadiroğlu et al. (2020) estimated discrete-choice models of high school program rankings in New York City high schools. 4 They found that school rankings were particularly responsive to peer composition and that parents did not seem to value schools that were particularly effective at increasing student achievement relative to baseline expectations. Relatedly, Angrist et al. (2024) showed that the positive correlation between the share of White students and performance measures was driven by the selection of White students into high-performing schools as opposed to schools with a higher share of White students adding more value. Other studies used randomized, controlled trials to examine whether providing additional information to parents and students on school characteristics affected enrollment and application choices. Cohodes et al. (2022) implemented an experiment that provided information on graduation rates and the likelihood of admission to New York City high school programs. This information affected high school application rankings, with treatment group members much less likely to rank schools with low graduation rates as their top choice.
In addition, Campos (2024) implemented a field experiment on parents’ enrollment decisions in Los Angeles. The experiment included informational videos that provided alternative frames emphasizing the importance of the level of incoming student achievement or achievement growth over the academic year. These treatments changed beliefs about school quality and enrollment decisions, with schools that performed well on the growth metrics ranked higher. These results complement ours and show that information, as well as how it is presented, can affect real-world enrollment decisions.
An advantage of the hypothetical choice setting in our study is that we were able to include respondents who were not parents of school-aged children in the sample and therefore could study which characteristics were important to their assessment of school quality. Citizens without school-aged children can affect educational policy outcomes through their voting decisions on school finance measures as well as school board elections. Moreover, individuals without school-aged children can influence, through their residential location decisions and, in turn, their effects on property values, the resources that schools have available to educate students. We made comparisons between respondents with and without school-aged children to examine how preferences for school characteristics differed across those who have children to enroll in schools versus those who do not.
Different Perspectives on School Quality
The prominence and importance of information on student achievement and growth led us to expect that respondents in our study would have higher probabilities of selecting schools that performed well on these dimensions. However, it was less clear how individuals weigh achievement levels relative to growth in their assessments of school quality. We also expected that student demographics would be important for (hypothetical) enrollment decisions as well but had no expectation regarding the magnitude of these effects. Again, one goal of this study was to investigate the relative importance of these metrics.
Still, a further goal was to investigate the mechanisms driving individuals’ use of different metrics of school quality. Given the variety of resources available to parents and community members to help make sense of school performance, do different perspectives for understanding school quality affect the type of information individuals use when evaluating schools and making enrollment decisions? To explore this, we developed four information-provision interventions that directed individuals’ attention to different aspects of school and district quality. These interventions were inspired by common arguments for how to understand school and district quality repeated not only in academic circles but also by government sources, news outlets, and education nonprofits. Table 1 provides examples of the arguments pertaining to test scores, growth, peer effects, and crowding out that informed the construction of our four interventions, and we discuss each intervention in more detail below. While there are numerous other possible perspectives with which to assess school quality, such as perspectives emphasizing small class sizes, school staff including counselors and nurses, and the graduation rate, we consider four popular arguments directing attention toward (test scores and peer-effects interventions) or away from (growth and crowding-out interventions) academic achievement status.
Popular perspectives for understanding school quality
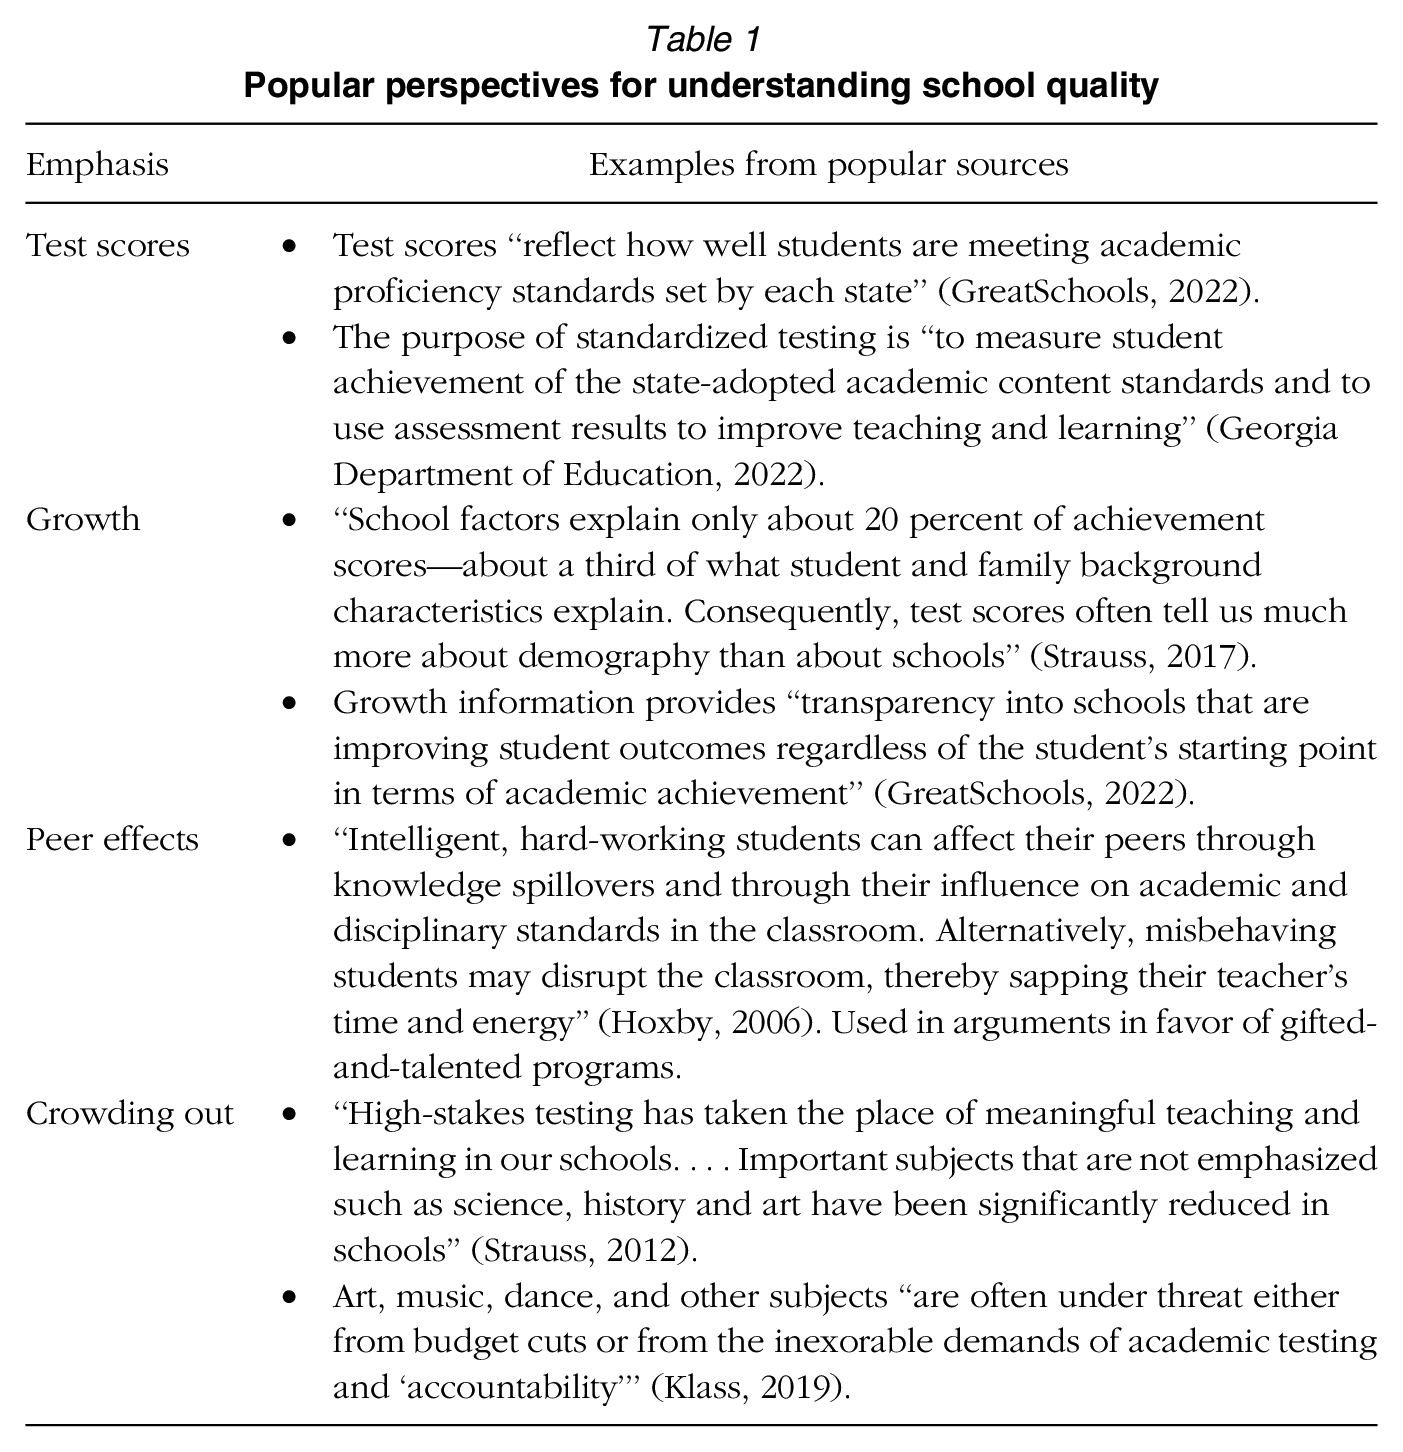
One way to evaluate school and district quality is to focus on academic achievement as measured from standardized testing. Achievement status may be reported as test score averages or the percentage of students meeting a proficiency benchmark in a given school or district in a specific year. Measuring and reporting student academic achievement through standardized testing has been required by state and federal law (e.g., the No Child Left Behind [NCLB] Act of 2001 and the Every Student Succeeds Act [ESSA] of 2015). This mandated disclosure combined with significant media attention has resulted in a high level of familiarity with local public school proficiency on state standardized tests (Chingos et al., 2012). Arguments in favor of disclosing test scores to the public emphasize the importance of this information for helping schools and districts assess whether students are mastering the required academic content and for helping parents select high-performing schools for their children or hold their schools and districts accountable for subpar performance. Based on these arguments and the justifications for the NCLB Act and ESSA, we constructed an intervention that we called the test score treatment that discusses the value of school-level standardized test score averages in evaluating students’ academic achievement.
However, academic proficiency at a single point in time cannot fully communicate the contributions, or value added, of teachers, schools, and districts to student learning. Academic achievement is highly correlated with student demographic composition, and school factors such as teacher quality and curriculum determine only a small part (around 20%) of test scores (Reardon, 2016; Strauss, 2017). Nonetheless, teacher quality, curriculum, and other school factors may play a large role in driving student growth over time on standardized tests. Reporting growth information aids in evaluating how schools promote student learning and increase content mastery relative to students’ baseline performance. This information may be more important than achievement status for some parents’ enrollment decisions, including parents of students with disabilities or special needs (Valant & Weixler, 2022). We constructed an intervention that we called the growth treatment to reflect these value-added arguments in favor of growth information. It discusses the contribution of background factors to student standardized test scores and distinguishes between students’ baseline academic performance and the growth in standardized test scores that they experience in the classroom over the course of an academic year.
While the growth intervention suggested a reason to rely less on measures of achievement status such as test score averages, we constructed a contrasting intervention that we called the peer-effects treatment to present an argument in favor of attention to test score averages. Peer effects refer to the influence that other students’ backgrounds, behavior, and academic performance can have on a student (Sacerdote, 2011). Students may benefit from spillover effects from peers when surrounded by high-achieving students, potentially elevating their own academic performance. This reasoning is often used to support gifted-and-talented programs and may provide further justification for a focus on test scores in parents’ enrollment decisions. The peer-effects intervention discusses the potential impact of classmates’ academic performance on a student's learning outcomes.
Finally, we constructed another intervention presenting a reason to devote less attention to test scores. This intervention, which we call the crowding-out treatment, draws on popular sentiment that an overemphasis on standardized testing has resulted in insufficient time spent on nontested academic subjects such as science and history; arts, sports, and other extracurricular and enrichment activities; and other aspects of student development, such as socioemotional skills (Klass, 2019; Strauss, 2012). Those worried about such crowding-out effects would advocate for increased attention to other features of schools that help build well-rounded students, such as the curriculum, climate, enrichment opportunities, and diversity of student body, rather than achievement status. To represent this point of view, the crowding-out intervention addressed the tradeoff between improving test scores and participating in enrichment activities such as sports and arts.
Our experimental design allowed us to test whether these arguments are effective in directing individuals’ attention toward, or away from, certain school characteristics, particularly test score averages, when evaluating school quality. In particular, we tested the following four main hypotheses corresponding to our four interventions:
Test score hypothesis: Test score averages will affect the assessments of respondents treated with the test score intervention more than respondents in the control group.
Growth hypothesis: Test score growth will affect the assessments of respondents treated with the growth intervention more than respondents in the control group and in the test score intervention.
Peer-Effects Hypothesis: Demographic composition information and test score averages will affect the assessments of respondents treated with the peer-effects intervention more than respondents in the control group, and demographic information will affect assessments more than in the test score intervention.
Crowding-out hypothesis: Test score averages will affect the assessments of respondents treated with the crowding-out intervention less than respondents in the control group and in the test score intervention.
We also tested several exploratory hypotheses derived from expectations about how different groups of individuals will respond to treatment. For some subsets of respondents, we expected to find stronger treatment effects across the different treatments. That is, for all the comparisons in the above-mentioned hypotheses, we anticipated stronger treatment effects for respondents with children versus respondents without children, respondents with school-aged children versus respondents without school-aged children, and respondents who owned their own residence versus respondents who did not own their own residence. We expected that respondents with children and those who owned their homes would be more invested in the quality of their schools due to the personal stakes in securing a high-quality education for their children or increasing their home's value by ensuring that the local schools are strong. Alternatively, individuals with children and homeowners may have stronger preexisting beliefs about what information is important for assessing school quality, and as a result, they may be less responsive to new information.
We also expected a pattern in responses to the peer-effects intervention—we expected that demographic information regarding the student enrollment for respondents’ own racial group would affect respondents’ assessments more than the enrollment of other racial groups. This expectation was based on the findings of Hailey (2022) and Billingham and Hunt (2016) regarding racialized school preferences and the findings of Glazerman and Dotter (2017) specifically regarding preferences for schools with larger shares of students from one's own racial group.
Experimental Design
Sample
We conducted two preregistered 5 online survey experiments using the Qualtrics survey platform and fielded on participants recruited through Lucid (Study 1) and Prolific (Study 2). 6 Lucid and Prolific are online marketplaces that allow individuals to participate in research studies, such as surveys. Prior research validated and supported the use of both Lucid (Coppock & McClellan, 2019) and Prolific (Peer et al., 2021) for social scientific research. However, recent research has documented declines in attentiveness among respondents on the Lucid platform since 2020 (Ternovski & Orr, 2022) and as we describe below, the Lucid sample had a much higher share of inattentive respondents than the Prolific sample in our studies. Lucid provides samples that are representative of the U.S. population on gender, age, race/ethnicity, and region. We also found that our Prolific sample was similar to the U.S. population on age, gender, and race/ethnicity. Appendix Table A1 in the online version of the journal compares the Lucid and Prolific samples with the U.S. population. Compared with Lucid, the Prolific sample was slightly younger and more Democratic.
We fielded the survey for Study 1 from August 26 to 30, 2022, 7 and 6,934 respondents completed the survey. 8 We then fielded the survey for Study 2 on January 19, 2023. Due to the higher cost of recruiting Prolific respondents, we reduced our target sample size to 4,500, and 4,495 respondents completed the survey. Given the smaller sample size in Study 2, we reduced the number of informational interventions tested as well, as described in more detail below.
In the surveys for both studies, we used two standalone screener questions and a grid screener question from Berinsky et al. (2021) to measure respondent attentiveness. In addition, following the recommendations of Read et al. (2021), we included response timers on each page of the survey and constructed an alternative measure of respondent attentiveness using the response-time attentiveness clustering method.
The Lucid respondents performed unexpectedly poorly on the attention checks (only 51% answered three or four of the attention checks correctly), and as we describe below, compliance with watching the assigned informational treatment video was low (~64%). Study 2 was motivated by this weakness of Study 1—we aimed to replicate our analysis using a higher-quality pool of respondents from Prolific. We found that the Prolific respondents in Study 2 were systematically more engaged with the survey and were more attentive. Among the Prolific respondents, 94% clicked to watch the assigned informational treatment video, and 98% answered three or fourof the attention checks correctly.
Open-Ended Question about Evaluating School Quality
Before the informational interventions and conjoint choice task, described in more detail below, our surveys in both studies included an open-ended item that encouraged respondents to reflect on the school attributes that are most important to them. In Study 1, we asked, “When thinking about what makes one school better than another, what are your main considerations?” In Study 2, we asked a similar question with the clarification that we were asking about a K–12 public school. 9 This allowed us to study the school attributes that are most important to respondents without priming them or without placing any researcher-defined constraints on the choices available to them. While researchers focus on factors such as test scores, the open-ended format allows respondents to express any consideration that they believe is an important component of school quality.
Informational Interventions
Next, our surveys included informational interventions presenting common arguments about how to evaluate school quality. In Study 1, we randomly assigned participants (with equal probability) to one of five groups: the control group, in which participants received a video with no informational intervention; the test score treatment group, in which participants received a video emphasizing the importance of test scores; the growth treatment group, in which participants received a video suggesting growth in test scores as an alternative metric; the peer-effects treatment group, in which participants received a video describing peer effects; and the crowding-out treatment group, in which participants received a video explaining the crowding-out effects of standardized testing. Each of the growth, peer-effects, and crowding-out videos included the text from the test score treatment. For Study 2, due to the smaller sample size, we reduced the number of informational interventions to three and randomly assign participants to either the control group, the growth treatment group, or the peer-effects treatment group. Based on the Study 1 results, we identified the growth and peer-effects treatments as worthy of further examination.
The informational messages were original videos constructed by the research team using Biteable in the style of infographic educational videos. The scripts for the videos, provided in Table 2, were inspired by articles from the Washington Post and Education Next or by how GreatSchools described school ratings and other performance information to parents and community members on its popular website.
Video scripts for informational interventions
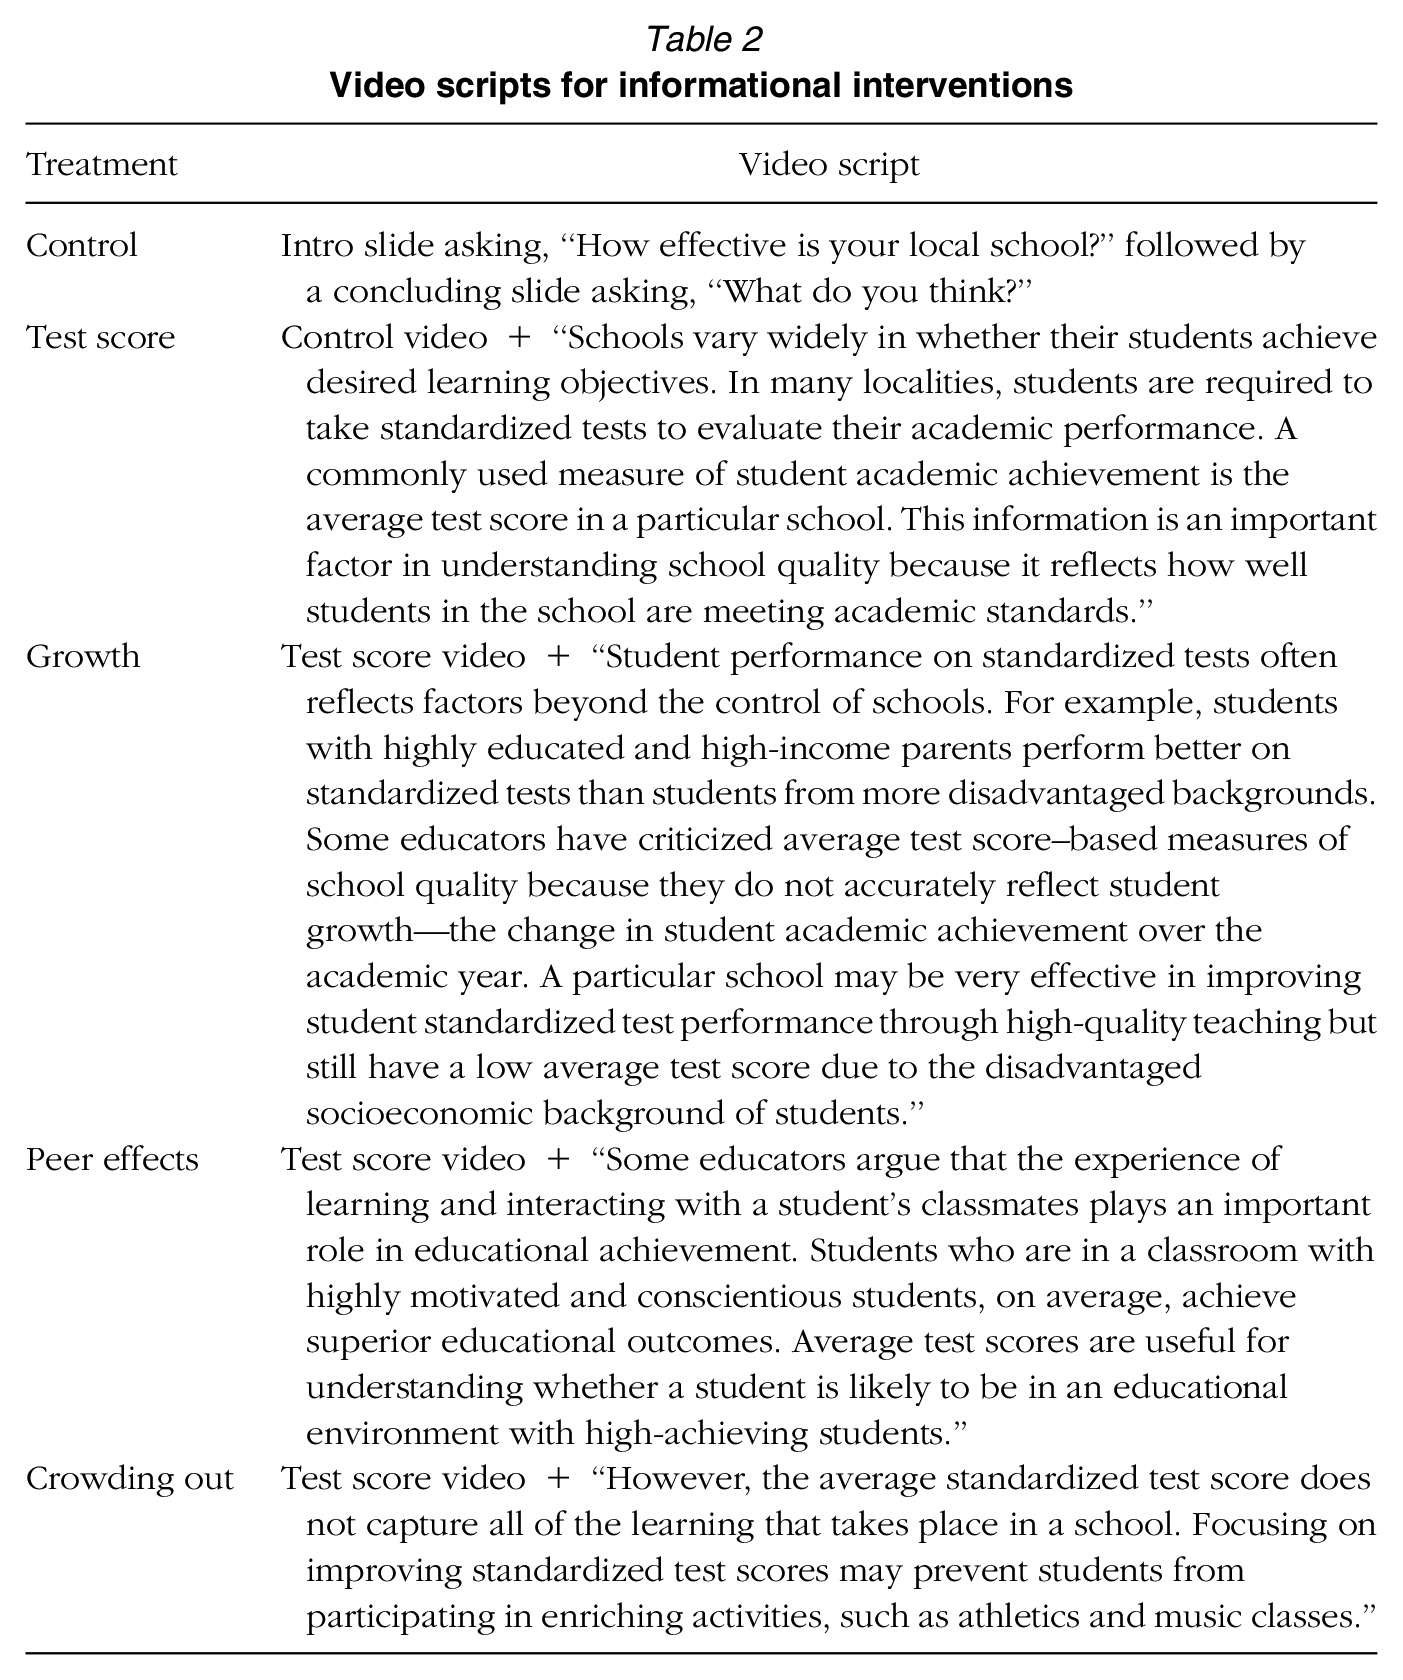
While we could not force respondents to watch the videos, we delayed the “Advance” button on the surveys for both studies by the length of time required to watch the assigned video in order to encourage viewing. Our videos do not autoplay and require the respondent to click to start the video. Because they were hosted on YouTube, we examined the number of views on the videos for Study 1 to determine the compliance rates with our treatments. In Study 1, we found 4,455 views across 6,934 Lucid respondents, producing an overall compliance rate of ~64%. 10 For Study 2, we added a JavaScript-based tracker to the Qualtrics survey that provided an individual-level measure of whether a respondent clicked to watch the assigned video. 11 For the Prolific sample in Study 2, the compliance rate was much higher, with 94% of respondents clicking to watch their assigned video. We used the assignment of the video treatments, irrespective of whether respondents actually watched the videos, to identify intention-to-treat (ITT) effects, which were appropriate for the policy context and interventions that we studied. Given the high rate of compliance in Study 2, the ITT effects approximated complier average causal effects. Still, in Appendix Table A6 in the online version of the journal we present both ITT and complier average causal effects estimates for both studies for the primary tests of our hypotheses.
Conjoint Task
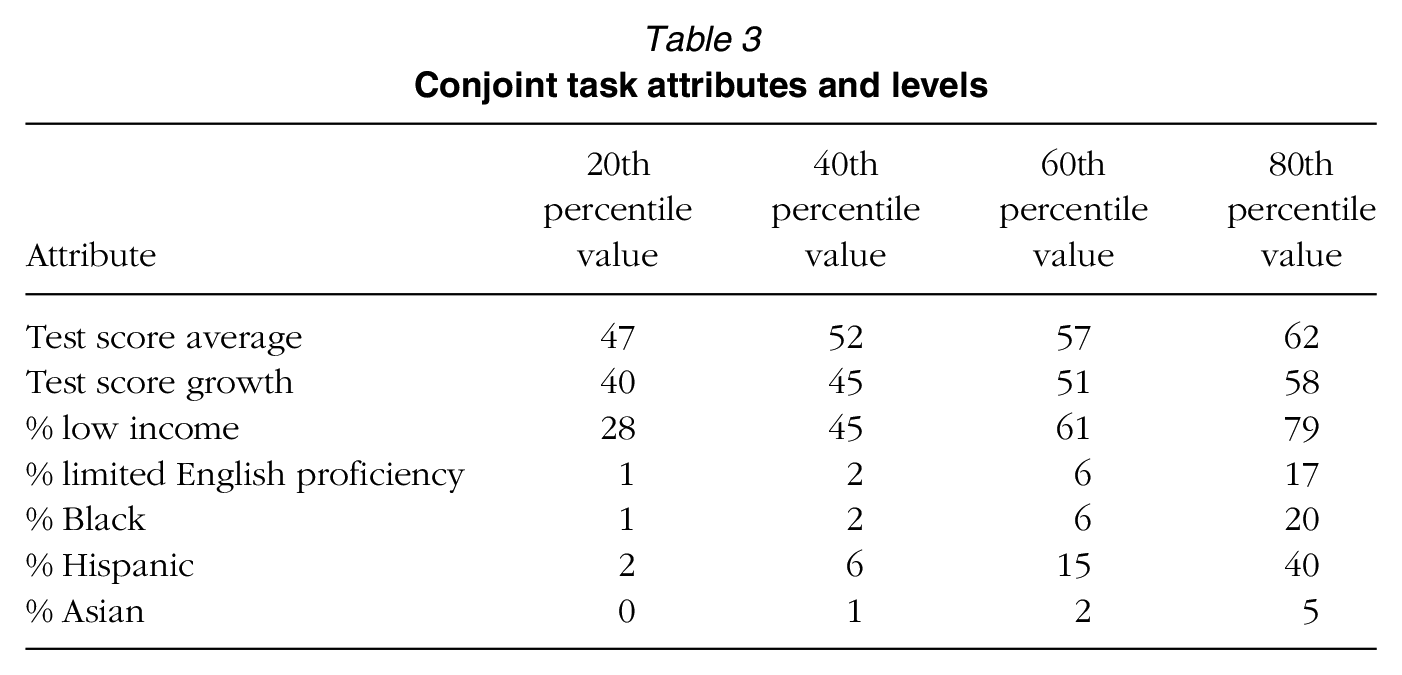
Then, in both studies, participants completed a conjoint task, or a discrete-choice experiment. That is, we used a survey experimental technique where respondents were asked to select between alternatives—in this case hypothetical 12 school profiles—where each alternative consisted of a randomized bundle of multidimensional characteristics—in this case, school attributes. In particular, in our studies, respondents viewed five pairs of school profiles with information about test score averages, student standardized test score growth, and school demographic composition. The conjoint task allowed us to examine the relative importance of variation in each of these dimensions in influencing school choice. We can explore, for example, how respondents weigh variation in test scores relative to variation in the racial composition of a school's student body. We independently randomized each characteristic so that we could examine the impact of a particular school characteristic, holding all other characteristics equal.
We further followed the recommendations of de la Cuesta et al. (2022) by randomizing based on the distribution of these school attributes of interest in the real world. In particular, we based the information displayed to participants on actual school data from the Stanford Education Data Archive (SEDA). We combined school academic and demographic data from SEDA to create a database of 59,597 schools. 13 Respondents randomly received (with equal probability) values corresponding to either the 20th, 40th, 60th, or 80th percentile levels for each demographic attribute, 14 and we independently randomized each of the seven school characteristics. 15 Table 3 describes the school attributes in the conjoint profiles, and Figure 1 presents an example of how the school profiles were displayed to survey respondents in Study 1. 16
Conjoint task attributes and levels

Example school profiles for Study 1.
In Study 1, we displayed the percentage of White students in the school, which we deterministically calculated as 100 minus the sum of the Asian, Black, and Hispanic student percentages. 17 While we reported this information to respondents, we did not consider it a conjoint attribute and did not use it to conduct any analyses because this information was entirely determined by the realized levels of the Asian, Black, and Hispanic student percentages. The percentage of White students in the school was not displayed to respondents in Study 2 due to a difference in the way that attributes were ordered and presented.
That is, in Study 1, we did not randomize the order in which attributes were displayed to respondents. We instead preferred a consistent ordering that was similar to the way that school information is displayed on the widely used GreatSchools website. The Study 1 list of attributes placed the attributes of primary importance to many of our hypotheses, test score averages and test score growth first. Moreover, the information displayed in the school profiles was brief (without lengthy text) and relatively easy to take in visually, reducing the cognitive load on respondents. In our analysis of the effects of the informational interventions, a consistent order of attributes was less of a concern because our main treatment effects of interest were average component interaction effects (ACIEs) rather than standard average marginal component effects.
Still, randomizing the order of attributes in a conjoint experiment offers benefits, including reducing the possibility that attributes farther down the list suffer from more limited respondent attention. Therefore, in Study 2, we randomized the order of attributes at the respondent level. We created three blocks grouping the test score information, the low-income and limited-English-proficiency demographics, and the racial demographics, and we randomized the order in which these three blocks were displayed. This approach allowed us to assess whether key findings from Study 1 were driven by the placement of the test score information at the top of the school profiles.
Finally, following each pair of school profiles, we asked respondents to choose between the schools. In particular, we asked the following question: “If you had to pick, would you enroll your child in School A or School B?” After the first-choice task, each respondent was given four additional choice tasks for a total of five choices between pairs of schools with randomly selected attributes.
Analysis Strategy
Open-Ended Survey Responses
To analyze responses to the open-ended survey question about evaluating school quality, we performed text-as-data techniques to measure the important themes that respondents invoked when describing school quality. We followed the preprocessing steps—removal of punctuation, converting to lowercase, stemming, and lemmatizing the responses—used by Ferrario and Stantcheva (2022). Then we performed topic modeling using the topicmodels package in R (Grün & Hornik, 2011) to identify distinct overall themes in the responses. We also conducted keyness analysis using the quanteda package in R (Benoit et al., 2018) to examine differences in views on school quality between subgroups of respondents, pooling the open-ended text responses across Studies 1 and 2. Results were similar when we broke out the Study 1 and Study 2 respondents and separately analyze each set of open-ended text responses.
Impact of School Characteristics
Next, to analyze the results of the conjoint-choice task, we followed the approach of Hainmueller et al. (2014). We estimated average marginal component effects (AMCEs) for each school characteristic using the cregg package in R. This is equivalent to using the following ordinary-least-squares regression specification:

where
Impact of the Informational Interventions
Finally, we evaluated the impact of the information interventions by estimating ACIEs. To estimate the ACIEs, we again used the cregg package in R and made use of a similar regression model as earlier but with the addition of interaction effects between our treatments and the school attributes. That is, we compared responsiveness with the school attributes among respondents in each of the informational treatment groups (i.e., test score, growth, peer effects, and crowding out) with respondents in the control intervention. Statistically significant differences in responses to school attributes in the treatment groups relative to the control group indicated that the informational videos impacted respondents’ use of the attributes in their hypothetical enrollment choices.
To determine whether treatment effects varied with respondent attentiveness, we also reestimated our main models subsetting to attentive respondents according to the attentiveness index measure constructed from the screeners based on Berinsky et al. (2021) and the attentiveness cluster measure using the classification approach of Read et al. (2021). 18
Results
What Matters for School Quality? Text Analysis of Open-Ended Survey Responses
Before examining how respondents evaluated the school characteristics that we manipulated in the conjoint-choice task, we examined the open-ended responses to the question, “When thinking about what makes one school better than another, what are your main considerations?” First, we used topic modeling to identify common topics discussed in the open-ended responses. 19 Figure 2 displays the two primary topics identified from the open-ended responses, representing two distinct ways of thinking about school quality. The first topic, which we labeled as the qualitative topic, was associated with words such as quality, safety, location, and curriculum. The second topic, which we labeled as the quantitative topic, was associated with words such as scores, test, funding, ratio, and rate. It is possible that individuals with a quantitative versus qualitative view of school quality respond differently to school performance information, such as test score averages, and we return to this possibility when we discuss the results of the conjoint-choice task below.
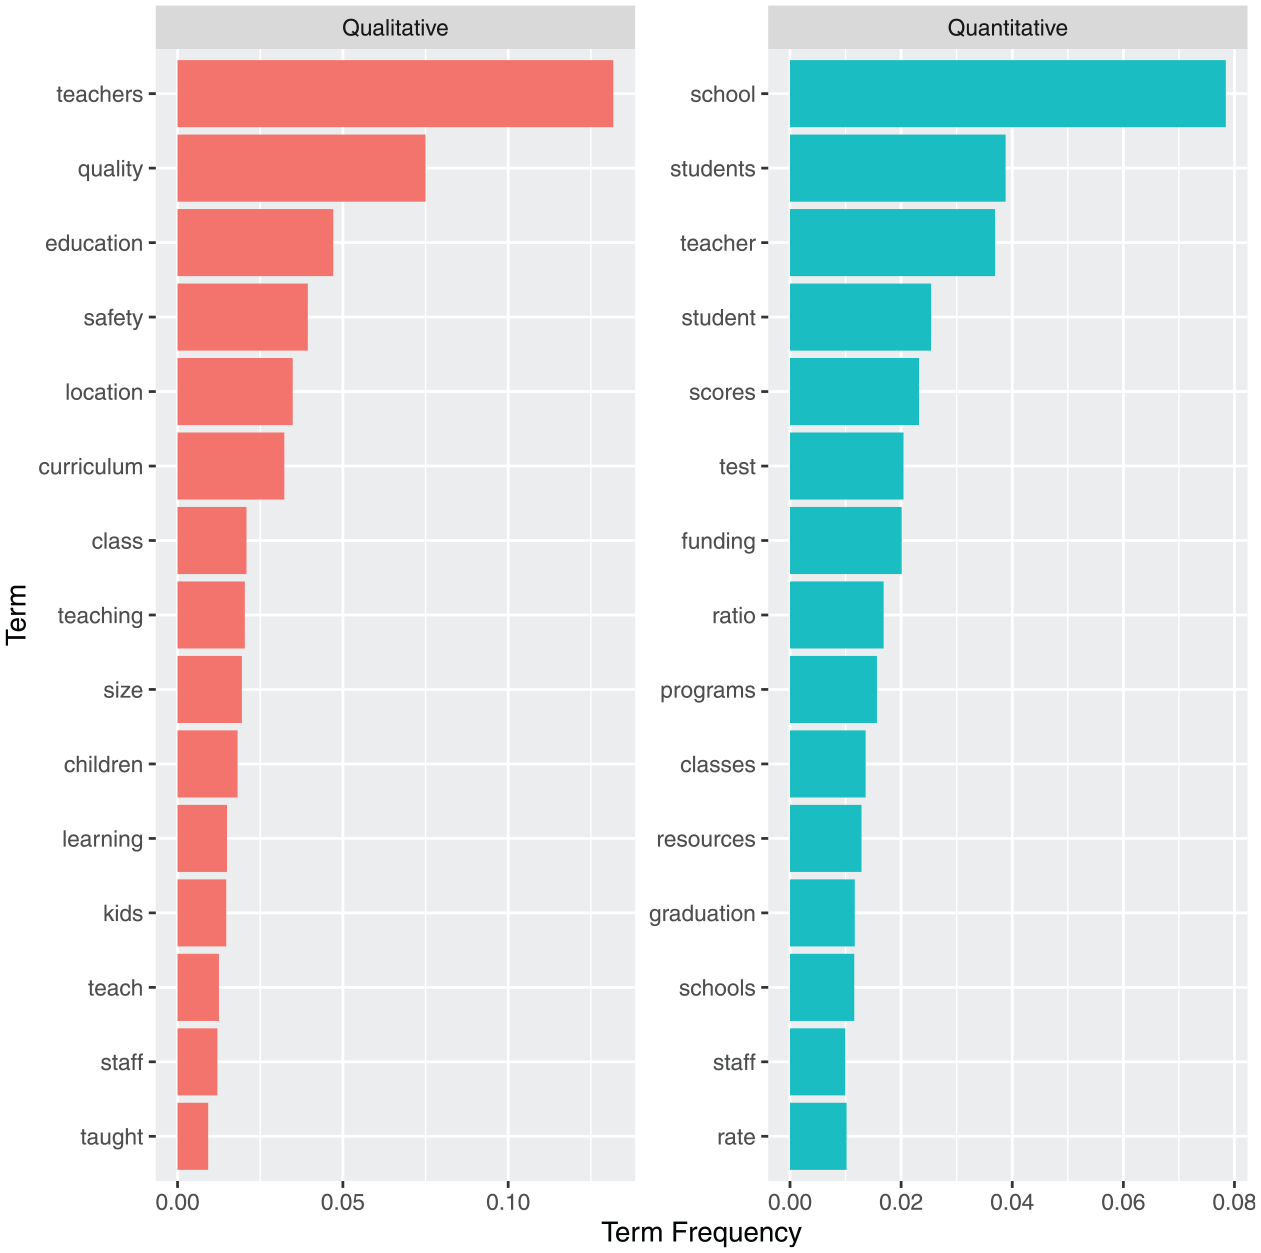
Topics in open-ended responses and associated terms.
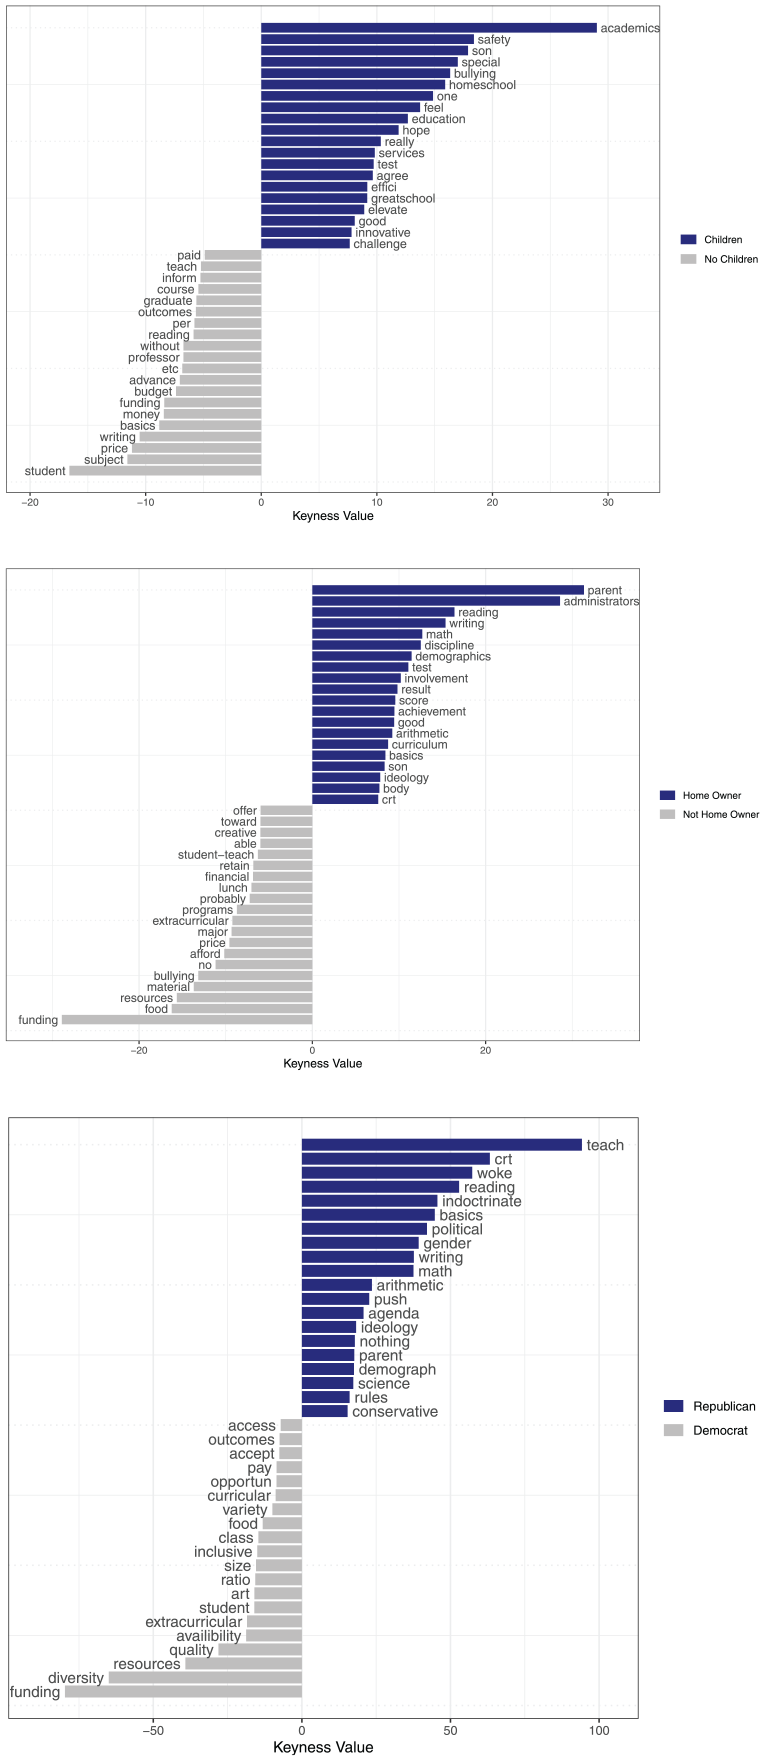
Next, we used keyness analysis to examine how open-ended responses differed by respondent demographics and political partisanship. 20 Figure 3 presents differences in unigram—single word or word stem—usage across respondents with and without school-aged children (top), respondents who owned their home and those who did not (middle), and Republicans and Democrats (bottom). The figure reports the 20 unigrams for each group that best distinguished it from the comparison group. 21
Keyness analysis of differences in unigram usage.
Unigrams capturing the concepts of school safety, teacher quality, and curricular content were characteristic of respondents with school-aged children. In contrast, respondents without school-aged children tended to focus on the cost of education, using the terms price and cost. Homeowners focused on parental involvement in the school and were somewhat concerned with contentious issues in contemporary political debates, using terms such as CRT (critical race theory) and ideological. Nonhomeowners were influenced by school cost considerations, as evidenced by use of the terms financial, afford, and price. Both parents of school-aged children and homeowners focused on test scores more than respondents without school-aged children and nonhomeowners. Finally, the keyness analysis of differences in unigram usage across Republicans and Democrats was illustrative of prominent contemporary debates. 22 The terms CRT, ideological, indoctrination, and gender were characteristic of Republican respondents, whereas diversity and inclusion were indicative of Democratic respondents. 23
An important takeaway from the analysis of the open-ended survey responses is that many individuals thought about school quality in ways different from researchers and different from what's measured for state report cards and reported on websites. While some of our respondents mentioned test scores, other considerations, such as teacher quality and class sizes, were more frequently reported. Moreover, individuals’ experiences and identities, including considerations related to their children or partisanship, may influence their perceptions of school quality separately from, and perhaps prior to, other external sources of information.
Responsiveness to Test Performance and Demographic Characteristics
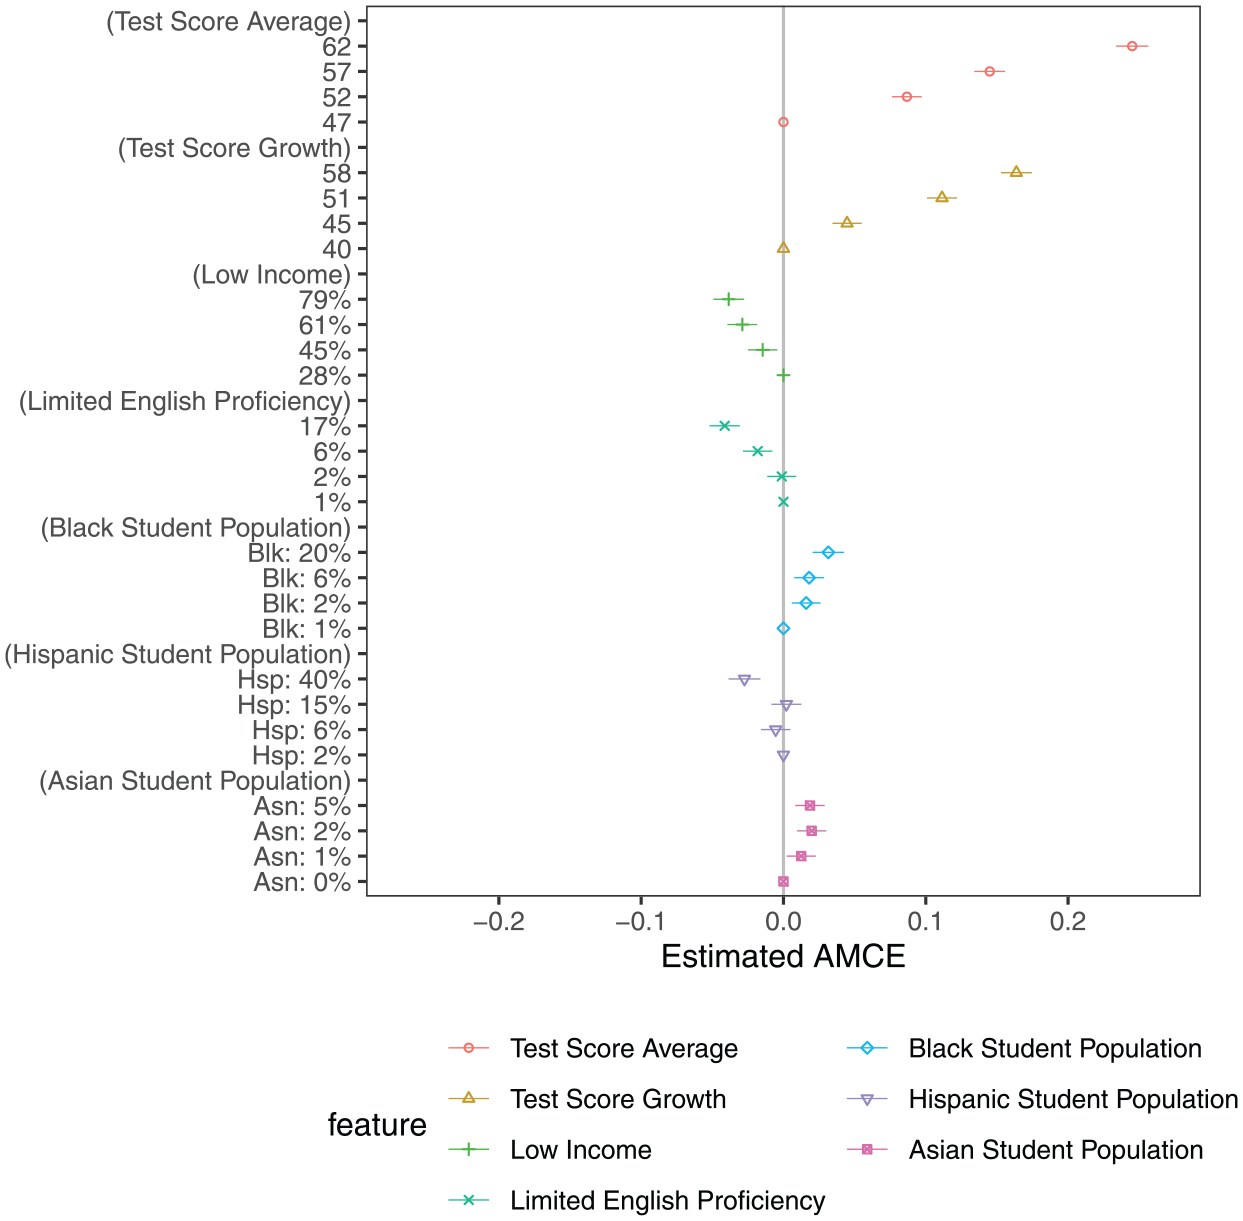
Next, we studied respondents’ relative preferences for academic achievement, growth, and student demographic composition in evaluating school quality. Figure 4 displays average marginal component effects for Study 1, representing the individual impact of each attribute level on respondents’ probability of choosing the associated school, averaged over the distribution of the remaining attributes. Attribute levels with estimates of zero and without confidence intervals represent the reference levels within attribute categories (such as 47 for the test score average). Figure 4 indicates that individuals were most responsive to academic achievement and growth in assessing school quality. Hypothetical schools with a test score average of 62 were about 24.5 percentage points more likely to be selected than schools with a test score average of only 47. Schools with a growth level of 58 were about 16.4 percentage points more likely to be selected than schools with a growth level of only 40. 24 Moreover, preferences for achievement and growth were clearly monotonic—higher achievement and higher growth led to higher selection probabilities. These results comport with expectations given the literature on achievement and growth as signals of school quality.
Effects of school characteristics on enrollment preferences for Study 1.
As for student demographic composition, we found that this information exerted less influence on individuals’ assessments. Still, interesting patterns emerged. Hypothetical schools where the proportion of limited-English-proficiency students was the highest possible category were, on average, 3.8 percentage points less likely to be selected relative to schools with the lowest possible proportion. And schools where the proportion of students with low-income backgrounds was the highest possible category were 4.1 percentage points less likely to be selected than hypothetical schools with the lowest proportion of students with low-income backgrounds. Moreover, while respondents preferred larger Black and Asian student populations (3.2 and 1.9 percentage point increases, respectively, comparing the highest with lowest levels), they preferred smaller Hispanic student populations (2.7 percentage point decrease, comparing highest with lowest levels) on average. However, as described in Appendix Section A8 in the online version of the journal, individuals’ preferences may be determined not only by the size of certain racial groups alone but also by the combined size of certain racial groups, such as the combined Black and Hispanic student population (see Appendix Figure A8 in the online version of the journal).
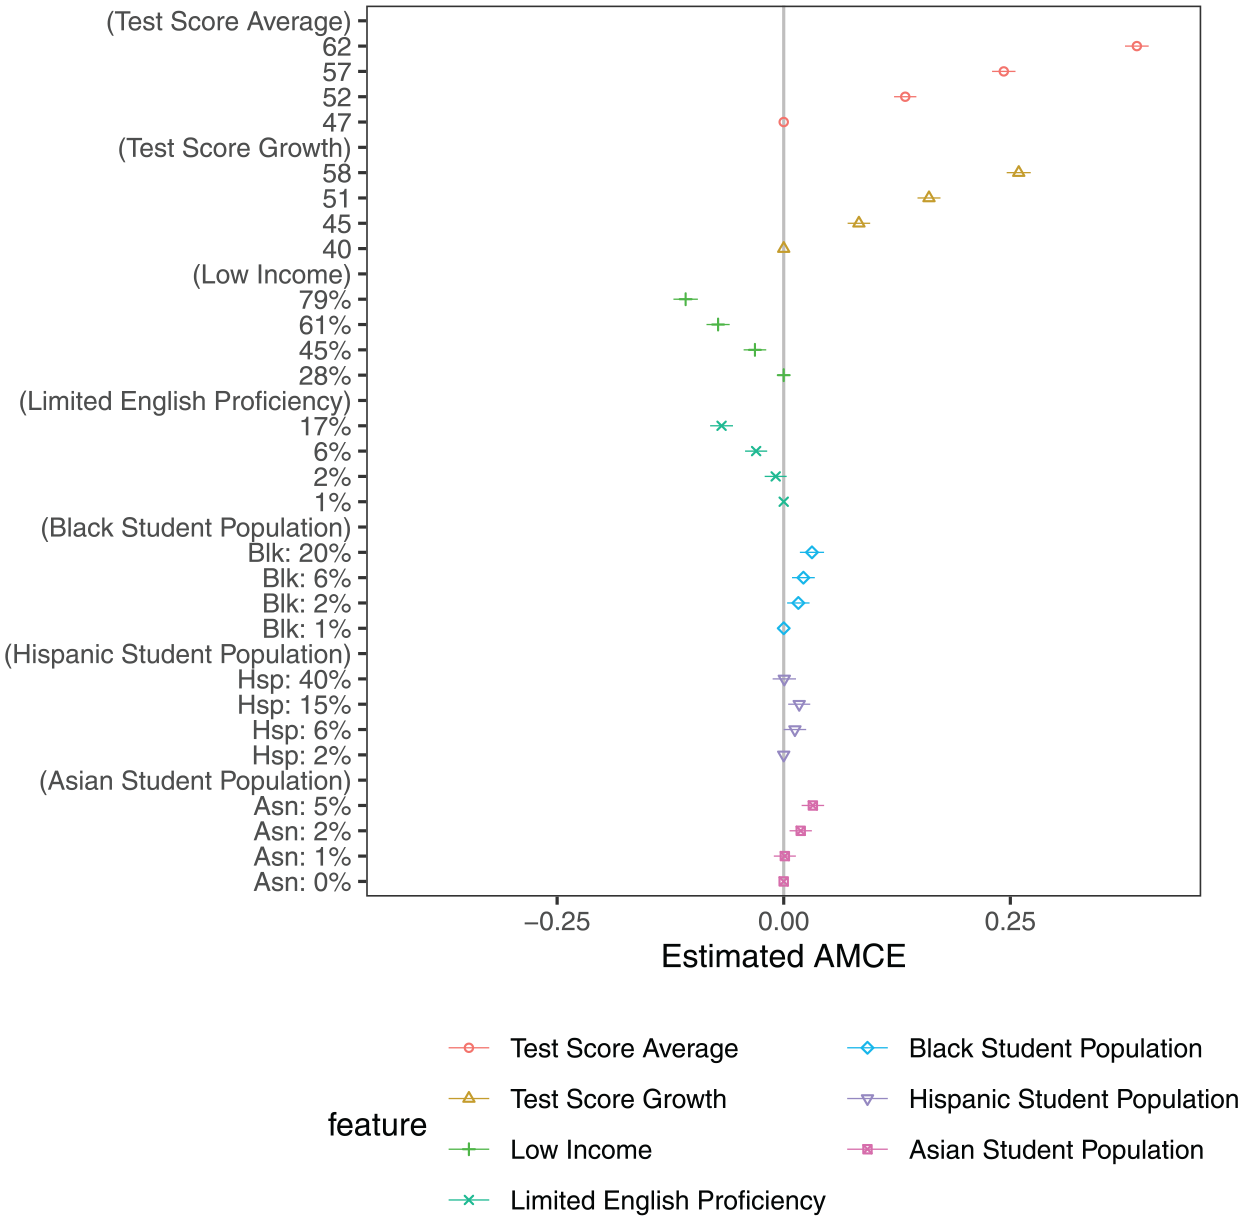
Figure 5 then shows the estimated AMCEs and associated confidence intervals for Study 2 using the more highly attentive Prolific sample. The results are consistent with Study 1, and the magnitudes of the estimated AMCEs are even typically larger than those based on the less attentive Lucid sample. For example, schools with the highest test score level were about 39.0 percentage points more likely to be selected relative to the lowest level in Study 2 compared with 24.5 percentage points in Study 1. Schools with the greatest test score growth were 25.9 percentage points more preferable compared with 16.4 percentage points in Study 1. As discussed previously, we randomized the order of attributes in Study 2. The consistent results between Studies 1 and 2 demonstrate that the large AMCEs on the test score levels that we documented in Study 1 are not an artifact of the test score level information being presented first. The Study 2 results reinforce the Study 1 finding that citizens value test scores more than demographic composition when assessing school quality and making hypothetical enrollment decisions.
Average marginal component effects (AMCEs) for Study 2.
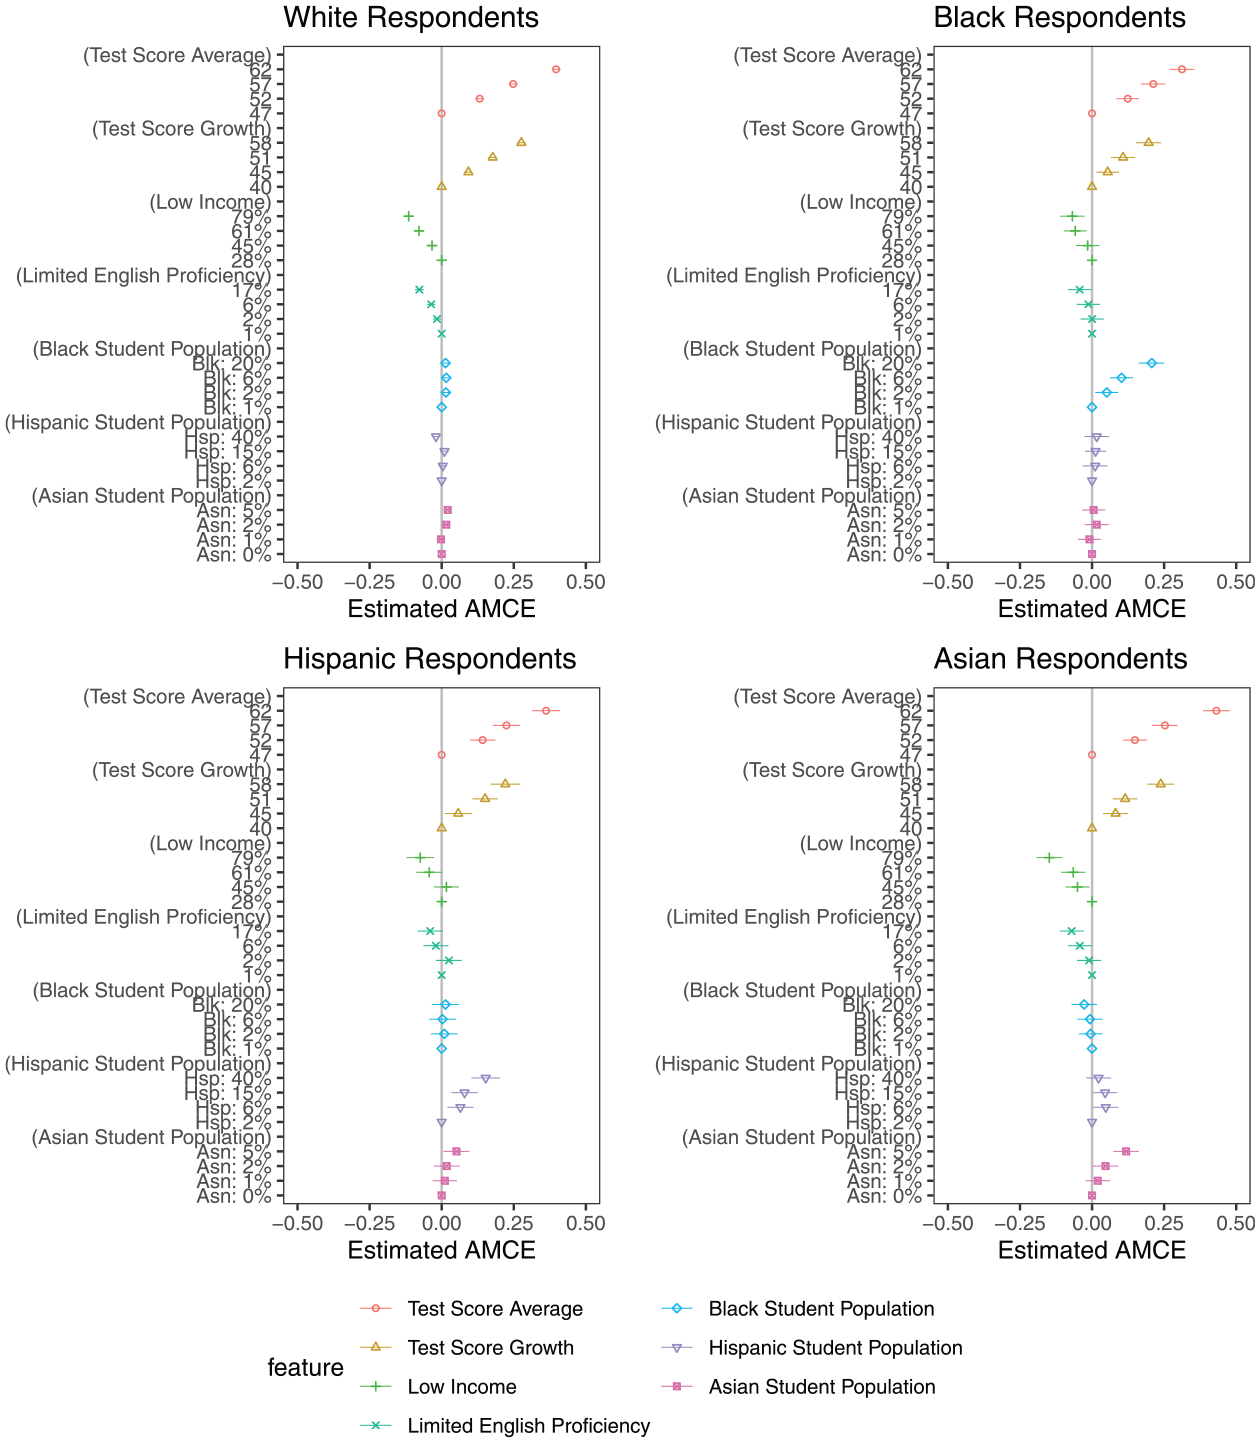
We further investigated whether these trends were driven by differences among respondents with different racial identities. Because the AMCE results are similar both overall and within subgroups for Studies 1 and 2, we present results only for the more highly attentive Prolific sample (Study 2) in the rest of this section. Figure 6 presents AMCE estimates separately for respondents identifying as White (
Average marginal component effects (AMCEs) by respondent race.
Next, Figure 7 indicates stark differences in the importance of school attributes across Republican and Democratic respondents.
26
Compared with Democrats, Republicans had significantly stronger distaste for schools with larger Black (−15.6 percentage points;
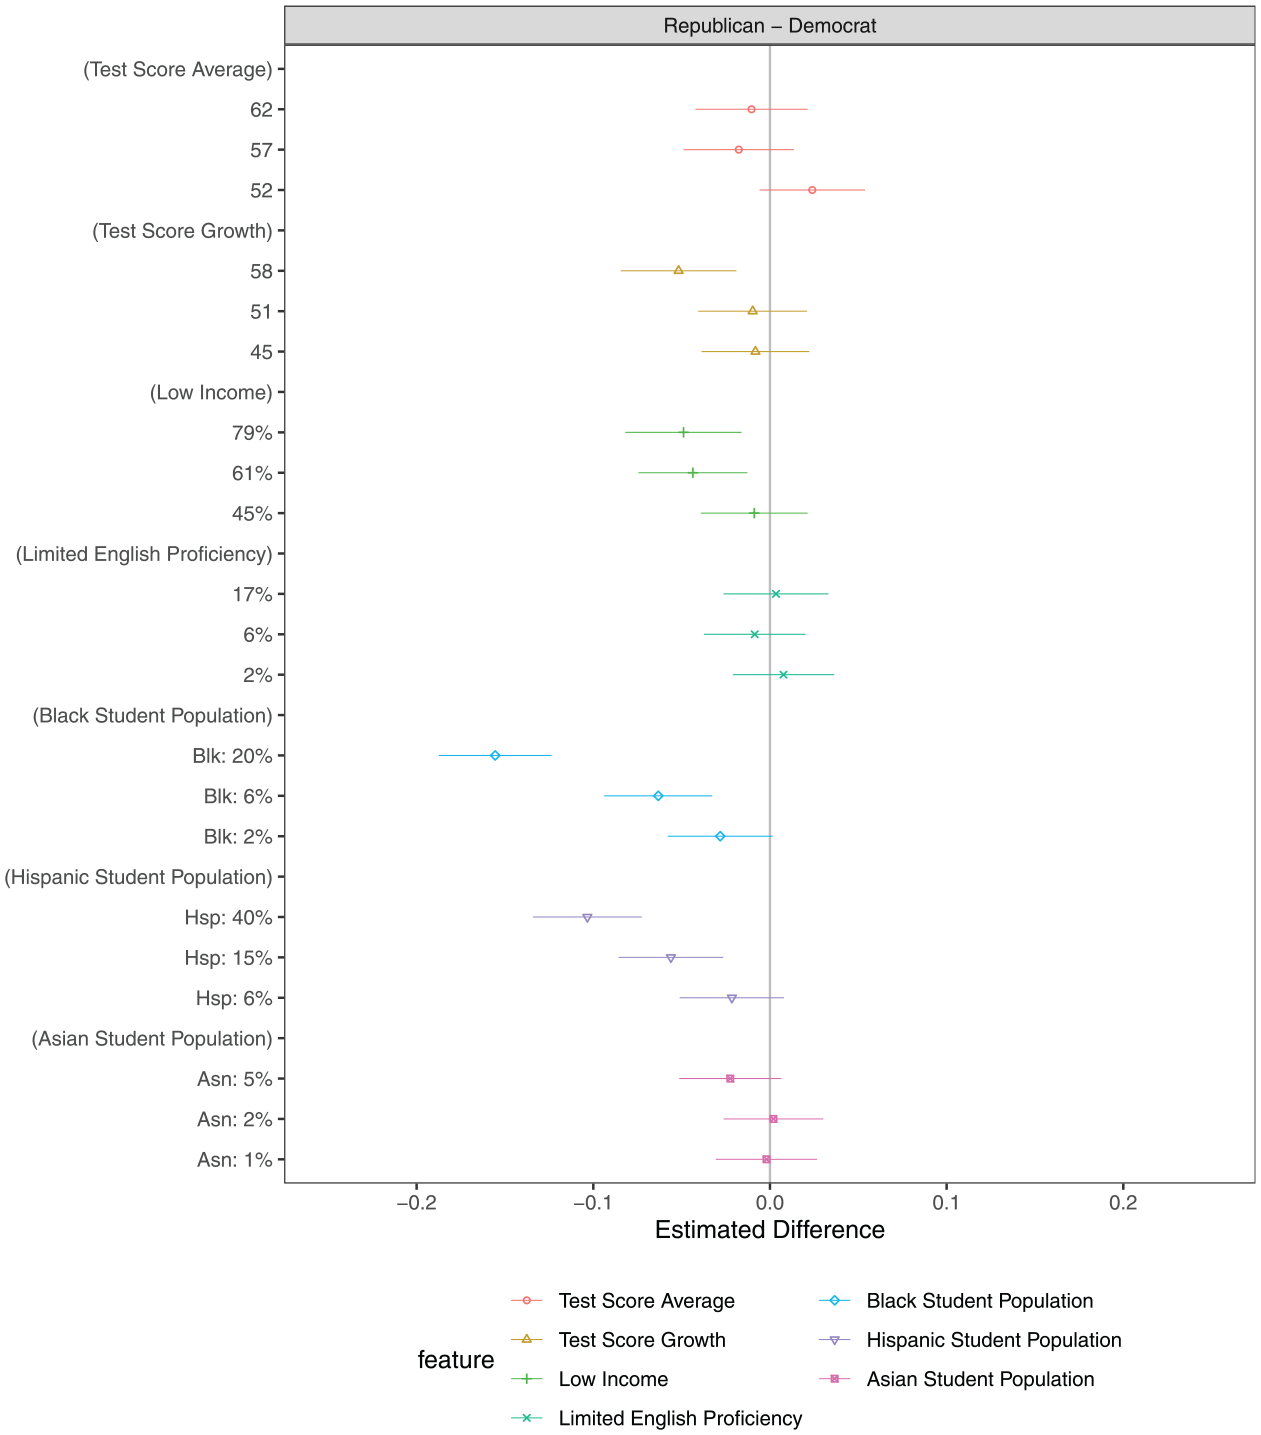
Average marginal component effects (AMCEs) differences for Republicans compared with Democrats.
Finally, we also investigated whether individuals who had a quantitative mindset based on their responses to the open-ended question about school quality
28
responded differently to school performance information. As reported in Appendix Figure A10 in the online version of the journal, we found that respondents with a quantitative view of school quality exhibited a higher probability of selecting schools with the highest test score average (4 percentage points;
Informational Video Treatment Effects
In Study 1, we generally found no systematic impact of our informational interventions on individuals’ responsiveness to specific school attributes. Figure 8 reports ACIEs comparing each treatment group with the control group. Note that these ACIEs differ from the AMCEs presented earlier. For the ACIEs, each point estimate showed how choice probabilities differed for a given attribute level between the respective treatment group and the control group. While some results were suggestive of the impacts that we hypothesized—such as borderline greater responsiveness to the highest test score level in the test score treatment group (3.5 percentage points;
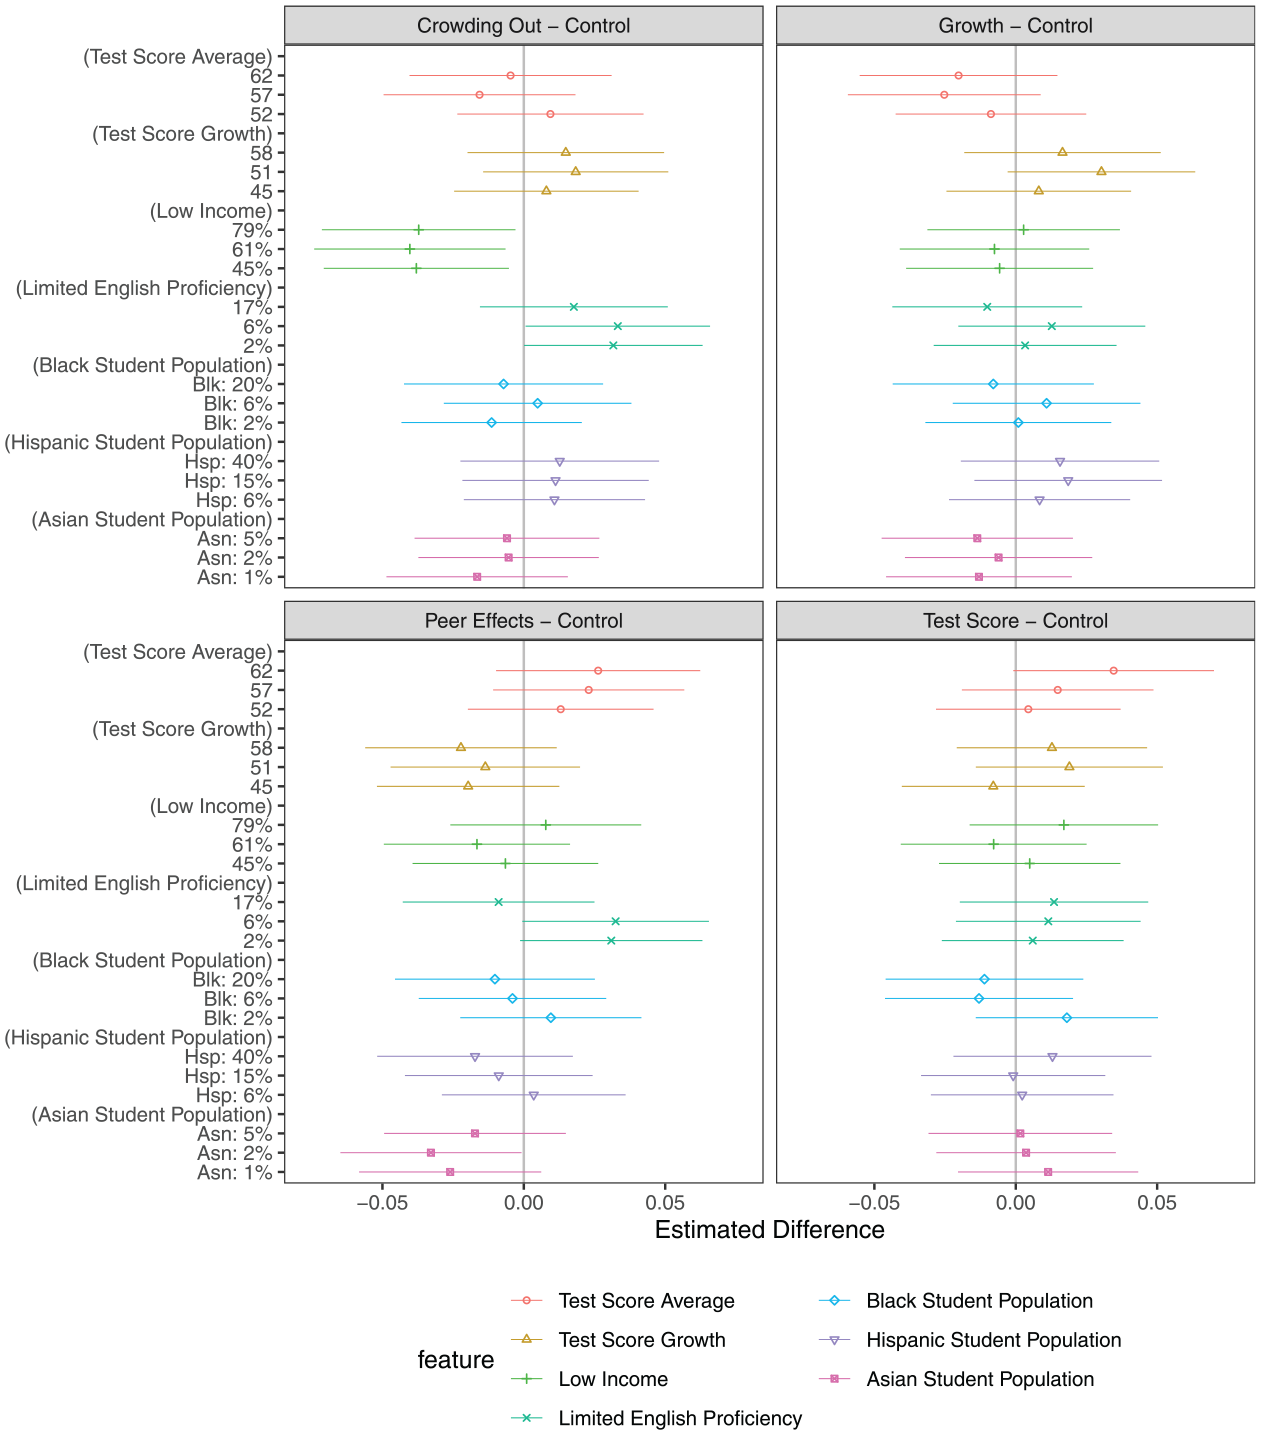
Study 1 average component interaction effects (ACIEs) comparing interventions with the control group.
One possible explanation for the relatively weak relationship between treatment video assignment and demand for school characteristics in Study 1 relates to the findings of the open-ended question analysis. The treatments may not have impacted respondents because they cared about other considerations (such as class sizes) not included in the conjoint-choice task or because they had already solidified preferences based on their identities and experiences. However, another possible explanation concerns respondent inattentiveness. As shown in Appendix Figure A5 in the online version of the journal, we did find some suggestive evidence that among the subset of respondents who correctly answered three or four attention-check screeners, the growth treatment led respondents to value test score levels less than in the control group and that the peer-effects treatment led respondents’ choice probabilities to be more responsive to the racial composition of listed schools. However, Appendix Figure A6 in the online version of the journal demonstrates that these results did not hold when we measured respondent attentiveness using the response-time clustering method.
As discussed earlier, the inattentiveness of the Lucid sample in Study 1 motivated us to conduct Study 2 on a higher-quality Prolific sample. We next examined whether the informational video treatments affected valuation of school attributes in the more attentive Study 2 sample. The estimated ACIEs for the growth and peer-effects treatments (relative to the control video) are displayed in Figure 9. We found several treatment effects that were substantively large and statistically significant. Most notably, respondents who were assigned the growth video treatment valued test score levels less than respondents in the control group (−5.2 percentage points for the highest level). The estimated effects were statistically significant for each of the three values of the test score levels attribute (
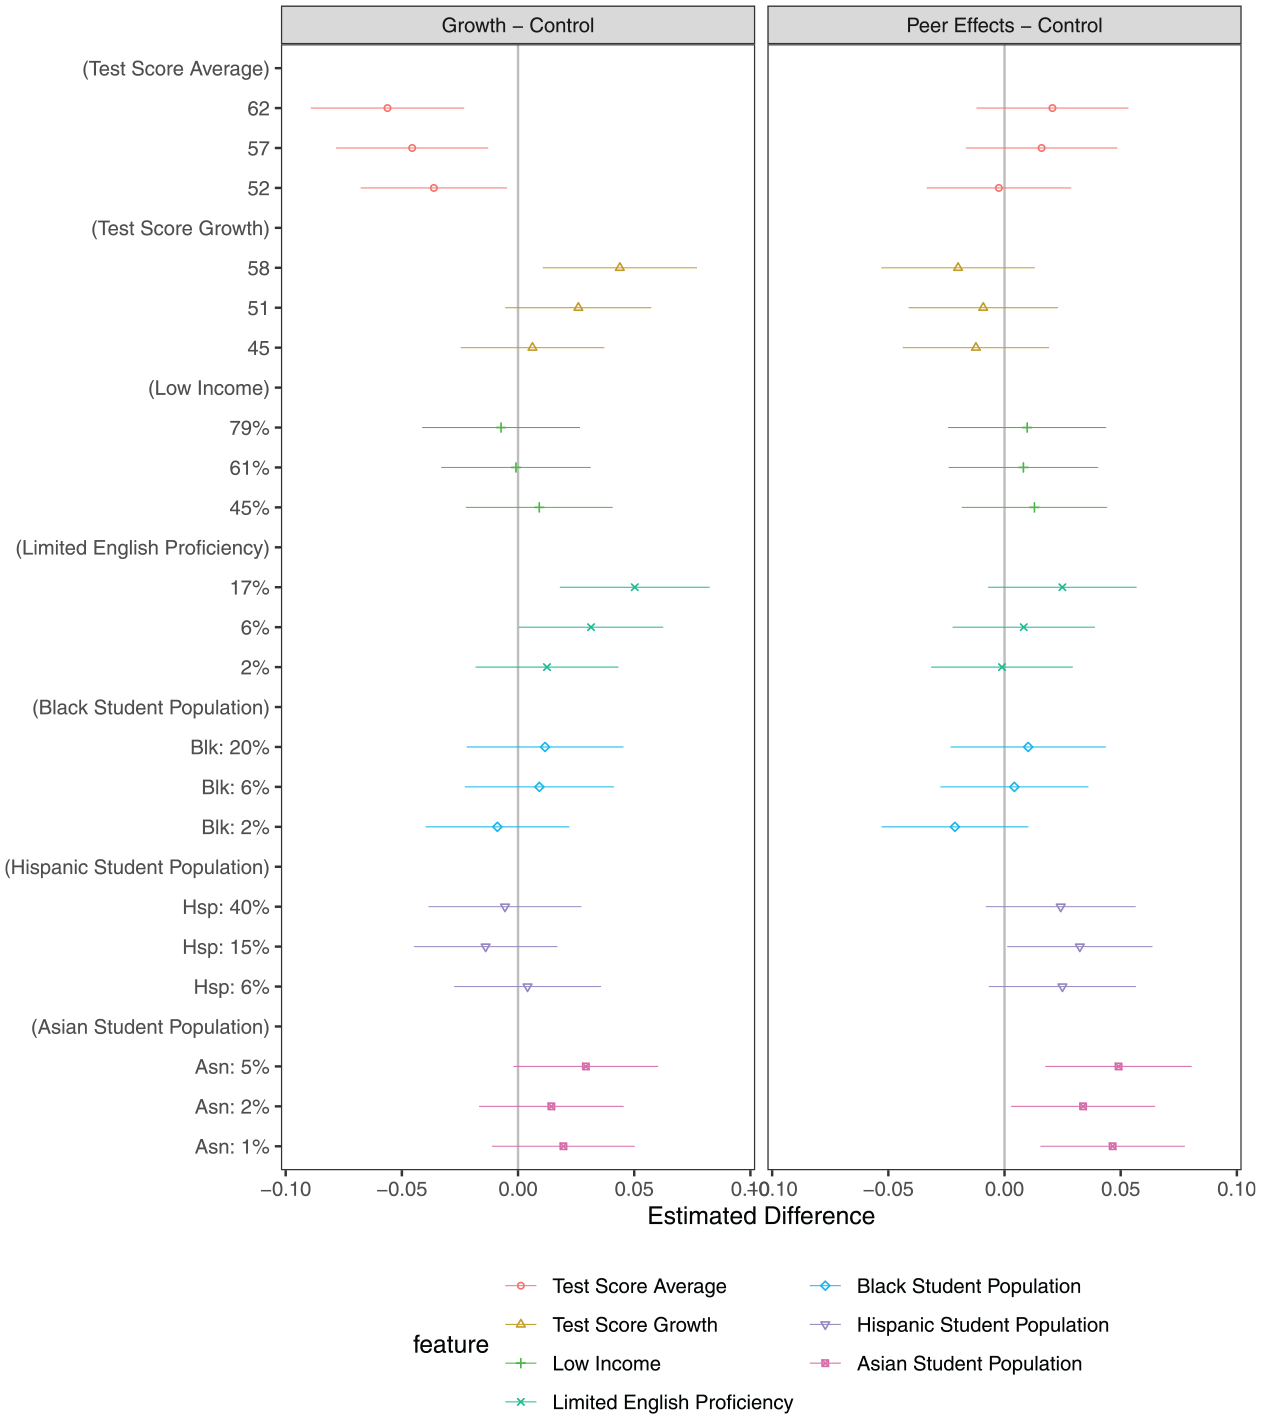
Study 2 average component interaction effects (ACIEs) comparing interventions with the control group.
We also found that respondents in the growth treatment group were more likely to choose schools with high performance on test score growth compared with respondents in the control group. Again, the estimated treatment effects increased with the growth attribute and represented a difference of about 4.3 percentage points (
The peer-effects informational intervention exhibited some patterns that were consistent with our theoretical expectations regarding how considerations of students’ peers might affect school choice behavior. Respondents who received the peer-effects treatment were more likely to select schools with larger Asian student populations (4.6 percentage points for the highest level). This may reflect perceived associations between Asian students and high academic achievement. The estimated effects were statistically significant for all three attribute levels (
To examine the possibility of differential impacts of the video treatments on respondents with a quantitative view of school quality, Appendix Figure A11 in the online version of the journal presents the treatment effects of the informational videos among the subset of respondents whose open-ended responses used quantitative terminology (about 37% of the sample). We found that treatment effects for this subset were similar in direction to the treatment effects for the full sample. However, some treatment effect magnitudes were larger. For example, quantitatively minded respondents in the growth treatment group were 10 percentage points (
Discussion
In choosing between schools, we found that individuals responded most strongly to test scores, then to growth information, and then to student demographic information. This is perhaps unsurprising given the significant attention devoted to standardized testing by schools, parents, politicians, and the media since the NCLB Act in 2001 and given prior scholarly work documenting the importance of achievement status (Haderlein, 2022). We also found evidence of responsiveness to student racial composition, even while holding fixed academic achievement and schools’ low-income and limited-English-proficiency populations. In the aggregate, these preferences were relatively muted in magnitude: up to 3 percentage points compared with differences of around 39, 26, 11, and 7 percentage points for the highest levels of test scores, growth, the low-income student population, and the limited-English-proficiency student population, respectively. However, we found stronger preferences within subgroups. As in Billingham and Hunt (2016), among non-White respondents, we found preferences on the order of 12–21 percentage points for larger shares of students matching respondents’ own racial identity. Of note, this pattern is driven primarily by Democrats and does not hold among Republicans of color. In addition, we found some evidence of different preferences regarding school racial composition for White respondents. While White Democrats were more likely to select schools with larger Black and Hispanic student populations, White Republicans were less likely to select schools with non-White student populations.
Because response bias, particularly demand effects and social desirability bias, is a potential concern in many surveys and survey experiments, we cannot rule out the possibility that respondents did not truthfully reveal their preferences regarding school racial composition. However, conjoint experiments are often preferred in situations where social desirability bias is a concern because they require simultaneous consideration of multiple attributes, with responses less clearly linked to any one particular, potentially sensitive item (Hankinson, 2018; Teele et al., 2018). Furthermore, recent work suggests that conjoint experiments can indeed reduce social desirability bias (Horiuchi et al., 2022). Nonetheless, a different issue is that the school racial composition information may have affected respondents’ beliefs about other relevant background features of the hypothetical schools, producing an information equivalence concern (Dafoe et al., 2018). While our design helped to minimize some of these concerns—we directly manipulated and therefore controlled for the related attributes of the low-income student population and the limited-English-proficiency student population—because socioeconomic status and migrant status are linked to perceptions of race (Landgrave & Weller, 2022), we can only account for the attributes displayed to respondents, and it is possible that respondents’ beliefs shifted on other unmeasured dimensions.
Moreover, it is important to note that a limitation of our experimental design is that respondents received hypothetical school profiles based on the full distribution of schools in the United States rather than based on schools that might be more representative of the area in which they live. This may affect the interpretation of our treatment effects, especially with regard to school racial composition, because actual school options may be significantly more racially segregated than the hypothetical options presented in our survey. It is possible that the preferences revealed in our survey would be even stronger given more racially segregated options, but we are hesitant to draw such conclusions. Additionally, we acknowledge that individuals may not form their preferences based on isolated school attributes but instead based on combinations of attributes. In Appendix Section A8 in the online version of the journal we explore and discuss the joint effects of school racial composition, such as how the combined White + Asian student population may affect school enrollment preferences. We encourage continued efforts to examine such joint effects, following the example of Houston and Henig (2021), who considered bundles of attributes for school districts, or Yun and Moreno (2006), who examine geographic clusters of schools.
As to the effectiveness of informational interventions, we found evidence that some common arguments regarding school quality led individuals to use different metrics in their evaluations of schools. In particular, we found that the growth treatment shifted respondents’ evaluations away from test score achievement and toward test score growth. The effects were especially strong among the subset of respondents who expressed a quantitative mindset toward school quality (e.g., mentioned terms such as score and rating in their open-ended responses about school quality). To assess the magnitude of our results relative to prior work, we compared responsiveness to growth between our Study 2 and Haderlein (2022), who similarly used a conjoint-choice task to investigate preferences for school achievement status, growth, and demographics. Haderlein found a 187% increase in the odds that a parent would select a school comparing the highest growth level with the lowest growth level. Replicating Haderlein's analysis approach (conditional logit model) and also comparing our highest growth level with the lowest growth level, we observed a somewhat similar increase in odds for the control group in Study 2 (221%), which still saw a short video, and an even larger increase in odds for the growth treatment group in Study 2 (283%), which watched the growth-focused informational video. This suggests that our engaging videos exerted a larger influence on attributes used for hypothetical school enrollment choices than in prior work without such informational interventions.
In addition, these impacts are not only limited to Study 2 with the more attentive Prolific sample. When pooling the attentive respondents in Studies 1 and 2 (see Appendix Figure A3 in the online version of the journal) and when considering only the attentive respondents in Study 1 (see Appendix Figure A4 in the online version of the journal), respondents who received the growth intervention consistently valued test scores less than the control group. This suggests that informational interventions emphasizing how standardized test achievement may not be a valid indicator of student learning can be effective in shifting individuals’ attention away from the arguably poor metrics of school quality. In addition, arguments regarding peer effects may lead individuals to more strongly consider the characteristics of other students in the classroom. Finally, we also found some limited evidence regarding the test score and crowding-out interventions. Arguments emphasizing test scores may lead individuals to increase their already substantially high attention to test scores. Arguments emphasizing how standardized testing takes time away from arts, sports, and other enrichment activities may cause individuals to avoid schools with larger low-income student populations because these schools may be less likely to have the funding to provide those opportunities.
However, the reduced impact of the informational interventions in the less attentive Lucid sample in Study 1 suggests a further important takeaway: For informational interventions regarding school performance metrics to influence parents and community members, these messages must actually reach them. Informational videos and other communications strategies can be impactful only when people actually watch them. For the many governments, nongovernmental organizations, and community organizations that devote significant time and attention to communicating with parents regarding how to interpret school performance information, this study's findings suggest the need to measure actual parent engagement through various communication strategies. In-person meetings, for example, may be more effective for gaining attention and changing minds but also may limit the reach of outreach efforts.
Nonetheless, simply gaining parents’ attention may not be enough on its own. School performance information also must be made understandable and accessible to parents and community members, including, for example, through explaining how growth is calculated. Moreover, this information must be memorable. While our study cannot assess the degree to which treatment effects persist and the arguments in the informational videos impact respondents’ future choices, these considerations may be highly important to policymakers and advocates. Additionally, individuals must be motivated and incentivized to consume new information about school performance. The individuals who took our surveys were paid survey takers who had financial reasons to engage with the informational interventions, especially the highly experienced, high-quality sample in Study 2. Therefore, our results may not fully generalize to the broader public, comprised of individuals with other demands on their attention and prior considerations regarding school performance.
Finally, the findings of the open-ended question analysis suggest that individuals may not be motivated to consume new information about school performance if they care about factors such as class environment and teacher quality that are not included. While we found significant treatment effects for the informational videos among respondents who thought about school quality in a quantitative way, additional research should be devoted to understanding the choices of parents who think about school quality in a more qualitative way, choices that may not be reflected well by experimental studies, especially conjoint experiments. Mixed-methods research studies should be employed to offer advice regarding how more qualitative information about schools could be communicated to parents through means such as school report cards, parent forums, and informational videos.
Given the differences between Democrats and Republicans in the conjoint task and in the open-ended responses, our results also suggest that national political discourse may have significant impacts on more local choices, such as school enrollment, although it is also possible that other factors associated with Republican identification and preferences for less diverse schools (such as a lower value attributed to identity-based politics and representation) also may explain these results. Nonetheless, the significant differences in the content of the open-ended responses between Democrats and Republicans (such as the greater emphasis on CRT 32 and indoctrination for Republicans) provide further support for the idea that national messages are shaping local preferences. Hopkins (2018) has shown that voting behavior is increasingly nationalized, and scholars have documented that attitudes on education policy issues have exhibited increasing levels of partisan polarization over the past several decades (Houston, 2024; Shapiro et al., 2021). As Reckhow et al. (2017) and Henig et al. (2019) highlight the role of external money in the nationalization of school board elections and school politics, our findings suggest an impact of external ideas from national political debates in local politics.
Yet, it is important to remember that some topics of national political debate—such as those surrounding CRT and transgender rights—originated in conversations about schools. More work should be devoted to understanding the two-way street through which school politics and national-level party politics influence one another.
Supplemental Material
sj-docx-1-aer-10.3102_00028312251315740 – Supplemental material for Assessing the Impact of Informational Interventions on Perceptions of School Quality
Supplemental material, sj-docx-1-aer-10.3102_00028312251315740 for Assessing the Impact of Informational Interventions on Perceptions of School Quality by Kaylyn Jackson Schiff and Zachary Peskowitz in American Educational Research Journal
Footnotes
Disclosures
No conflict of interest exists in the submission of this manuscript.
Funding
The author(s) disclosed receipt of the following financial support for the research, authorship, and/or publication of this article: Funding for this research was provided by Purdue University and Emory University.
Notes
References
Supplementary Material
Please find the following supplemental material available below.
For Open Access articles published under a Creative Commons License, all supplemental material carries the same license as the article it is associated with.
For non-Open Access articles published, all supplemental material carries a non-exclusive license, and permission requests for re-use of supplemental material or any part of supplemental material shall be sent directly to the copyright owner as specified in the copyright notice associated with the article.