
Abstract
Undermatching identifies high school graduates who do not attend selective colleges even if they have high academic performance. To date, the study of undermatching is restricted to access to selective colleges and to the United States and the United Kingdom. We expand this concept to identify students who, having high academic performance, do not undertake five critical educational transitions: graduating from high school, enrolling in higher education, taking the college-entry exam, enrolling in university, and enrolling in a selective university. Using the case of Chile and a novel population-level panel dataset combining administrative and survey data, we found that undermatching is prevalent, highly stratified by socioeconomic status, and stronger among disadvantaged boys than girls. A Gelbach decomposition analysis suggested that inequality in undermatching is largely accounted for by the students’ sorting across schools. We discuss the implications of undermatching for countries around the world.
Keywords
Introduction
As young people transition into adulthood, they face choices with important consequences for their economic well-being. Among these choices, youth need to decide whether to obtain a high school diploma, whether to continue to higher education, and which kind of postsecondary institution to attend. The context of such decisions has changed dramatically as countries have experienced expansion and differentiation of their higher educational systems. Despite these changes, a strong association between socioeconomic background and educational attainment persists across many countries. To understand the persistence of disparities, the sociologic literature offers a distinction between socioeconomic gaps in students’ academic performance measured by grade-point average (GPA) or test scores (so-called primary effects) and socioeconomic gaps in higher education enrollment given similar levels of academic performance (i.e., secondary effects), driven by gaps in access to information, preferences, borrowing constraints, and perceived risks of pursuing higher education (Boudon, 1974; Breen & Goldthorpe, 1997; Erikson et al., 2005; Jackson & Buckner, 2016; Jackson & Jonsson, 2013; Jackson et al., 2007).
The theoretical distinction between academic performance and educational decisions net of performance underlies the newer concept of undermatching. The concept emerged in the United States to describe high-performing high school graduates who do not enroll in selective universities they would likely have gained access to on the basis of their performance and instead attend less-selective institutions (Dillon & Smith, 2017). In the United States, undermatching is particularly prevalent among students from low-income, low-education, and rural families. Several factors may account for the high prevalence of undermatching among disadvantaged youth, including barriers based on family economic and cultural resources, limited information, quality and composition of schools attended, and absence of role models that would encourage them to pursue educational opportunities (Campbell et al., 2022; Dillon & Smith, 2017; Dynarski et al., 2021; Hoxby & Avery, 2013; Hoxby & Turner, 2015; Maragkou, 2020; Muskens et al., 2019).
Undermatching highlights the financial, social, or cultural barriers faced by “bright but poor” youth, and it offers an approach to guide educational equalization policies around the world. Research has shown that undermatching harms individuals and society. Compared with their matched peers, undermatched students are less likely to graduate from college and have lower college satisfaction and lower earnings (Cavaglia et al., 2024; Cook, 2022; Dillon & Smith, 2017; Kang & García Torres, 2021; Maragkou, 2020; Muskens, 2020; Muskens et al., 2019; Ovnik et al., 2018). Undermatching curbs upward mobility, and reduces the benefits of higher education for society in terms of increased productivity, reduced crime, improved public health, and greater civic engagement, among others (Campbell et al., 2022; Chetty et al., 2020; Hout, 2012; Psacharopoulos & Patrinos, 2018).
To date, undermatching has been mostly studied in the United States and the United Kingdom, and it has been mostly restricted to the access to highly selective universities (Campbell et al., 2022; Dillon & Smith, 2017; Hoxby & Avery, 2013; Li et al., 2023; Muskens et al., 2019; Wolniak & Muskens, 2021). These limitations reduce the relevance of the concept for two reasons. First, undermatching is likely prevalent in other countries, particularly in developing nations characterized by large returns to higher education and high economic inequality. Second, although selective universities yield large economic returns (Black & Smith, 2004, 2006; Brewer et al., 1999; Dale & Krueger, 2014, 2002; Monks, 2000; Thomas, 2003; Thomas & Zhang, 2005), many young people around the world do not make earlier educational transitions such as graduating from high school or attending postsecondary education even if they have sufficient academic qualifications to do so.
This study expands the concept of undermatching to earlier educational transitions instead of restricting it to enrolling in selective universities and expands its application to other national contexts. Specifically, we studied the case of Chile, a country characterized by high inequality and a meritocratic university admission system. We used an original population-level panel dataset that combined administrative and survey data to follow all Chilean students from fourth grade to higher education to provide, to the best of our knowledge, the first assessment of educational undermatch in Latin America. We examined the extent to which students’ academic performance and decisions not driven by performance contributed to undermatching in five critical educational transitions: graduating from high school, entering higher education, taking the university admission exam, enrolling in university, and enrolling in a selective university.
We address four questions: (a) How prevalent is undermatching across these five educational transitions? (b) To what extent is undermatching stratified by family socioeconomic status (SES)? (c) Are there differences in undermatching between male and female students? and (d) What are the mechanisms accounting for undermatching? We proceed as follows: The second section describes the Chilean higher education system. The third section discusses theoretical approaches with a focus on the concept of undermatching. The fourth section introduces the data and methods. The fifth section offers the analysis of undermatching across educational transitions as well as SES disparities and gender differences in undermatching. The sixth section offers a discussion and policy implications of the findings. The final section concludes.
Context: The Chilean Educational System
We chose the case of Chile for several reasons. First, while the undermatching literature has focused on the United States and the United Kingdom., it is important to examine it in other countries, especially those characterized by high inequality and high returns to schooling. Second, Chile features a university admissions system based on standard measures of academic performance, including university entry exam scores and GPA, instead of personal interviews, legacies, or athlete quotas, which makes the criteria for undermatching exceptionally clear. Third, we rely on an original population-level panel dataset based on administrative and survey data sources. This dataset allowed us to examine the educational transitions of all students who attended fourth grade in 2006, alleviating sample selectivity driven by nonuniversal enrollment and attrition.
The Chilean educational system underwent a market-oriented transformation since 1981 in the context of a military dictatorship. A universal school voucher system was established in which a per-student subsidy was paid to public and private K–12 schools. Families were allowed to choose among schools, and private schools receiving the voucher were able to select admitted students (Contreras et al., 2010; Lara et al., 2011; Torche, 2005). This transformation provided incentives for schools to recruit advantaged students and for families to sort into advantaged peer groups (Hsieh & Urquiola, 2006). Research has suggested that private voucher schools had small to null effects on test scores but that the system resulted in marked socioeconomic segregation across schools (Giaconi et al., 2022; Hsieh & Urquiola, 2006; Lara et al., 2011; Mizala & Torche, 2012; Valenzuela et al., 2014). Since the reestablishment of democracy in 1990, subsequent governments have channeled additional resources to low-SES schools and students and have attempted to reduce socioeconomic gaps across schools. Substantial socioeconomic segregation across schools persists to date, however (Gutiérrez & Carrasco, 2021).
The market-oriented reform of the educational system included higher education, too. Until 1980, the Chilean higher education system was an elite system. Only 10% of youth aged 20–24 years were enrolled in higher education, and only eight public and nine private higher education institutions existed in the country (Von Hippel & Hofflinger, 2021). The transformation implemented since 1981 reduced regulation and relied on private institutions and sources of funding (Torche, 2005).
After attaining a high school diploma, students can enroll in three kinds of higher education institutions: universities, professional institutes, and technical training centers. Universities offer bachelor's programs of ≥5 years of duration and graduate degrees, professional institutes offer 4-year professional degrees, and technical training centers offer vocational training usually lasting 2 years. By 2015, there were 156 higher education institutions in the country. In that year, 57% of postsecondary students enrolled in universities, 31% attended professional institutes, and 12% enrolled in technical training centers. A distinctive feature of the Chilean system is the large market share of the private sector. By 2015, 85% of undergraduate students attended private institutions (Sistema Nacional de Información de la Educación Superior [SIES], 2015).
Most universities in the country (33 of 58 in 2015) grant admission through a centralized system based on measures of academic performance. The factors considered in admissions include university entry test scores, high school GPA, and, since 2013, high school grade rank (Catalán et al., 2022). The weights of these three components vary somewhat across institutions and majors, but on average, they are 57, 18, and 25%, respectively. The college entry exam is given annually at the end of the academic year. Since 2006, the government has provided scholarships that fully defray the exam fee to all high school seniors (except for those attending private-paid high schools serving the Chilean elite). High school graduates apply through the centralized admissions system to institution–major combinations, ranking their top choices. A matching algorithm pairs them with their preferred choice among the programs that would grant them admission. Other higher education institutions in the country, including universities that do not use the centralized system, professional institutes, and technical training centers, admit students without centralized coordination. They set minimal cutoff values for high school GPA and university entry exam scores or have no requirements beyond a high school diploma. Many of them are open-admissions institutions that accept all applicants.
There is a strong correlation between students’ socioeconomic background and both their academic performance and educational attainment (Canales, 2016; Delisle & Bernasconi, 2018; Mizala & Torche, 2012; OECD, 2022; Von Hippel & Hofflinger, 2021). Low-income students, on average, have lower standardized test scores and lower GPAs. They are less likely to take the university admission test, to enter postsecondary education, and to be admitted to a selective university. Disparities in access to higher education are consequential for economic inequality because, despite substantial postsecondary expansion, a college degree still yields high economic returns in Chile compared with other middle- or high-income nations (Psacharopoulos & Patrinos, 2018). However, returns to higher education are highly heterogeneous (González-Velosa et al., 2015). Selective universities have the largest earnings payoffs, whereas low-selectivity institutions may have limited or even negative returns (Bucarey et al., 2020; Hastings et al., 2013; Rodríguez et al., 2016).
Since the 1981 educational reform, higher education funding relies heavily on tuition fees (Marcucci & Johnstone, 2007). Tuition amounts are set by higher education institutions without government restrictions. This results in substantial variance in prices across institutions, with the highest fees at universities, followed by professional institutes and technical training centers. University tuition fees are among the highest in the world, adjusting for purchasing power, amounting to about half the median family income (Solis, 2017).
Given high postsecondary education fees, many students rely on financial assistance. Since the reestablishment of democracy in 1990, democratic governments have expanded higher education access through grants and loans (Bernasconi & Rojas, 2003; Cox, 2024). In 2015, the main sources of funding were scholarships and loans provided by the government. Students in all kinds of institutions were eligible for some types of grants and loans, although university students—particularly those enrolled in selective institutions—received higher-value packages. Allocation of financial assistance is centralized and, in most cases, linked to performance on the university entry test. In 2015, about half of all students received financial aid from the government in the form of scholarships and subsidized loans (Delisle & Bernasconi, 2018), with the average scholarship covering 80% of the sticker price (Bucarey, 2018). Since 2006, an important source of educational financing is the state-guaranteed loan (crédito con aval del estado in Spanish), which targeted low- and middle-income students. The program reduced liquidity constraints for disadvantaged students and increased postsecondary enrollment, particularly in technical training centers and professional institutes.
In 2016, a groundbreaking law was passed that made university tuition free for all students from families in the lower 50% of the income distribution. The free-tuition law (gratuidad in Spanish) included all public universities in the country. Private institutions could opt in if they had nonprofit status and met high academic accreditation standards, and many did. In 2017, access to free tuition had expanded to less selective universities, professional institutes, and technical training centers (Delisle & Bernasconi, 2018). In 2018, access to free tuition expanded to families in the bottom 60% of the income distribution. The free-tuition policy alleviated financial constraints for some disadvantaged students, but its impact on university enrollment was weaker than anticipated because many eligible students already received generous grants and scholarships (Bucarey, 2018; Delisle & Bernasconi, 2018; Espinoza et al., 2022). The free-tuition policy did not, for the most part, affect the students considered in this analysis, who were enrolled in fourth grade in 2006 and graduated from high school mainly in 2014. 1 Despite increases in financial aid for higher education over the years, disadvantaged students are still likely to face financial constraints, including the costs of room and board and transportation and opportunity costs.
Theoretical Background: Socioeconomic Disparities in Higher Education and Undermatching
Many factors account for socioeconomic stratification in the access to higher education. As outlined in Perna’s (2006) theory of college choice, these factors include liquidity constraints and inadequate financial aid, low academic performance and preparation, and limited information and biased expectations about college emerging from the lack of cultural capital and absence of role models. To examine these SES disparities in educational attainment, scholars have distinguished socioeconomic gaps in students’ academic performance (i.e., primary effects) from gaps in decisions given similar levels of academic performance (i.e., secondary effects) (Boudon, 1974; Erikson et al., 2005; Jackson & Buckner, 2016; Jackson & Jonsson, 2013; Jackson et al., 2007; Schindler & Lorz, 2012).
SES differences in academic performance are shaped by long-run processes starting at birth, including family financial and cultural resources, genetic background, early-life home environment, health and nutrition, peer effects, and cultural biases exhibited by schools, among others (Bourdieu & Passeron, 1977; Calarco, 2018; Cameron & Heckman, 2001; Carneiro & Heckman, 2002; Keane & Wolpin, 1997; Lareau, 2011; Streib, 2011). In contrast, secondary effects capture SES differences in the expected cost, benefit, and probability of success in higher education given a certain level of academic performance (Jackson and Jonsson, 2013). A central mechanism driving secondary effects is financial constraints that could prevent low-income students from attending college or that could make the perceived risk of college too high (Belley & Lochner, 2007; Breen, 1999; Breen & Goldthorpe, 1997; Carneiro & Heckman, 2002; Lochner & Monge-Naranjo, 2011).
Some scholars have argued that long-run processes crystallized in academic performance (i.e., primary effects) are the central determinant of economic inequality in college attendance (Chetty et al., 2020; Pallais & Turner, 2006) and that financial constraints at the time of high school graduation play a minor role (Carneiro & Heckman, 2002). Others contend that the lack of information about college applications or liquidity constraints at the time of high school graduation are critical barriers (Lovenheim & Smith, 2023).
Primary and secondary effects depend not only on family SES but also on school contexts and resources. A vast literature has examined the role schools play in equalizing educational opportunity (e.g., Raudenbush & Eschmann, 2015). In the United States, this literature suggests that tracking and other forms of differentiation across and within schools widen SES gaps in enrollment by shaping students’ learning opportunities, expectations, aspirations, and the composition of their peer groups (Domina et al., 2017; Lucas, 1999; Oakes, 1985). Recent work has documented how schools operate as “sorting machines” that assign students into stratified categories or formal and informal tracks, thereby reinforcing class and racial inequalities (Domina et al., 2017). Studies of socioeconomic and racial segregation across schools underscore that school composition predicts academic trajectories and postsecondary outcomes (Niu & Tienda, 2013; Owens et al., 2016; Palardy, 2013).
Social capital approaches show that students’ educational choices are embedded in networks of peers, teachers, counselors, and family members who transmit information, encouragement, and institutional know-how (Coleman, 1988; Horvat et al., 2003; Stanton-Salazar, 1997, 2001, 2011). Research on high schools has further shown how some schools develop strong college-linking strategies, while others leave students to navigate on their own, reinforcing disparities (Engberg & Wolniak, 2010; Farmer-Hinton, 2008; Hill, 2008). Social reproduction and hidden curriculum perspectives focus on the implicit messages and norms schools communicate about which futures are achievable or desirable for different groups of students (Anyon, 1980; Apple, 2004; Bowles & Gintis, 1976). More recent U.S. scholarship has documented how institutions of higher education contribute to these processes. For example, elite colleges privilege students already fluent in institutional norms (Jack, 2019; Khan, 2011; Stuber, 2011), whereas public flagships organize social and residential pathways that channel working-class students into less academically rewarding tracks (Armstrong & Hamilton, 2013).
Together these theoretical perspectives highlight two main sources of inequality that are central to our analysis: differences tied to students’ family socioeconomic characteristics and differences arising from school contexts. Family resources shape both primary and secondary effects, whereas schools influence the information, expectations, and networks that help determine whether achievement translates into further opportunity.
These insights point directly to the concept of undermatching. Undermatching describes a sorting pattern in which high-performing students do not attend selective colleges even if they would be eligible for admission (Belasco & Trivette, 2015; Hoxby & Avery, 2013; Roderick et al., 2011; Smith et al., 2013). Undermatch is more prevalent among youth from low-income, low-education, and rural families (Belasco & Trivette, 2015; Campbell et al., 2022; Dillon & Smith, 2017; Smith et al., 2013). Students who undermatch tend to attend less-selective secondary schools, where they are not surrounded by a critical mass of fellow high achievers. They have fewer resources to prepare for college, have greater financial and information restrictions, and may not know, for example, about scholarship opportunities (Dillon & Smith, 2017; Dynarski et al., 2021; Hoxby & Avery, 2013). Research also has shown that undermatching is largely driven by students’ own application choices rather than by college admissions decisions (Dillon & Smith, 2017; Hoxby & Avery, 2013). In other words, many students who end up at less selective institutions would have been admitted to more selective ones if they had applied.
Undermatching is a relatively new term but is not a new phenomenon (Smith et al., 2013). It is well established that low-income students apply and enroll in different colleges than high-income students even when they have similar levels of academic performance (Carnevale & Rose, 2004; Hill & Winston, 2010; Kane, 1999; Manski & Wise, 1983). For example, a pioneering study of high school graduates in 1980 showed that low-income students were more likely to attend nonselective institutions regardless of their level of academic achievement (Hearn, 1992). The novelty of the undermatching approach is its focus on students who likely would gain access to selective higher education institutions if they applied, providing a clear target for policy intervention.
Data and Methods
Data
We merged administrative and survey data to create a panel with detailed student-level data for the entire population of Chilean students enrolled in fourth grade in 2006. We tracked students’ educational progress annually using Ministry of Education's records regardless of when students achieved educational milestones. For example, the cohort's normative year of high school graduation was 2014. However, students were included in the panel if they graduated from high school any time between 2013 and 2018, reducing selectivity based on normative graduation.
We added information from five data sources to the initial wave of the panel. First, we added student- and school-level data provided by the Ministry of Education, which reports whether students were promoted from grades 9 to 12 and the grades received each year, the school they attended, and the characteristics of the school (e.g., total enrollment, number of teachers, etc.). Second, we added student-level data provided by the postsecondary admissions system on whether the student enrolled to take the college entry exam any year between 2013 and 2017. We also added information about college entry test scores and whether students applied to and enrolled in a university. Third, we incorporated information on postsecondary enrollment in any higher education institution regardless of the admission system used, obtained from years 2013 to 2018. Fourth, we added fourth grade students’ scores on a standardized test administered by the Ministry of Education, known as SIMCE (Sistema de Medición de la Calidad de la Educación in Spanish). The SIMCE test was given to all fourth graders in the country in 2006 and included math and language subtests. Fifth, the SIMCE test was accompanied by a survey given to the students’ parents or guardians that gathered information about their education, income, and assets, among others. We added information from the SIMCE survey into the panel dataset. We merged these data sources based on a masked ID that uniquely identified students, creating a panel that tracked students from elementary school into their first year of enrollment in higher education. This study was determined to be exempt from institutional review board review because it relied on deidentified secondary data.
Variables
The key variables in our analysis were students’ educational decisions and academic performance. To measure educational decisions, we considered five transitions, namely whether the student graduated from high school, enrolled in postsecondary education, took the university entry exam, enrolled in a university, and enrolled in a selective university. 2 Our measure of academic performance for the first three transitions was the student's high school GPA for all available grades between the ninth and twelfth grades, divided into quintiles. This measure was available for most students regardless of whether they took the university admissions test because only a small proportion of students dropped out of school before the ninth grade. For the last two transitions (i.e., enrolling in a university and in a selective university), our measure of academic performance was a university entry exam percentile score, a weighted average of university admission test scores, high school GPA, and GPA rank across all institution–major combinations, where the weights were the proportional enrollment in each combination.
Our measures of academic performance (as well as those used in the undermatching literature in general) run the risk of reverse causality in the association between students’ academic performance and their educational choices. Reverse causality emerges when academic performance is treated as exogenous when, in fact, it might be driven by students’ choices to pursue further education. For example, some high school students may not prepare for the university-entry test because they have already decided not to pursue higher education. These students likely would perform poorly on the exam (if they take it), and a researcher would erroneously attribute their failure to enroll in postsecondary education to their performance rather than to their anticipatory choice not to prepare (Erikson et al., 2005; Morgan, 2012). To avoid this issue, we examined the robustness of our finding using students’ standardized test scores in fourth grade, an arguably exogenous variable, as an alternative measure of academic performance.
We examined the association between students’ SES and educational attainment, accounting for their academic performance. Our focal measure of SES was parents’ education. We selected the highest level of schooling among both parents if information was available for both and created an ordinal variable with five categories: primary school or less (<9 years of schooling), some secondary (grades 9–11), high school graduate (grade 12), some postsecondary education, and BA degree or more. In addition to parents’ education and students’ academic performance, our models included the following individual and family covariates: students’ sex, household income, household's assets, household's educational and cultural resources, and parents’ ethnicity. All these variables were obtained from the parent survey that accompanied the fourth grade SIMCE standardized test.
Household income was based on self-reports by the students’ parents and measured as an ordinal variable with 13 categories. Midpoint values of each category were used, except for the top category, whose value was determined by using information about the income distribution in the country. Values then were logged. The household assets index was a composite measure based on reports about ownership of the following goods and services: indoor shower, hot-water furnace, color TV, refrigerator, washing machine, car, microwave oven, cable TV, DVD, landline phone, and cellular phone. These items were combined using principal component analysis; the first component was used as the index of SES (Torche and Spilerman 2009). The household educational and cultural resources index relied on a similar methodology. The items included were calculator, computer, internet connection, printer, textbooks, books excluding textbooks, adequate room for studying, newspapers and magazines, and other learning materials. Indigenous ethnicity captured whether either of the student's parents belonged to an Indigenous group.
We added school-level characteristics based on the educational production function literature (Hanushek, 1997). They included mean years of teachers’ experience, total school enrollment, student–teacher ratio, school location (urban/rural), school type (public, private voucher, or private paid). Unfortunately, no variables capturing schools’ normative environment or availability of information about higher education existed in the data. We also added variables capturing the socioeconomic composition of the school, including the school-level mean of parents’ education, standard deviation of parents’ education, mean of household assets, and mean of household educational resources. Table 1 offers descriptive statistics for all variables included in the analysis.
Descriptive statistics
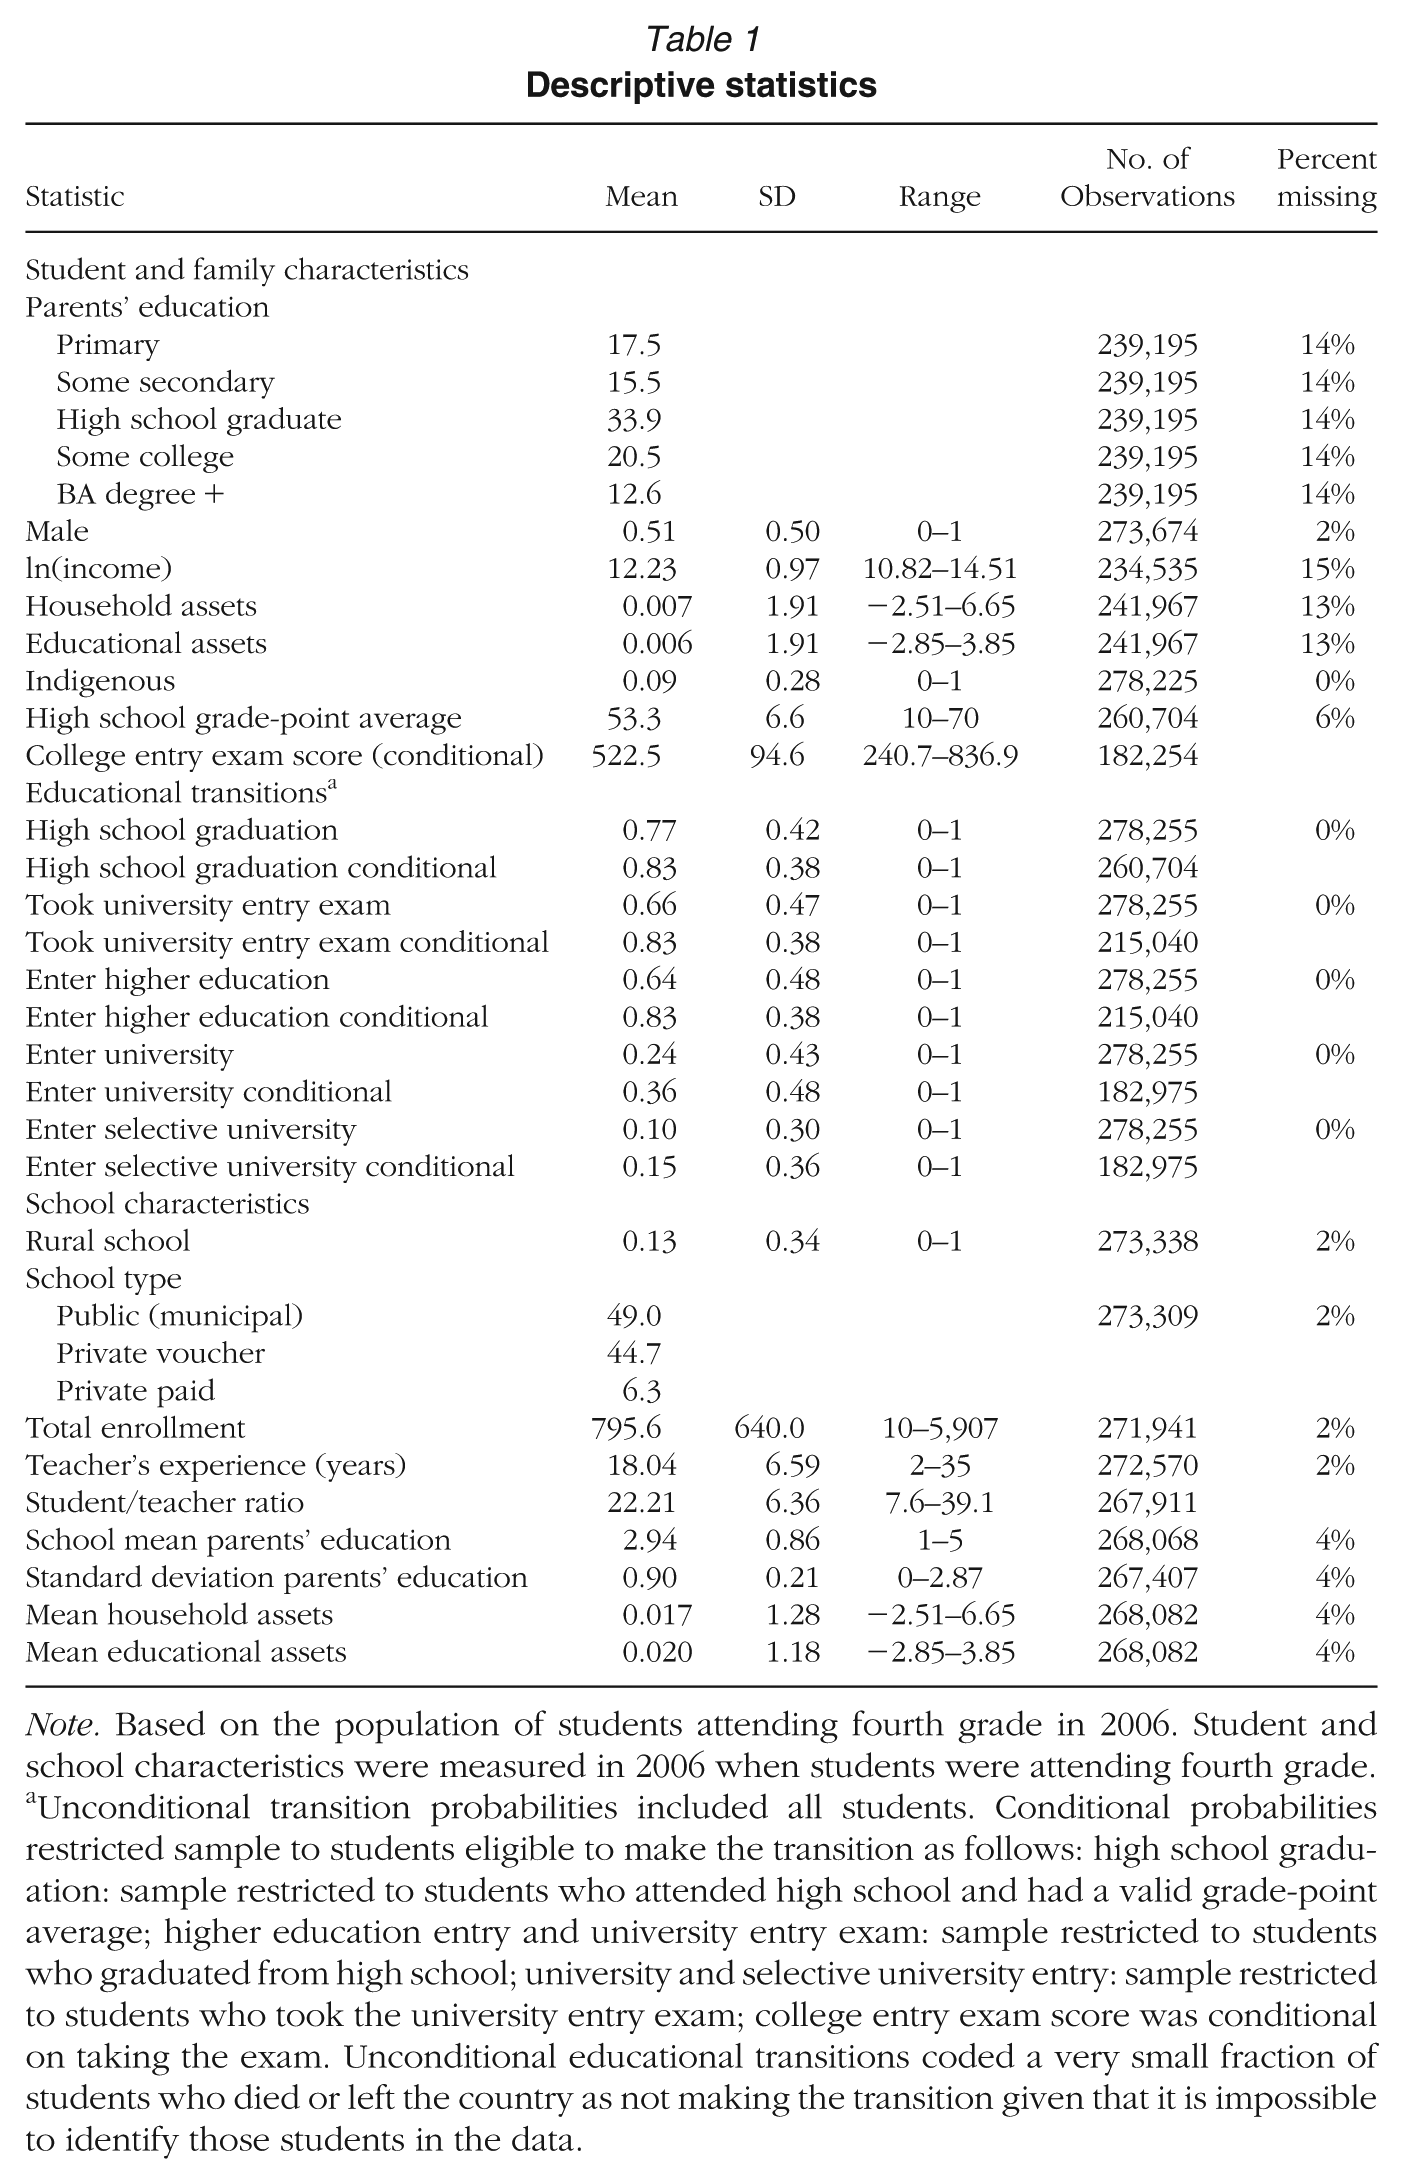
Note. Based on the population of students attending fourth grade in 2006. Student and school characteristics were measured in 2006 when students were attending fourth grade.
Unconditional transition probabilities included all students. Conditional probabilities restricted sample to students eligible to make the transition as follows: high school graduation: sample restricted to students who attended high school and had a valid grade-point average; higher education entry and university entry exam: sample restricted to students who graduated from high school; university and selective university entry: sample restricted to students who took the university entry exam; college entry exam score was conditional on taking the exam. Unconditional educational transitions coded a very small fraction of students who died or left the country as not making the transition given that it is impossible to identify those students in the data.
Analytic Strategy
Before examining undermatching, our introductory analysis examined the extent to which students’ SES and academic performance shaped the probability of making each educational transition using linear probability models. To account for socioeconomic variation at similar levels of academic performance, we included interaction terms between parents’ education and students’ performance using the following model:
where
We then moved to the core of the analysis: the prevalence and stratification of undermatch in Chile. For each of the five educational transitions, we defined undermatch by comparing the percentile rank of the student's high school GPA or college entry exam score with the proportion of students making the transition among those eligible to make it. Eighty-three percent of students with valid GPA scores graduated from high school (transition 1, T1). Therefore, students with high school GPAs in the top 83 percentiles (above the 17th percentile) would be considered “matched” if they graduated from high school and “undermatched” if they did not. Taking the university entry exam (T2) and entering higher education (T3) require a high school diploma. Eighty-three percent of high school graduates took the college entry exam, the same percentage enrolled in any kind of postsecondary education, so high school graduates with a GPA above the 17th percentile would be considered undermatched if they did not enter postsecondary education.
The definition of undermatching for the last two transitions—entering university (T4) and entering a selective university (T5)—relied on the college entry exam percentile score. Thirty-six percent of exam takers enrolled in a university, and 15% enrolled in a selective university. Therefore, students whose university entry score was above the 64th percentile but did not enroll in a university would be considered undermatched in the transition to university, and students who scored above the 85th percentile but did not enroll in a selective university would be considered undermatched.
Our analysis included four components: prevalence of undermatching, variation in undermatching by family SES (measured by parents’ education), gender differences in undermatching, and mechanisms for the stratification of undermatching. All analyses relied on linear probability models with robust standard errors clustered at the school level. 3 Observations with missing values on any covariates were excluded from analysis, resulting in a final analytic sample of 232,141 respondents (83.4% of the original sample of 278,255). To assess the robustness of our findings, we replicated the analyses using multiple imputation. Results were substantively identical, so models using listwise deletion are presented.
We used a Gelbach decomposition approach (Gelbach, 2016) to examine mechanisms accounting for the stratification of undermatching. This method added a set of covariates to the model capturing the association between parents’ education and the probability of undermatching and decomposes the role of these covariates (plausible mediators) in reducing the coefficients capturing the effect of parents’ education. The main advantage of a Gelbach decomposition is that unlike sequential regression models, it is conditional on all covariates in the model, so the estimated explanatory power of mediators does not depend on the order in which they are entered.
We accounted for three sets of covariates. The first one included family resources (i.e., parents’ income, family assets, family educational resources, and parents’ ethnicity). The second set included school-level resources and socioeconomic composition (e.g., mean years of teacher's experience, total school enrollment, student–teacher ratio, school location [urban/rural], school type [public, private voucher, private paid], mean of parents’ education, standard deviation of parents’ education, mean of household assets, and mean of educational resources). Given that some school characteristics might be unobserved or poorly measured, the third set of mediators added school fixed effects. 4 By estimating a different intercept for each school, school fixed-effects models accounted for all—observed and unobserved— differences across schools and provided a comprehensive assessment of differences in school resources and composition.
The degree to which the coefficients capturing the association between parents’ education and the probability of undermatching decline after accounting for those covariates gauged their role as mediators. We emphasize that this decomposition did not support causal identification. We cannot claim that family or school resources causally mediate the effect of parents’ education. Rather, we used this decomposition to describe the relative relevance of family and school resources for the socioeconomic stratification of undermatching.
Findings
Descriptive Analysis
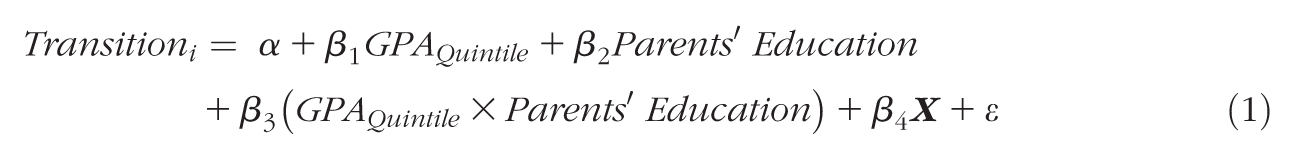
The probability of completing educational milestones varied markedly by family SES. The chance of graduating from high school increased from 62% for students whose parents had primary schooling to 95% for those with college-educated parents (Figure 1). Similarly, the probability of entering any higher education ranged from 40% for the least-advantaged students to a nearly universal 92% for the most-advantaged ones. Moving to the most-selective transitions, the probabilities of entering a university and a selective university were 7 and 3%, respectively, for low-SES students but two thirds and one third, respectively, for the students who had parents with a BA degree.
Percent of students making each educational transition by family socioeconomic status (measured by parents’ educational attainment).
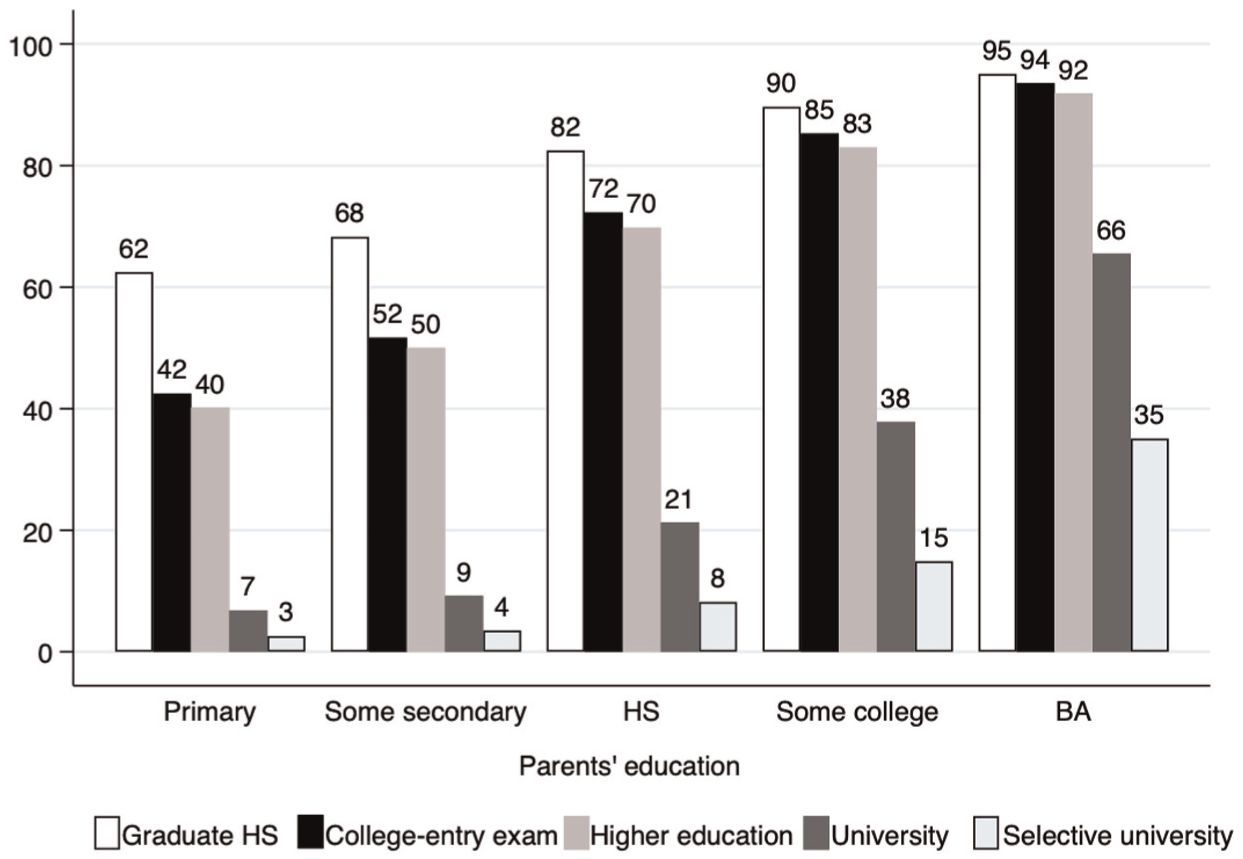
Substantial variation by gender also was observed (Figure 2). Women surpassed men in terms of high school graduation (82% women, 74% men), taking the university entry exam (71% women, 62% men), and entering higher education (69% women, 59% men). This female advantage started more than three decades ago in Latin America (Grant & Behrman, 2010) and aligned with global trends (Buchmann et al., 2025; DiPrete & Buchmann, 2013). The female advantage shrank, however, in the access to university and fully disappeared for selective university entry. Academic performance also was highly stratified by parents’ resources. Both high school GPA (Table 2A) and university entry exam scores (Table 2B) increased as parents’ educational attainment increased.
Percent of students making each educational transition by gender.
Relationship between family socioeconomic status (i.e., parents’ education) and students’ academic performance
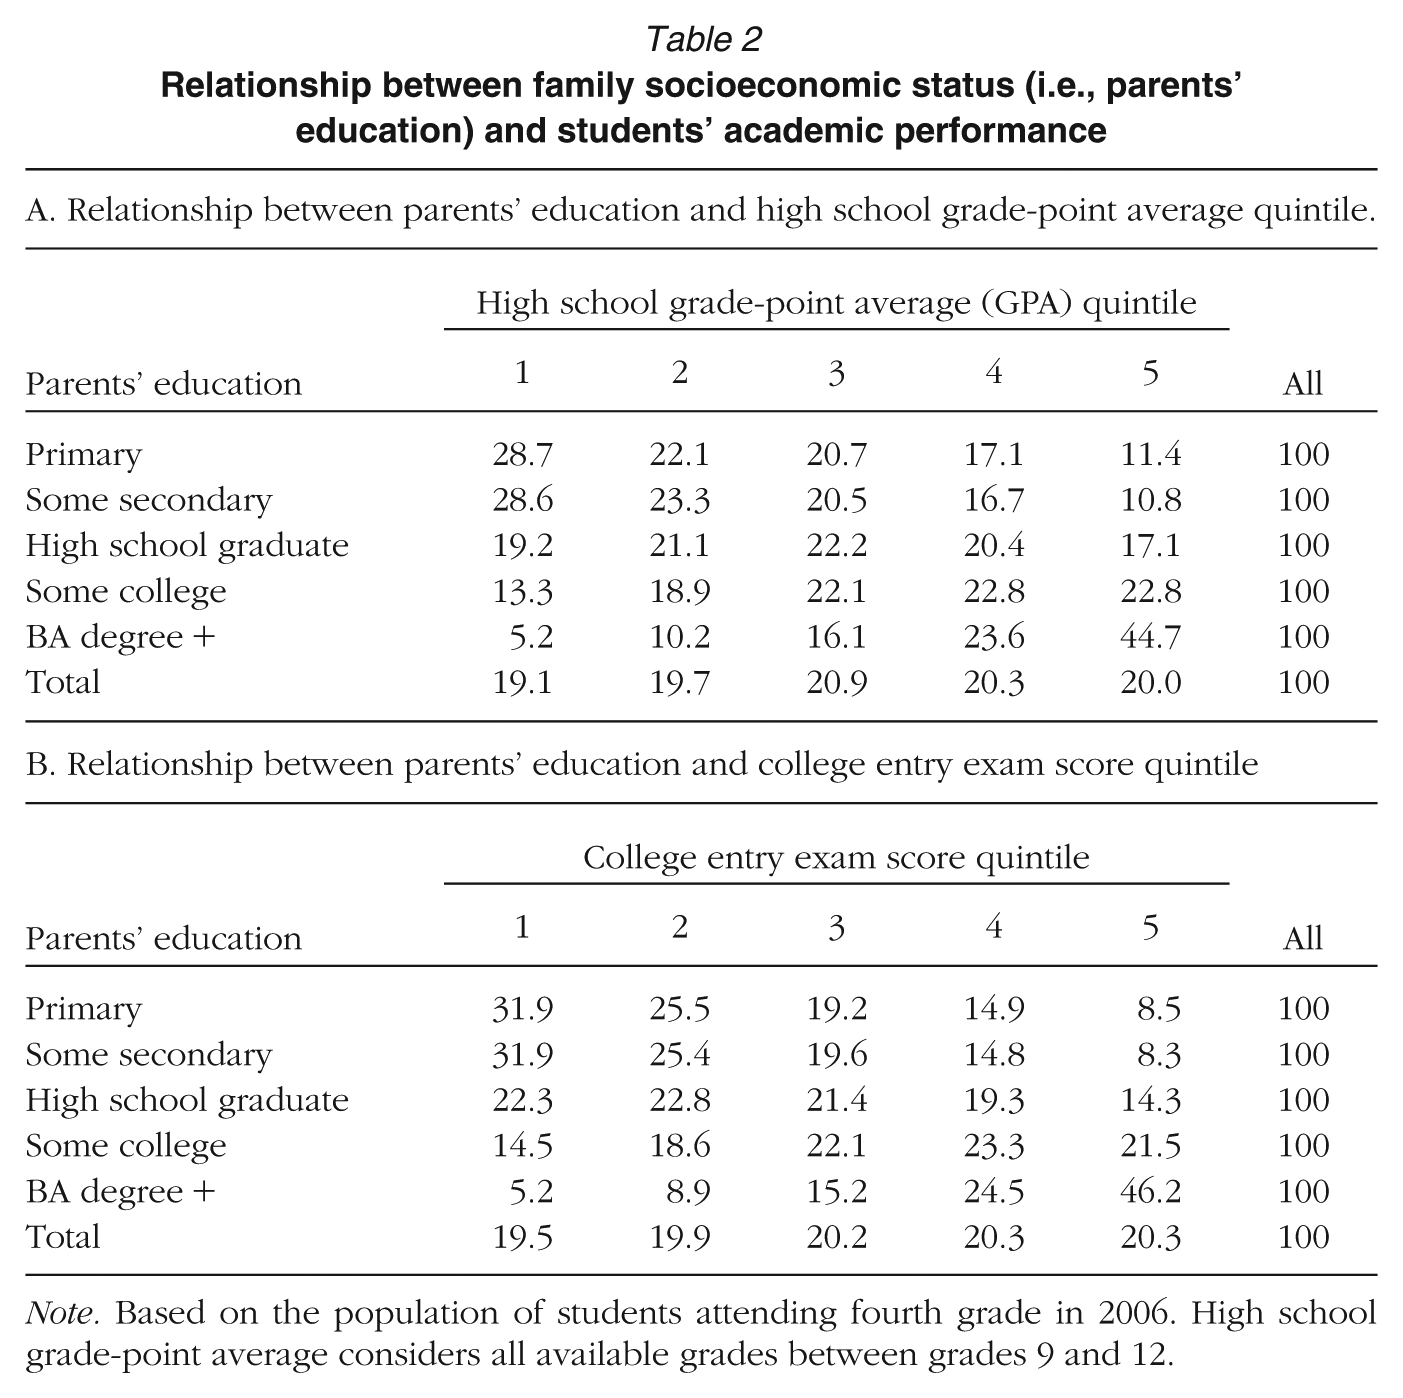
Note. Based on the population of students attending fourth grade in 2006. High school grade-point average considers all available grades between grades 9 and 12.
Socioeconomic Advantage and Academic Performance as Determinants of Educational Attainment
We understand SES differences in educational attainment as stemming from two factors: SES gaps in academic performance and SES-based decisions to enroll that are net of performance. Figure 3 shows the SES gaps in the probability of making each educational transition by parents’ education and high school GPA quintile/university entry exam score quintile (parameter estimates, standard errors, and significance tests can be found in Appendix Table A1 in the online version of the journal). Lines represent probabilities for each level of parents’ education across academic performance quintiles. The vertical comparison between the lines captures differences attributable to family SES net of any differences in academic performance.
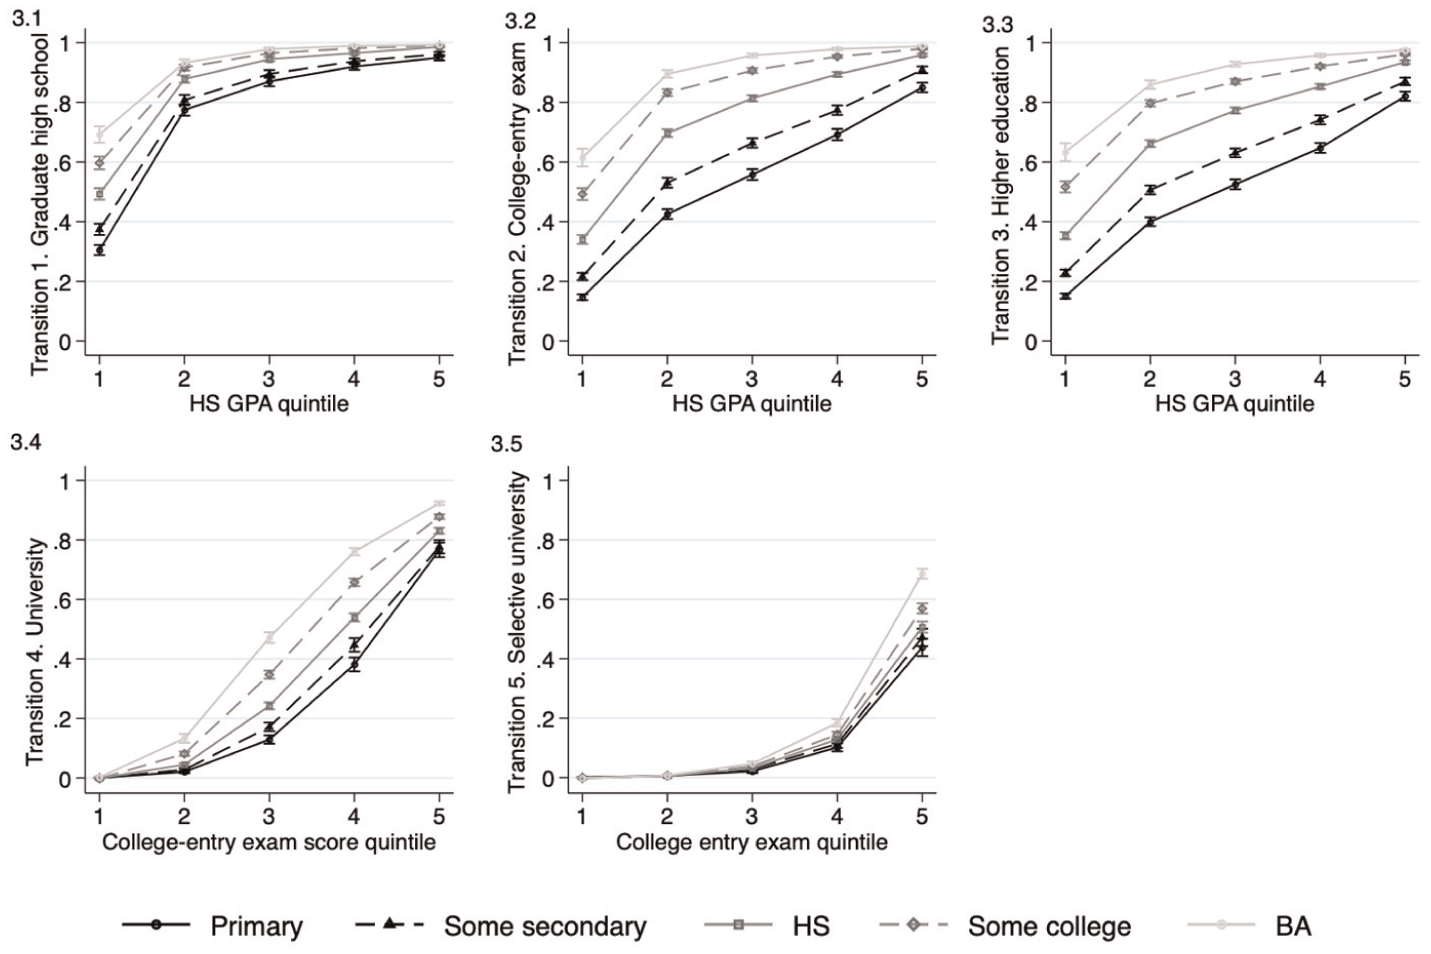
Educational transitions by family socioeconomic status (parents’ education) and academic performance (high school grade-point average quintile/university entry exam score quintile).
For high school graduation, SES did not seem to matter among high-performing students: Virtually all top performers attained a high school diploma regardless of parents’ education (Figure 3A). In contrast, parents’ education was crucial among students in the bottom performance quintile. Low-performing children had only a 30% chance of graduating from high school if their parents had primary schooling but a 70% chance when parents had a college degree.
Figure 3B and C examines the probability of taking the university entry exam and enrolling in postsecondary education, respectively. Socioeconomic gaps were wider than for high school graduation, as expected, given that these transitions were far from universal. The pattern of socioeconomic stratification, however, was similar. Among top performers, SES differences were small. Top performers with college-educated parents had a near-universal 99% chance to take the college entry exam and enter higher education; comparable top performers with primary school–educated parents had still high 85 and 82% chances, respectively. Socioeconomic gaps widened at the lower end of the performance distribution. Lowest-performing children of college-educated parents had a 61% chance of taking the university entry exam and a 63% chance of attending higher education. Comparable low-performing students whose parents had primary education had only a 15% chance of making either transition.
In sum, socioeconomic advantage mattered little for graduating high school, taking the college entry exam, or entering higher education among high-performing students. For students with low academic performance, parents’ resources were critical: low-SES low performers dropped out, whereas high-SES low performers persisted into higher education.
The influence of parents’ resources was different for entering a university (Figure 3D) and a selective university (Figure 3E). In these transitions, the lowest-performing students had a virtually null probability of entering a university and a selective university regardless of socioeconomic advantage, as expected given Chile's meritocratic college admissions system. However, the impact of SES grew among students with high academic performance, especially in the access to selective universities. Top performers whose parents had a college degree had a 93% chance of enrolling in a university; those with primary-educated parents had only a 77% chance. Similarly, top performers with college-educated parents had a 69% chance of enrolling in a selective university, whereas those with primary-educated parents had only a 44% chance. This suggests a large amount of undermatching among low-SES students in access to university.
Prevalence of Undermatching
Figure 4 evaluates the extent of undermatching for each educational transition. About 13% of students whose school GPA would support high school graduation did not graduate. Given that these are population data, this amounts, without sampling error, to ~25,000 students a year. Moving to the transition to higher education, 12% of high school graduates had a high school GPA sufficiently high to take the college entry exam but did not do so, and 14% could have enrolled in postsecondary education based on their GPA but did not do so. Undermatching was even larger for more selective transitions. Almost one quarter of students who took the university entry exam had a sufficiently high score to attend a university but did not do so, and more than one third of students had high enough scores to attend a selective university but did not enroll.
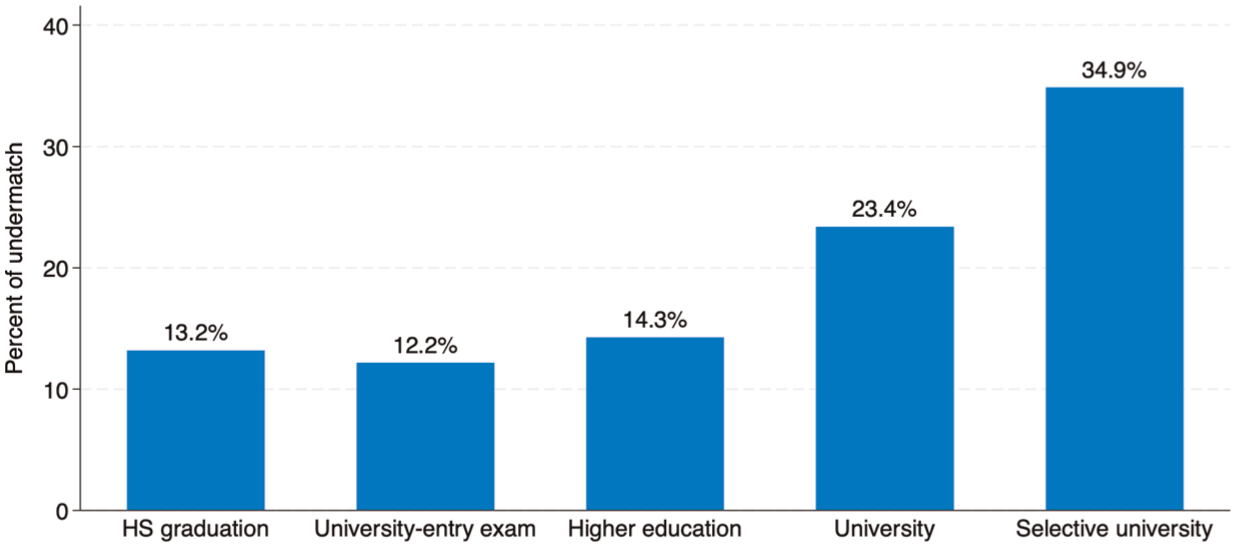
Probability of undermatching across educational transitions.
Stratification of Undermatching
Figure 5 shows predicted probabilities from models capturing the association between undermatching and parents’ educational attainment without any other predictors (parameter estimates, standard errors, and significance tests are given in Appendix Table A2 in the online version of the journal). 5 It shows a substantial gradient in the probability of undermatch based on parents’ education for all educational transitions. In all cases, as parents’ education increased, the probability of undermatching sharply declined.
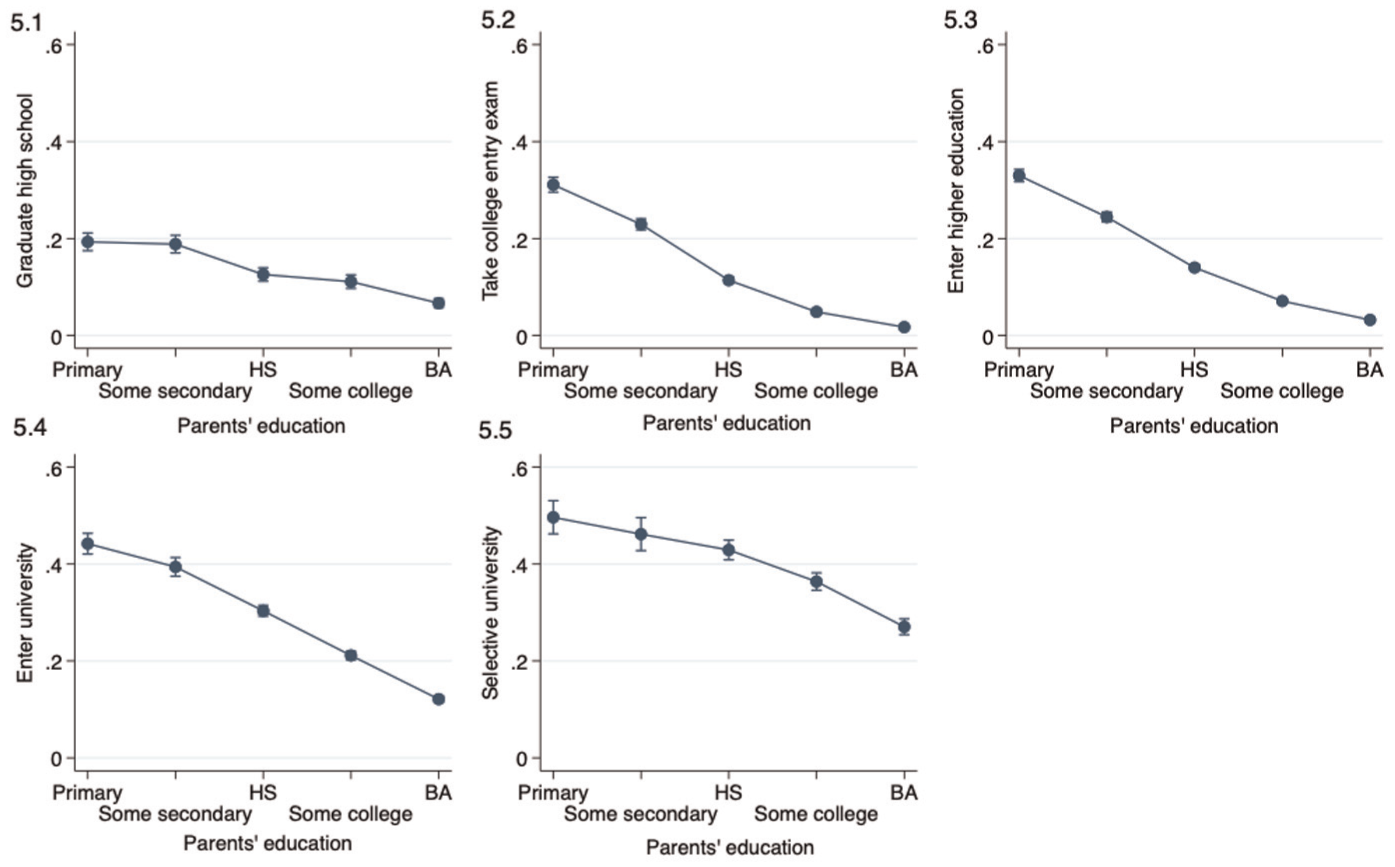
Predicted probability of undermatching by family socioeconomic status (measured by parents’ education) across educational transitions.
For high school graduation (Figure 5A), youth whose parents had primary education had a 20% chance of dropping out from high school even if they had a sufficiently high GPA. The probability of undermatching was only ~6% among youth with at least one college-graduate parent. The socioeconomic gaps were wider for undermatching in taking the university entry exam and attending higher education (Figure 5B and C). Although only 2% of high school graduates with college-educated parents failed to take the college entry exam or enter higher education when they had a sufficiently high GPA, as many as one third of those with primary-educated parents were undermatched in these transitions.
Wide socioeconomic gaps also emerged in the transition to university. The probability of undermatching was 12% among those who had a college-educated parent but 44% among children of primary-educated parents. Undermatching in access to a selective university reached 27% for children of college-educated parents but as much as 50% for youth whose parents had only primary education (Figure 5E). Strikingly, about half the lowest-SES Chilean youth with a sufficiently high university entry exam score did not enroll in a selective university even if they would likely be accepted. Although meritocratic university admissions criteria might weaken the influence of family support by removing the impact of résumé building and cultural capital, there are still large barriers preventing “bright but poor” youth from accessing universities, especially selective ones.
As mentioned earlier, both students’ high school GPA and college entry exam scores were endogenous to the decision to pursue additional education. Students intending to attend university might invest time, financial resources, and effort to improve their GPA and to prepare for the college entry exam, whereas those not intending to attend might not prepare at all. As a result, matching might reflect investments motivated by anticipatory choice. To address this concern, we replicated Figure 5 using students’ fourth grade standardized test scores instead of high school GPA and university entry exam scores (see Appendix Figure A3 in the online version of the journal). The fourth grade standardized test is universal and has no consequences for students’ further attainment, placement, or grades. Appendix Figure A3 in the online version of the journal shows levels of undermatching that are higher (expected because performance was measured earlier in the life course), but patterns of SES stratification were virtually identical with Figure 5. This suggests that our findings about SES disparities in undermatching are not biased by students’ anticipatory choice.
Gender Differences in Undermatching
Literature based on the United States and other countries has documented a “boy crisis,” in which young males are falling behind in educational achievement and attainment (Farrell & Gray, 2019; Fortin et al., 2015; Reeves, 2022) and boys from low-income families are particularly disadvantaged (Autor et al., 2019; DiPrete & Buchmann, 2013). This literature has suggested that undermatching might be more prevalent among low-income boys, at least in educational transitions where there is a large gender gap favoring girls.
Figure 6 examines gender differences in undermatching by family SES (parameter estimates, standard errors, and significance tests are provided in Appendix Table A3 in the online version of the journal). Boys were more likely to experience undermatching than girls across the early educational transitions—graduating from high school, taking the college entry exam, and entering higher education. The gender gap was wider for boys from low-SES families. For example, the probability of undermatching in high school graduation among the most disadvantaged families was 17% for girls but 28% for boys. Similarly, the probability of undermatch in entering higher education was 28% for low-SES girls but 36% for low-SES boys. The excess undermatching of boys decreased as family SES increased and fully disappeared among families in which the parents had some postsecondary education or more. Gender gaps in undermatching reversed for the two more selective transitions: enrolling in a university and in a selective university. In those transitions, girls were more likely to be undermatched than boys, consistently across family SES. This finding was fully consistent with prior results showing that boys were more likely to apply to selective universities than similarly qualified girls (Bordón et al., 2020), plausibly due to the influence of traditional gender expectations (Van Houtte, 2024). Naturally, the excess undermatch in early educational transitions among low-SES boys does not imply that undermatch is not a concern among disadvantaged girls. It means, however, the need to consider specific barriers to educational attainment among high-performing, low-SES boys.
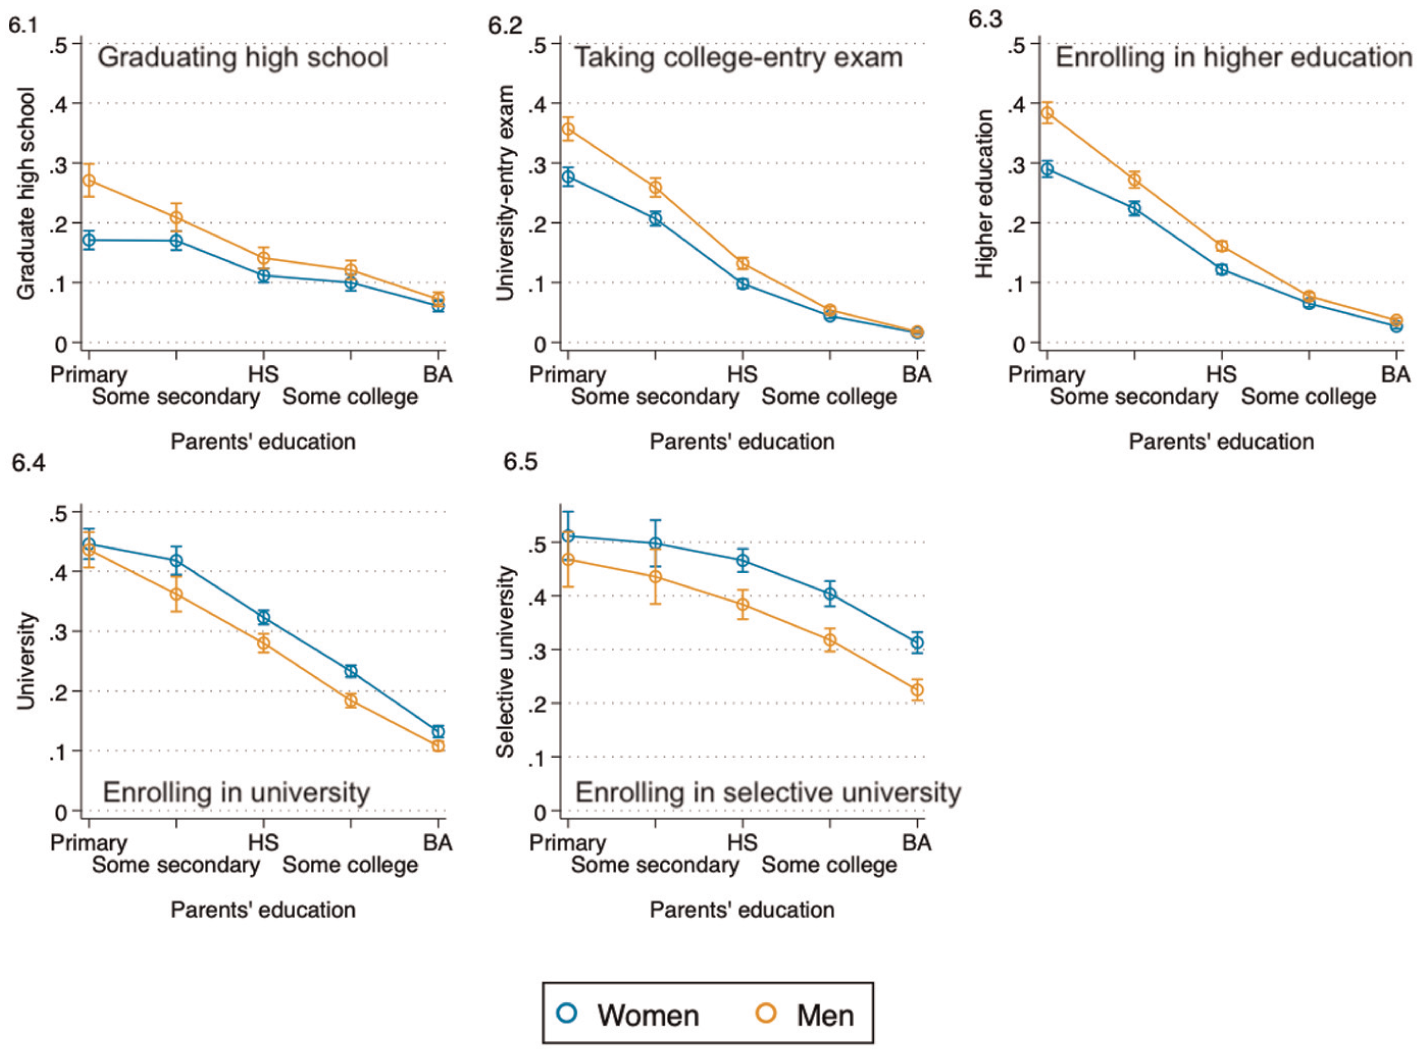
Probability of undermatching across educational transitions by student's gender.
Mechanisms for the Stratification of Undermatching
Although a full analysis of mechanisms is beyond the scope of this paper, we provide preliminary evidence. Based on prior literature, we examined mechanisms related to family resources and characteristics of schools attended. We relied on a Gelbach decomposition, adding plausible mediators to the model capturing the association between parents’ education and undermatching presented in Figure 5.
Table 3 shows the results of the decomposition of the coefficients of parents’ education for each educational transition (for a graphic version of the table, see Appendix Figure A4 in the online version of the journal). The “Total” column is the coefficient capturing the total association between parents’ education categories and the probability of undermatching in each of the five educational transitions with the lowest level of parental education (primary schooling) as the reference category. 6 Expectedly, all coefficients had negative signs, indicating that the probability of undermatching decreased as parents’ education increased. For example, students whose parents were high school graduates were 6.8 percentage points less likely to undermatch in high school graduation (T1) compared with students with primary-educated parents. The next column (“All covariates”) indicates the portion of the total association between parents’ education and undermatching probabilities accounted for by the covariates added to the model. For example, the covariates account for 4.9 percentage points of the 6.8 percentage point difference in undermatching between students with primary-educated and high school-graduate parents (72% of the difference).
Gelbach decomposition of coefficients capturing the association between parents’ education and the probability of undermatching across educational transitions
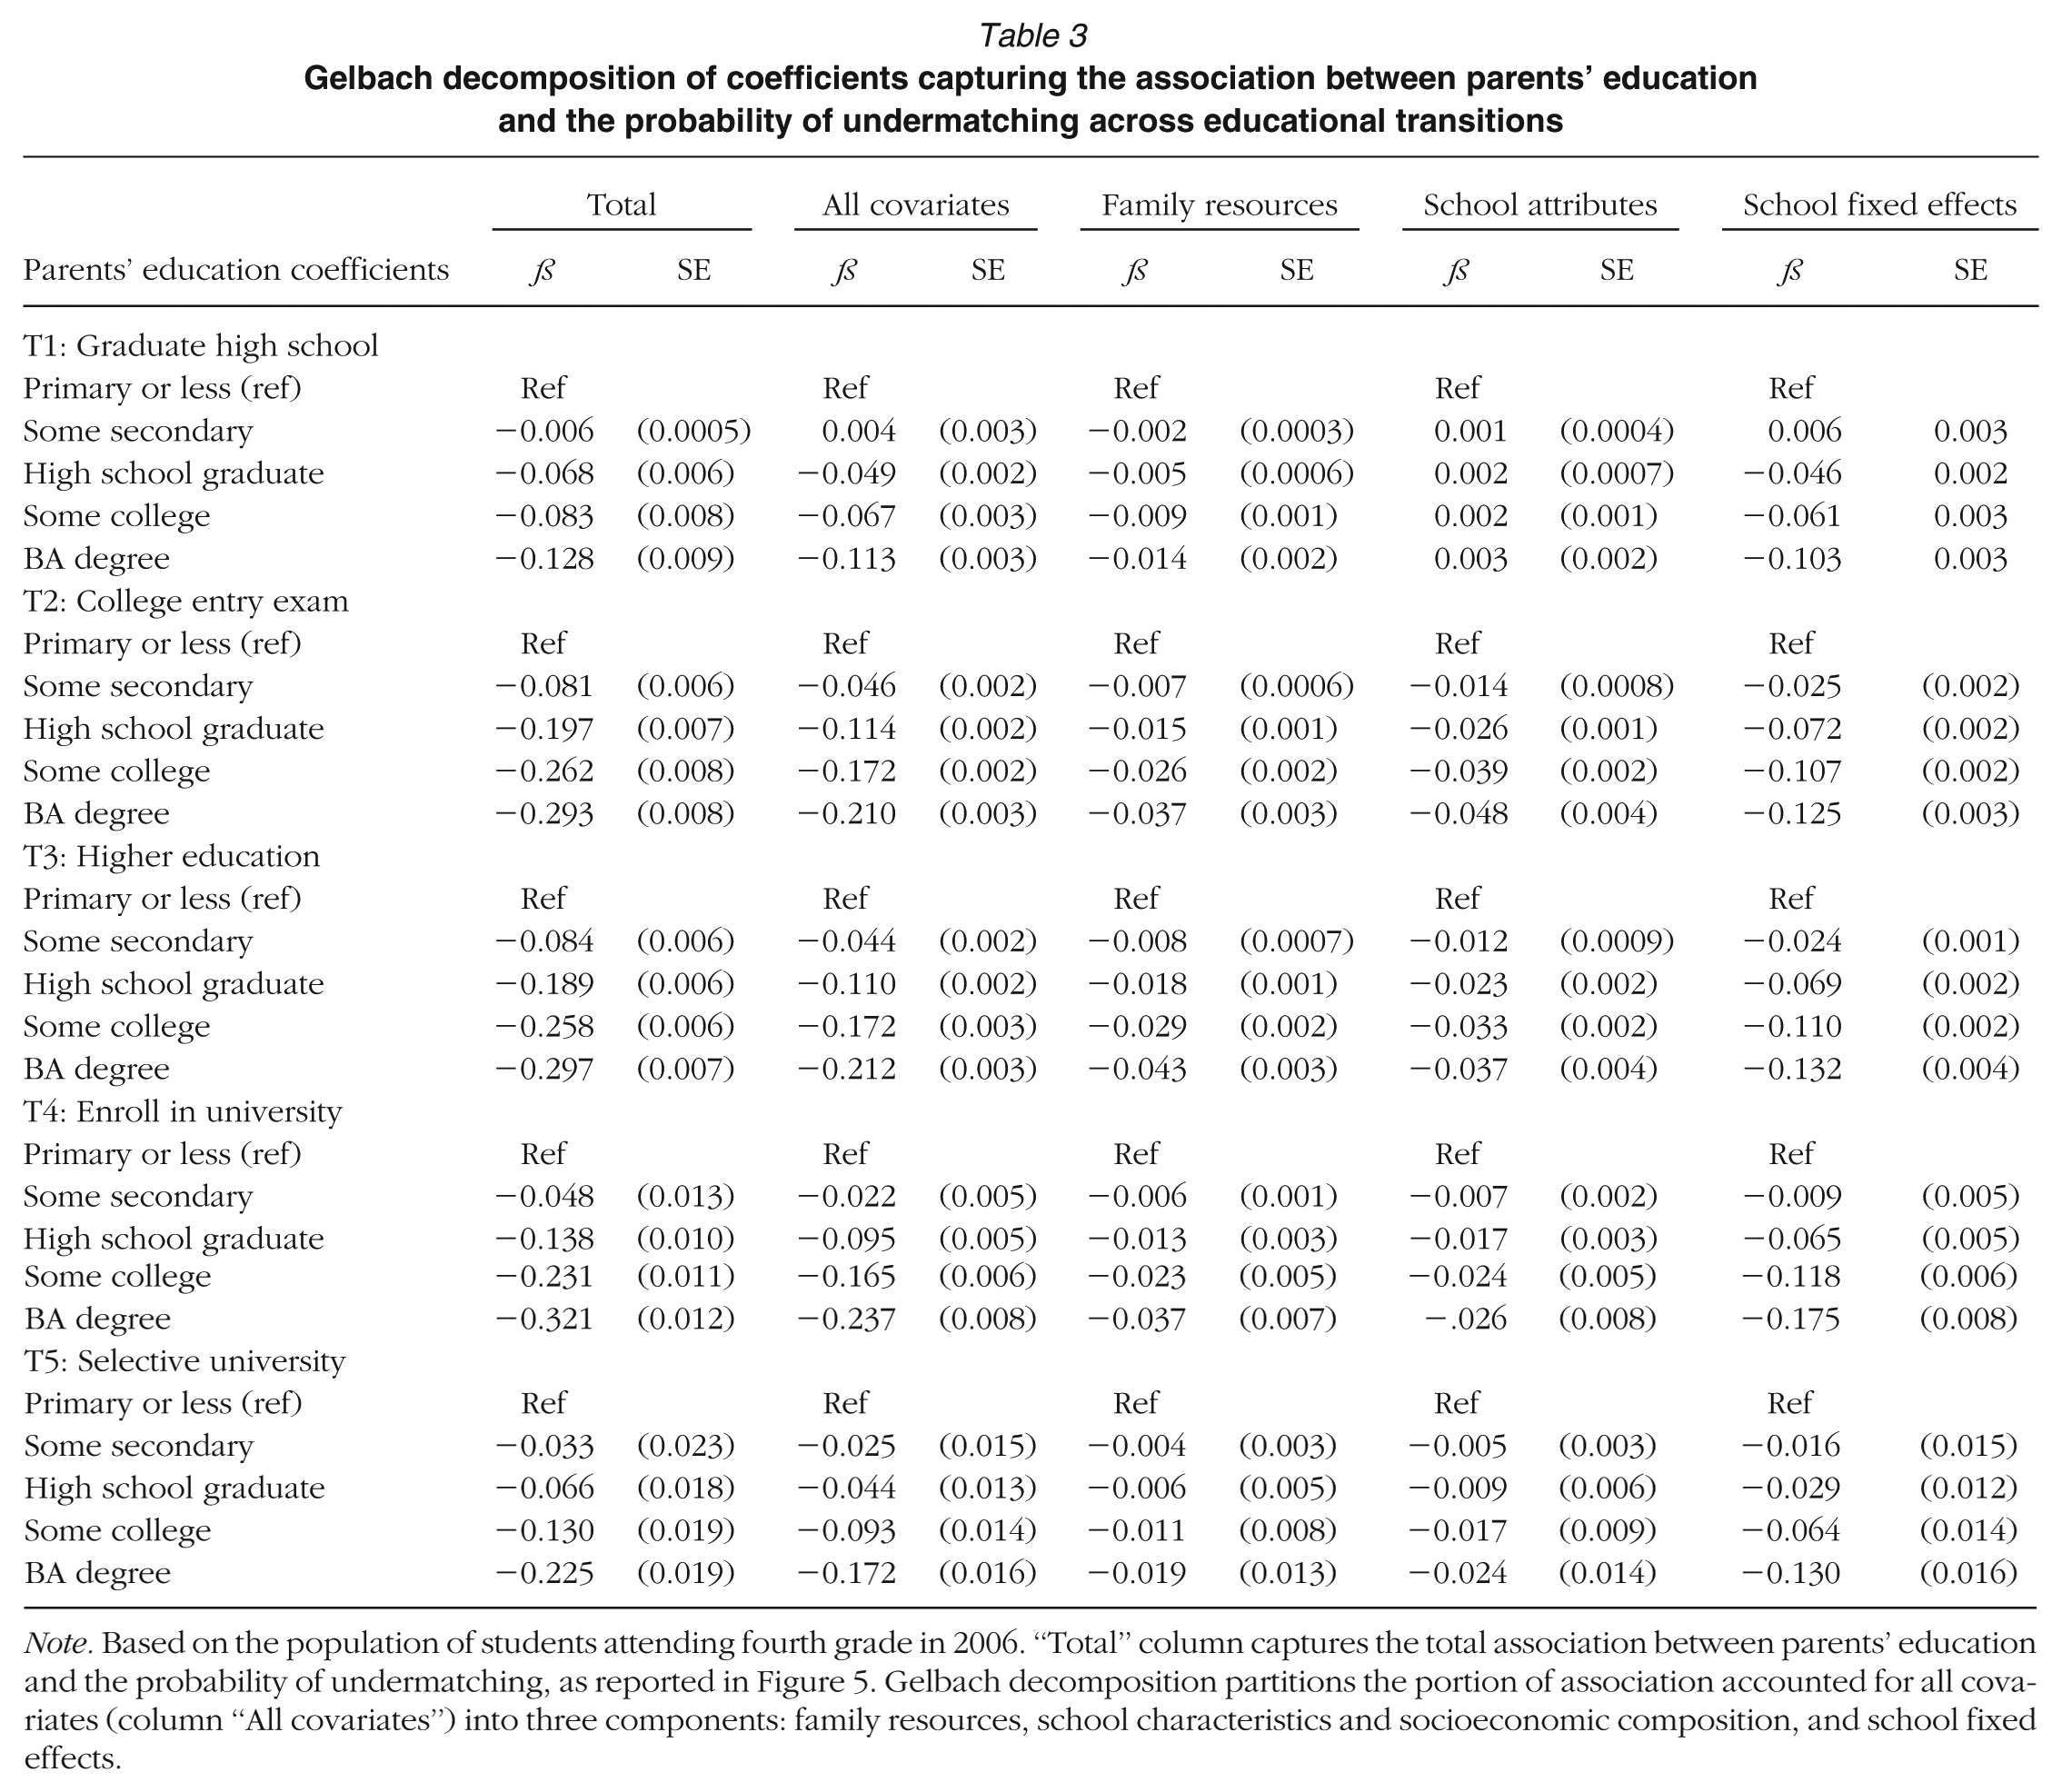
Note. Based on the population of students attending fourth grade in 2006. “Total” column captures the total association between parents’ education and the probability of undermatching, as reported in Figure 5. Gelbach decomposition partitions the portion of association accounted for all covariates (column “All covariates”) into three components: family resources, school characteristics and socioeconomic composition, and school fixed effects.
The most relevant result in Table 3 is the decomposition of covariates accounting for the stratification of undermatching. We partitioned covariates into three groups: family resources, observed school characteristics and SES composition, and school fixed effects. A consistent pattern emerged: school fixed effects accounted for the vast majority of SES differences in undermatching. Returning to our example, 4.6 of the 4.9 percentage points accounted for the covariates were accounted for by school fixed effects (94%), whereas family resources and school observed characteristics accounted for only 0.5 and 0.2 percentage points, respectively. School fixed effects, which captured observed and unobserved attributes of schools, were the most important factors mediating the socioeconomic stratification of undermatching across all transitions, including the most selective ones. For example, the total undermatching gap in the transition to a university (T4) between having parents with a BA degree and parents with primary school was 32.1 percentage points. Of this gap, 23.7 percentage points (85%) were accounted by covariates, and school fixed effects alone accounted for 17.5 percentage points, whereas family resources and school characteristics accounted, respectively, for 3.7 and 2.6 percentage points only.
The large explanatory power of school fixed-effects models indicates that observed and unobserved characteristics of schools—plausibly including social networks, information about higher education, availability of role models, teachers’ expectations, and support in navigating the higher education application process, among others—shaped the SES stratification of undermatching. The findings strongly suggest that schools are critical venues accounting for socioeconomic inequalities in undermatching. This does not mean that family resources do not matter. It means, however, that differences in family resources result in strong sorting across schools. As we elaborate in the discussion section, institutional features of the Chilean K–12 universal voucher system likely accounted for the substantial role of schools in the stratification of undermatching.
Discussion and Policy Implications
This study has examined the prevalence, stratification, gender differences, and potential mechanisms for educational undermatching in Chile. While the literature in the United States is limited to youth who do not enroll in highly selective universities when they have a sufficiently high college?-entry exam score to do so, we expanded undermatching to five educational transitions—graduating from high school, taking the university entry exam, enrolling in higher education, entering university, and entering a selective university. The rationale for extending the concept of undermatching was that a large proportion of disadvantaged youth around the world do not make these transitions even if they have sufficiently high academic performance to do so (Maragkou, 2020). These “bright but poor” youth provide low-hanging fruit for interventions intended to support educational opportunity and promote intergenerational mobility.
Using an original population-level panel dataset, we obtained four main findings. First, undermatching is prevalent in Chile. About 13% of youth undermatch in the transition to high school graduation, 23% undermatch in the transition to university, and 35% undermatch in access to a selective university. Second, the probability of undermatching is strongly stratified by socioeconomic resources. For example, only 6% of youth with college-educated parents but 20% of youth with primary-educated parents undermatch in the high school graduation transition. The socioeconomic gap is even wider for the transition to higher education, with 2% of advantaged youth versus 33% of disadvantaged youth undermatching. Similarly, undermatching in the transition to university reaches 12% among advantaged students but 44% among their disadvantaged peers.
Third, low-SES boys are more likely to undermatch than low-SES girls in earlier educational transitions—graduating from high school, taking the college entry exam, and entering any postsecondary education. This finding highlights the obstacles faced by young males growing up in poor families and aligns with recent findings in other contexts (Autor et al., 2019; DiPrete & Buchmann, 2013; Farrell & Gray, 2019; Fortin et al., 2015; Reeves, 2022). Fourth, socioeconomic gaps in undermatching greatly decline after school fixed effects are accounted for, suggesting that socioeconomic sorting across schools shape the risk of dropping out from education among low-SES youth even when they have high academic performance.
Socioeconomic disparities in undermatching are a relevant policy concern because they prevent intergenerational mobility, increase segregation, and reduce returns of higher education for individuals and society at large (Campbell et al., 2022; Chetty et al., 2020). Our study suggests that in Chile, inequality in undermatching is largely due to students sorting across different school contexts based on socioeconomic resources. Differences across schools include funding, teacher experience, student–teacher ratio, leadership, academic standards, and infrastructure. They also include peer effects resulting from the school socioeconomic and academic makeup. As discussed earlier, until 2015, Chile operated a universal school voucher system that encouraged schools to recruit advantaged students and families to cluster in advantaged peer groups (Mizala & Torche, 2012). This system promoted socioeconomic and academic sorting across schools (Giaconi et al., 2022; Gutiérrez & Carrasco, 2021; Valenzuela et al., 2014). Our findings suggest that SES sorting across schools may contribute to the marked stratification of undermatching, plausibly by creating segregated learning communities and peer groups that provide different levels of information, aspirations, and expectations about higher education.
We should highlight, however, that these patterns are not unique to Chile. The small literature on mechanisms for undermatching shows that, at least in England, schools also account for much of the SES gap in undermatching the access to upper secondary education (Maragkou, 2020) and selective university degrees (Campbell et al., 2022). Our finding that school fixed effects account for a large share of undermatching SES gaps aligns with these findings.
These findings suggests that despite variation in specific organizational features, schools play a pivotal role in sorting students into different pathways based on the socioeconomic resources of their families. The school-level mechanisms driving undermatching are exceedingly difficult to observe directly using quantitative data, but they are captured by school fixed effects in our models. The relevance of schools as venues for stratification, long emphasized in social science research, calls for further investigation into the mechanisms driving undermatching, with particular attention to school contexts in different national settings.
It is important to note that several policies have been implemented in Chile since the reestablishment of democratic rule in 1990 to reduce inequalities and segregation across schools. For example, the government has established a means-tested school voucher that increased the voucher payment for low-income students and schools serving them in 2008 (Mizala & Torche, 2017) and a program to support access to higher education among students attending disadvantaged high schools who graduate in the top 15% of their class in 2014 (Carlana et al., 2024). More recently, two major reforms intended to equalize educational opportunity have been implemented. In 2015, a new social inclusion law prohibited schools that received voucher payments from selecting students (Cummings et al., 2023). In 2016, Chile implemented a groundbreaking college tuition-free policy that benefited students from families in the lowest 50% of the income distribution. This benefit applied to all public universities and to private, nonprofit universities that met high academic accreditation standards. In 2017, the policy was expanded to include less selective universities, professional institutes, and technical training centers. In 2018, eligibility was extended to students from families in the bottom 60% of the income distribution. These reforms are too recent to affect the cohort under analysis, which mostly graduated from high school in 2015. They call, however, for longitudinal research examining their potential impact on undermatching, particularly among low-SES students.
Finally, it is important to mention that supporting low-SES students who are top academic performers is only one component, perhaps a small one, of the goal of equalizing educational opportunity. As important is the need to provide disadvantaged families with a safety net and resources to support children's human capital through early-life investments in nutrition, health, safety, and learning at home and school (Cameron & Heckman, 2001; Carneiro & Heckman, 2002; Keane & Wolpin, 1997). Additionally, some high-performing disadvantaged youth may not want to pursue education beyond high school. We are not advocating for college as the only, or best, pathway for all young people. We are, however, suggesting that this option should be available to students and that the decision to pursue further education should be a well-informed one based on interests and aspirations rather than socioeconomic constraints. This is particularly important in high-inequality contexts such as Chile, where the overall economic payoff of postsecondary education is high (OECD, 2024; Psacharopoulos & Patrinos, 2018) and the payoff of selective institutions is particularly elevated (Hastings et al., 2013; Rodriguez et al., 2016). In these contexts, supporting access to higher education is a critical pathway to reducing inequality and enhancing social mobility. Identifying the extent of undermatching, its socioeconomic stratification, and its underlying mechanisms is a relevant step in pursuit of this objective.
Conclusion
This study documented the extent and stratification of undermatching in Chile across multiple educational transitions. We showed that undermatching is both prevalent and highly stratified by socioeconomic status, that low-SES boys are particularly disadvantaged, and that much of the SES gap can be traced to differences between schools. These findings underscore the role of schools in reproducing inequalities, likely through diverse mechanisms including family sorting into different schools, material resources, and social processes that shape students’ access to information and expectations. Future research should continue to examine how specific school-level factors contribute to undermatching and evaluate whether recent reforms aimed at reducing school segregation and expanding higher education access succeed in narrowing these disparities. More broadly, addressing undermatching is part of a larger project of reducing educational inequality and promoting mobility in high-inequality contexts.
Supplemental Material
sj-pdf-1-aer-10.3102_00028312251409059 – Supplemental material for Bright but Poor: Undermatching in the Access to Postsecondary Education
Supplemental material, sj-pdf-1-aer-10.3102_00028312251409059 for Bright but Poor: Undermatching in the Access to Postsecondary Education by Alejandra Mizala, Luis Herskovic, Alejandra Abufhele and Florencia Torche in American Educational Research Journal
Footnotes
Acknowledgements
The authors thank the Department of Evaluation, Measurement and Educational Registration (DEMRE) and the Ministry of Education for granting them access to the individual college entry exam scores, application, and enrollment data. Additionally, we thank the Agency for Quality of Education for providing individual information regarding family background and tests scores of the standardized SIMCE tests. The authors also thank Michelle Jackson for her excellent comments and suggestions.
Funding
Support from ANID/Basal Funds for Centers of Excellence (FB0003, ANID-MILENIO-NCS2022-051) and CIAE Applied Research Center Project CIA250005 is gratefully acknowledged.
Notes
A
L
A
F
References
Supplementary Material
Please find the following supplemental material available below.
For Open Access articles published under a Creative Commons License, all supplemental material carries the same license as the article it is associated with.
For non-Open Access articles published, all supplemental material carries a non-exclusive license, and permission requests for re-use of supplemental material or any part of supplemental material shall be sent directly to the copyright owner as specified in the copyright notice associated with the article.