
Abstract
Increasingly, states and districts are combining student growth measures with rigorous, rubric-aligned teacher observations in constructing teacher evaluation measures. Although the student growth or value-added components of these measures have received much research and policy attention, the results of this study suggest that the data generated by high-quality observation systems have potential to inform principals’ use of data for human capital decisions. Interview and survey data from six school districts that have recently implemented new evaluation systems with classroom observations provide evidence that principals tend to rely less on test scores in their human capital decisions. The consistency, transparency, and specificity of observation data may provide benefits for principals seeking to use these data to inform their decision making.
Spawned by federal Race to the Top grants and the School Improvement Grants (SIGs) program authorized under Title I of the Elementary and Secondary Education Act, state legislatures and districts are mandating new policies on teacher evaluation. These policies require rigorous teacher classroom observations as part of teacher performance evaluations, alongside other measures such as student growth and achievement. These observations typically are performed by principals and other instructional leaders who have undergone training, certification, and often repeated calibration while implementing a common, detailed rubric over a prescribed number of observations. Although much focus has been placed on student test score-based teacher effectiveness measures and their potential uses (Hanushek & Rivkin, 2010; Harris, 2011), data from structured teacher observations—both quantitative and qualitative—constitute a new source of information principals and school systems can utilize in decision making as well.
Based on data from hundreds of principal surveys and semistructured interviews of central office personnel and principals in six urban school districts in five different states during the 2012–2014 school years, we learned that as these rigorous, observation-focused evaluation systems develop, value-added measures (VAM) may play a less exclusive role in principals’ human capital decision making (e.g., teacher hiring, contract renewal, assignment to classrooms, professional development), despite policy mandates that suggest otherwise. Our data suggest that teacher observations, associated evidence, and rubric scoring are becoming the main driver of principals’ data use regarding teaching effectiveness and human capital decisions in districts that have invested in these systems. Leaders in our interviews identify numerous shortcomings in the usefulness of student test score-based models, including timing (i.e., results are not available in real time when decisions are made), perceptions of validity (i.e., scores do not exist for untested subjects, students are taught by multiple teachers), specificity (i.e., the scores do not provide a window into what teachers actually do that directly impacts students’ learning, the measures are not fine-grained and actionable), and transparency and complexity (i.e., lack of understanding for both school leaders and teachers about complicated statistical models negates comfort with the results and their interpretation, it is unclear how the measures were created).
In contrast, teacher observation data address many of the above concerns and are beginning to emerge in the districts we studied as powerful engines for principal data use. More specifically, three core themes surfaced about the use of teacher observation data in this study: (1) the consistency of the data, (2) the transparency of the data, and (3) the specificity of evidence of teacher observation data. Although acknowledging clear differences between the two types of data—value-added and observation measures (e.g., value-added measures are summative and once-a-year by definition)—our research suggests that student test scores may become less central to principals’ human capital decision making as rigorous teacher observation systems take root and become more widespread.
Background
Although research has explored principals’ reactions to and use of value-added data and the extent to which principals believe that value added and observations are congruent (Childers, 2012; Kimball & Milanowski, 2009), much of the research literature has focused on the quality of value-added measures, appropriate models for calculating value-added measures, and the implications for use of different models (see Carnegie Knowledge Network, n.d.; Harris, 2009; McCaffrey, Koretz, Lockwood, & Hamilton, 2004); others have attended to the policy implications of determining specific uses of value-added scores (Winters & Cowen, 2013). Jacob (2011) analyzed Chicago Public Schools data and found that principals might in fact take into account teacher effectiveness in dismissal decisions as “elementary teachers who were dismissed had significantly lower value added with regard to student achievement in prior years compared with their peers who were not dismissed” (p. 429). Others have written about principals and human capital management, noting the constraints they find in hiring effective teachers and the barriers to their ability to dismiss ineffective teachers (Donaldson, 2013); some authors question whether teacher evaluation and a performance management frame is even a worthwhile or fruitful avenue to pursue to improve student learning (Murphy, Hallinger, & Heck, 2013). Research also indicates that it is difficult to systematically explain why there are differences between principals’ observational ratings of teachers and value-added measures (Harris, Ingle, & Rutledge, 2014; Kimball & Milanowski, 2009). And Hallinger, Heck, and Murphy (2014), in their review of the literature on principals’ roles and teacher evaluation, conclude that principals “. . . find it difficult at best and counter-productive at worst to intensify their efforts at teacher evaluation” (p. 22). Despite these findings, principals and other school-level leaders are asked to use the measures of teacher effectiveness that are provided to them. Increasingly, both value-added or other test-based growth measures and scores from observations of teaching are in the set of data available to principals.
According to the National Council on Teacher Quality (NCTQ): almost every state—44 and Washington, D.C. (DCPS)—now requires that classroom observations be incorporated into teacher evaluations. In 24 of those states and DCPS, multiple annual observations are required as part of each evaluation for at least new, if not all, teachers. Twenty-one states and DCPS provide specific guidelines for when classroom observations should take place during the year, and 14 states and DCPS require that at least some classroom observations are unannounced. Twenty-one states and DCPS are explicit that teachers receive feedback on classroom observations. (Doherty & Jacobs, 2013, p 14)
Master (2014) found that teacher observation ratings predict principal personnel dismissal and promotion decisions in an urban charter network.
These teacher observation requirements, in addition to creating new and additional data points for teacher evaluation, provide principals with a completely new set of data regarding their teachers, prompting us to explore principals’ perceptions of these new teacher effectiveness data. Furthermore, the uniformity of the observation process, the training required, and the consequences for both principals and teachers are much more stringent now compared to earlier studies (see Kimball & Milanowski, 2009). Given the prevalence of new teacher evaluation policies that increasingly include scores from teacher observations, the purpose of this paper is to explore principals’ use of, and attitudes toward, teacher effectiveness data for human capital decisions, specifically value-added and observation measures. We ask: How and why do principals use teacher effectiveness measures for human capital decisions in practice? What are barriers to using these measures for human capital decisions?
Data and Methods
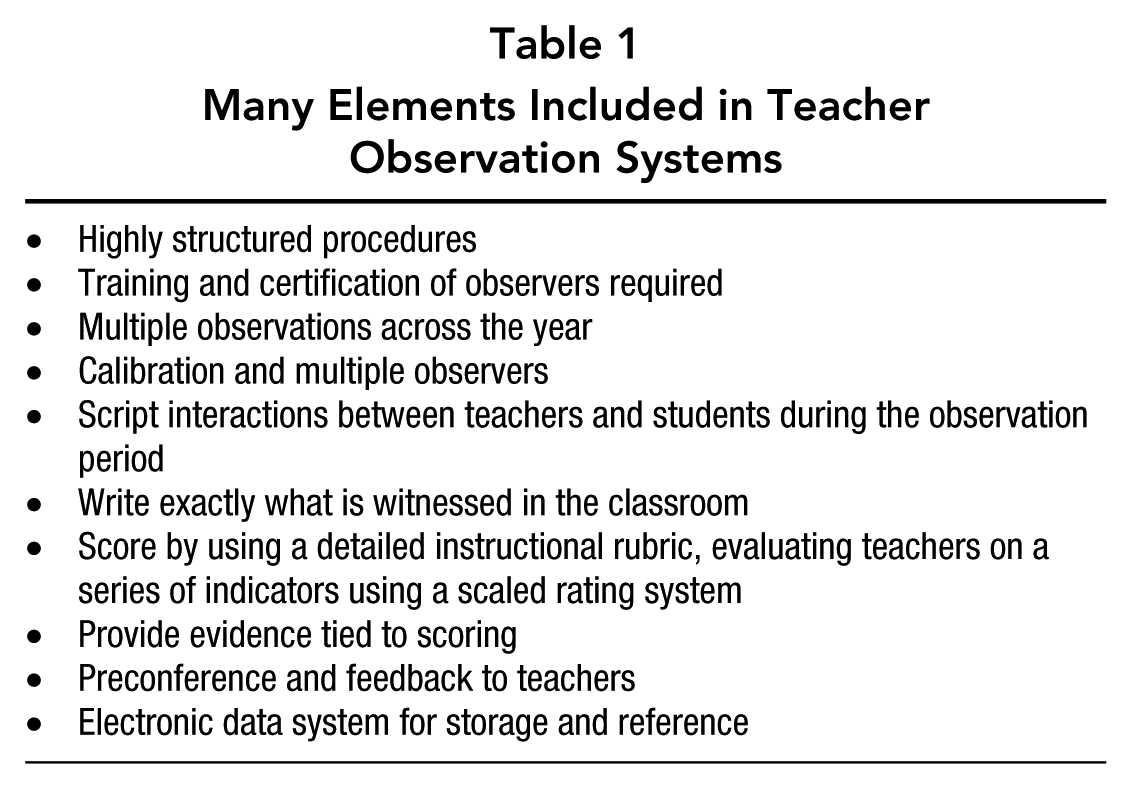
As part of a larger project examining principal data use for human capital decision making, we surveyed principals and conducted semistructured interviews of central office personnel and principals in six urban school districts during the 2012-2014 school years (Baltimore City Schools, Denver Public Schools, Hillsborough County (Florida) Public Schools, Houston Independent School District, Memphis City Schools, and Metro Nashville Public Schools). 1 The districts are all engaged in developing and implementing new and varied measures of teacher effectiveness including, for example, teacher observation scores, value-added or growth measures, and student perception surveys. In these systems, teacher observation measures count from 25% to 50% of a teacher’s overall evaluation score. Figure 1 provides an example of the system used in Baltimore that is typical of the other districts. All of the districts we studied have expended considerable amounts of time and resources devoted to creating data systems and implementing processes, policies, and procedures that allow central office staff and principals access to and use of these teacher effectiveness data. Some of the districts are part of intensive reform efforts with strong foundation and philanthropy engagement; all but one of the districts are in Race to the Top states, and some also have Teacher Incentive Funds grants. As noted, the common theme is these districts are heavily engaged in developing, collecting, and thinking about the use of teacher effectiveness measures and have implemented complex, elaborate teacher observation systems, as described in Table 1.

Components of the teacher evaluation rating in Baltimore City Public Schools
Many Elements Included in Teacher Observation Systems
Data collection proceeded in three stages. First, semistructured interviews were conducted with central office personnel in each district. Key system personnel, including the superintendent/president, director of human resources, director of research and accountability, and director of curriculum and/or professional development, were interviewed to examine the types of teacher quality and effectiveness data available to principals and system expectations for data utilization for teacher human capital decisions. In total, we performed over 90 interviews with central office staff across the six systems, ranging from 12 to 17 interviews in each system.
Second, to sample principals for interviews, schools were randomly chosen from a list that we first stratified on the school level (e.g., elementary, middle, high) and achievement level (e.g., low, high). In some cases, scheduling problems or other school circumstances necessitated substitutions of schools on the original randomized list. Overall, we randomly selected four elementary, three middle, and three high school principals to interview from within the achievement stratum, except for one system where high school principals did not participate in the interviews. Interviews with principals were semistructured and reflected the insights gained from the central office interviews and included questions regarding what teacher effectiveness data they use for human capital decisions (such as contract renewals and nonrenewals, deploying support recourses), why, how these data are used, and barriers to data use. We conducted a total of 56 principal interviews.
Interviews with both central office personnel and principals were audio recorded and transcribed verbatim. Transcriptions were then uploaded to Dedoose software for coding. The analysis protocol, which stemmed from the original research proposal, guided development of an initial coding scheme. The process was iterative in nature (Corbin & Strauss, 2008; Le Compte & Schensul, 1999); members of the research team coded a sample of central office and principal interviews regarding specific human capital decisions, type of data used, barriers to data use, ease of data use, and then revised the coding scheme to address questions and concerns that emerged. Researchers coded data from multiple districts. Researchers also compared their coding to ensure consistency in application of codes. Importantly, the researchers double coded all instances of human capital decisions mentioned by respondents by the specific decision (e.g., hiring, professional development, contract renewal) along with the types of information used (e.g., observation data, state test scores, value-added scores). This allowed for subsequent querying of the data by human capital decision and types of data used; researchers where thereby able to assess the types of data most often used for specific decisions. Thematic coding led to the emergence of patterns within and across districts as well. For instance, we learned about various barriers to access of teacher effectiveness data such as weaknesses in data system infrastructure and the timing of when data became available. We share quotes from respondents for illustrative purposes to provide rich descriptions of the themes that emerged across all the systems. Throughout the coding process, researchers wrote in-depth memos to capture nuance as well as ideas that were not always captured in the coding scheme. These memos were considered alongside the coded data during synthesis of findings (Corbin & Strauss, 2008), and these memos were compared to field notes and district site summaries that were developed immediately following the data collection.
Third, in addition to the interviews, we conducted principal surveys in four of the six public school district systems. Data were collected through an online survey questionnaire. 2 Online surveys were distributed to all principals by email. Principal emails were obtained from the system central offices. Email reminders to complete the survey were sent once per week to nonrespondents for 3 to 4 weeks after the initial survey invitation was sent. Hard copies of the survey were mailed to nonrespondents approximately 1 to 2 weeks after they received their last email reminder. A total of 764 principals responded to these surveys, representing an overall response rate of 85.2%, ranging from 79% to 92% across the six districts. Descriptive survey responses are presented in the Results section.
Results
Using Value-Added Measures
Principals across all school systems revealed major hesitations and challenges regarding the use of value-added measures for human capital decisions. Data reveal numerous barriers to utilization of these measures for principals’ decisions, including the timing of data availability and issues around the transparency and complexity of the measures, which in turn contribute to questions about the measures’ validity and principals’ understanding of the measures.
Timing
Central office staff and principals reported that value-added data are unavailable at the time most human capital decisions are made. Two consistent themes emerged about the timing of value-added measures despite the fact that these measures are mostly mandated as part of teacher evaluation systems, especially under Race to the Top: They come too late in the school year to be useful, and they occur only once a year and are thus far removed from the act of instruction. Value-added scores are provided to most principals in the late summer or early fall, whereas many human capital decisions, such as decisions about teacher contract renewal, are made in the spring. Data unavailability makes the use of value-added measures for hiring infrequent. A central office supervisor provided one such example: We’re not getting back scores until like November. We had a teacher, for example, that by the time their scores came back, a principal had hired her a few weeks before, but that person got dipped into an Unsatisfactory. Now that would have impacted the decision on that principal hiring that teacher obviously. . . .
For whatever reasons, principals do not use the prior year’s value-added scores when decisions need to be made.
A principal noted the difficulty of developing improvement plans in early fall, when VAM scores are not available until later in the fall: . . . There are a couple of people who are in that satisfactory borderline, with some needing improvement, and it’s difficult for us to start, okay, let’s go ahead and let’s start a plan of action for them right now, but we don’t have that paperwork because there’s the value-added pieces.
Others noted that they had to change decisions when testing data became available: “When we give our faculty and staff their class assignments, they know that it’s tentative, because as soon as I receive our data back, then I may go in and tweak a little bit to respond to the data.”
Another aspect of timing is that value-added measures are a once-a-year occurrence; the scores and the measures are far removed from the practice of teaching. It is harder for a principal to link specific improvement plans or decisions to value-added data because it is not fine-grained when it comes to what teachers did or did not do in their classrooms. Value-added data cannot provide guidance into why or how the scores emerged. Principals plan individual support and growth plans for teachers during the school year and want to use multiple data points that are relevant for the current school year. One principal explained: I use observation data more than I use anything else . . . it wouldn’t be fair for me to use that value-added data to judge who he [a teacher] is. What would be fairer is to use what he received in his observations because that’s his actual teaching practice . . . I’m going to be honest with you, I take more seriously the observation data than any other data, because it’s what I see. That’s real data to me. . . .
Similarly, when asked on the principal survey how often they look at various sources of data for human capital decisions, 41% of principal respondents indicated they used teacher observation data twice a month to daily, whereas 18% of principals reported they use teacher growth measures twice a month to daily (Figure 2). Forty percent of principals noted they looked at teacher growth measures yearly, whereas 11% of principals reported they looked at teacher observation scores yearly. Clearly, this finding is a function of how often the data are collected, but nonetheless, teacher growth scores are not referred to as frequently when making human capital decisions.
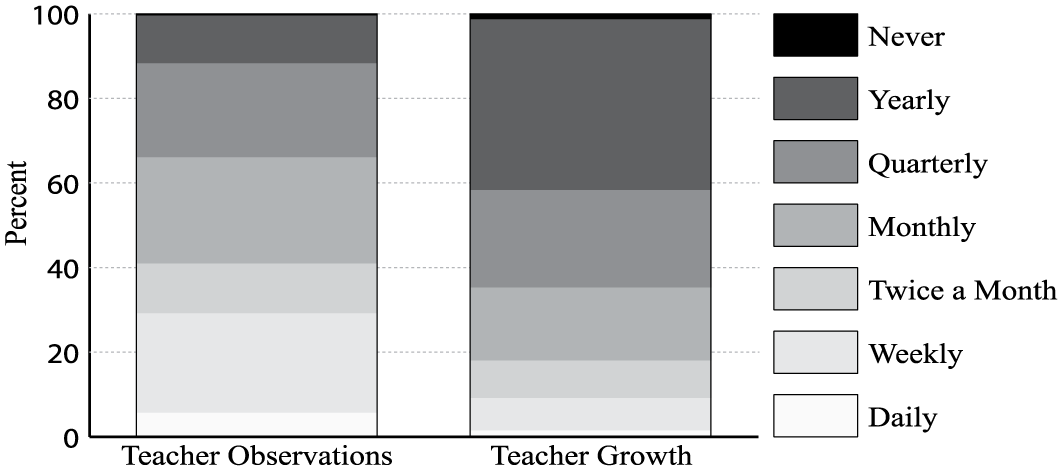
Principal reports of frequency of data use
Transparency and complexity
Principals noted that value-added measures are not transparent, especially in regard to how they are used to determine compensation and even more so for those teachers in nontested subjects. Principals noted they did not really understand how value-added scores were calculated, and therefore they were not completely comfortable using them. Combined with the inability to access data for nontested teachers, principals cannot readily use value-added scores, for example, for teacher contract renewal decisions. As one principal described: But this year I had a social studies teacher I had to make this [nonrenewal] decision for, well, what student achievement data do I use? I think social studies [teachers] are equally responsible for reading and writing, so I had to figure out how do I pull reports on this teacher’s kids in reading and writing from the two years prior. . . .
Some districts use school-wide value-added scores for teachers in nontested subjects. In these systems, principals regularly ignored the value-added results altogether, noting: the challenge of this is: I have an average teacher. She had a growth plan, kind of between a two and a three. . . . But on her final summative [evaluation], she’s a five because she gets the school wide score. That is wrong, okay? So that is the problem with this whole scenario here . . . it hides the teachers that are not doing their job.
The lack of understanding and transparency of value-added measures is highlighted in discussions of teacher compensation systems. Although many of the compensation systems that use value-added along with other measures are still evolving and are in flux, there was widespread concern from principals that they themselves and teachers did not understand how the system worked: They do a formula where they say you get these kids who attend this much or are in this group and who meet this growth target . . . it’s meant to be an incentive so that teachers get paid, and I want teachers to get more pay. But you end up as a leader looking kind of foolish when you’ve told everybody, “Hey, you better get better,” and then they bring you that “exceeds expectations” or, but you’re going, “But our whole grade level dropped by 27%, so how did you guys get a bonus?”
There was quite a lot of mistrust of the use of value-added measures for compensation decisions for those teachers in nontested subjects: . . . I strongly believe in incentivizing teachers who do perform . . . but it’s kind of screwed up right now because you have teachers that are getting inflated scores. You have teachers that are getting deceptive scores because they’re getting the school wide score and they truly, in my opinion deserve the money. . . . If you’re going to do it, it should be done as fairly as you can. I just don’t think it’s right yet.
Similarly, a central office staff member commented: What we have heard loud and clear is that teachers don’t understand the bonus. They don’t understand the theories that undergird the system. They don’t understand the outcomes. They cannot associate the outcomes with what they do in their classrooms. I did the same thing this year that I did last year, but last year I earned a bonus of $6,000. This year, I didn’t earn anything and my kids aren’t that different. So please tell me what I did. So we’ve not successfully been able to articulate that for teachers.
Perceived validity
Principals reported that they perceived observations to be more valid than value-added measures. One principal summarized this sentiment: The value-added scores, because they’re so elusive to all of us, you know, no one can really explain them, and that’s just the animal that it is, right? But they’re concrete. And so, they feel like that there still must be something behind those scores that aren’t fair. And so, for them to trust something that is that obscure, they struggle with that a little bit.
One noted exception to the use of value-added scores seemed to be in the area of assigning teachers to particular grades, subjects, and classes. Many principals mentioned they use value-added measures to place teachers in tested subjects and with students in grade levels that “count” for accountability purposes. Interviews with principals suggested that grade assignment decisions were driven in part by state and end-of-course tests used for No Child Left Behind accountability and overall school value-added grades: In my school last year, we changed every single End of Course (EOC) teacher because their growth scores were not there. And so we looked for people with real potential to have growth with those students, because we are judged pretty much now by our EOC scores, which is just simply algebra one, English two, and biology. . . . So it’s very important to us that a teacher have a growth score, be able to show growth within those areas.
The main point is that because of accountability, some principals did use VAM to move ineffective teachers to untested grades, such as K-2 in elementary schools and 12th grade in high schools.
Survey data responses from principals also suggest that more principals view teacher observation data as valid than value-added measures (Figure 3). In response to the question “To what extent do you personally believe that each component below of your district’s teacher evaluation system is a valid measure of aspects of a teacher’s effectiveness?” 84% of principal respondents noted that teacher observations were valid to a very large extent, compared to 56% who said student achievement/growth was valid to a very large extent.
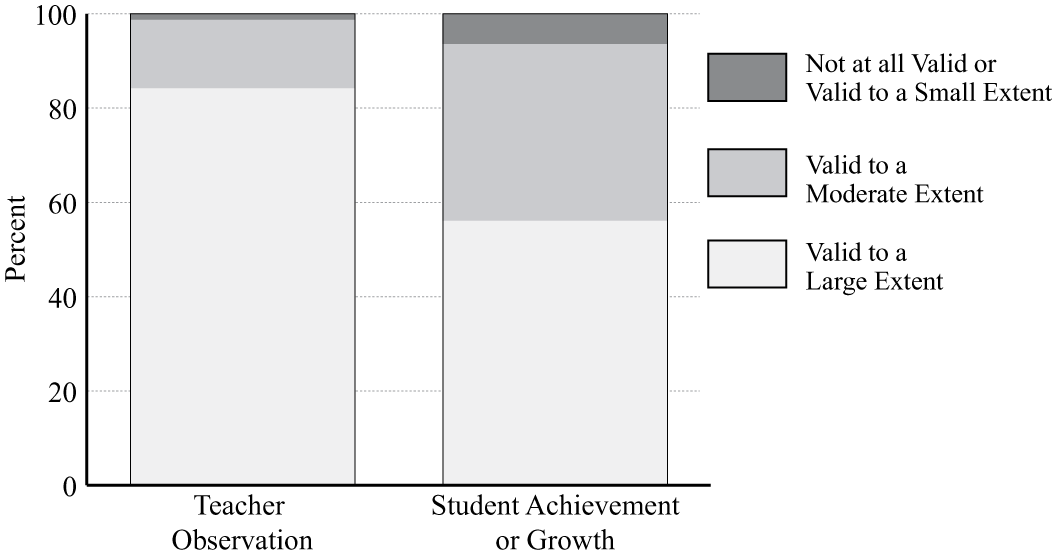
Principals’ perceived validity of measures for teacher evaluation
Furthermore, when asked in what areas principals would like more support, 32% of the principals on the survey indicated that they wanted support in understanding value-added measures to a very large extent, and 41% wanted more support to a moderate extent. Of all the areas probed, this was the area where there was strongest desire for additional support.
Using Teacher Observation Data
In contrast to value-added measures, principals resonated with using teacher observation scores precisely because they were timely, transparent, and clear. Although very time consuming, including requiring the principal to spend hours in the classroom, scripting evidence and scoring a rubric, principals recounted how the collection of observation rubric data has influenced their human capital management in very specific ways. Principals and central office staff spoke at length about their use of teacher observation data to support teachers, drive feedback to teachers, and develop individual growth plans.
In half of the systems, there is a strong and clear expectation that there be alignment between a teacher’s value-added growth score and observation ratings (see Harris et al., 2014). Sometimes this was a state directive and other times it was district-based. In some systems, this alignment is part of the principal’s own evaluation; principals receive reports that show their alignment. One district staff member explained, “Aligned is when the student performance at the school is aligned with the ratings that teachers received for the instructional practice that was observed. So observations and student results lined up.” One district leader explained: [the] statewide principal evaluation system holds principals accountable for the correlation between their observation scores and [state test] scores. On paper, sounds great. You don’t want a principal to be going in, giving fives to a teacher who’s getting ones [on Value Added]. . . . However, the outcome is that principals know that. They know that their evaluation is dependent on their correlation, so they’re just looking at the year before . . . while they’re making their observations. So total invalidation of the observation process.
One district provided regular reports to principals that showed the degree of alignment and that report was part of coaching conversations between principals and supervisors. Principals felt uncomfortable because they were not sure if their observation scores should align primarily with the evidence in the observation rubric, or with the VAM.
Transparency
Principals gravitated to the teacher observation data because of the clarity and specificity of the rubrics, and because excellence in teaching is clearly defined. Unlike value-added measures, all teachers in all subject matters are held to the same observation schedule and requirements, regardless of subject matter. All teachers are observed on a common rubric, with the same scoring and evidence requirements. The clearly defined procedures associated with the observation process also foster transparency. As one principal explained: I was in classrooms better, more often. . . . I would say because of the observation system, using it really consistently, I think there wasn’t any gotcha’s, there was no surprise. Here’s the language, here’s the rubric, here’s what I’m looking for. I had discussions about, “This really needs to improve.” I also became more strategic . . . who am I concerned about and getting support in that classroom? Because I really knew what was going on early on.
In one district, there is a very elaborate system of calibration by peer observers that adds to the transparency; peer evaluators are teachers who have been fully released from classroom teaching responsibilities to conduct classroom observation of teachers for up to 3 years. Having multiple points of data on teacher practice from multiple sources helps establish its validity and usefulness as tool for decision making. One principal explained: I think because we have the accurate, the data here and it’s not just mine. It’s the peer. It’s the supervisor. It’s somebody else that’s been in. It’s an easier conversation to have because you’ve got specific data on questioning. Well, you know what, out of the three people that have been in your classroom, everybody has rated you as progressing in this area. So you’ve got that confidence because you believe in the rubric. . . . That makes it easier, and they’re ready to . . . say, “you know what, I am going to go to professional development on questioning or assessment because I can see that’s where most people are saying I need some training.”
Timing
Many human capital decisions occur in the fall and others in the spring, whereas some are ongoing throughout the year. Observation data, unlike value-added measures, are collected at multiple points during the school year, including formal and informal data collection, and are readily and immediately accessible. In our participating systems, principals script their observations, document evidence, and score the rubric directly after their observations and upload the data in a computer software program; feedback conversations based on the observation data are ongoing. For example, central office leaders expect principals to use observation data to engage in “crucial conversations” with teachers, not only during the summative end-of-year conversation, but throughout the school year. Such conversations are meant to be discussions between the principal and teacher, detailing areas of instructional strength and areas in need of improvement.
Specificity
The observation rubric provides principals with specific, actionable feedback to teachers. Principals can pinpoint where teachers need support and development and where they have documented strengths. These data are then very useful in developing growth plans, providing specific feedback, and documenting the case for dismissals and contract nonrenewals.
Principals reported that the observation process and the reliance on the rubric provided clear guidance for them in the process of assigning ratings. When it came time to give feedback to teachers, they felt equipped with objective evidence upon which they could base their claims. Objective evidence was especially important in cases where experienced teachers needed to improve in certain areas, but were taken aback because they had not been told for many years that their practice was not up to par: The benefit of the new evaluation system is it pinpoints exactly the next step for the teacher to grow. And that’s a huge benefit to the teachers, because it doesn’t leave it up to, “well, I think maybe you should do this next.” It’s this whole continuum, okay, so if I’m in developing, this is the criteria to get to effective. Now I know exactly what I need to do. And that’s very beneficial to the teachers, and they really like it for that reason. And I think it helps drive our conversations, that it becomes more, the feedback is more beneficial to the teachers, because it was like okay, this is what you did. And there’s no I think you did this, I like the way you did this. This is what was said by you, by the students, the actions by the students, and it tries to make it as objective as possible. There’s always some subjective in there. But so I think that it’s beneficial for that reason. It clears up all of that loose talk that you don’t really have the evidence to back it up. But the teachers really like it because they can see next steps.
In sum, the use of observation data is important to principals for a number of reasons: It provides a “bigger picture” of the teacher’s performance, it can inform individualized and large group professional development, and it forms the basis of individualized support for remediation plans that serve as the documentation for dismissal cases. It helps principals provides specific and ongoing feedback to teachers. In some districts, it is beginning to shape the approach to teacher hiring as well (see Cannata et al., 2014).
Conclusion
Clearly, teacher value-added growth measures and observation measures are different. They serve different purposes and provide distinct information about teachers and teaching. And as we learned in our study, teacher observation systems are not without their challenges. The systems are time-consuming, raising the question of how principals can continue to do everything they were doing before this new role, without seriously considering the distributed leadership in schools and altering the role definitions of other staff (Neumerski et al., 2014). Many principals are simply overwhelmed. Some principals noted that they felt that the quality of informal interactions and discussions with teachers and students were suffering. Moreover, the software and hardware of observation data systems are largely not up to the task; most data systems do not allow principals to sort their data to look for patterns across teachers and across time. Also, in some districts, the strong and stated expectation that principal observations align with growth measures and that growth measures are the “true measure” of effectiveness may both bias principals’ observation scores and undermine their usefulness (Grissom & Loeb, 2014). This expectation of alignment created uncertainty for some principals when they notice lack of alignment between these measures for individual teachers.
Although the preferences for using teacher observation data amongst the principals we studied were prevalent, it is important to note that there were individual cases in which principals wanted to use value-added measures for human capital decisions. Some principals believe that value-added measures are extremely important, especially for teachers in tested subjects. They tend to rely mostly on their use for strategic assignment decisions, but less so for other personnel decisions. Many principals want to understand the intricacies of value-added data, and they want data systems that provide them with ready access to multiple years of data alongside teacher observation data in a timely and straightforward manner.
Still, as policy makers and policy researchers debate the robustness and use of value-added measures, it is important to keep in mind that educators on the front line are highly engaged in measuring teacher effectiveness using other means that are growing in sophistication and depth, and they are finding numerous productive uses for decision-making in their schools. Student growth measures are but one tool in the toolbox, and our interviews with district and school leaders suggest that they are becoming less relied upon as the observation components of evaluation systems become better developed and implemented. Provided flexibility and choice around data use and measures for human capital decisions, principals in these districts suggest they would rely more heavily on data from observations of teaching. If the goal is to improve school leaders’ use of teacher effectiveness data in making decisions around teacher human capital, shifting some focus and resources from the further refinement of student growth measures to the development of tools, capacity, and supports for high-quality observation systems holds great promise for transforming school leadership processes. The advent of new observation systems stands to strengthen principals’ overall use of data for human capital decision making because observation data may fill in for some of the perceived shortcomings of value-added measures.
Although the findings of our study are from a sample of large urban districts that have invested heavily in developing and implementing teacher observation systems as part of teacher evaluation policies, the results point to the potential promise these data may hold for informing human capital decisions. Further research should analyze the extent to which observation measures and their use are related to school improvement processes, such as academic press or actionable feedback to teachers, as well as improvement in instruction and learning (Hallinger et al., 2014). More research is needed to continue to probe why, and under what conditions, there is consistency or inconsistency between observation scores and other measures of teaching and learning. Studies could examine the actual use of teacher observation data through monitoring data warehouses and data systems (see Tyler, 2013); intervention studies can research data use and human capital outcomes such as retaining highly effective teachers and dismissing ineffective teachers. The cost effectiveness of such elaborate observations systems should also be studied, alongside continued development work around the observation and data systems and tools themselves (Harris, 2013). Equally important, we suggest research is needed that will address how the implementation and use of teacher observations affects principal roles, perspectives, and effectiveness. For years, the field has lamented that principals do not spend time in classrooms and do not sufficiently attend to teaching and learning. Structured teacher observations, as integral components of teacher evaluations, are poised to be a very powerful lever for changing principal leadership and the influence of principals on schools, teachers, and learning.