
Abstract
The passage of landmark federal legislation in 1975 guaranteed students with disabilities (SWDs) a free appropriate public education. Over time, reauthorization of this legislation has highlighted the importance of educating SWDs in the general education environment where appropriate, and significant interaction with general education peers who are not receiving special education services (GENs) has followed. The largest U.S. school district—New York City (NYC), the setting of our study—mirrors this national trend toward more inclusive environments. Despite the trend, a critical question remains: Does inclusion in fact feel inclusive? This study provides a district-wide descriptive analysis of feelings of inclusion among SWDs compared to their GEN peers. We rely on detailed, longitudinal administrative and student survey data on approximately 249,000 NYC middle school students attending schools that educate both SWDs and GENs (which we call traditional schools in contrast with schools that educate only SWDs). Our results suggest that while gaps between SWDs overall and GENs are quite small, there is some heterogeneity. Specifically, students with an emotional disturbance (ED) and other health impairments (OH) feel modestly less included with peers but more with adults. There are, however, almost no differences in feelings of inclusion between students assigned exclusive and inclusive services, even for those in the ED and OH groups. In fact, for students with low incidence (LI) disabilities, feelings of inclusion are slightly better when assigned exclusive services.
Keywords
The passage of landmark federal legislation in 1975 guaranteed students with disabilities (SWDs) a free appropriate public education. 1 Over time, reauthorization of this legislation has highlighted the importance of educating SWDs in the general education environment where appropriate, and significant interaction with general education peers who are not receiving special education services (GENs) has followed. For example, by 2014, 62.6% of SWDs nationwide “were educated inside the regular class 80% or more of the day,” an increase of 16.9 percentage points from 1996 (U.S. Department of Education, 2007, 2015). The largest U.S. school district—New York City (NYC), the setting of our study—mirrors the nation, with 60.5% educated inside the regular class in 2014 (NYSED, 2017). Moreover, between 2006 and 2012 in NYC, the percentage of SWDs assigned to self-contained services declined while the percentage assigned to services in the general education environment increased, by 9 percentage points (Stiefel, Shiferaw, Schwartz, & Gottfried, 2017).
Although the delivery of SWD education services involving considerable interaction with GENs (labeled inclusive services hereafter) is a national and NYC trend, there is little empirical evidence supporting the efficacy of the practice. There is, however, some evidence that special education services in general can improve achievement for SWDs (e.g., Cohen, 2007; Hanushek, Kain, & Rivkin, 2002). Perhaps most surprising is the dearth of evidence on whether students educated with inclusive services feel included—important itself and for its effect on academic success (Anderman, 2002). We fill this gap by providing a rich descriptive examination of four questions:
Research Question 1: How do SWDs and GENs perceive feeling included in schools that educate both SWDs and GENs (hereafter traditional schools in contrast to schools that educate only SWDs)? 2
Research Question 2: Do SWDs’ perceptions differ across major disability classifications?
Research Question 3: Are there differences between assigned services that are inclusive rather than exclusive?
Research Question 4: Since low-performing students may perceive the school environment differently, to what extent are results driven by differences in students’ academic achievement?
Answering these helps policymakers and practitioners understand patterns of responses to the inclusive environment and sheds light on whether steps need to be taken to make inclusion in fact feel more inclusive.
We are in a unique position to examine these questions for several reasons. First, NYC public schools have large populations of both SWDs and GENs, increasing the ability to detect nuanced relationships, obscured in smaller data sets. Second, NYC’s heterogeneous students and neighborhoods make it a useful setting for policy and practice that applies to many different kinds of districts, although its exceptional size and complex political environment might also mean that findings are likely more narrowly relevant only for the largest U.S. districts. Third, our data contain rich detail on disability and assigned special education services that allow us to parse more finely the single aggregate category “SWD.” Finally, we have student responses to survey questions about the school environment for both SWDs and GENs. This is particularly important because we can determine how students with different disabilities and assigned different services feel about inclusion in their schools both overall and in comparison to GEN peers. 3 We use these data to estimate descriptive regression models that examine SWDs’ feelings of inclusion compared to GENs.
Background
Inclusion of SWDs in the general education environment has a clear appeal. While much of the literature on this topic was published over 15 years ago, when opportunities for using causal methods were more limited, the correlational findings were generally positive. 4 For example, inclusion can offer SWDs greater access to the general education curriculum, which has been linked to increased academic success (Baker, Wang, & Walberg, 1995). Existing evidence supports the notion that inclusion could also boost social development as SWDs may feel a better sense of school belonging and acceptance rather than feeling labeled and isolated, which often results from little (or no) interaction with GENs (Ballard, Corman, Gottlieb, & Kaufman, 1977; Fitch, 1999, 2003; Schnorr, 1990). Moreover, inclusion may result in some instruction in classrooms that offer two teachers, potentially benefitting both SWDs and GENs (Schwab & Gelfman, 2005).
That said, many education stakeholders question whether inclusion adequately addresses the needs of SWDs (Moon, Todd, Morton, & Ivey, 2012; Rule, Stefanich, Haselhuhn, & Peiffer, 2009; Supalo, Mallouk, Rankel, Armorosi, & Graybill, 2008). For example, general education teachers are often underprepared to educate SWDs (Kauffman & Hallahan, 1993; Moon et al., 2012), there may be a lack of necessary individualization within larger classes (Sandler, 1999), or schools may be unequipped to address SWD needs adequately (Supalo et al., 2008). Additionally, because students rely on classmates to make comparisons and develop self-confidence (Huguet et al., 2009), SWDs might have lower self-esteem if they compare themselves to higher performing or more socially adjusted GENs (Freeman & Alkin, 2000). There also may be problematic effects for GENs. For instance, some SWDs may be disruptive at school (Fletcher, 2010), slowing the pace of instruction as teachers attend to management (Gottfried, 2014; Lazear, 2001). Finally, increasing diversity might lead to hostility (Banks & Banks, 1995).
Despite these concerns, quantitative research on the effects of inclusion is scarce, focuses on academic outcomes, and reports mixed results. For SWDs, some studies find positive effects of inclusion on academic outcomes (Jepma, 2003; Markussen, 2004; Myklebust, 2007; Peetsma, Vergeer, Roeleveld, & Karsten, 2001; Rogers & Thiery, 2003; Rojewski, Lee, & Gregg, 2015; Waldron & McLeskey, 1998), while a few show negative or null findings (Cole, Waldron, & Majd, 2004). For GENs, the literature is also mixed. Fletcher (2009, 2010) finds that having classmates with emotional and behavioral disabilities lowers math test scores. Friesen, Hickey, and Krauth (2010) and Keslair, Maurin, and McNally (2012) find null peer effects of SWDs. Gottfried and Harven (2015) and Gottfried, Egalite, and Kirksey (2016) find that GENs perform worse with SWD classmates, although this effect is moderated by the percentage of female classmates. Hanushek et al. (2002), however, report a higher proportion of SWDs in a grade raises GEN math achievement.
Much less is known about how inclusion influences SWDs’ socioemotional well-being, in particular perceptions of inclusion. For GENs, feeling included in school predicts multiple indicators of academic success. For instance, researchers have found that feeling included predicts academic self-efficacy (Uwah, McMahon, & Furlow, 2008), achievement (Anderman, 2002), school completion (Finn, 1989), expectancy of success (Goodenow & Grady, 1993), and transition into postsecondary education (Pittman & Richmond, 2007). But little is known about these patterns for SWDs in general education settings. We believe this oversight is problematic because SWDs are less likely to be socially integrated with peers, have poorer relationships with teachers, and are more likely to be socially isolated than GENs (Biordi & Nicholson, 2012; Murray & Greenberg, 2001; Pearl et al., 1998; Turner & Noh, 1988; Van Gundy & Schieman, 2001).
These issues of feeling included become especially poignant in the context of specific assigned services and disabilities. On the one hand, as SWDs receive more inclusive services, SWDs and GENs spend more time together and may feel greater similarity (Freeman & Alkin, 2000) and exhibit improved interpersonal skills and acceptance of individual differences (Gottfried, 2014; Williams & Downing, 1998). On the other hand, inclusion might inhibit feeling included. Pulling SWDs out of general education classrooms to receive services may increase feelings of dissimilarity, decrease participation in curricular activities with GENs, and diminish feelings of acceptance from both groups (Gottlieb, 1981; Schnorr, 1990). Moreover, it is likely that the type of disability plays a role. SWDs with emotional disabilities involving aggression or disruptiveness may feel more rejected by their peers (Coie, Dodge, & Kupersmidt, 1990; Siperstein & Leffert, 1997), which might be exacerbated with increased time spent with GENs. In this case, feelings of inclusion may decline (Freeman & Alkin, 2000; Kozleski & Jackson, 1993). Other SWDs may experience more (or less) positive peer attitudes (Laws & Kelly, 2005; Nowicki, 2006), low self-esteem, or teasing, for example. Hence, the relationship is complex, requiring detailed attention to service assignment and disability.
Issues pertaining to feeling included are especially critical for middle school students—the focus of our study. Students first feel self-consciousness and make social comparisons in middle school (Nicholls, 1990) and feel a greater need for positive and supportive peer and nonparental adult relationships than earlier (Anderman, 2003; Blum, McNeely, & Rinehart, 2002). In middle school, students become more aware of and vulnerable to school social climate (Anderman, 2003; Wang & Holcombe, 2010) and may begin to feel either more included in or alienated from school—feelings that continue into high school (Rumberger, 1995). Young adolescents’ sense of belonging and inclusion has significant ramifications for academic and psychological development (Anderman & Freeman, 2004; Resnick et al., 1997). Therefore, understanding how inclusion contributes to these feelings is important, particularly during a significant transitional period like middle school. It is even more poignant for SWDs facing the aforementioned difficulties in establishing and maintaining social relationships.
In summary, although SWDs are increasingly included with GENs in school, almost nothing is known about whether inclusion is linked to feeling included. Because (a) inclusive practices are increasingly prevalent in our nation’s schools and (b) feeling included is important for short- and long-term social and educational success, it behooves researchers to determine to what extent students do in fact feel included. Understanding the processes that facilitate feeling included in school might be effective in increasing educational success for all.
To address these issues, we provide rich descriptive evidence from multiple regression models that associate SWD status with measures of feeling included. We probe the associations more deeply by distinguishing SWDs by disability classification and comparing feelings for students receiving exclusive compared to inclusive services.
Methods
Data and Measures
Overall sample
We use administrative and survey data from the New York City Department of Education (NYCDOE). The final sample comprises 248,951 students attending 502 traditional public schools serving Grades 6 through 8 between 2007 and 2012. 5 We exclude SWDs attending schools in the special district (D75) serving students with severe disabilities, although results are robust to including them.
SWD sample and measures
We identify disability status, classification, and primary assigned service of each student. During the special education assessment process, each student is professionally evaluated, assigned a disability classification (among the 13 federal disability classifications), and where appropriate, an Individualized Education Program (IEP) is developed. For our study, SWDs include all students with an IEP; GENs are all others. We group the 13 disability classifications into the five largest categories in our sample: learning disability (LD, 60.5% of middle school SWDs in our 2012 sample), speech impairment (SI, 26.3%), other health impairment (OH, 7.1%), emotional disturbance (ED, 2.6%), and low incidence (LI, 3.5%), which includes deafness, deaf-blindness, visual impairment, hearing impairment, intellectual disability, multiple handicap, autism, traumatic brain injury, and orthopedic impairment. Shogren, Kennedy, Dowsett, and Little (2014) grouped high-incidence disabilities (learning, emotional, speech, or language impairments and other health impairments) separately from low-incidence groups. Their taxonomy is similar to ours and also demonstrates precedence for collapsing federal categories into analytically manageable groups.
Following the information in the IEP, NYCDOE identifies the primary assigned service as the service (of four possible) that is assigned to the SWD for the largest proportion of time, which can be less than 50%. The NYCDOE ranks these from the “least to most restrictive environment” as follows (NYCDOE, n.d.): related services only (RS, 9.1% of SWDs in our 2012 sample), special education teacher support services (SETSS, 40.7%), integrated co-teaching (ICT, 45.0%), and self-contained (SC, 5.3%). See Appendix Table A4 for the percentage of students by disability classification and assigned service for our sample. RS include services such as counseling, physical therapy, and hearing education. Students are assigned RS as their primary service if it is their only service. SETSS take place in general education classrooms and provide pullout or in-class selective services to support SWDs or indirect services to foster collaboration between special education and general education teachers. ICT services take place in classrooms with both general and special education teachers in classes with both GENs and SWDs. SC services are provided to SWDs grouped by needs. 6 We create a dummy variable, exclusive, that takes a value of one if a SWD is assigned to SC (the least inclusive service) and zero otherwise (that is, assigned to an inclusive service—RS, SETSS, or ICT). 7
Other student measures
Student sociodemographic characteristics and performance levels include gender, age, race/ethnicity, nativity status, Limited English Proficiency (LEP), home language, free/reduced price lunch eligibility, and proficiency levels on lagged fifth-grade English language arts (ELA) and math examinations. Data include school and grade IDs.
In Table 1, we present descriptive statistics for the most recent year of data, 2012, for our analytic sample of students in traditional schools. Recall we do not include students in D75. SWDs make up roughly 11% of the sample and differ from GENs markedly; they are disproportionally male, Hispanic, LEP, native-born, and likely to score below proficiency on math and ELA tests. The majority of SWDs (95%) are assigned inclusive services (RS, ICT, or SETSS). SWDs with each disability are represented in all four assigned services, although SETSS and ICT are most common. Relative to other classifications, a larger share of students with emotional disturbances are assigned SC services.
Descriptive Statistics for Sixth- Through Eighth-Grade Students With Disabilities and General Education Students in NYC Traditional Public Schools, 2012
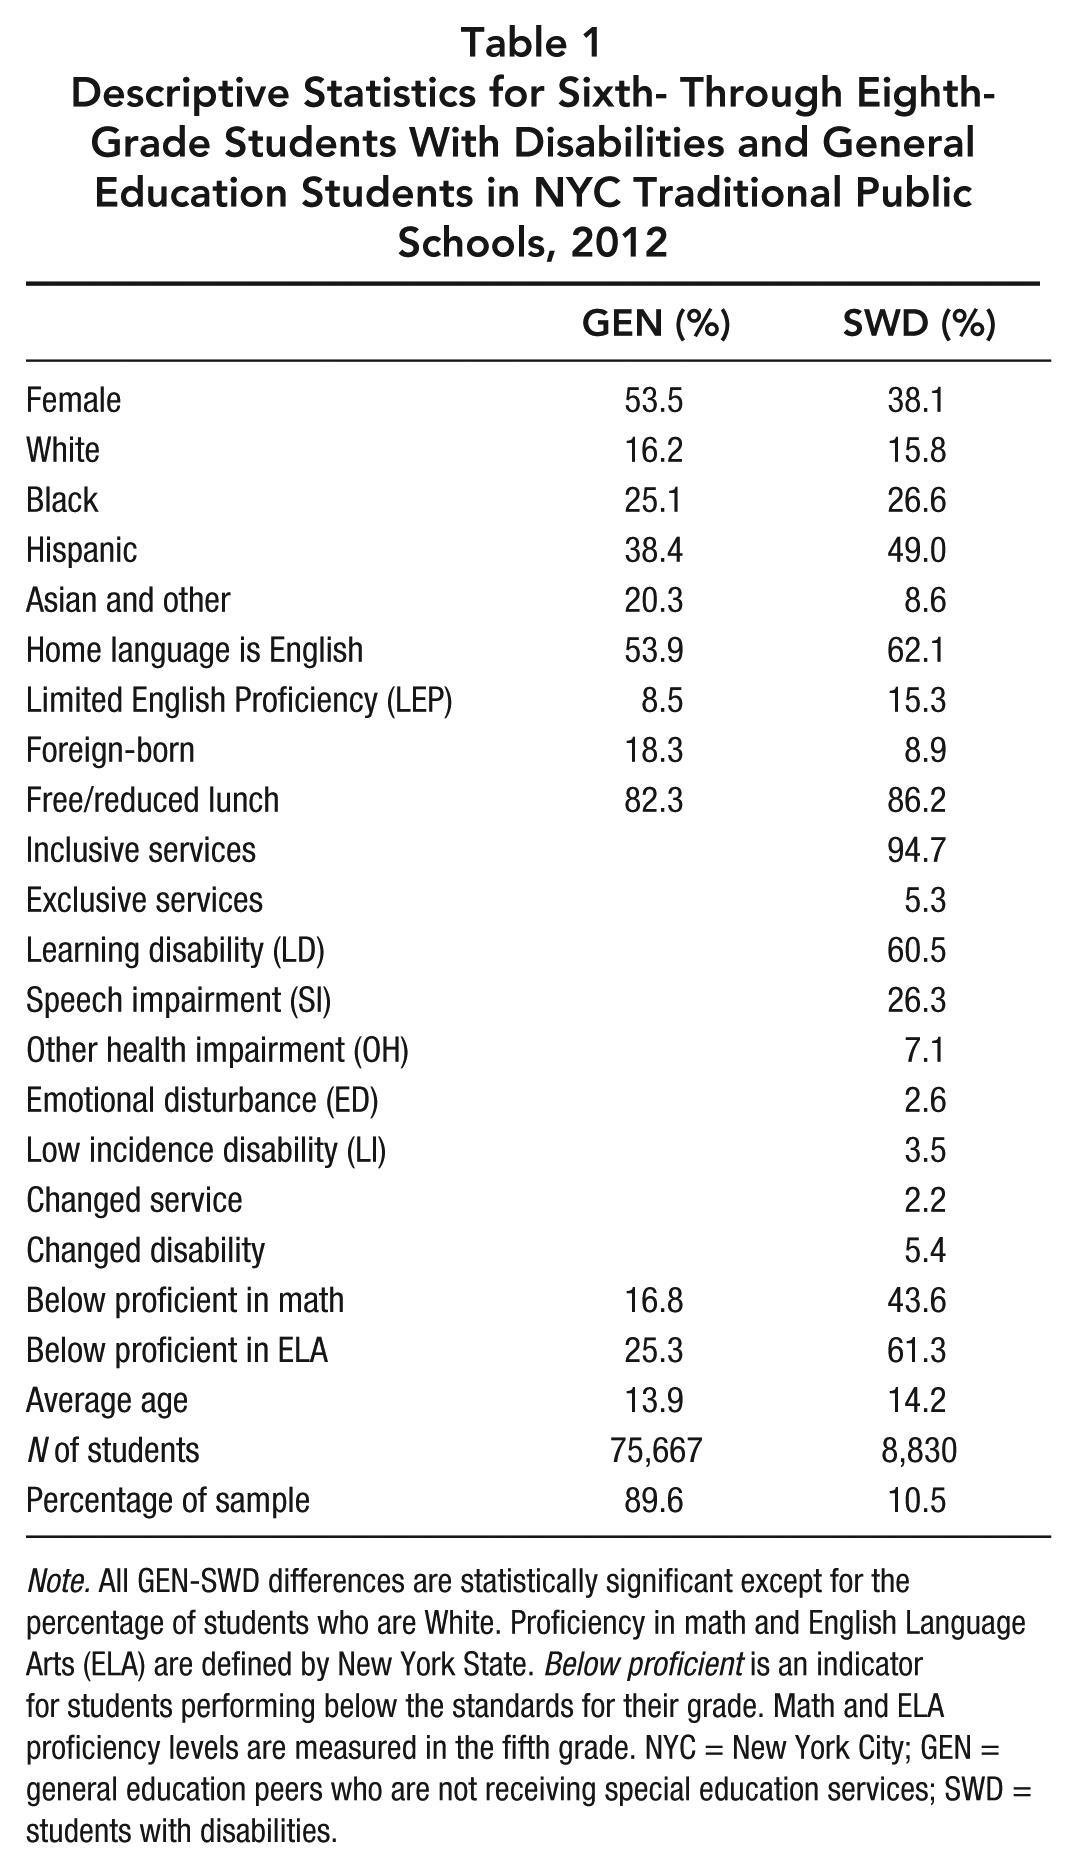
Note. All GEN-SWD differences are statistically significant except for the percentage of students who are White. Proficiency in math and English Language Arts (ELA) are defined by New York State. Below proficient is an indicator for students performing below the standards for their grade. Math and ELA proficiency levels are measured in the fifth grade. NYC = New York City; GEN = general education peers who are not receiving special education services; SWD = students with disabilities.
Outcomes: Feeling included
In 2006–2007, NYC launched an annual survey of students’ responses to questions concerning their learning environment (Learning Environment Survey; NYCLES). The largest survey of its kind in the United States, it provides unusually rich information on 6th- through 12th-grade students with over 60 questions in four broad reporting categories: academic expectations, communication, engagement, and safety and respect. Response rates increased steadily since first implementation, from roughly 60% in 2007 to 90% in 2012 in our sample. We account for varying response rates across questions and students by weighting all models using the inverse of the predicted probability of response (Seaman & White, 2013; Wooldridge, 2002). Results are robust to excluding 2007, which has relatively low survey response rates. See Appendix Table A5.
To be sure, “feeling included” is a multidimensional aspect of the learning environment, reflecting engagement, safety and respect, and communication. Five questions that span these three domains of the learning environment cover aspects of the school environment related to feeling welcome (welcome), bullying (bully), harassment (harass), being known (known), and SWD inclusion in school activities (included).
As shown in Table 2, the response to each question is either on an agreement scale (strongly agree, agree, disagree, or strongly disagree) or frequency scale (all of the time, most of the time, some of the time, or never). For each, we construct a binary indicator taking a value of one if the student agrees (strongly agree/agree) or the event occurs more frequently (all of the time/most of the time). Other authors also have used binary indicators (Cannon, Jacknowitz, & Painter, 2006) and/or analyzed other ways of categorizing such variables and have found that all the “empirical action” is captured by the binary representation (Gibbons & Silva, 2011).
Survey Questions That Capture Feelings of Inclusion
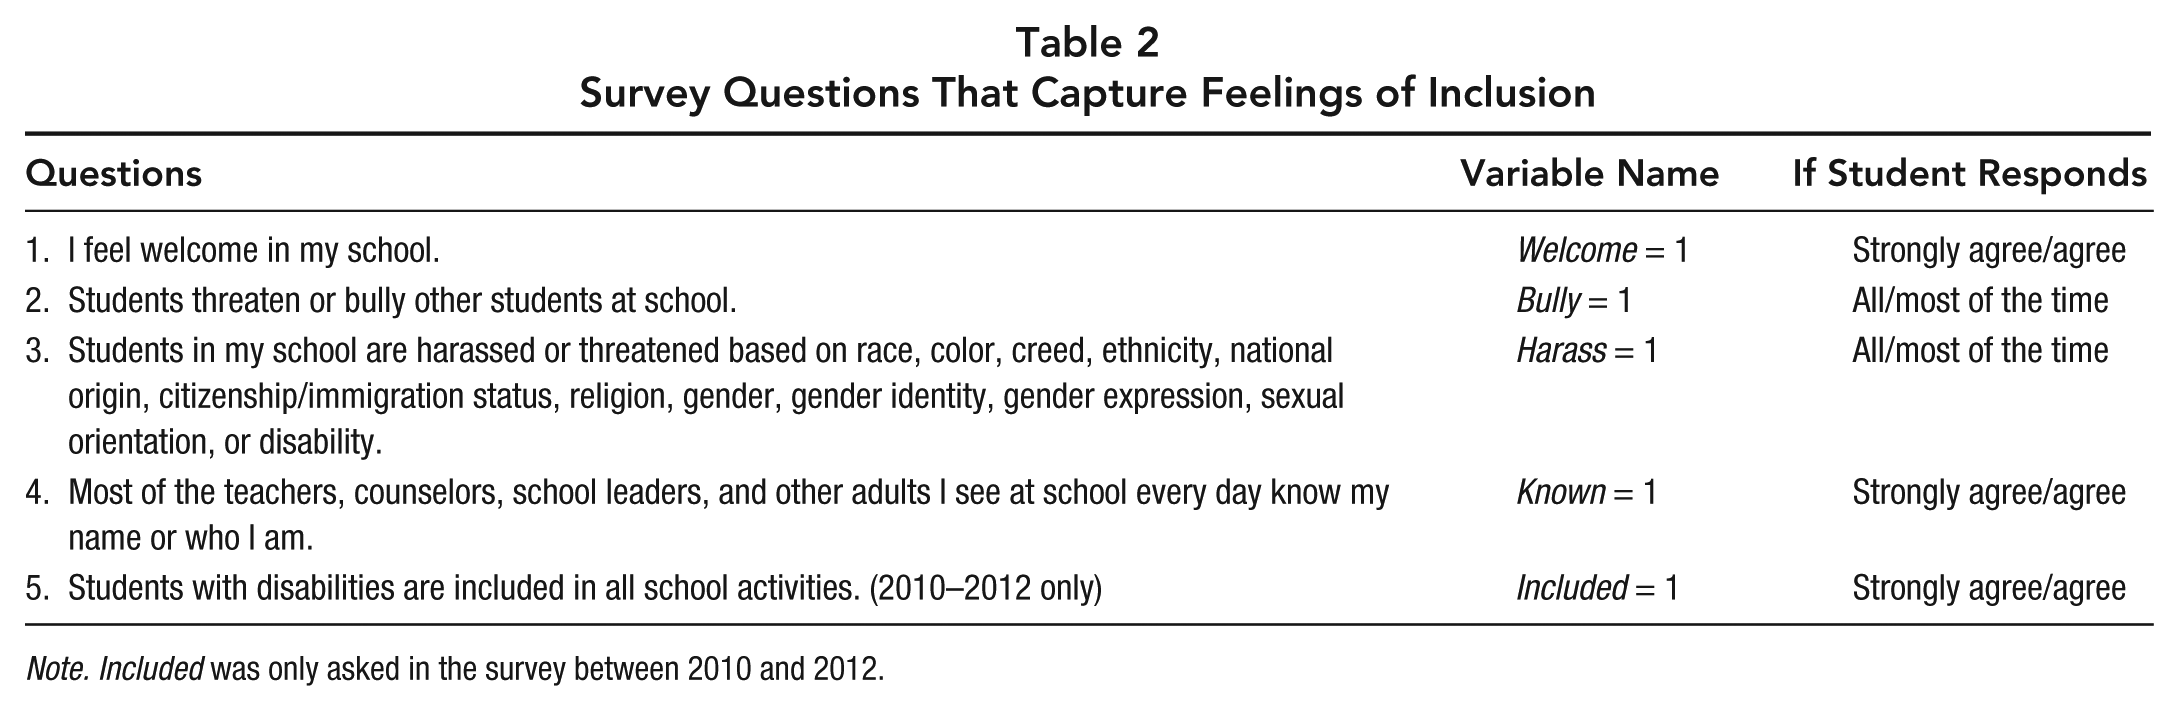
Note. Included was only asked in the survey between 2010 and 2012.
Empirical Framework
To provide descriptive evidence on Research Question 1 (How do SWDs and GENs perceive feeling included in traditional schools?), we first estimate a baseline linear probability model linking feeling included to SWD status:

where igst denotes student i, in grade g, attending school s, in year t. The outcome Y represents a dichotomous response as described previously. θ and τ are grade and year effects, respectively, capturing grade-specific idiosyncrasies or common factors in each year such as systemwide accountability policies. In all models, standard errors are clustered at the school by year level. This is consistent with later models that include school by year fixed effects. The reference group is GENs so that δ captures conditional differences in feeling included between SWDs and GENs. Estimation of logit models yields similar results to linear probability models.
The next models deepen the analysis by adding a set of student characteristics (X) encompassing gender, age, race/ethnicity, nativity status, LEP, home language, free/reduced price lunch eligibility, and proficiency levels on lagged fifth-grade ELA and math examinations. We substitute school by year fixed effects (πst) for year effects to capture school-specific differences, such as principal leadership, which may change over time:

To answer Research Question 2 (Are SWD reports about feeling included heterogeneous?), we replace SWD with a set of disability indicators,

Here our coefficients of interest, δ, capture the disparity in feelings of inclusion between SWDs in each disability classification and GENs, accounting for differences in student characteristics and differences across grades and schools by years.
Third, to address Research Question 3 (Are there differences in perceptions about feeling included by assigned service?), we estimate a model that includes the interaction between each of the disability indicators and an indicator for being assigned to an exclusive service (

As in Equation 3, components of
Finally, to address Research Question 4 (To what extent are differences driven by academic performance?), we reestimate Equation 4 including lagged proficiency levels. While proficiency could be related to feelings of inclusion, it may also indicate the need for special education services. Moreover, feelings of inclusion could affect test scores or vice versa. Disentangling these is complicated, and including a control for proficiency in the model is no doubt not fully satisfying. Nonetheless, since recent literature suggests such controls can change the size and signs of important coefficients (Morgan et al., 2015), we report results with lagged, fifth-grade proficiency levels. Results are similar when we include contemporary proficiency levels or test scores.
Results
Feeling Included
Question 1 asks how SWDs as a whole and GENs perceive feeling included in traditional schools. Results are presented in Figure 1, which shows SWD and GEN responses to each survey question, adjusting for grade and year. All differences between SWDs and GENs are statistically significant. As shown, fairly high percentages of both SWDs and GENs feel welcome and known, somewhat lower percentages of both feel included, and significant percentages of both report a likelihood of bullying and harassment. Importantly, however, compared to GENs, SWDs are only modestly less likely to report feeling welcome, somewhat more likely to report bullying, and somewhat more likely to report harassment at school. Also, compared to GENs, SWDs are somewhat more likely to report that adults know their name and somewhat more likely to report being included in school activities. All differences are between 1.7 and 6.3 percentage points (ppts). While these differences are small, they may be meaningful for the most vulnerable students who are attempting to navigate their environment as young teens. Subsequent results will also illustrate that averaging across all SWDs masks notable disparities by disability type.
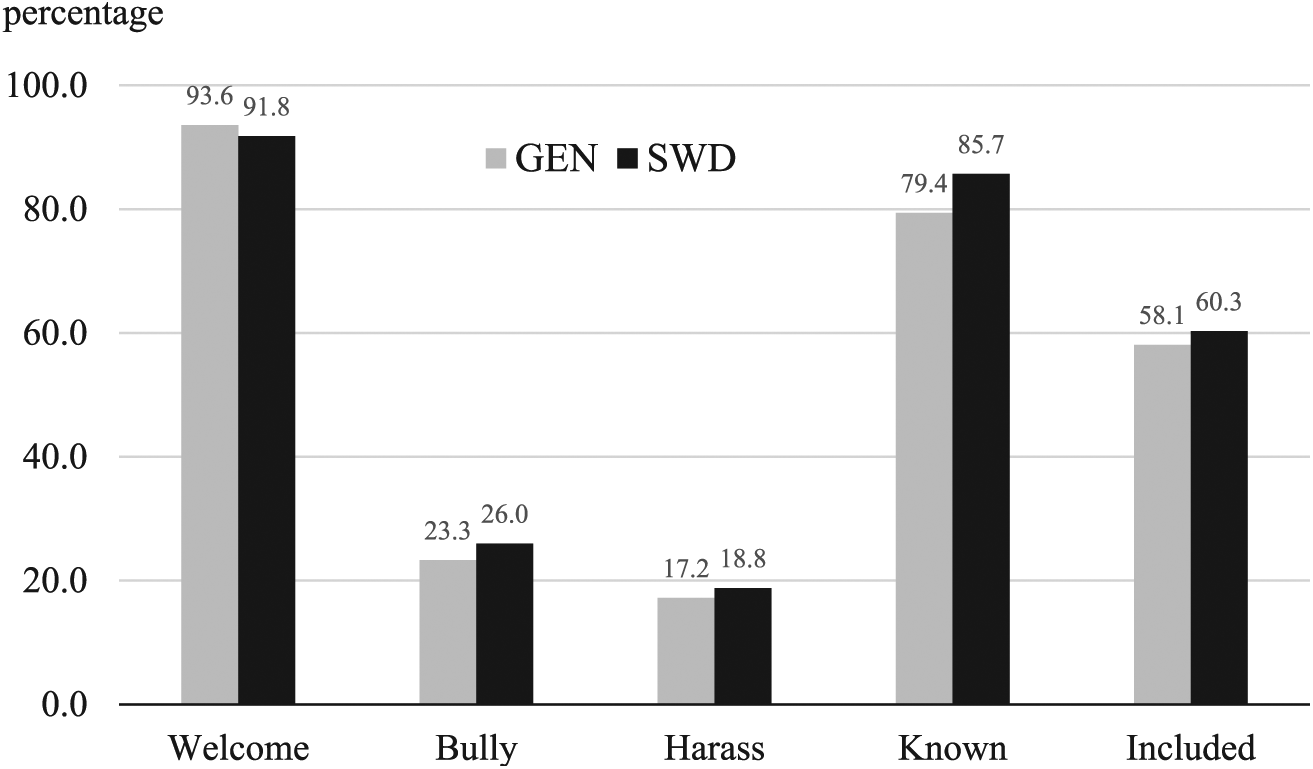
Do students with disabilities (SWDs) feel differently from students not receiving special education services (GENs)? Baseline average responses
To further address Question 1, we next make adjustments to estimate the gap between SWD and GEN feelings of inclusion. From here on, we report only the size of the gap, having shown the absolute magnitudes in Figure 1. We incorporate controls for student characteristics and school by year effects. Figure 2 presents the estimated δ, the SWD-GEN difference. Again, all differences represented by all bars are statistically significant. The grey bars show results from Figure 1 but as gaps, for comparison (Model 1). The black bars show results for Model 2, with student characteristics and school by year effects included. The modest SWD-GEN disparity persists, with the gaps somewhat attenuated. For example, now SWDs are 2.1 ppts more likely than GENs to report bullying and 3.8 ppts more likely to feel they are known.
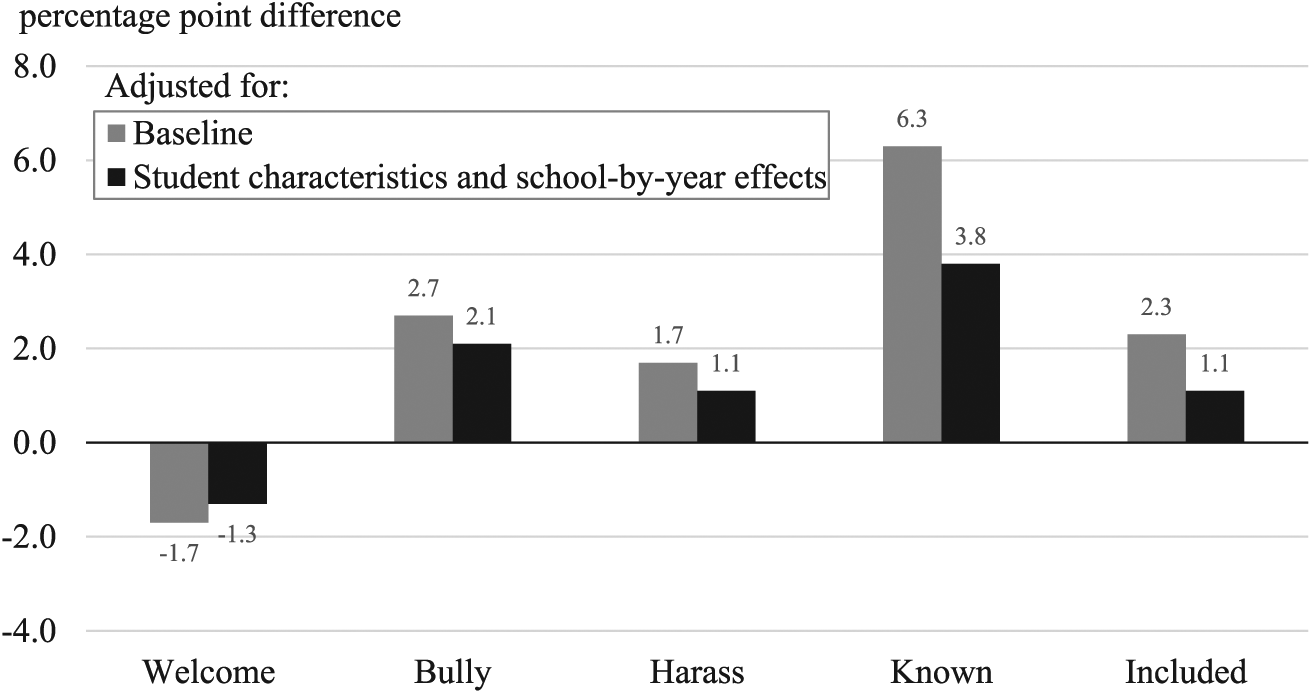
Are differences driven by student and school by year characteristics?
Question 2 asks if SWD perceptions are heterogeneous, differing by major disability. Results are presented in Figure 3, which disaggregates SWDs into five major classifications, still including student characteristics and school by year effects (Model 3). There is heterogeneity across SWDs with different disability classifications. Except for Known, students with EDs and OHs feel least included, with the largest (but still modest) gaps across all classifications of SWDs in Included. For example, the ED-GEN gap is 3.9 ppts in Welcome and a 4.2 ppt gap in Included. Gaps for students with LDs and SIs are a little less consistent than for students with EDs and OHs; while there is a negative gap with GENs for Welcome, Bully, and Harass for included, students with LDs and SIs feel more included than GENs. As for all classifications, students with LDs and SIs feel more known than GENs. Finally, students in the LI disability group feel more included than other SWDs. The gap with GENs shows more positive or similar feelings in all cases except Harass, which is negative but only significant at the 10% level. Thus, feelings of inclusion vary in both intensity and consistency across SWDs with different disability conditions. Overall, students with EDs and OHs most consistently feel somewhat less included.
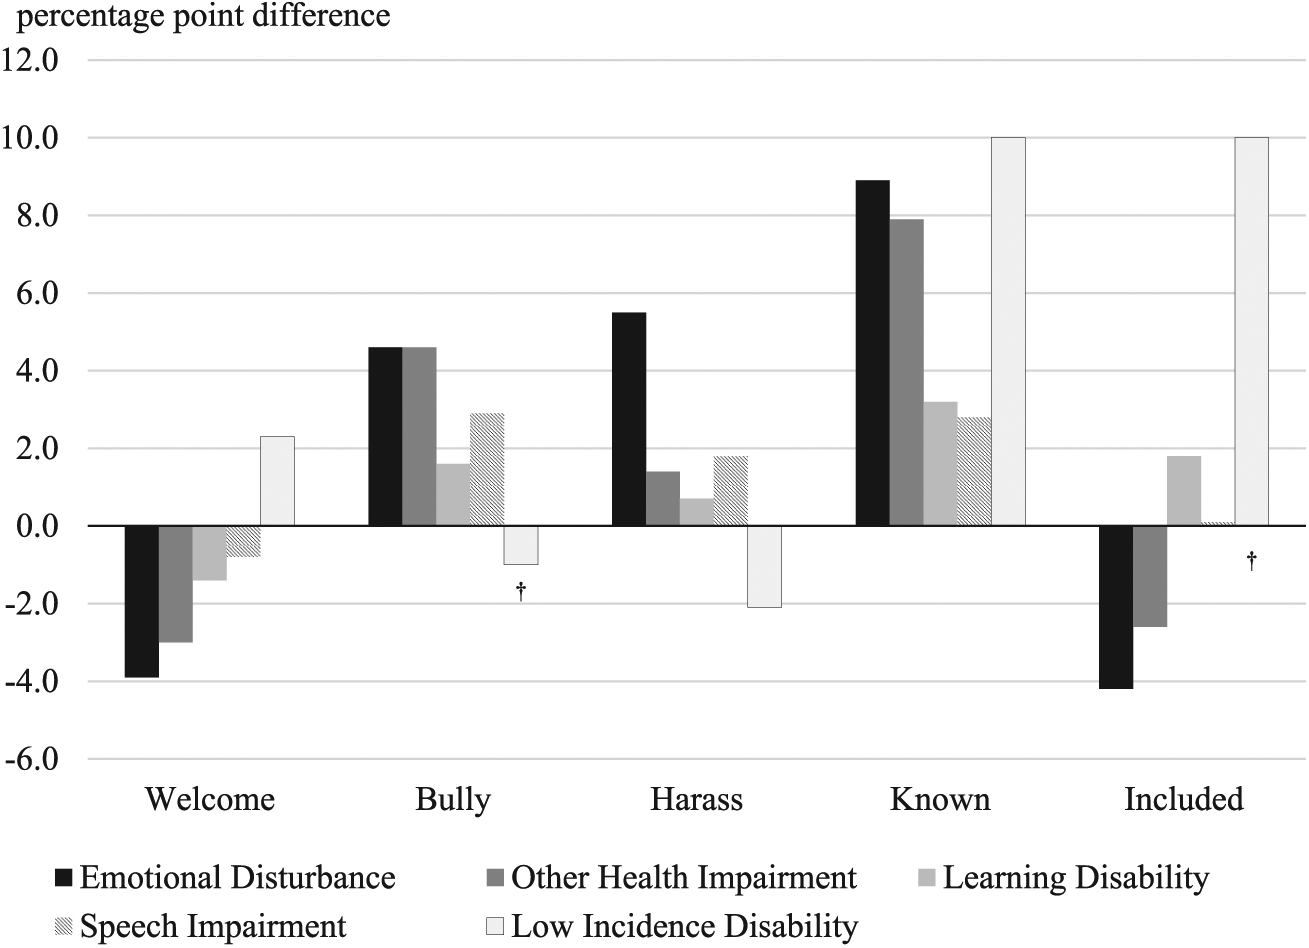
Heterogeneity in SWD-GEN differences by disability classification
The Role of Assigned Service
Question 3 asks if there are differences in feelings of inclusion by assigned service. Table 3 presents results; the reference group is GENs. All models include student characteristics and grade and school by year fixed effects.
Disparities by Disability and Assigned Service
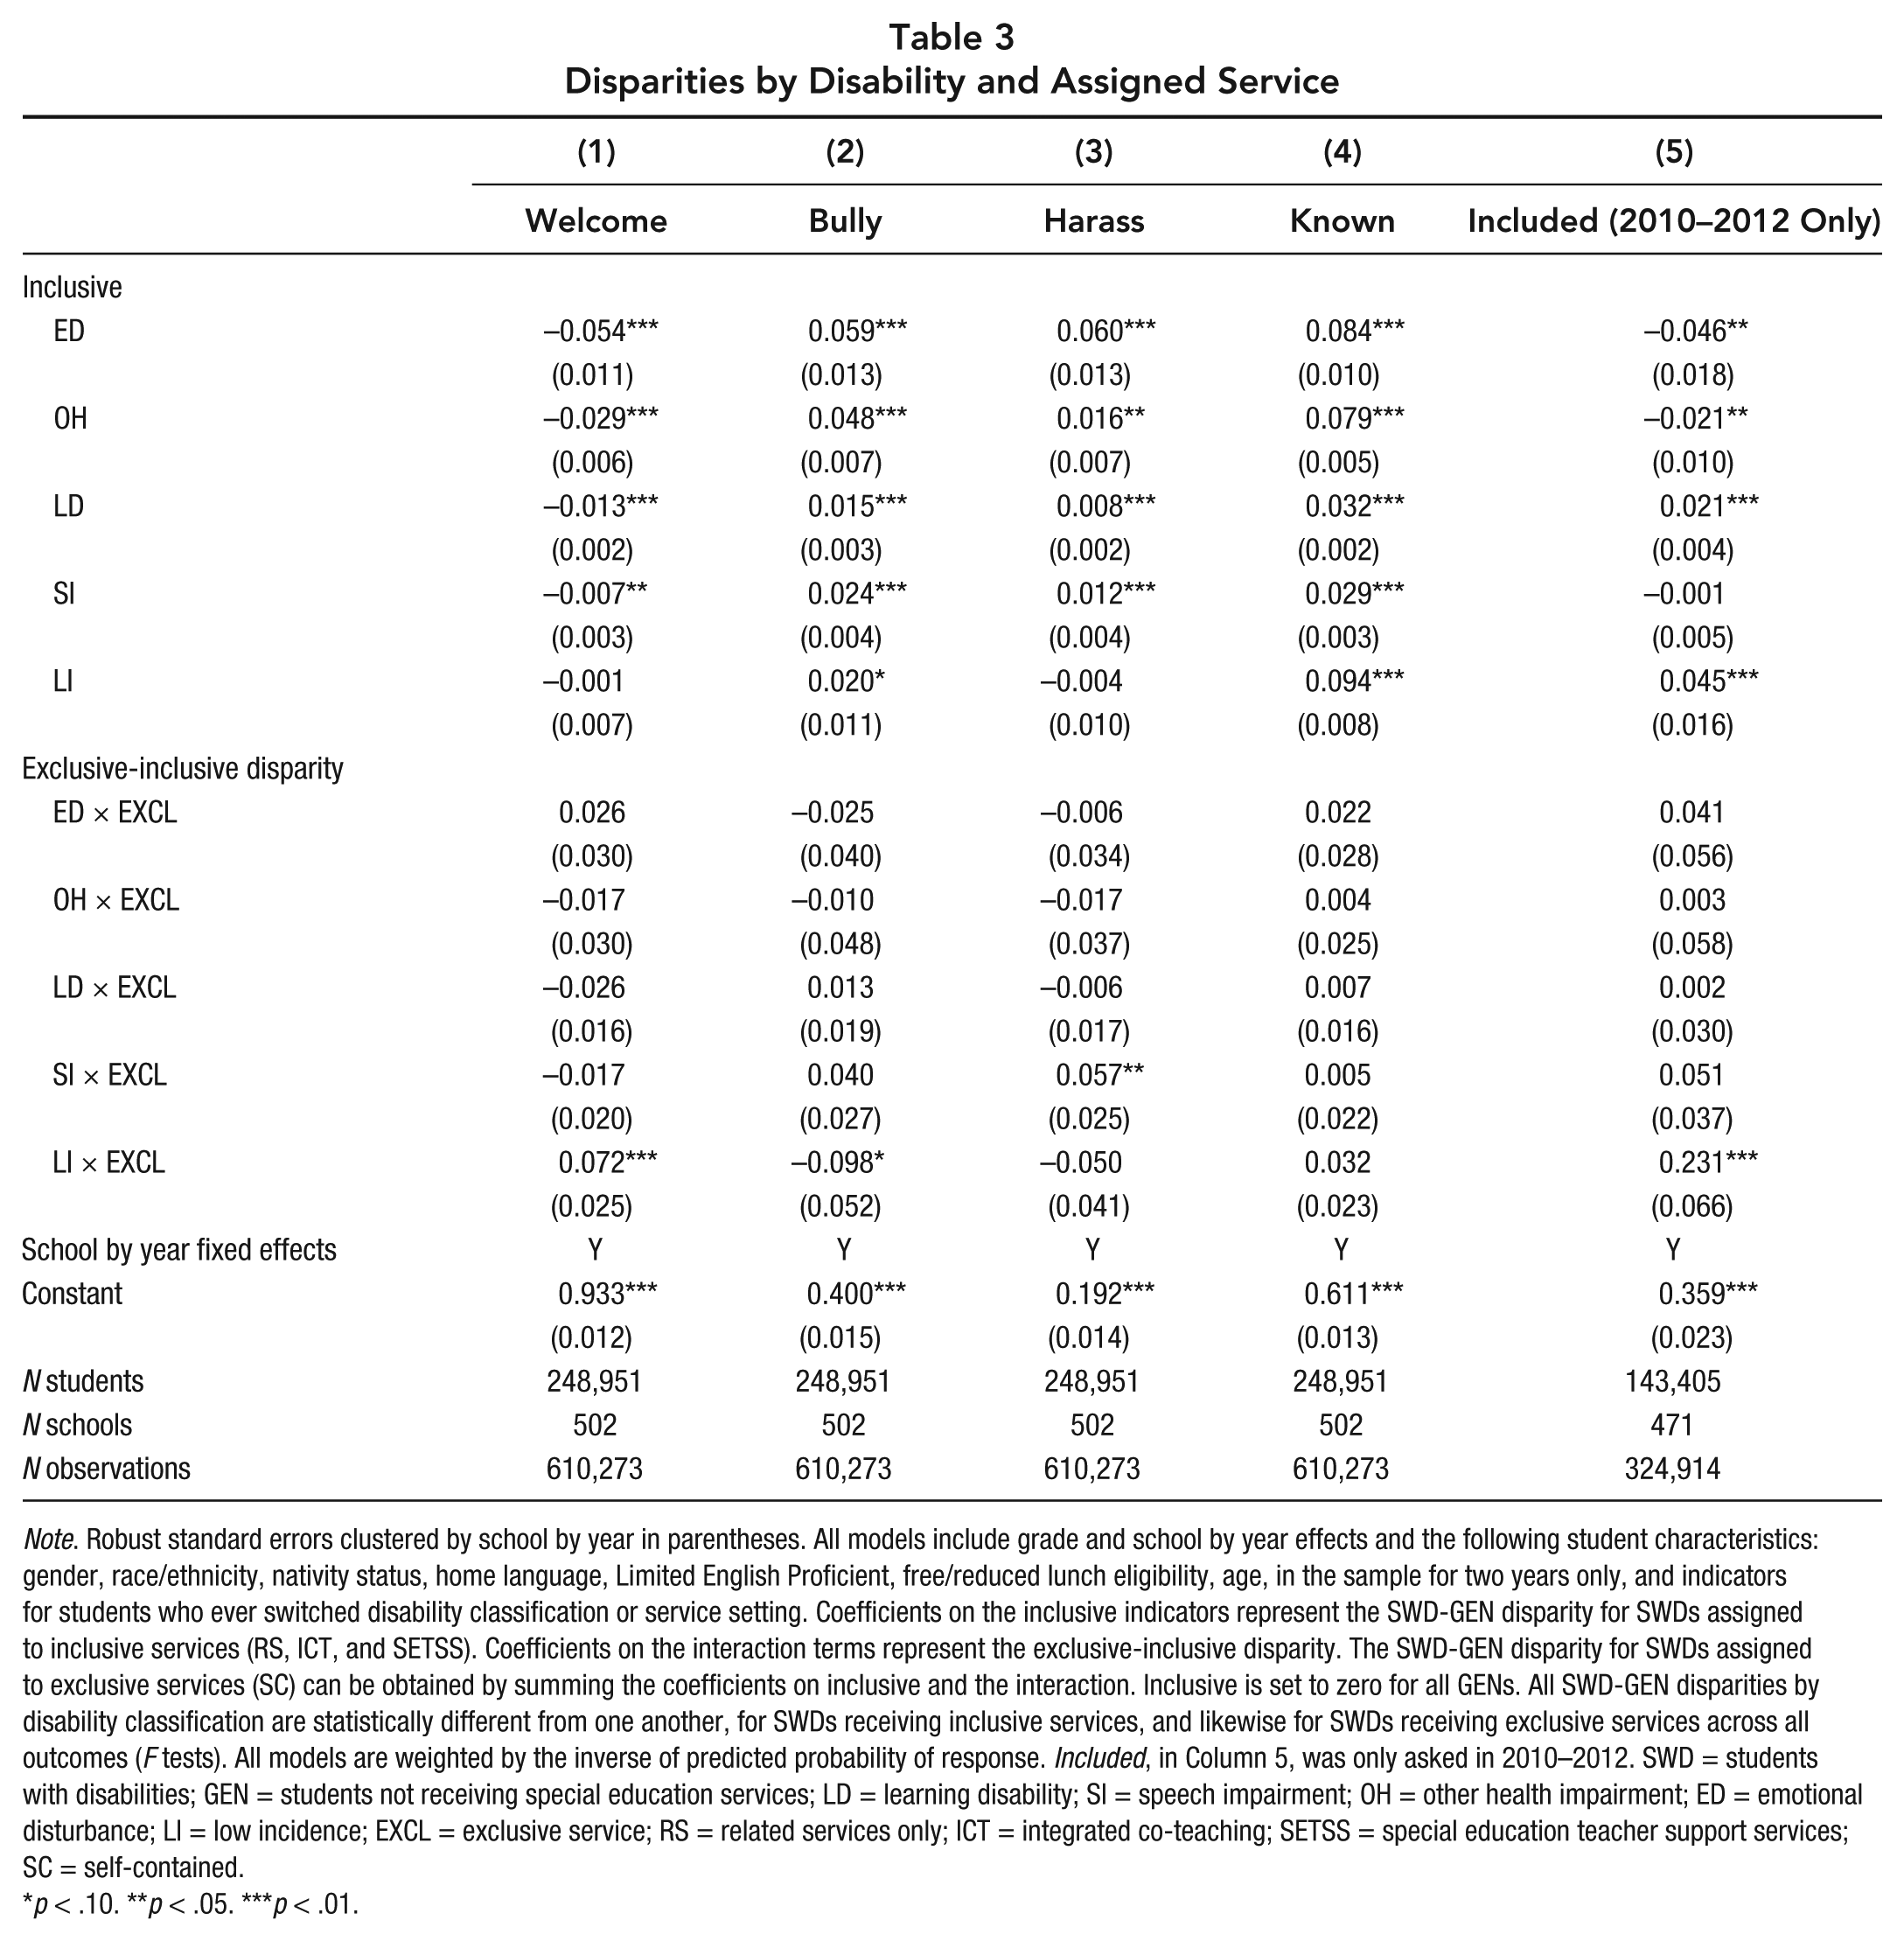
Note. Robust standard errors clustered by school by year in parentheses. All models include grade and school by year effects and the following student characteristics: gender, race/ethnicity, nativity status, home language, Limited English Proficient, free/reduced lunch eligibility, age, in the sample for two years only, and indicators for students who ever switched disability classification or service setting. Coefficients on the inclusive indicators represent the SWD-GEN disparity for SWDs assigned to inclusive services (RS, ICT, and SETSS). Coefficients on the interaction terms represent the exclusive-inclusive disparity. The SWD-GEN disparity for SWDs assigned to exclusive services (SC) can be obtained by summing the coefficients on inclusive and the interaction. Inclusive is set to zero for all GENs. All SWD-GEN disparities by disability classification are statistically different from one another, for SWDs receiving inclusive services, and likewise for SWDs receiving exclusive services across all outcomes (F tests). All models are weighted by the inverse of predicted probability of response. Included, in Column 5, was only asked in 2010–2012. SWD = students with disabilities; GEN = students not receiving special education services; LD = learning disability; SI = speech impairment; OH = other health impairment; ED = emotional disturbance; LI = low incidence; EXCL = exclusive service; RS = related services only; ICT = integrated co-teaching; SETSS = special education teacher support services; SC = self-contained.
p < .10. **p < .05. ***p < .01.
The coefficients on EXCL variables, which capture differences between feelings of inclusion among students assigned exclusive compared to inclusive services, are largely insignificant—that is, there are few differences between students in exclusive and inclusive services. Recall that most students in the traditional schools in this study are assigned to inclusive services, so the sample assigned to exclusive services is not large. Only for students in the LI group is there some indication of differences, and these students feel more included (more welcome, less bullying, and more known) compared to GENs when served with exclusive compared to inclusive services.
The Role of Academic Achievement
Question 4 asks to what extent the results are driven by differences in students’ academic achievement. Results are presented in Table 4. For students in the ED, OH, and LI groups, there are essentially no differences when proficiency levels based on test scores are added to the model. For students with LDs and SIs, some coefficients are no longer statistically significant, although all signs are the same, and thus controlling for performance seems to affect them somewhat. In general, from Tables 3 and 4, the most consistent SWD-GEN disparities across all five outcomes arise among students with EDs, OHs, and LIs. These results for students with EDs are consistent with prior research, which has shown that students with EDs are among the most challenging to incorporate into more inclusive settings (MacMillan, Greshman, & Fornes, 1996).
Does Academic Performance Matter?
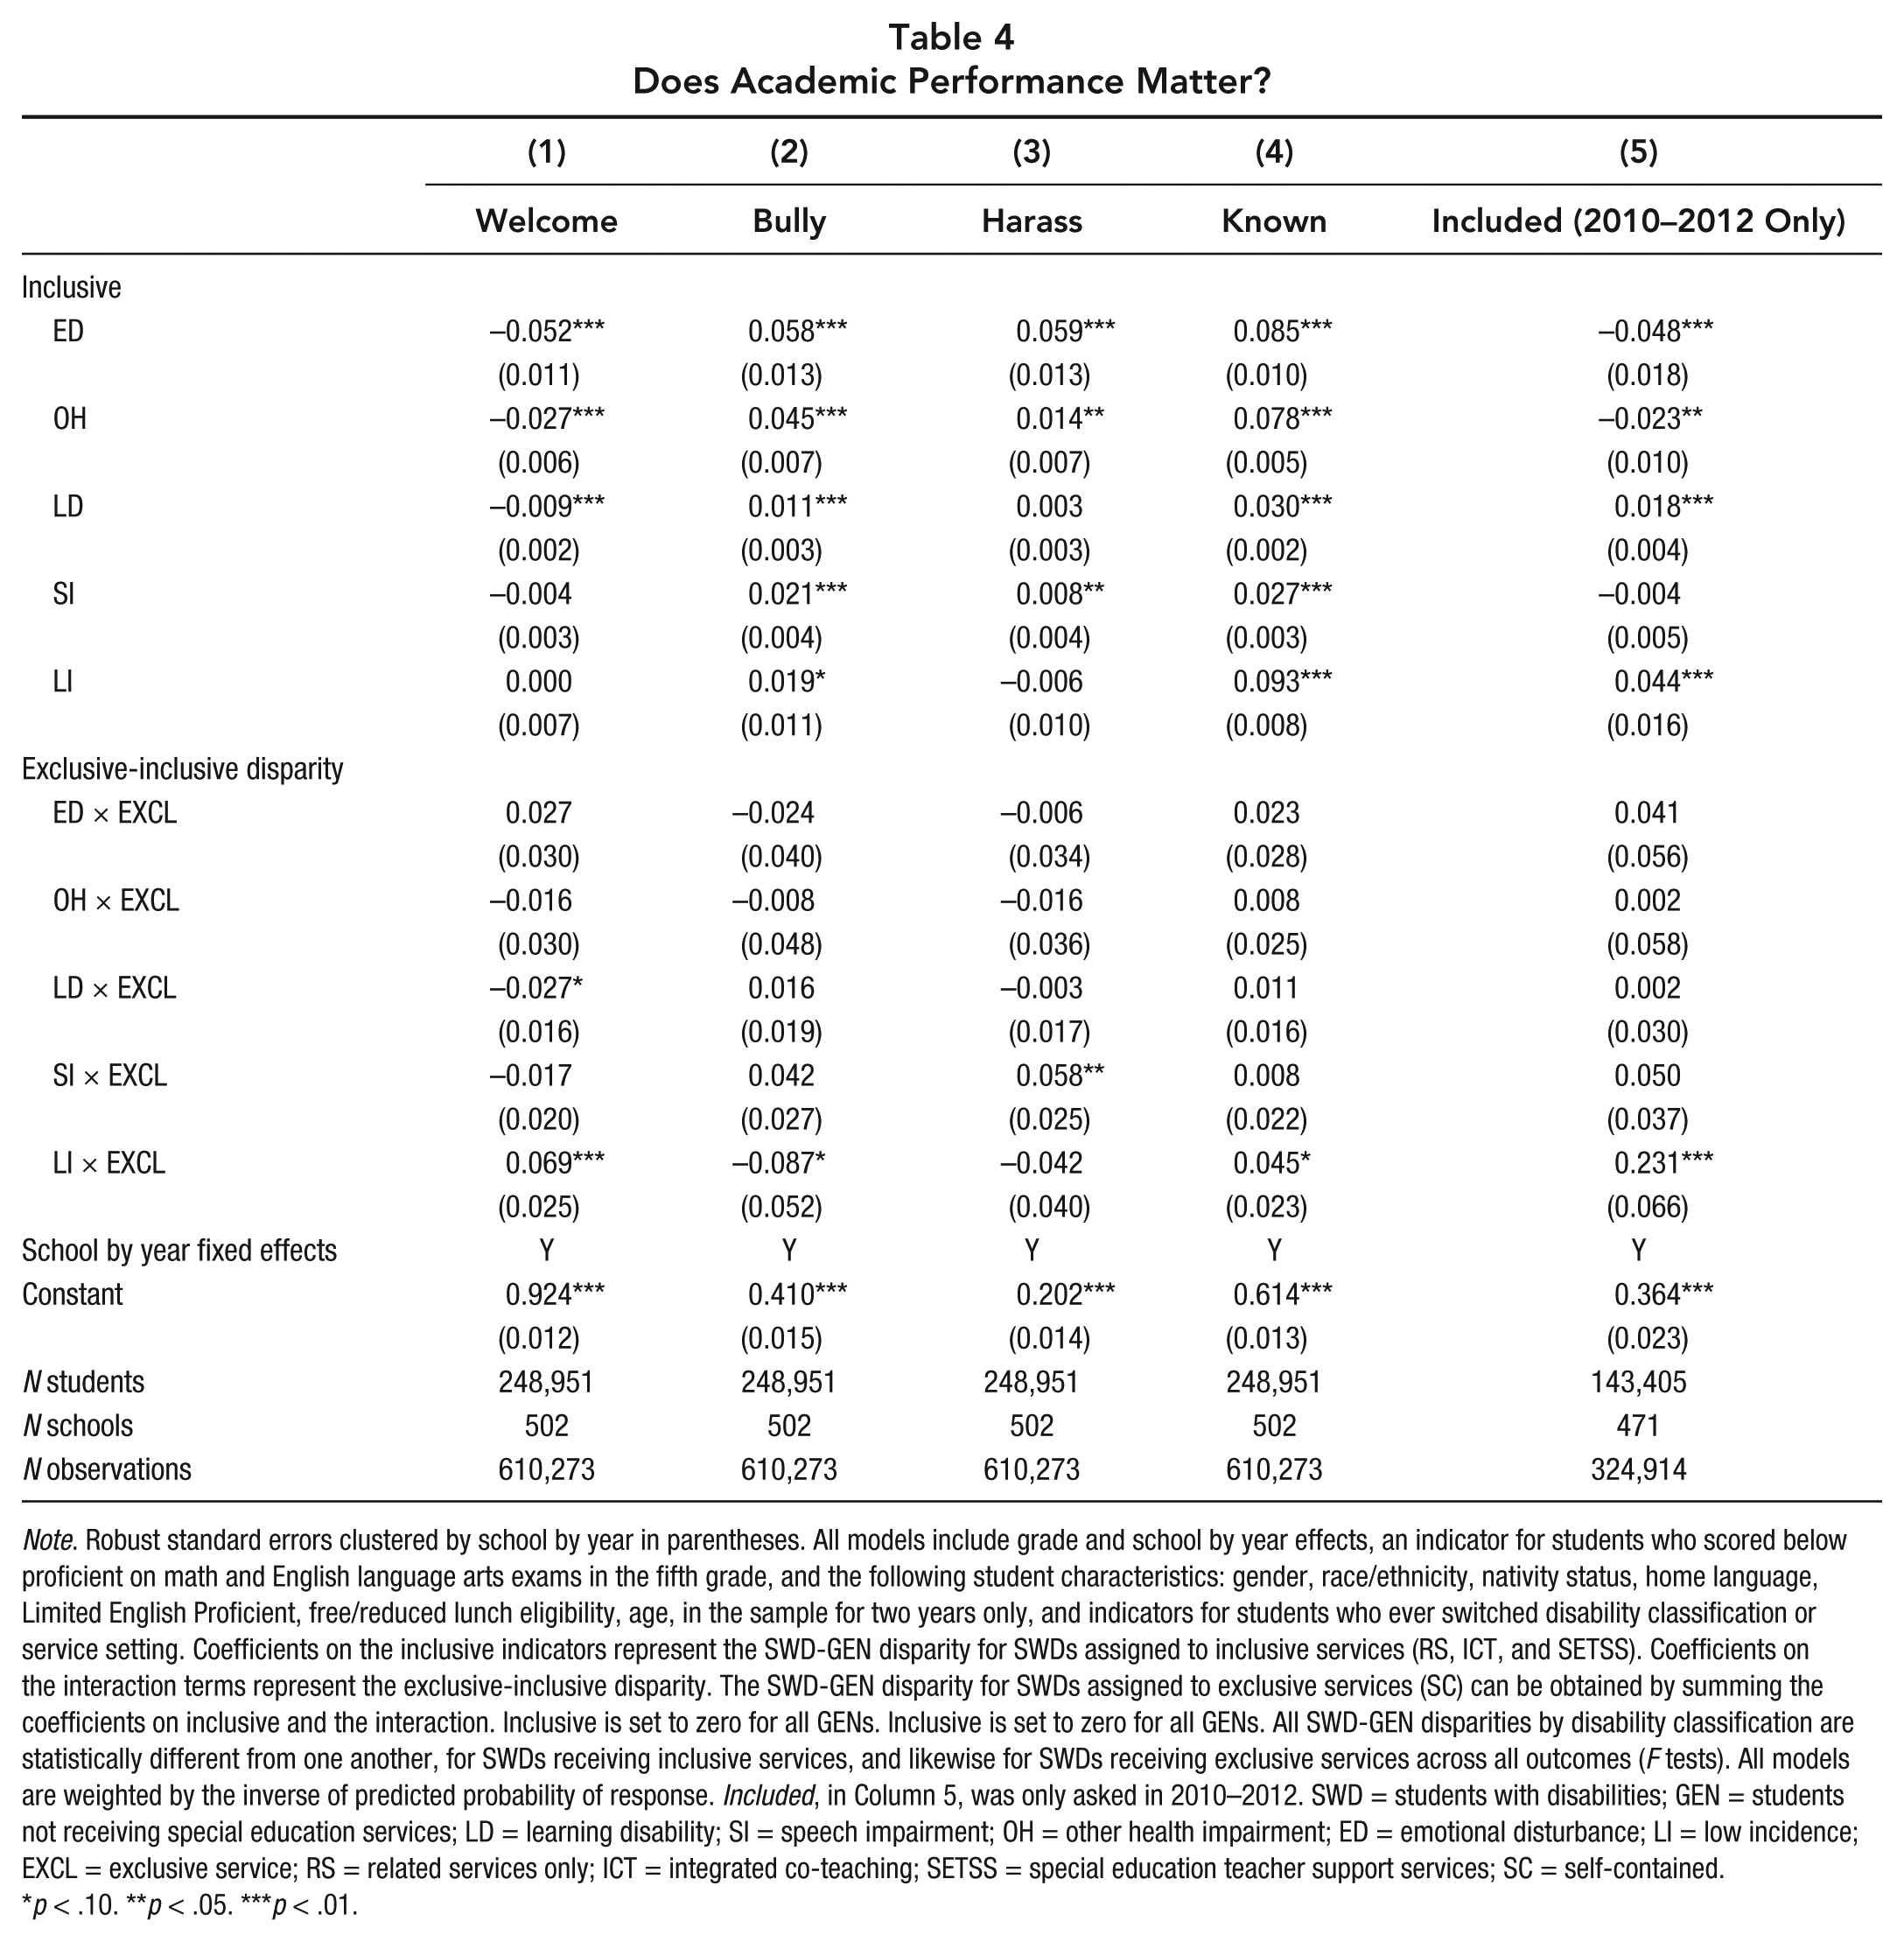
Note. Robust standard errors clustered by school by year in parentheses. All models include grade and school by year effects, an indicator for students who scored below proficient on math and English language arts exams in the fifth grade, and the following student characteristics: gender, race/ethnicity, nativity status, home language, Limited English Proficient, free/reduced lunch eligibility, age, in the sample for two years only, and indicators for students who ever switched disability classification or service setting. Coefficients on the inclusive indicators represent the SWD-GEN disparity for SWDs assigned to inclusive services (RS, ICT, and SETSS). Coefficients on the interaction terms represent the exclusive-inclusive disparity. The SWD-GEN disparity for SWDs assigned to exclusive services (SC) can be obtained by summing the coefficients on inclusive and the interaction. Inclusive is set to zero for all GENs. Inclusive is set to zero for all GENs. All SWD-GEN disparities by disability classification are statistically different from one another, for SWDs receiving inclusive services, and likewise for SWDs receiving exclusive services across all outcomes (F tests). All models are weighted by the inverse of predicted probability of response. Included, in Column 5, was only asked in 2010–2012. SWD = students with disabilities; GEN = students not receiving special education services; LD = learning disability; SI = speech impairment; OH = other health impairment; ED = emotional disturbance; LI = low incidence; EXCL = exclusive service; RS = related services only; ICT = integrated co-teaching; SETSS = special education teacher support services; SC = self-contained.
p < .10. **p < .05. ***p < .01.
Discussion
In this study, we examine how feelings of inclusion differ for SWDs and GENs in traditional schools. This is a critical issue to address for several key reasons. First, little research has focused on inclusion for both SWDs and GENs. Our study looks at responses of both groups to questions about feelings of being included. Second, most research has focused on inclusion and academic outcomes while our study goes beyond testing. Finally, little research examines differences by disability within a single study on inclusion (for an exception, see Gottfried, 2014); we are the first to examine feeling included by disability and by service, made possible by NYC’s unique, large administrative data set with rich detail on disability and service.
We derive several key insights. First, among students attending traditional schools, SWDs as a whole feel only slightly less included with classmates (Welcome, Bully, Harass) compared to GENs but somewhat more included with teachers and in school activities (Known, Included). These may reflect educators’ particular efforts to address the education needs of SWDs and draw them into school activities. Sharing classes with GEN peers, however, might make SWDs feel singled out among classmates. This could occur because SWDs receive different services compared to GENs (e.g., having another teacher in the classroom or receiving pull-out services), or this may arise due to observable differences, such as physical impairments, compared to GEN classmates. Together, our results suggest that SWDs in general feel only modestly less included with their classmates but are somewhat more likely to report favorable feelings with regard to teachers, especially feeling known.
Second, our findings regarding feelings about classmates correspond with prior research, which has found that SWDs often have poorer peer relationships compared to GENs (Biordi & Nicholson, 2012; Pearl et al., 1998). Our study demonstrates this in findings related to the modest gaps in Welcome, Bully, and Harass as described previously. Thus, it suggests schools and policymakers would do well to understand how inclusive activities that bring students with individual differences together might at the same time differentially affect feeling included at school versus feeling included with peers. The distinction of what it means to feel included (and with whom) becomes important. Since disparities are small, attention to these differences could result in rapid improvements.
The third finding provides insights into mechanisms that might drive our results. The analysis by disability group suggests that some of the strongest and most consistent relationships arise for students with an ED. These students have some of the greatest needs when included with GENs (MacMillan et al., 1996). While the results here do not directly support or dispute that claim, we find that students with EDs feel among the least included of all SWDs and suggests a previously undocumented source of risk for this group. Most notably, except for students in the OH category, students with EDs compose the only group that is somewhat less likely to report being included in school activities when in traditional schools. Thus, in considering the previously established challenges with regards to including students with EDs (e.g., disruptive behaviors, academic disengagement), additional challenges might arise in connection with feeling included. 8 Given this newly surfaced source of risk faced by students with EDs, we call attention to support systems that might be best suited to improve feelings of inclusion specific to this group. For instance, Gottfried and Harven (2015) found that peer composition was critical for classrooms with EDs when it came to improving testing outcomes, and perhaps consideration of classroom assignment is a mechanism to boost feelings of inclusion for this especially vulnerable group of students. Additional supports might include expanding the role of school counselors, shown to improve student behaviors (Carrell & Hoekstra, 2014; Reback, 2010) and could foster the development of feeling included as well. These are just several of numerous ways for schools to improve outcomes for students with ED vis-à-vis feeling included.
Fourth, within traditional schools, we do not find differences in feelings of inclusion between students assigned exclusive and inclusive services. This is important for at least two reasons. First, it indicates that traditional schools need to pay attention to feelings of SWDs across all services and not simply students receiving the most or least inclusive services. Second, with the exception of students with LIs, it indicates that differences in exclusive and inclusive services may not affect feelings of inclusion. These latter findings, however, need to be tempered by the descriptive nature of the study and the small proportion of students assigned exclusive services. Our design does not yield causal predictions of what would happen if significantly more students were assigned inclusive (or exclusive) services, and importantly, we cannot say what outcomes would result if more students were educated in traditional schools instead of exclusive schools.
Finally, while the small negative disparities between SWDs and GENs uncovered in this study present some challenges for traditional schools, the size of the gaps are not so large as to discourage productive action. 9
Limitations
There are several limitations that should spark further research in this area. First, the survey used for this study does not distinguish feelings of inclusion in specific academic subjects. Future research might consider a follow-up survey in a single school site (or perhaps focus groups using qualitative inquiry) to test whether feeling included differs across academic subjects. Second, while we believe that our findings have implications for the nation, our study relied on data from one district and focused on middle school, so additional work exploring generalizability to other contexts is warranted. Although NYC is the largest district in the United States, findings in other districts could differ, so it is important to replicate this work in other districts. Additionally, while we focused on middle school, a critical time in young adolescence for the development of feelings of inclusion, future research might examine other critical periods in the education pipeline, such as the extent to which children with disabilities feel included when transitioning into kindergarten or how high school students feel about inclusion at the point in high school when dropout becomes a risk. Finally, this study does not address the academic performance of SWDs in traditional schools, a complex topic that we hope these analyses will inform in the future.
Conclusion
There are several concluding implications of our study. To begin, it demonstrates the value of exploring administrative data in conjunction with survey data. Prior research in special education has often been limited to using administrative data (on students and classrooms but lacking detail on nonacademic facets) or national data sets (rich in contextual data but lacking a census of students). Our findings extend the examination in both dimensions—we describe nonacademic outcomes for traditional schools in an entire district, including both SWDs and GENs.
Our findings also suggest that perceptions of the school environment have the potential to be responsive to policy changes. For example, this study suggests that teachers and programs might help SWDs feel somewhat more included than do peers. Understanding these mechanisms better will be important moving forward as special education policy continues to implement reforms.
Finally, much of prior research has treated SWDs as a single aggregate category. There is richness in the diversity of this group of students, however, and ensuring that we address the needs of students within this population becomes obscured when considering the group in the aggregate. Furthermore, we examine these outcomes not only by disability grouping but also assigned service. This refined level of detail provides insights to schools and policymakers about the imperative to address the needs of SWDs no matter what their service. Understanding patterns at this level will enable multiple layers of stakeholders to implement better practices and develop supportive and diverse learning environments.
In summary, middle school is both a critical time period for education attainment as well as an important life course stage for identity formation and social development (Williams & Downing, 1998). Our focus on disparities in feelings of inclusion can support education practitioners in their efforts to identify areas that require attention to address the needs of all youth during this important life point.
Footnotes
Appendix
This appendix provides additional detail on the analytical sample used in the paper, how we address survey nonresponse, and robustness checks.