
Abstract
This paper derives efficiency scores for around 8,500 schools in 30 countries, using Programme for International Student Assessment 2012 data and a nonparametric approach called data envelopment analysis as method. On average, achievement scores of schools can be increased by 27%, holding inputs constant. Efficiency scores vary considerably both between and within countries; the role of managerial efficiency and structural differences due to operating in different contexts (countries) is disentangled. Subsequently, a number of school-level factors are found to be correlated with efficiency scores and indicate potential directions for improving educational results. Heterogeneity of such characteristics across countries and along the distribution of efficiency is explored.
Keywords
Analyzing the efficiency of educational systems and organizations is today at the forefront of the institutional and academic debate. There are various reasons to care about using resources more efficiently: the reduction of public budgets, the competition of other welfare services for limited public expenditures, higher (demand for) transparency in information about the costs and results of schools’ activities. A growing number of stakeholders pay attention to the effectiveness of educational activities (i.e., generating good results in terms of cognitive and noncognitive skills of the students); nonetheless, many observers complain that pursuing these objectives must consider the efficiency issue, which is obtaining good outputs while typically containing or even reducing the necessary resources.
The research challenge of measuring schools’ performances and efficiency has been typically undertaken through within-country comparisons of schools’ results. The reason for a single-country focus are multiple; principal among them are the necessity of controlling for structural differences in institutional settings as well as the difficulty in collecting comparable data of schools operating in different countries. Therefore, the development of programs for measuring the achievement of students through standardized tests in several countries opens today new doors for extending research into an international perspective, as well. Indeed, a well-developed, relatively recent stream of the literature uses a microeconomic setting for estimating international educational production functions, in which several characteristics of students, schools, and countries’ educational systems are included as inputs for explaining standardized tests as outputs (see early work by Wößmann, 2003, 2007, and the wide discussion in Hanushek & Wößmann, 2010). This research investigates how these inputs are statistically related with outputs but does not analyze the efficiency intended in its technical sense, that is, the ability of educational institutions to transform inputs (resources) into outputs (achievement).
The present paper compares the efficiency scores of about 8,500 schools in 30 countries, using Programme for International Student Assessment (PISA) 2012 test scores as outputs. The research questions can be summarized as follows: (a) How relevant are the differences in the efficiency of schools in the selected 30 countries? (b) Which factors are associated with schools’ efficiency scores?
This research is innovative for two main reasons. First, it illustrates the efficiency of schools in an international setting; although a unique previous attempt in this direction dates back to PISA 2003 (Sutherland, Price, & Gonand, 2009; see also literature review in the next section), the results included here provide an updated picture of the frontier of efficient schools in 30 economically developed countries. Second, we investigate whether the school factors associated with efficiency scores are similar or structurally different across countries and if differences in efficiency are more relevant between or within countries; this is very important to understand for designing national-level or international policies and incentives. For instance, various countries may decide to adopt practices that turn out to be beneficial for efficiency, or they might discourage the adoption of initiatives that have been proven to be associated with lower efficiency in different educational systems.
In answering these questions, the definition of efficiency adopted is a “technical” one, meaning that a school is efficient if it is able to maximize the output level (test scores) for a given level of available input (human and financial resources). We are aware that this definition ignores an important area of outputs, namely, the stimulation of noncognitive, socioemotional skills—and future research must include indicators for these dimensions in efficiency analyses. 1
The paper is organized as follows. The next section describes the data and is followed by one that presents the methodology. The section about results comes after, and it contains four separate paragraphs, each with its own discussion of main findings. Concluding remarks are in the last section.
Exemplary Literature
The literature about educational efficiency in international settings has generated two parallel streams. In the first one, there are some studies that use country-average data for comparing the efficiency of public spending in education. Clements (2002) used a simple setting where two inputs are indicated as proxies for human and financial resources as inputs (student-teacher ratio and expenditure per student, respectively), and TIMSS (Trends in International Mathematics and Science Study) scores are outputs. Efficiency scores are obtained through a basic technique called FDH (free disposable hull) and suggest that some countries can achieve their present levels of achievement scores with 25% fewer resources. Similarly, Afonso and St. Aubyn (2006) consider a country’s PISA score as output and some measures of resources (i.e., time spent at school and student-teacher ratio) as inputs. The empirical results of a two-stages data envelopment analysis (hereafter, DEA) conducted on 25 countries reveal that efficiency of public spending on education (authors claim that countries can expand the results by 11.6% using the same resources) is related to a country’s stock of human capital (measured by attainment of adult population) and wealth (as measures by gross domestic product per capita). Giménez, Prior, and Thieme (2007) utilize one similar nonparametric model (DEA) but add measures of students’ socioeconomic background as inputs. Again, the results help to identify individual countries whose average test score should be higher when available inputs are considered. Agasisti (2014) innovates the state of the art by extending the empirical analysis to two subsequent periods (instead of a single year), considering PISA 2006 and 2009 scores as outputs, and student-teacher ratio and expenditure per student as inputs. Not only were DEA efficiency (of spending) scores derived (they estimate 10% of inefficiency, on average), but also a Malmquist index was computed to analyze whether efficiency gains occurred or not and if they were driven by pure efficiency or by technology (frontier shifts). The analysis was limited to the European countries, and it concluded that “no efficiency gains have been reaped overall in the Euro area. Indeed, despite a slight improvement in the efficiency of public spending, a general worsening of the efficient frontier neutralised such gain” (Agasisti, 2014, p. 12).
However, the studies listed above do not analyze how schools should be organized or resourced for the purpose of improving educational efficiency; this line of research is still in its infancy. To the best of our knowledge, only Sutherland et al. (2009) use international data for measuring efficiency at the school level. 2 Their research comprises the 30 Organisation for Economic Co-operation and Development (OECD) countries and is based on PISA 2003 as outputs (test scores); student-teacher ratios and school-average ESCS (an index for the economic, social, and cultural status) are used as inputs. The results demonstrate that inefficiency is indeed affecting educational production for schools in several countries, although it is more relevant in some of them (for instance, Norway, Greece, and United States) and less in others (for instance, Korea and Japan). The discussion claims that differences in school efficiency also exist within countries, albeit these are quite limited in general (around 10% of output expansion), and input savings are substantial (i.e., >15%) only in Italy, Greece, and Belgium. An econometric model about the determinants of inefficiency reveal that “indicators for higher quality teaching resources appear to be correlated with better performances at the school level” (Sutherland et al., 2009, p. 24), and this is especially true for the ability of schools to use fewer resources to obtain a given level of achievement scores. Our paper improves upon the strategy employed by Sutherland et al. in two principal ways: (a) the efficiency scores are derived with a more recent and robust nonparametric technique, based on a bootstrapped version of DEA, and (b) we model more explicitly the factors associated with efficiency, in a clearer approach based on the educational production function at the school level—thus, the analysis of efficiency scores allows us to consider how schools operate to get higher scores.
None of the studies listed above investigate the causal link between certain schools’ features and their efficiency, as our paper does not—and, in general, this lack of studies dealing with causality in efficiency setting is a gap in the wider literature about the efficiency of educational production (see De Witte & López-Torres, 2015).
Data and the Choice of Variables
The first choice to be made is about the set of countries to be included in the analysis. We opted for the group of countries whose cumulative expenditure per student is above $50,000 PPPs (purchasing power parity), as identified by OECD (2013b). The OECD opted for this operational criterion for differentiating between two groups of countries: the “low-spending” ones, where a correlation between spending and test scores (at country level) is detectable, and the “high-spending” countries, for which no clear pattern in the relationship between resources and academic results emerges at country level of analysis. The latter are 30 countries, specifically, all the OECD countries with the exclusion of Chile, Greece, Hungary, Mexico, and Turkey and the inclusion of Singapore. The data set used for this paper is PISA 2012, where data from student and principal questionnaires (with student- and school-level information, respectively) were merged. The selection of inputs and outputs followed the well-established literature about schools’ efficiency (see De Witte & López-Torres, 2015) and was constrained by data availability. As a general principle, we consider efficiency in a microeconomic perspective as the ability of transforming the inputs into outputs at the best ratio possible, given the existent production technology. In the case of educational settings (Levin, 1974), we would consider as inputs the human and financial resources available for schools (teachers and other staff, current and capital expenditures used for buying facilities and teaching materials), together with the initial human capital of students involved in the educational process; and the outputs produced are knowledge and skills, measured through indicators of school success and scores obtained in tests for cognitive and noncognitive skills. Unfortunately, PISA does not contain complete and comparable direct measures for the inputs defined above, so we used some variables of the data set as proxies for the underlying economic and educational phenomena of interest. More specifically, the indicators included in the efficiency analyses proposed in this paper are as follows (I and O denote inputs and outputs, respectively):
ESCS (I1), which is an indicator—computed by OECD—about the economic, social and cultural status, for controlling for the quality of students’ background. It includes several dimensions in its computation, namely, parents’ occupation and education as well as home possessions. It is built to be internationally comparable, and it has been constrained to have a mean of 0 and a standard deviation of 1.
StRatio (I2), the (inverse of) student-teacher ratio. This indicator is a measure of the quantity of human resources employed by each school.
Computer_n (I3), the number of computers for each student at school level. It is a proxy for the quantity of material resources (and facilities) available for the school.
pv1math (O1), the average score in mathematics obtained by the school. 3 By construction, plausible values have an international mean of 500 and standard deviation of 100.
pv1read (O2), the measure for test scores in reading.
The selection of these specific indicators within the wider set of variables that are available in PISA 2012 is coherent with the choice made by Sutherland et al. (2009), who worked with previous editions of the PISA data set. Also, we must clarify two other criteria that drove our final selection. First, we intend to keep the efficiency model as simple as possible, so instead of including numerous characteristics of schools among inputs, we tested their relationship with efficiency scores in the second stage of our analysis. Second, we primarily focus on two indicators for overly important aspects of the educational process: human resources and facilities. The two variables that were selected at the end are those that can be more easily modified by decisions made by school managers in many countries.
Schools for which at least one of the indicators that we selected was missing are excluded from the sample; we did not engage with imputation of missing data, with the aim of comparing only schools for which we have complete information about the selected inputs and outputs. Also, we excluded a small group of schools with unreasonable data (i.e., excessively large/small number of computers, students, teachers, etc.). The descriptive statistics for these five variables, referring to the 8,500 schools included in the final sample, are in Table 1. On average, the schools in the sample have a student population with ESCS close to the PISA mean, around 0.75 computers per student, and 10 students per teacher. The average score in mathematics and reading is a bit lower than PISA average, equal to 497 and 496, respectively. However, the differences between countries’ averages are stark, as can be seen by looking at the mean and standard deviation for each variable in each country (see data in Agasisti & Zoido, 2015).
Inputs, Outputs, and Second-Stage Variables: Descriptive Statistics
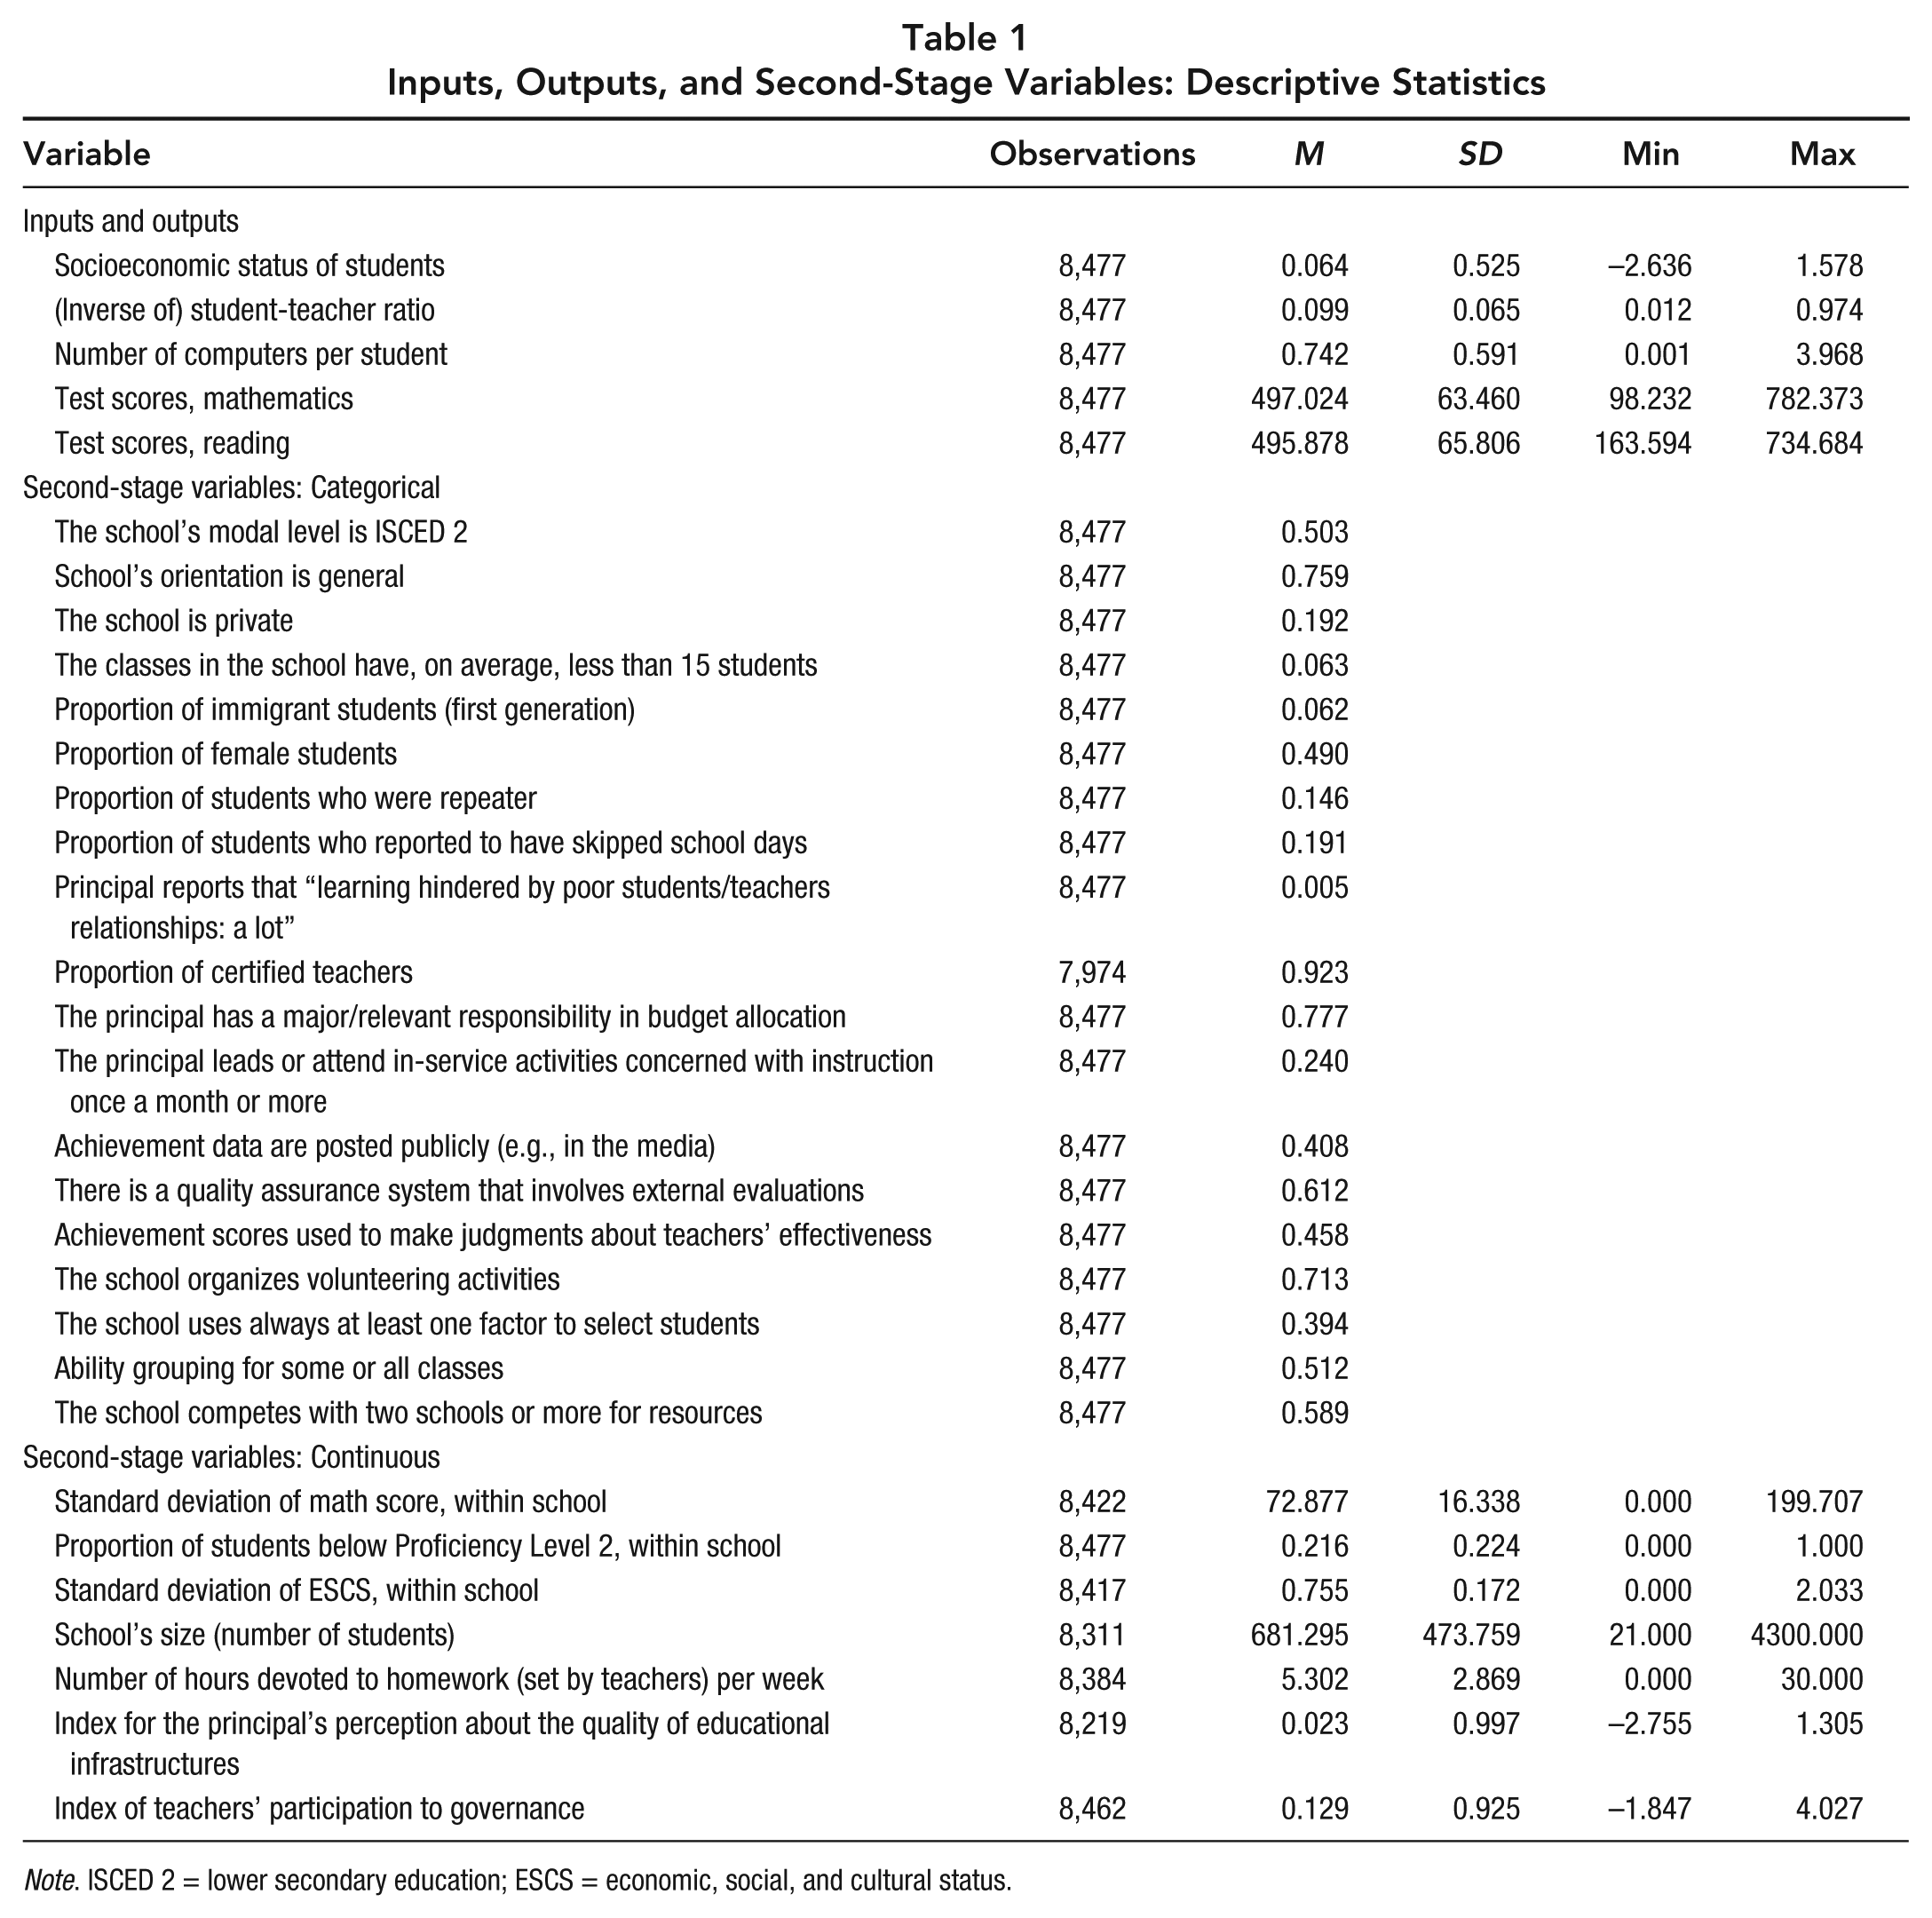
Note. ISCED 2 = lower secondary education; ESCS = economic, social, and cultural status.
Table 2 contains a list of variables that were selected for a second-stage analysis, which focuses on the factors that are statistically associated with efficiency scores, along with a short definition and description 4 ; their descriptive statistics are reported in Table 1. These second-stage variables have been classified into three main groups: students’ characteristics, general characteristics of the schools, and school’s practices and processes. To account for structural differences across countries in the efficiency scores’ distribution and features, we include country-level dummies in the second-stage regression. 5
Second-Stage Variables: Labels and Definitions
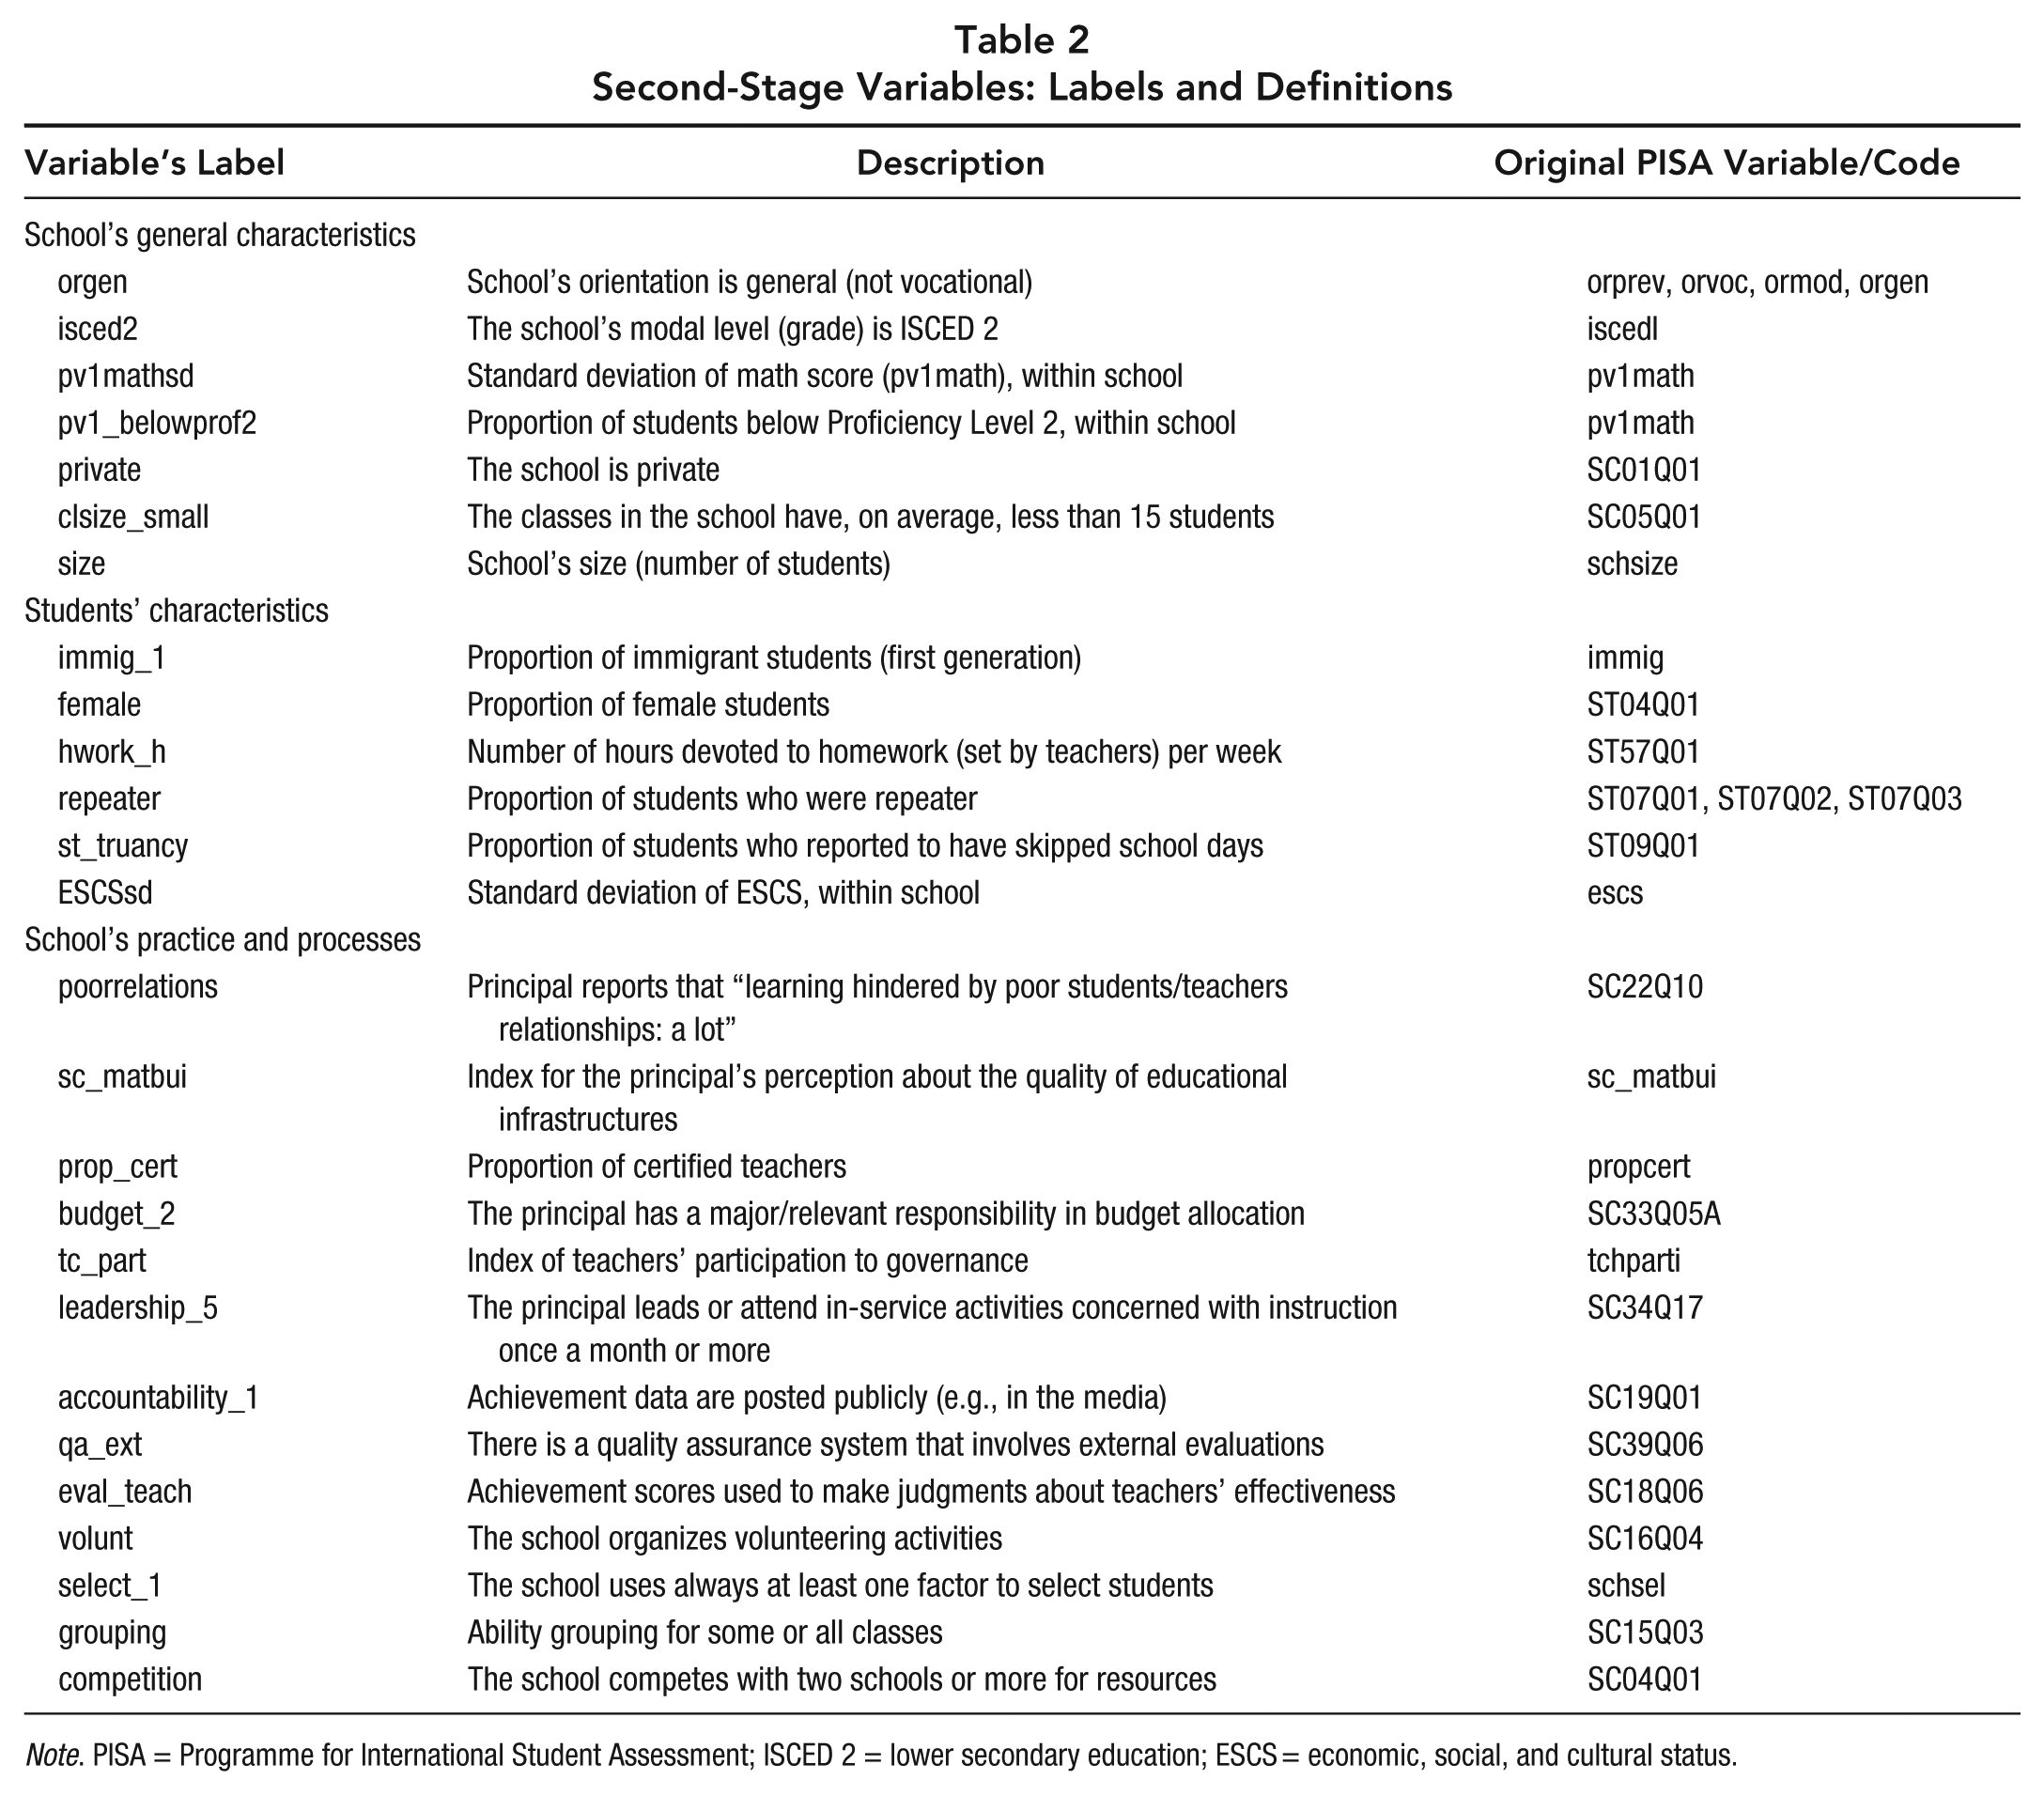
Note. PISA = Programme for International Student Assessment; ISCED 2 = lower secondary education; ESCS = economic, social, and cultural status.
A set of student characteristics investigates whether efficiency is related to the proportion of female students (female), first-generation immigrants (immig_1), repeaters, and students who reported to have skipped school days (st_truancy). In this set of variables, we also considered the number of hours devoted to homework reported by teachers (hwork_h). With the aim of controlling for the diversity of the student population—and to some extent because of the role of other students (peers) who can have an influence on their performance—we computed the standard deviation of ESCS within a school (ESCSsd). All these indicators can be thought of as proxies for additional inputs of the schools; however, for keeping the model of school “(technical) productive process” as simple as possible, we introduce these in the second stage for seeing whether and how they influence the efficiency scores as derived through the baseline specification.
Among the schools’ general characteristics, we inserted a dummy (orgen) to indicate whether the orientation of the school is academic (compared with technical and vocational) and another dummy for schools where the modal grade is ISCED 2 (isced2). A complete set of country fixed effects is used, together with a set of dummies for program types as classified by OECD through the variable progname. One dummy (private) distinguishes between private schools (both state dependent and independent) and public ones. The model includes indicators for school size, as the number of students per school (size), and class size through a dummy that identifies whether the average dimension of classes within a school is lower than 15 (clsize_small). Two indicators are intended to capture dimensions of equity: pv1mathsd measures the standard deviation of test scores within school and can be regarded as an indicator of equality, and pv1_belowprof2 calculates the proportion of students who obtain a score below the Proficiency Level 2, which is indicated by OECD as the baseline level required to participate in modern economic and social life—in this sense, it is a proxy for the concept of inclusion as defined by Schleicher (2014).
Among the set of variables for school’s practices and processes, there are a number of indicators taken from the questionnaire about principal’s perceptions: if learning is felt to be hindered greatly by poor relationships between teachers and students (poorelations), 6 an index that measures his or her opinion about the quality of educational infrastructure at school (sc_matbui), a dummy that indicates whether the principal has a major responsibility in budget allocation (budget_2), an index of teachers’ participation in governance (tc_part), and a variable indicating if the principal exerts instructional leadership by leading or attending meetings with teachers to discuss instructional methods and content (leadership_5). The model also includes dummies to signal whether the school’s achievement data are publicly available (accountability_1), if is there an assurance system that involves external examiners (qa_ext), whether achievement scores are used in some way for teachers’ evaluation (eval_teach), if the school organizes volunteering as an extracurricular activity (volunt), whether the school always uses at least one factor to select students at the entrance (select_1), and if the school practices ability grouping between classes systematically (ability). Last, an index of competition is measured as a dummy for if the principal reports that the school competes with two or more schools for the same students (competition).
The inclusion of a set of variables describing schools’ practices and processes is of critical importance in this context. Efficiency studies often consider the process of transforming inputs into outputs as a “black box,” where mechanisms are not clear. By adding variables about schools’ activities, it is possible to provide at least descriptive suggestions of factors that are likely to improve the ability of schools to use their inputs productively.
Method
The baseline methodology is the computation of efficiency scores based on DEA (for an analytical description of the methodology, see Thanassoulis, Portela, and Despic, 2008). DEA allows the inclusion of multiple inputs and outputs in the model, and its objective is to calculate the efficiency score of each jth unit (in this case, school). In the generic case where each school is characterized by a combination of i (i = 1, . . . , m) inputs xi and r (r = 1, . . . , s) outputs yr, such as (x0i; y0r), then the concept of the jth school’s efficiency can be defined as the ratio of (weighted) outputs over the (weighted) inputs:
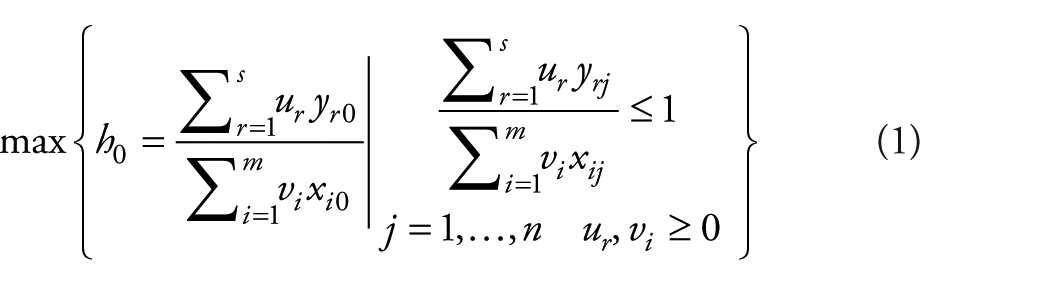
In Equation 1, ur and vi are the weights associated to the outputs and inputs, respectively; they are not set by the analyst but are determined by the computation of the efficiency score h0 (through linear programming) so that it turns out as “optimal.” By construction, h0 denotes an efficient school, while h0 < 1 means that the school is inefficient (and the difference between each school’s h0 and 1 measures its degree of inefficiency). 7 Using the efficiency scores as dependent variables, a second-stage regression was performed to observe whether certain variables (see previous section) are correlated with efficiency. 8
Results
A Discussion About the Efficiency Scores, in a Cross-Country Perspective
Table 3 reports the efficiency scores (summarized by country) calculated using the international sample of schools as potential benchmark. Given that the mean efficiency score (in the international distribution) is 0.73, schools can on average increase their PISA scores by around 27%, holding inputs constant. This result varies substantially across countries, ranging from 15% for Singapore schools (on average) to 33% for Slovenian ones. Figure 1 reports the distribution of efficiency scores by country; the results clearly indicate that the efficiency scores are much more dispersed within countries than between them. Moreover, efficiency scores for some Asian countries are higher, on average. 9 In this sense, comparing the efficiency of educational systems as a whole appears to be a less useful exercise than considering an international benchmark for the various schools, which can look at counterparts with similar characteristics but located in different countries and use them as a reference to compare practices, features, and activities—and eventually discussing their own efficiency this way. On average, it emerges that there is a positive relationship between performance (in mathematics) and efficiency; those countries where the average PISA test score is higher also show better efficiency scores on average. Remarkably, some countries report similar average efficiency, despite different levels of performance (as the cases of Portugal and Estonia or, even more strikingly, those of the United States and Canada), whereas others have similar level of average performance but a different efficiency attitude (e.g., the cases of New Zealand and Australia).
Efficiency Scores: Descriptive Statistics and Decomposition of Efficiency Scores

Note. Output-oriented, variable-returns-to-scale, bootstrap (bias-corrected) efficiency scores. Baseline model (three inputs, two outputs). International frontier as benchmark. Overall efficiency is decomposed as effj(INT)*effj(C); see the Method section.
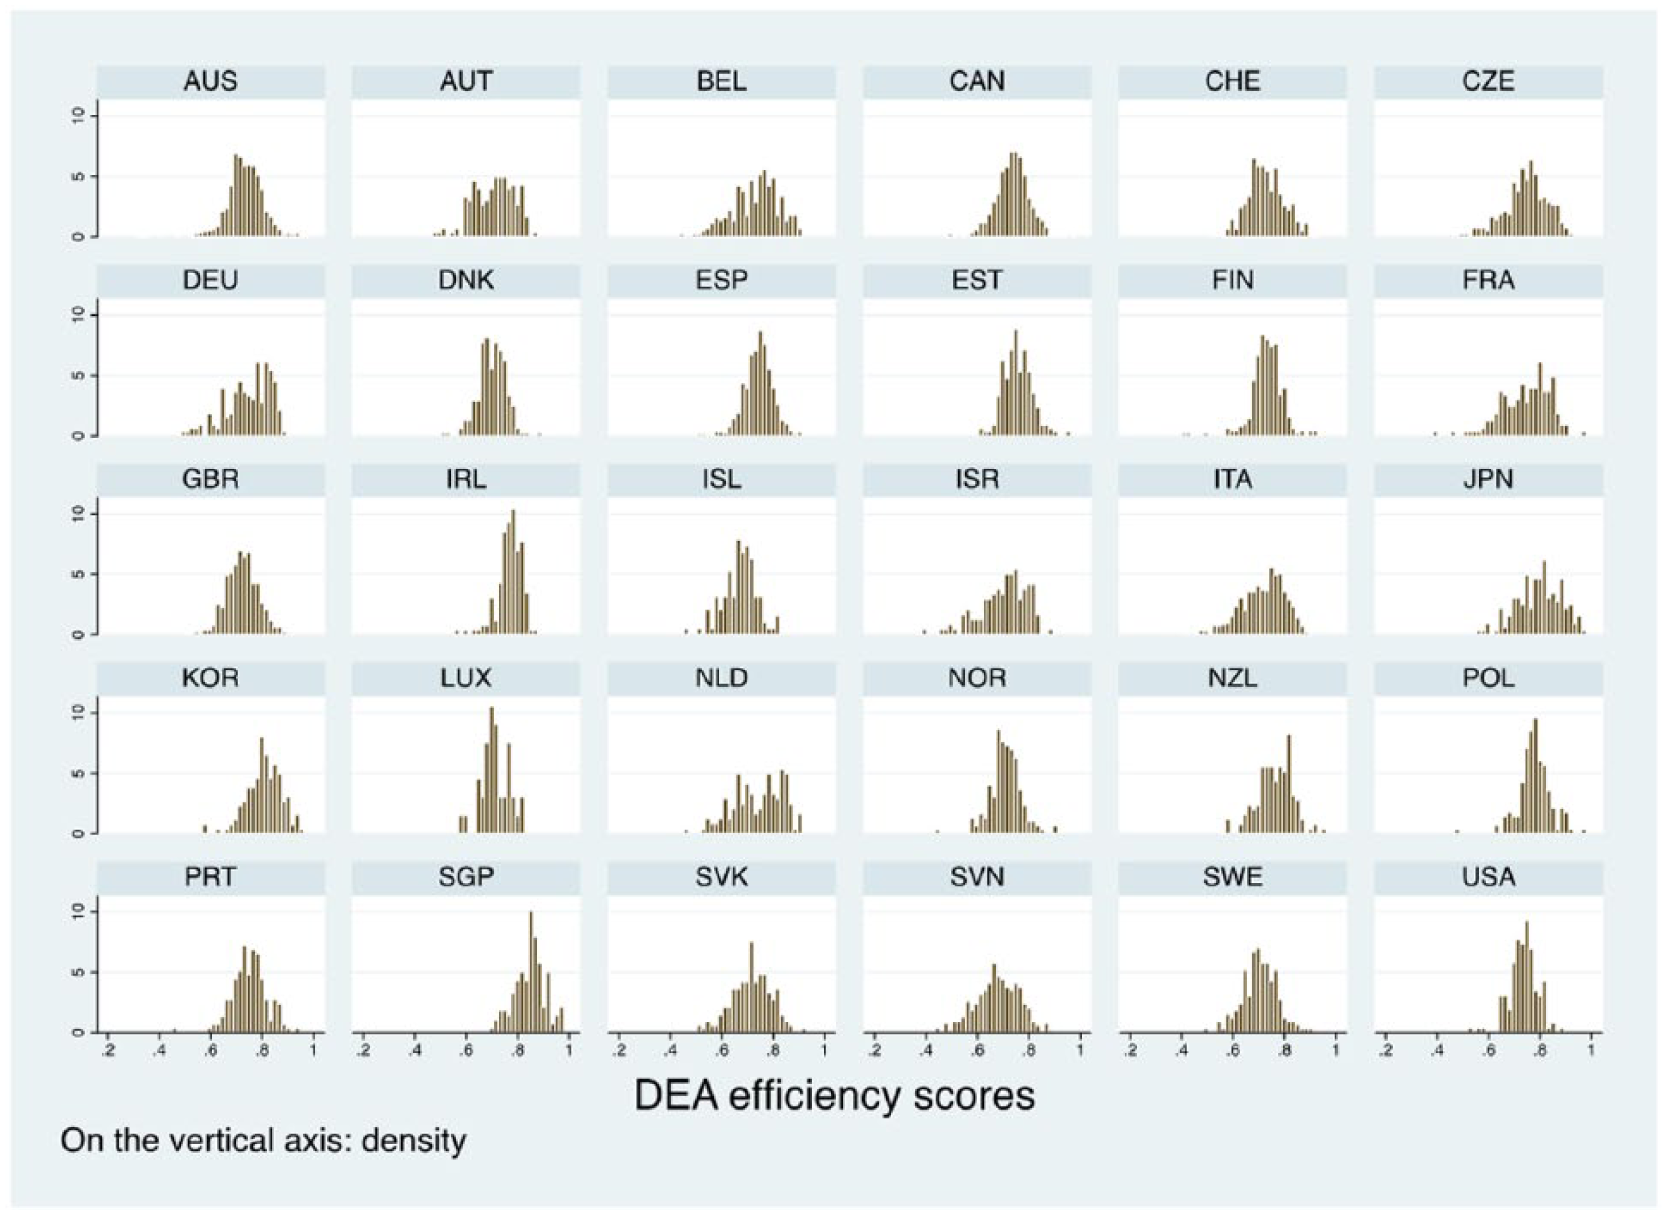
Distribution of efficiency scores, by country.
The Factors Associated With Efficiency
In Table 4, we report the results of the second-stage regression. 10 The results are presented by adding the three groups of variables of interest one a time. All the estimations include country-level fixed effects to account for structural differences of schools’ efficiency across countries.
The Factors Associated With Efficiency Scores, Second-Stage Regression
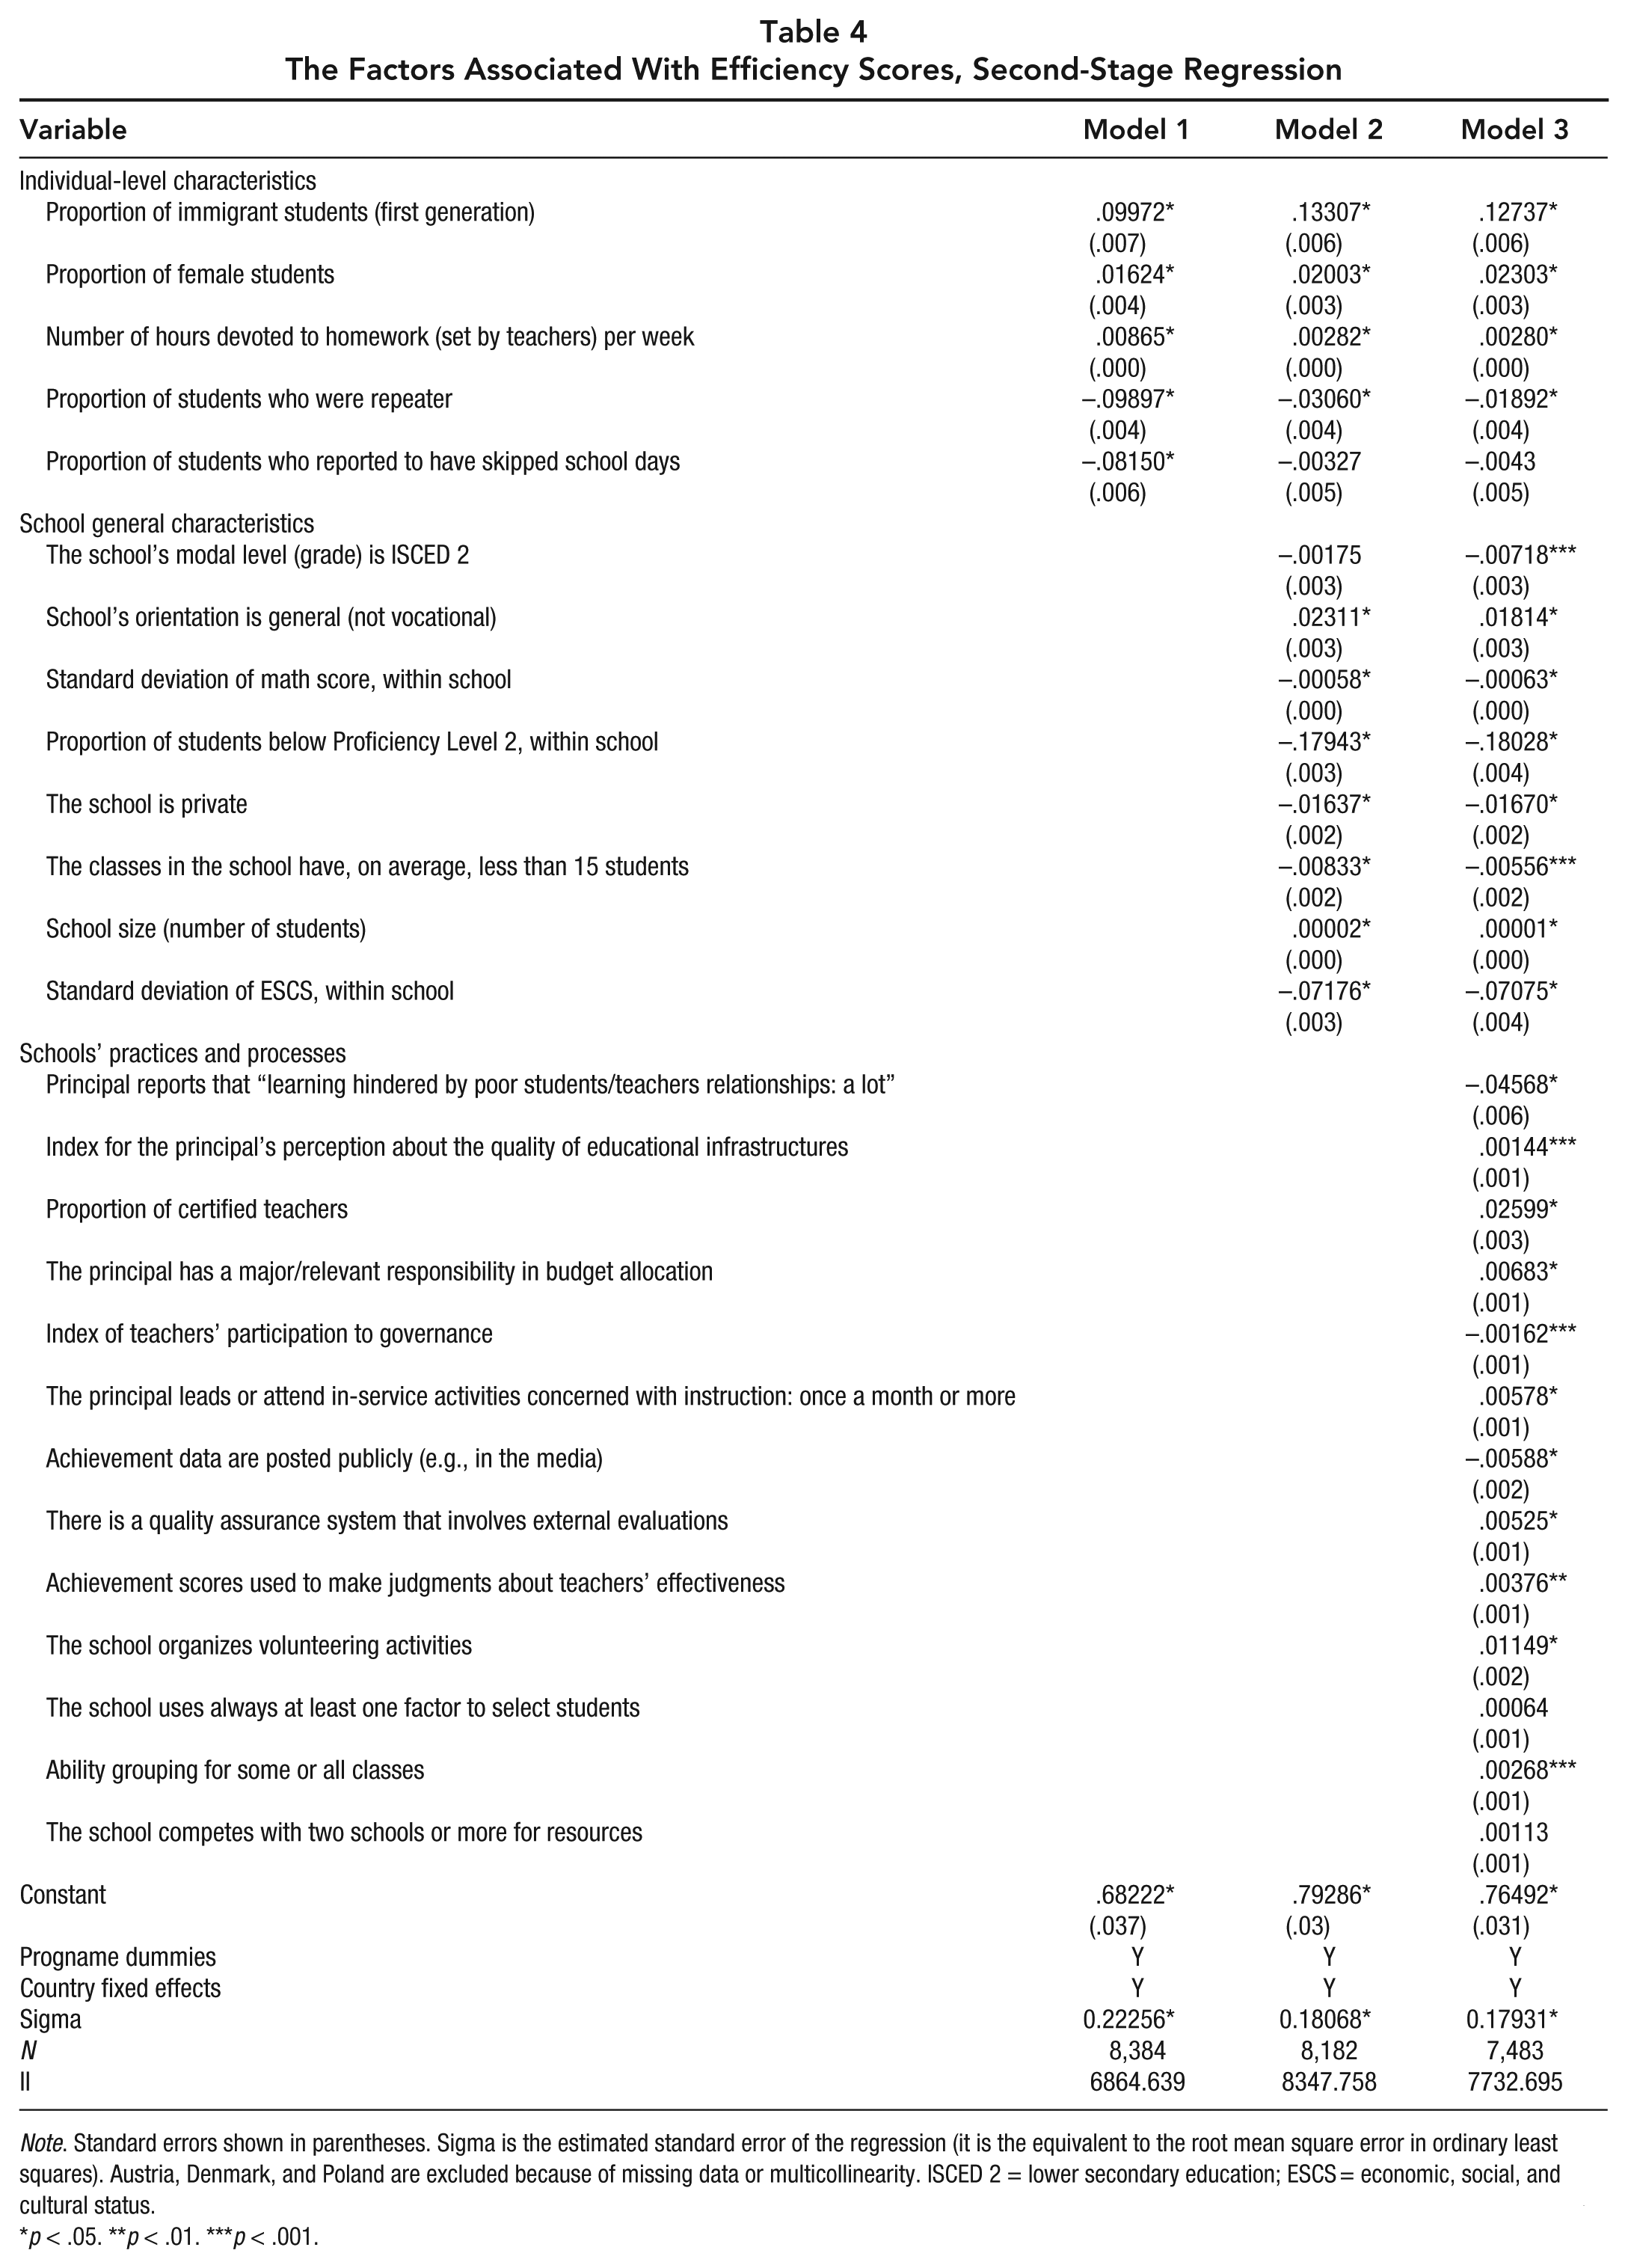
Note. Standard errors shown in parentheses. Sigma is the estimated standard error of the regression (it is the equivalent to the root mean square error in ordinary least squares). Austria, Denmark, and Poland are excluded because of missing data or multicollinearity. ISCED 2 = lower secondary education; ESCS = economic, social, and cultural status.
p < .05. **p < .01. ***p < .001.
We start with the school-average characteristics of the students (Model 1). Schools where the population of students have a more diverse socioeconomic background (as measured by ESCSsd) have lower efficiency scores; however, this negative association is counterbalanced by the positive effect on efficiency exerted by higher proportions of immigrant students (immig_1). Probably, the mechanism through which these variables affect efficiency is mediated by peer effects (Epple & Romano, 2011); in the context of the present paper, the result suggests that having more homogenous classes implies using fewer resources for obtaining equal academic achievement, after having controlled for the students’ socioeconomic background. A higher proportion of female students is associated with higher efficiency; conversely, a higher proportion of students who reported to have skipped school days (st_truancy) is negatively related to it. The number of hours that students devote to homework (hwork_h) shows a positive, albeit small in magnitude, relationship with school efficiency; however, it is impossible to disentangle how much of it is pure efficiency effects, as opposed to an indirect effect of students’ self-efficacy, for instance.
Model 2 adds schools’ general characteristics as covariates. Schools with general/academic orientation are more efficient than their counterparts with a vocational or technical focus; instead, no statistical difference arises between schools where many students are in lower secondary education or upper secondary education. Concerning the two indicators of equity, schools with a wider internal dispersion of test scores (pv1mashsd) have lower efficiency scores, even though the magnitude of this effect is negligible; in the same direction, but with a substantial magnitude, is the negative correlation between efficiency and the proportion of students with a test score below the Level 2 (pv1_belowprof2). Having classes of a small average dimension (clsize_small) is detrimental for efficiency, probably because it implies higher level of resources (i.e., teachers), and the additional resources required for small classes do not always translate to equivalent gains in achievement. In this sense, it can be useful to refer to the huge literature about class size, summarized by Krueger (2003), among others. School size’s coefficient on efficiency is practically zero, implying that only huge variations in size would have an effect on efficiency scores.
As a third step, the associations between efficiency scores and schools’ practices and processes are explored (Model 3). Two indicators of school climate matter for efficiency: The perception of nonpositive relations between students and teachers (poorelations) and the index for participation of teachers in governance and decision making (tc_part) are negatively associated with efficiency scores; they may indicate that when teachers have a nonpositive attitude toward students or the school principal, obtaining higher scores for each unit of resources invested is more difficult. On the contrary, a set of activities undertaken by the school principal are associated with higher efficiency scores: autonomy in allocating budgets across schools’ activities (budget_2), exerting instructional leadership through meetings with teachers about educational content and strategies (leadership_5), and involving external evaluations and achievement scores for evaluating teachers (qa_ext and eval_teach, respectively). The quality of educational resources, measured by an index for the quality of educational infrastructures (sc_matbui) and the proportion of certified teachers (prop_cert), are both important for efficiency, suggesting that—all else equal—transforming inputs into achievement is easier if the resources (especially teachers) are of good quality. 11 Last, some practices of schools were included: Having entrance exams (select_1) and making achievement results public (accountability_1) are associated with lower efficiency, whereas schools that organize volunteering as extracurricular activity (volunt) and grouping classes based on ability (grouping) are more efficient (but in the latter case, the effect size is almost zero). Considering the whole picture, this may suggest that giving more autonomy to schools could allow them to obtain better or worse results, given the available resources, depending on how their managers use them. Notably, there was no evidence found of a relationship between efficiency scores and the measure of competition, as was found in similar settings by Agasisti (2013) for Italy; Bradley, Johnes, and Millington (2001) for England; and Millimet and Collier (2008) for the United States.
It must be noted that the PISA data set does not contain detailed information on a set of key factors that are likely to be very influential in determining schools’ efficiency, namely, the specific form of parental involvement in supporting children’s academic activities, such as, for example, private tutoring, additional hours of teaching outside school, and so on. The academic literature shows the relevance of these actions in affecting students’ results, which in turn have an impact on schools’ results and efficiency, all else equal. Also, the wide extension of such “shadow education” can be one potential unobserved cause for the resulting higher efficiency estimated for Asian schools. On a closely related topic, see Byun and Park (2012) and Bray and Kobakhidze (2014).
Overall, the major factors in terms of magnitude are those related to the school composition in terms of students; even after having accounted for their background (indeed, ESCS is included among inputs), peer effects of various kinds are likely to improve or reduce the ability of schools to maximize student achievement.
The findings reported in this section must be considered as correlational, not causal. In other words, the lack of information about potential unobservable structural differences between schools impedes our ability to rule out the eventuality of these driving efficiency and not only the features described above. For example, the negative correlation between the variance of ESCS within a school and its efficiency does not necessarily mean that a more diverse student population makes the school more inefficient; it can easily be the case that some unobservable feature (for instance, teachers’ motivation) is causing inefficiency and that its variance with ESCS is only pure statistical correlation. Such difference between causality and correlation is very important when looking at results of studies about educational efficiency, especially when deriving policy and managerial implications based on the results. Therefore, the descriptive evidence presented in this work is important as a preliminary step. Indeed, it allowed the profiling of those schools that reveal higher average efficiency scores, as they are characterized by more motivated students, better school climate, and a higher quality of educational resources (teachers and facilities). Having framed this baseline picture, future steps for research will be dedicated to understanding which single factors are causally impacting higher efficiency levels.
Concluding Remarks
The use of international, comparable data about schools can pave the way toward new evidence about the efficiency of educational provision. This research represents one of the first attempts to use PISA for a comparative efficiency analysis of schools; a large number of schools (>8,600) and countries (30) are included in the present exercise, which sheds some light on the degree of variation in efficiency between and within countries as well as on the potential determinants of such efficiency. As previously indicated by Sutherland et al. (2009) with PISA 2003 data, substantial improvements in efficiency via increasing PISA scores are possible in most countries: This paper estimates these potential gains at 27% when allowing for an international benchmark, 12 as can be observed by the average value of efficiency of schools reported in Table 3 (0.734), which means that the schools operate at 73.4% of their efficiency potential.
The main message of our research is that concentrating the attention to the performance (efficiency) of the “average” school in a given country is meaningless, because the heterogeneity is higher within country than between countries, even when considering schools operating in 30 countries as different as those included in this empirical analysis. Let us consider a general judgment about the superiority of Japanese schools when compared with Italian ones; although this is certainly true on average (see Table 3; 0.797 vs. 0.717), it can be well possible to find more efficient specific Italian schools than Japanese ones—so that, when comparing those specific groups of schools, the consideration of country averages would be misleading. A second important point is that comparing each school to an international benchmark is more fruitful, because a wider set of alternative combinations of inputs and outputs can be considered to define efficiency and ways to pursue it. From this perspective, it would be useful for each school to concentrate on analyses of schools that have an efficiency score within its own boundaries (say, ±5%), wherever located, and to study more profoundly their characteristics, activities, and results. This way, the benchmarking would be realized not with a similarly efficient school in its own country but with the most similarly efficient schools in the international sample, with the possibility of considering whether and which system-level differences may influence performance.
It must be considered that the decision of focusing primarily on efficiency in a technical sense can be seen as an incomplete point of view. For example, if schools/countries decide to invest more resources on a policy for purposes other than maximizing test scores (say, for favoring the inclusion of disadvantaged students), this will translate automatically to lower efficiency, and even more importantly, efficiency should not be seen as a major criterion in this case. At the same time, parents and decision makers can opt for bigger class sizes for cultural reasons and preferences, and this can lead to higher efficiency scores, although efficiency may not be taken into consideration as a reference goal for the decision. As a consequence, efficiency of the schools can be safely compared straightforwardly only when there is certainty about common objectives and settings among the institutions under analysis.
The findings from second-stage regressions reveal that some school-level indicators are associated with higher/lower efficiency of institutions, among which are, for example, the proportion of female students, the proportion of students below Proficiency Level 2, the proxies for school climate, and the organization of extracurricular activities. Other elements emerge as important, such as the evidence that less diversity in student population (as measured by standard deviation of ESCS) and lower proportions of low-performing students (below Proficiency Level 2) are also associated with higher efficiency. We are aware that schools might pursue objectives that are not limited to efficiency, such as inclusion, tolerance, and openness. Our results should be taken as limited to the narrow concept of technical (economic) efficiency and not as necessarily outlining desirable school features for maximizing performance. As a consequence, any discussion about the efficiency of schools should include a wider definition of the vector of schools’ objectives and (societal) goals, and the analysis should provide evidence about their impact on the efficiency of schools themselves. On this point, see also a critical introduction on the topic of the complementary nature of efficiency and equity, which is left open for future research.
Some limitations still affect the quality of comparative efficiency analyses of schools and maybe can indicate ways for improving PISA and other international large-scale assessments. For instance, the absence of indicators about students’ prior achievement imposes the assumption that the ESCS index captures students’ entire previous scholastic stories; the development of measures, even raw, about their achievement level at school entry can allow for the better disentanglement of school effects and student ability. Also, the absence of data about school expenditures prevents the estimation of cost efficiency, which would be a natural and important extension of efficiency analyses from the international perspective. Last, we highlight that the quality of available data allows us to use only correlational analysis and not the estimation of the causal effects of schools’ characteristics on their efficiency. In such a sense, our findings reveal general interesting patterns that deserve more attention in future studies to carefully assess the real “determinants” of school efficiency in various country and educational system contexts, also employing different and more complete data sets.
A natural extension of this area of study is the explicit analysis of the relationship between efficiency and equity. PISA data could be used for deriving some indicators about school-level equity (or equality of opportunities), for example, (a) the correlation between ESCS and test scores, (b) the proportion of poor students with good test scores (see Agasisti & Longobardi, 2014), (c) the difference between students’ test scores at 90th and 10th percentiles, and (d) the variance of test scores around the mean. All these indicators can be used as a proxy of equity levels reached by the various schools, and the analysis could explore whether efficiency and equity are substitutes (i.e., higher levels of efficiency are associated with more inequality at institution level) or complements (i.e., more efficient schools are also able to reduce the presence of inequity in the educational process). The preliminary evidence presented in this paper regarding the negative correlation between efficiency scores and the proportion of very poor performers (the latter indicator being used as an indirect measure of inequality) suggests complementarity more than trade-offs. Nevertheless, investing more specifically on point can be worthwhile from a policy viewpoint.
A final point deals with the great opportunity offered by PISA 2012 in considering measures of noncognitive achievement; indeed, OECD (2013a) describes and comments on the available indicators for student perseverance, locus of control, motivation, and so on. Ongoing research is including these variables among outputs to explore how estimations of school efficiency change when adding these dimensions to the empirical analyses.
Supplementary Material
Online Appendices, EdR777495_Online_Appendices_A-D – Comparing the Efficiency of Schools Through International Benchmarking: Results From an Empirical Analysis of OECD PISA 2012 Data
Online Appendices, EdR777495_Online_Appendices_A-D for Comparing the Efficiency of Schools Through International Benchmarking: Results From an Empirical Analysis of OECD PISA 2012 Data by Tommaso Agasisti and Pablo Zoido in Educational Researcher
Footnotes
Notes
Authors
References
Supplementary Material
Please find the following supplemental material available below.
For Open Access articles published under a Creative Commons License, all supplemental material carries the same license as the article it is associated with.
For non-Open Access articles published, all supplemental material carries a non-exclusive license, and permission requests for re-use of supplemental material or any part of supplemental material shall be sent directly to the copyright owner as specified in the copyright notice associated with the article.