
Abstract
Students in the United States whose household income is less than 130% of the poverty line qualify for free lunch, and students whose household income is between 130% and 185% of the poverty line qualify for reduced-price lunch. Education researchers and policymakers often use free and reduced-price lunch (FRPL) status to measure socioeconomic disadvantage. But how valid is this measure? Linking IRS income tax data to school administrative records for all eighth graders in one California public school district and Oregon public schools, we examine how well FRPL enrollment captures student disadvantage. We find that FRPL categories capture relatively little variation in household income. However, FRPL captures elements of educational disadvantage that IRS-reported household income data do not.
Keywords
Founded in 1946, the National School Lunch Program (NSLP) serves free or reduced-price meals to over 30 million students at a cost of nearly $12.6 billion annually (U.S. Department of Agriculture [USDA] 2017). The program provides free lunches to students whose household income is less than 130% of the poverty line and reduced-price lunches to students whose household income is between 130% and 185% of the poverty line. Nearly 99% of all public schools offer meals via the NSLP, and close to 60% of school-aged U.S. children regularly receive meals through the program (Institute of Medicine 2008; Snyder, de Brey, & Dillow 2016).
As NSLP free and reduced-price lunch (FRPL) participation is often the sole available indicator of student socioeconomic status available in K–12 school administrative data, the program also plays a central role in education research and the allocation of school finances. Income information used by this program is typically based on student, parent, or guardian reports of total household income in the month prior to program application. Education researchers routinely use NSLP enrollment as a proxy for economic disadvantage (see Hill, Bloom, Black, & Lipsey 2008; Reardon, Kalogrides, & Shores, 2017) and represent peer socioeconomic status based on classroom or school-level free and reduced-price enrollment rates (Hanushek, Kain, Markman, & Rivkin, 2003; Kim & Sunderman, 2005). Likewise, school finance policies—including federal Title I funds as well as state and local weighted student funding formulae—use NSLP enrollment data to target supplemental funds to poor students.
In this paper, we investigate how well FRPL designations measure household income and educational disadvantage. We draw on a unique link between Internal Revenue Service (IRS) records of students’ annual household income and student administrative records from eighth graders in a midsized California public school district and Oregon public schools. The resulting data provide an unprecedented look at the relationship between NSLP enrollment categories, the economic resources in students’ homes, and students’ educational achievement.
Our analyses suggest that school data on students’ NSLP enrollment do not do a good job of capturing students’ socioeconomic resources as measured by IRS-reported annual household income. Interestingly, however, school-reported measures of student FRPL enrollment correlate more strongly with test scores than similar measures that we generate using IRS-reported annual household income. This finding suggests that NSLP data may better capture student educational disadvantage than annual household income data. Further, we find that school NSLP enrollment data predict test scores independent of other measures of household income, suggesting that FRPL categories may capture income volatility, educator perceptions of family resources, and other dimensions of disadvantage beyond annual household income. Finally, we show that the degree to which FRPL classification captures student poverty varies across schools so that school-level FRPL enrollment rates provide an imprecise measure of school-level economic disadvantage.
Background
The NSLP’s primary aim is to address the substantial and well-documented developmental challenges associated with childhood malnutrition (see Adolphus, Lawton, & Dye, 2013; Brown & Pollitt, 1996; Frisvold, 2015; Glevwe, Jacoby, & King, 2001; Hinrichs, 2010; Victora et al., 2008) by ensuring that poor and near-poor students in American schools have access to at least one nutritious meal during school days.
But the NSLP has also come to occupy a central place in education research. School administrative data provide unprecedented opportunities for the study of education since they provide repeated measures of academic progress and educational contexts for the universe of students in many states and large districts. However, NSLP enrollment is often the only indicator of student home economic resources available in K–12 administrative data. While scholars acknowledge the coarseness and limited purview of this measure of family background, they regularly use FRPL enrollment categories as an individual-level control or stratifying variable and use school-level variation to characterize the concentration of poverty in schools. Indeed, of the 82 articles published in Educational Researcher from 2006 to 2017 that include any empirical measure of student or school socioeconomic status, nearly 70% (57 articles) use FRPL measures (authors’ calculations). Prominent examples in related disciplines include Chetty, Friedman, and Rockoff (2014); Dobbie and Fryer (2013); Figlio and Hart (2014); and Morris and Perry (2016).
The NSLP also plays an instrumental role in the provision of funds targeted at schools that educate economically disadvantaged youth. The Elementary and Secondary Education Act allocates Title I funds to districts and schools based on the proportion of students enrolled in the free or reduced-price lunch program. Likewise, 34 states allocate supplemental education funds to districts based on free or reduced-price lunch enrollment rates (Verstegen, 2011).
Threats to Measurement Validity
FRPL data measure student program enrollment (Cruse & Powers, 2006; Harwell & LeBeau, 2010; Hauser, 1994; Michelmore & Dynarski, 2017). Analyses using these data inevitably confound several factors, including income eligibility, program participation, and program effects.
Income Eligibility as a Proxy for Socioeconomic Disadvantage
Scholars and policymakers use FRPL as a measure of socioeconomic disadvantage because in most cases, families must report relatively low income to qualify for the program. However, several factors potentially undermine the match between FRPL enrollment and socioeconomic disadvantage. First, FRPL data are based on largely unverified family reports of household income. The accuracy of family-reported income is not clear. Second, FRPL eligibility rules are built around the federal poverty line, a measure that is based on dated ideas about the relation between food costs and total expenditures, neglects the role of taxes and non-cash transfers in family budgets, and overlooks important geographic variation in the cost of living (Hauser, 1994). Third, as Michelmore and Dynarski (2017) point out, FRPL data obscure important variation in household resources at both the top and bottom of the income distribution since they reduce a continuous underlying variable (household income) to a rough categorical variable. Fourth, income-based eligibility requirements capture just one element of socioeconomic disadvantage and provide no information on parental education, neighborhood resources, residential stability, and other family background characteristics associated with educational experiences and outcomes (see National Forum on Education Statistics, 2015).
Unmeasured Variance in Program Participation
FRPL data are not collected for research purposes and thus are likely not collected using scientific best practices. District offices enroll students in FRPL for the academic year based on student, parent, or guardian reports of household income in the past month, collected in varying ways in different contexts. The USDA provides detailed guidance to schools about how to solicit and validate applications for NSLP data. Districts are required to publicize the program’s existence via local media, encourage participation by sending letters home with children, solicit standardized information about students’ household size and current income from all household earners, directly verify income reports from a small sample of applicants, and retain records for potential audits. However, schools may vary in the encouragement and assistance they provide to potential NSLP applicants. Accordingly, some students who are income eligible likely do not apply for FRPL.
Furthermore, verification studies suggest that family income reports may be inaccurate (Bass, 2010). 1 Indeed, Harwell and LeBeau (2010) compile evidence from multiple verification studies conducted between 1990 and 2005 suggesting that a considerable proportion of students who enroll in free or reduced-price lunch are income ineligible and a considerable proportion of students who are income eligible do not enroll. In an attempt to boost free lunch program enrollment and reduce the bureaucratic burden on schools and school districts, the USDA authorized local educational authorities (LEAs) to directly certify students whose families participate in SNAP and TANF enrollments for free lunch in 1986, and LEAs slowly rolled out direct certification through the 1990s and early 2000s. However, little information is available about the extent to which direct certification has improved the match between student income and FRPL status.
Other recent changes to the legislation governing the NSLP may render the measure increasingly problematic for research purposes and governmental programs that use NSLP enrollment data in funding formulae. A series of provisions authorized by the USDA in 2002 make it possible for schools in which many students are enrolled in the free lunch program to renew students’ program registration for up to four years without collecting updated information on students’ household incomes. Furthermore, the Healthy, Hunger-Free Kids Act of 2010’s Community Eligibility Provision (CEP), implemented nationwide in the 2014–2015 school year, allows schools or districts in which 40% or more of students are directly certified for enrollment in the NSLP based on their participation in other federal nutrition programs to offer free lunch and breakfast to all students without collecting data on other students’ household income. In the 2015–2016 school year, more than 15% of U.S. students attended a school or district that participated in the CEP (Segal et al., 2016). As this program becomes more widely adopted, it will likely create new challenges for education researchers using school-reported NSLP participation rates as a proxy for economic disadvantage.
Unmeasured Program Effects
Finally, students who enroll in FRPL receive an educational intervention—one or more free or subsidized meals on school days. Analyses using FRPL to measure disadvantage inevitably confound the effects of this meal subsidy with the consequences of income eligibility and enrollment. When researchers use FRPL as a proxy for socioeconomic disadvantage, they implicitly assume that the meal subsidy has no appreciable effect on student outcomes. If, however, existing evidence suggesting that FRPL has a positive effect on student outcomes is accurate (see Hinrichs, 2010), FRPL measures may understate the consequences of family socioeconomic disadvantage.
Research Questions
In this study, we investigate the validity of FRPL as a measure of student socioeconomic disadvantage. Following Messick (1987), we think of validity as an evaluative judgment of the degree to which inferences based on a measure are justified. We approach this task via two sets of analysis.
First, we investigate the convergent validity of FRPL enrollment data, asking: What is the relationship between IRS-reported annual household income and school-reported free or reduced-price lunch program enrollment? This analysis is predicated on the assumption that a valid measure of socioeconomic disadvantage should correlate with the income that a student’s household reports annually to the IRS.
Second, we explore the measure’s predictive validity, asking: What is the relationship between school-reported FRPL enrollment and student test scores? How does this relationship compare to the relationship between IRS-reported annual household income and test scores? This analysis proceeds from the empirical observation that socioeconomic disadvantage is strongly associated with low levels of academic achievement. A valid measure of socioeconomic disadvantage should correlate negatively with academic achievement as measured by eighth-grade English language arts (ELA) test scores. If FRPL measures correlate less strongly with academic achievement than IRS-validated household incomes, these analyses might indicate measurement error in the FRPL measures.
Data and Methods
To facilitate our analyses, we have linked student-level educational administrative data from one midsize California public school district and the state of Oregon with IRS tax records stored at the U.S. Census Bureau. The resulting merged data sets provide unique opportunities for assessing the measurement properties of FRPL data since they provide the basic student demographic and annual test score data that are routinely included in educational administrative data as well as continuous student-level measures of household income as reported on 1040 forms filed annually during the students’ elementary school career.
We have student-level administrative records from all eighth graders enrolled in one midsize California public school district for the 2008–2009 through 2013–2014 school years 2 as well as similar records from the Oregon Department of Education (ODE) covering all eighth graders enrolled in Oregon public schools during the 2004–2005 to 2013–2014 period. As is typically the case in school administrative data, these records provide little information about students’ family background beyond a categorical variable describing students’ free or reduced-price enrollment status. Both data sets provide annual data on students’ end-of-grade test score achievement as well as indicators of students’ gender, race/ethnicity, English language learner status, and identifiers for the schools in which students were enrolled.
We examine the relationship between student poverty, FRPL enrollment, and eighth-grade ELA achievement. In California during this time period, students were tested annually with the California Standards Test (CST) in Grades 2 through 11. 3 In Oregon, students in Grades 3 through 8 and in Grade 11 took the Oregon Assessment of Knowledge and Skills (OAKS) in ELA each spring.
Students whose household income is less than 130% of the poverty line 4 are eligible for free lunch, and students with household incomes between 130% and 185% of poverty are eligible for reduced-price lunch. 5 The California district data include indicators flagging students who were listed by the district as enrolled to receive free lunch, reduced-price lunch, or no support under the NSLP in each academic year. 6 In this district, the NSLP application asks for the current income, which is defined as pre-tax income from a wide variety of sources in the last month. The application specifies that the definition of income should include earnings from all sources (including work, pensions, public assistance, child support, and interest) from all members of the household (defined as “related or non-related individuals who are living as one economic unit and sharing living expenses”). 7 None of the schools in the California district participate in the USDA’s Provision 1, Community Eligibility Provision, or any other program designed to allow all students in a given school to enroll in free or reduced-price lunch independent of income eligibility.
The Oregon data provide information on a much broader array of schools and a longer time period. However, our Oregon administrative data provide less detailed FRPL enrollment data, combining students who enrolled in free or reduced-price lunch in a single category. Further, NSLP application and enrollment processes vary across Oregon schools.
We link these student-level records with IRS tax records stored at the U.S. Census Bureau. Most notably, IRS records include income information for the students’ households as reported on 1040 forms filed during each year of the student’s elementary school and early high school careers. IRS-reported income measures provide unprecedented insights into the economic resources available in students’ homes. The IRS-reported income data are continuous, include a wide range of income sources, and are collected in a context in which respondents have scaffolds (in the form of W2s and similar statements) as well as strong legal incentives to report accurate information.
The student records were processed at the Census Bureau using the Person Identification Validation System (PVS), which employs record linkage techniques using personal information such as Social Security number, name, date of birth, and address to assign each student, when possible, an anonymized unique Protected Identification Key (PIK). 8 Approximately 94% of students in the California district administrative records and 93% of students in the Oregon administrative records were assigned a PIK. These students’ PIKs were matched to their household’s IRS 1040 tax records. Approximately 99% of all IRS 1040 records filed across the United States were assigned a PIK. As not every household files taxes in every year and not all students received a PIK, eighth-grade household income is available for 87% and 88% of the students from California and Oregon, respectively, for whom we also have school NSLP enrollment data. 9 We exclude students who are missing IRS household income data as well as a very small number of students whose families report income greater than roughly 20 times the poverty line (approximately $500,000 annually in 2017 dollars) from the analysis. In both samples, excluded students due to missing IRS household income data are disproportionately low performing, receive free and reduced-lunch at a higher rate than nonexcluded students, and include a high proportion of racial and ethnic minorities.
We use the IRS 1040 tax records to create measures of the household income-to-poverty ratio and predicted FRPL eligibility following the NSLP enrollment thresholds. 10 We use a unique address identifier to indicate a student’s household, and our measure of household size is based on the total number of primary, secondary, and dependent exemptions claimed on all 1040s filed in a household.
As multiple persons in a household may file a 1040, we follow USDA Food and Nutrition Service guidelines and define household income as the sum of all total money income reported on all filed 1040s in a student’s household. An important limitation is that tax years and school years are not aligned. We use students’ household income from the IRS tax records for the calendar year that coincides with the beginning of the school year (e.g., for the 2008–2009 school year, we use 2008 tax records) since schools typically ask students to complete NSLP applications at the beginning of the school year. We are unable to account for short-term income volatility and its implications for student NSLP enrollment. Recent data suggest that this volatility is substantial, such that the average family spends several months each year with a monthly household income that is at least 25% lower than their average monthly household income for that year (Morduch & Schneider, 2017). Under NLSP guidelines, students can enroll in NSLP based on household income during a period of unemployment or underemployment and remain on the program throughout the school year. 11
Our analysis proceeds in two steps. First, we consider the convergent validity of FRPL as a measure for student socioeconomic disadvantage by investigating the degree to which these widely utilized measures account for variation in students’ household income. We use household income and size to create a measure of household income relative to the poverty line, dividing students’ household income by the poverty threshold for a household of their size. We also create annual indicators of household poverty from kindergarten through eighth grade for students in the California district and from fourth to eighth grade for students in Oregon. These variables indicate whether students came from households with incomes less than 130% of the poverty line (corresponding to the free lunch threshold) or between 130% and 185% of the poverty line (corresponding to the reduced-price lunch threshold) and whether the student lived in a household with an income below the poverty threshold. 12
We further examine the extent to which the convergent validity of FRPL enrollment measures varies across schools and with student demographics. Investigating the school-level relationship between IRS-reported household income and FRPL category data provides important information about the extent to which these measures capture socioeconomic variation across schools. After a preliminary descriptive analysis in the California data, we use the Oregon data to estimate a series of models investigating cross-district and cross-school variation in FRPL enrollment and the extent to which IRS-reported household income, as well as other demographic controls, explain that variation.
We then examine the predictive validity of FRPL enrollment measures by estimating the relationship between NSLP enrollment, IRS-reported household income, and student ELA achievement. In a series of ordinary least squares (OLS) regression models, we compare the extent to which NSLP enrollment and IRS-reported annual household income each explain variation on ELA achievement net of controls for student race/ethnicity, U.S. nativity, language status, and various measures of students’ prior exposure to poverty and family composition.
Findings
Convergent Validity
NSLP enrollment data reduce continuous variation in students’ household income-to-poverty ratio into three discrete categories: free lunch enrollees, reduced-price lunch enrollees, and non-FRPL students. As such, these data inevitably result in the loss of information and obscure important differences among students within each category. In these data, the estimated 1.5 million U.S. children who live on less than $2 a day (Shaefer, Edin, & Talbert, 2015) might look no different from classmates whose household income is just below 130% of the poverty line (approximately $32,000 for students in a family of four). Likewise, students from relatively modest backgrounds whose family incomes are just above 185% of the poverty line (approximately $45,000 for a family of four) look no different in FRPL data than their wealthy peers.
In analyses reported in Appendix Tables A1 and A2, we consider the extent to which these categories capture the continuous variation in student household income. These analyses predict the continuous measure of the household income-to-poverty ratio using FRPL categories as well as categories constructed around free lunch eligibility and reduced-price lunch eligibility thresholds with IRS-reported household income data. 13 Appendix Table A1 demonstrates that IRS-validated income categories account for approximately twice as much of the within-school, within-year variation (51%) in the continuous household income-to-poverty ratio as FRPL categories (28%) in our California school district. Appendix Table A2 demonstrates that IRS-validated income categories account for approximately 1.5 times as much of within-school, within-year variation as FRPL categories in Oregon (43% vs. 30%).
Figures 1a and 1b plot household income-to-poverty ratios for students separately by NSLP enrollment categories and illustrate the information lost by using free or reduced-price lunch status as a proxy for annual household income. These figures make it clear that there is substantial variation in household income among students in the same NSLP participation category. This variation is particularly pronounced among FRPL non-enrollees, a category that includes students from middle-income families, a considerable number of more affluent students, and many students who have household incomes below the 185% of poverty threshold. For example, in the California district, approximately 13% of students who are not enrolled in free or reduced-price lunch appear to be income eligible based on their household’s IRS records. We note this figure likely understates the degree of under-enrollment since these data exclude students from families who do not file income tax returns.
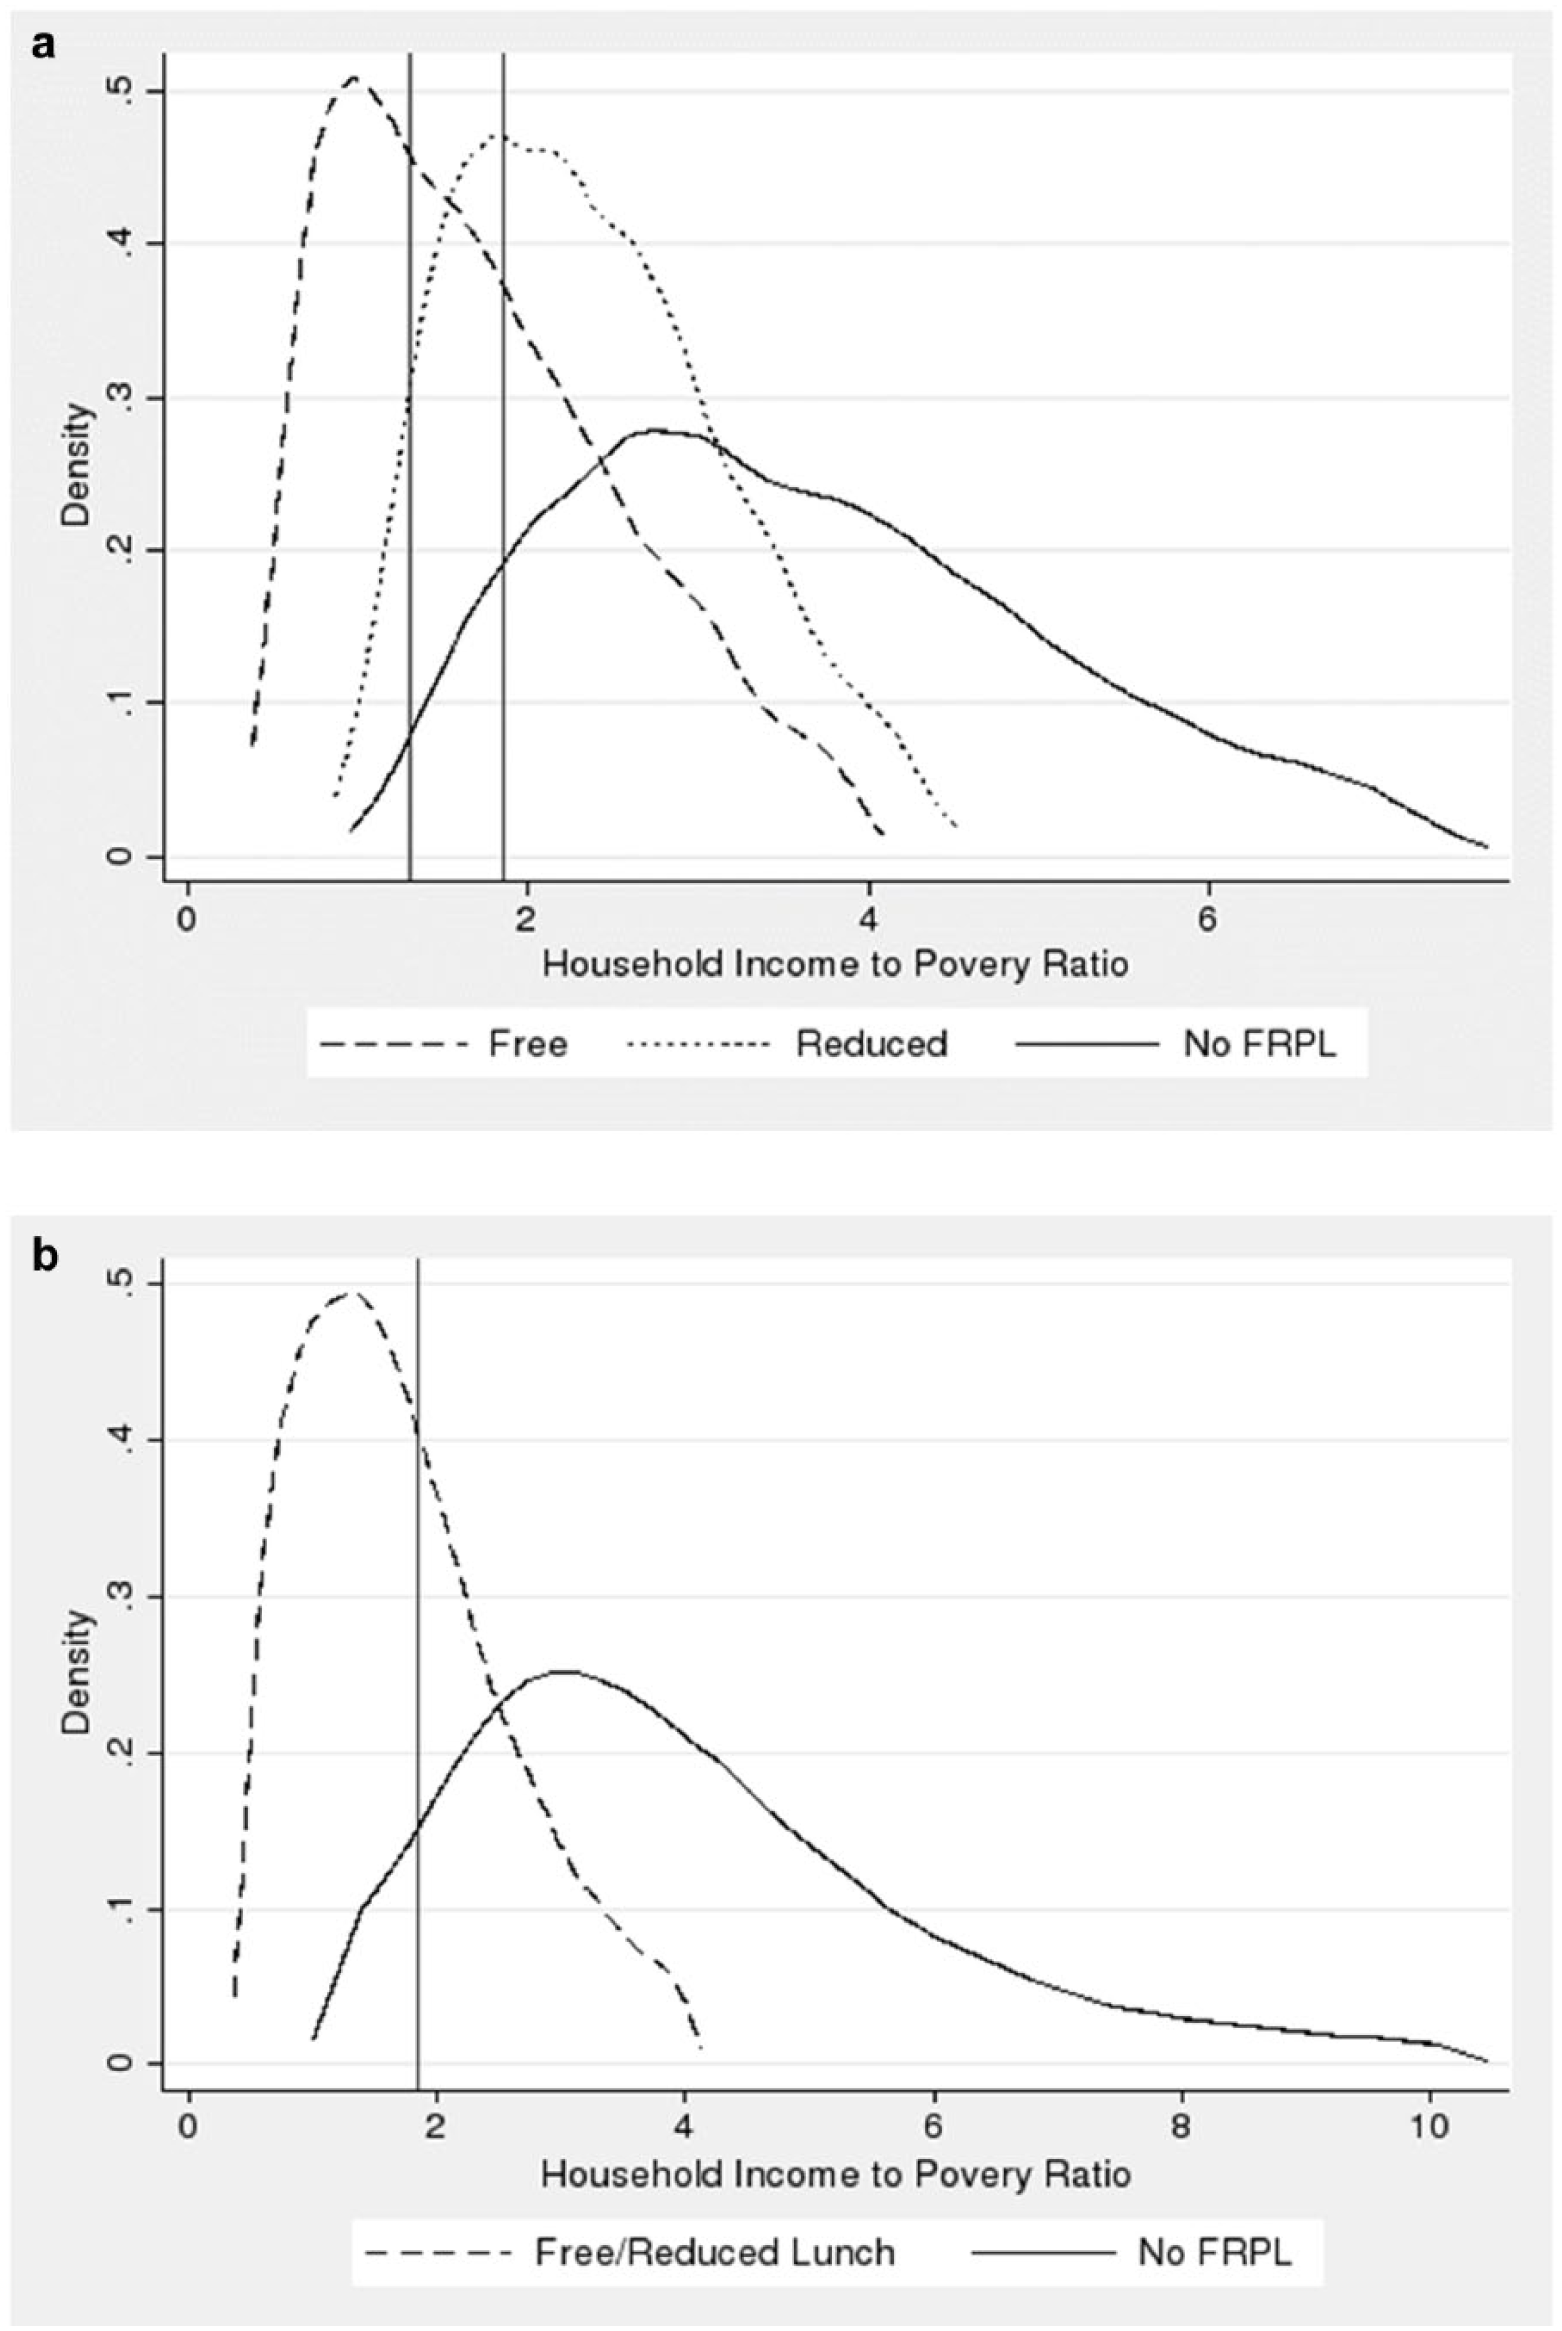
(a) Distribution of IRS-reported household income-to-poverty ratio by eighth-grade National School Lunch Program (NSLP) enrollment in one California school district for academic years 2008–2009 through 2013–2014 (N = 12,500). (b) Distribution of IRS-reported household income-to-poverty ratio by eighth-grade NSLP enrollment in Oregon schools for academic years 2004–2005 through 2013–2014 ( N = 315,000).
Considerable variation in household income also exists among FRPL recipients. Figure 1a illustrates that most free lunch recipients in the California district come from households with incomes near or below the poverty line. However, the left tail of the income-to-poverty distribution for free lunch recipients includes a group of extremely poor students. In the California district, 26% of free lunch recipients come from households with household incomes below the poverty line. Likewise, a substantial number (35%) have incomes that are greater than two times the poverty line. The statewide results from Oregon presented in Figure 1b are consistent with the California findings.
Figure 2 examines whether school-level aggregated NSLP enrollment rates capture school-level differences in household income in our California district. We plot the percentage of students who (a) are enrolled in the free or reduced-price lunch program, (b) were below the poverty line according to IRS household income information from the relevant tax year, (c) were ever below the poverty line in kindergarten through eighth grade based on IRS records, and (d) were below the threshold for free or reduced-price lunch according to IRS information from the relevant tax year. Figure 2 reveals substantial school variation in the degree to which the NSLP information aligns with other indicators of poverty. Schools 7 and 8, for example, have similar NSLP enrollment rates (74% and 75% of students, respectively) but vary considerably on other measures of poverty, while Schools 8 and 10 vary on NSLP enrollment rates (75% and 84% of students) but are similar in their other measures of poverty.
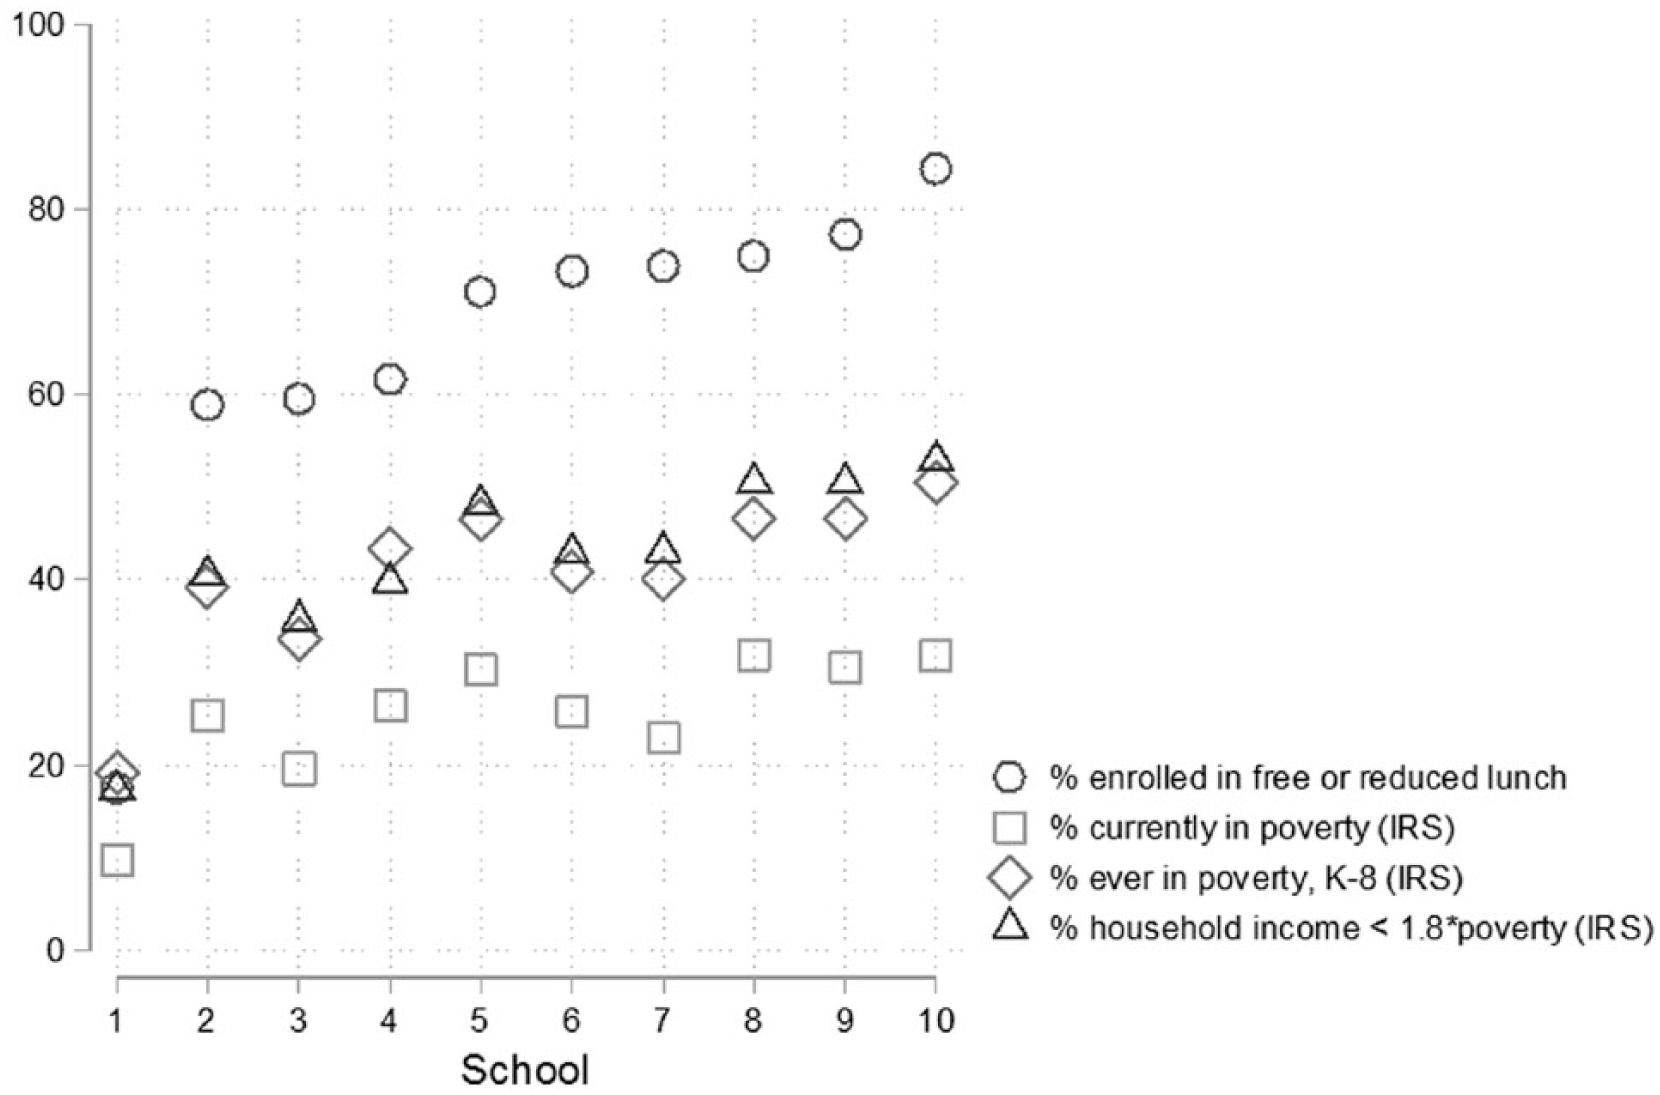
Eighth-grade National School Lunch Program (NSLP) enrollment and IRS-validated household income and poverty rates (averaged at the school level for all eighth graders in one California Public School District, 2008–2009 through 2013–2014) ( N = 14,000).
Table 1 reports the results of a series of multilevel models that extend these analyses using Oregon data. The results reported in the first column regress continuous IRS-reported income, centered at 185% of poverty, on FRPL enrollment controlling for secular changes and school-level random effects.
Mixed Level Linear Probability Model Predicting Free or Reduced-Price Lunch Enrollment Using Academic Year, Household Income Indicators, and Demographic Measures Using Data From the Oregon Department of Education (2005–2015) and Internal Revenue Service 1040 Tax Data (2000–2014) (N ≈ 358,000)
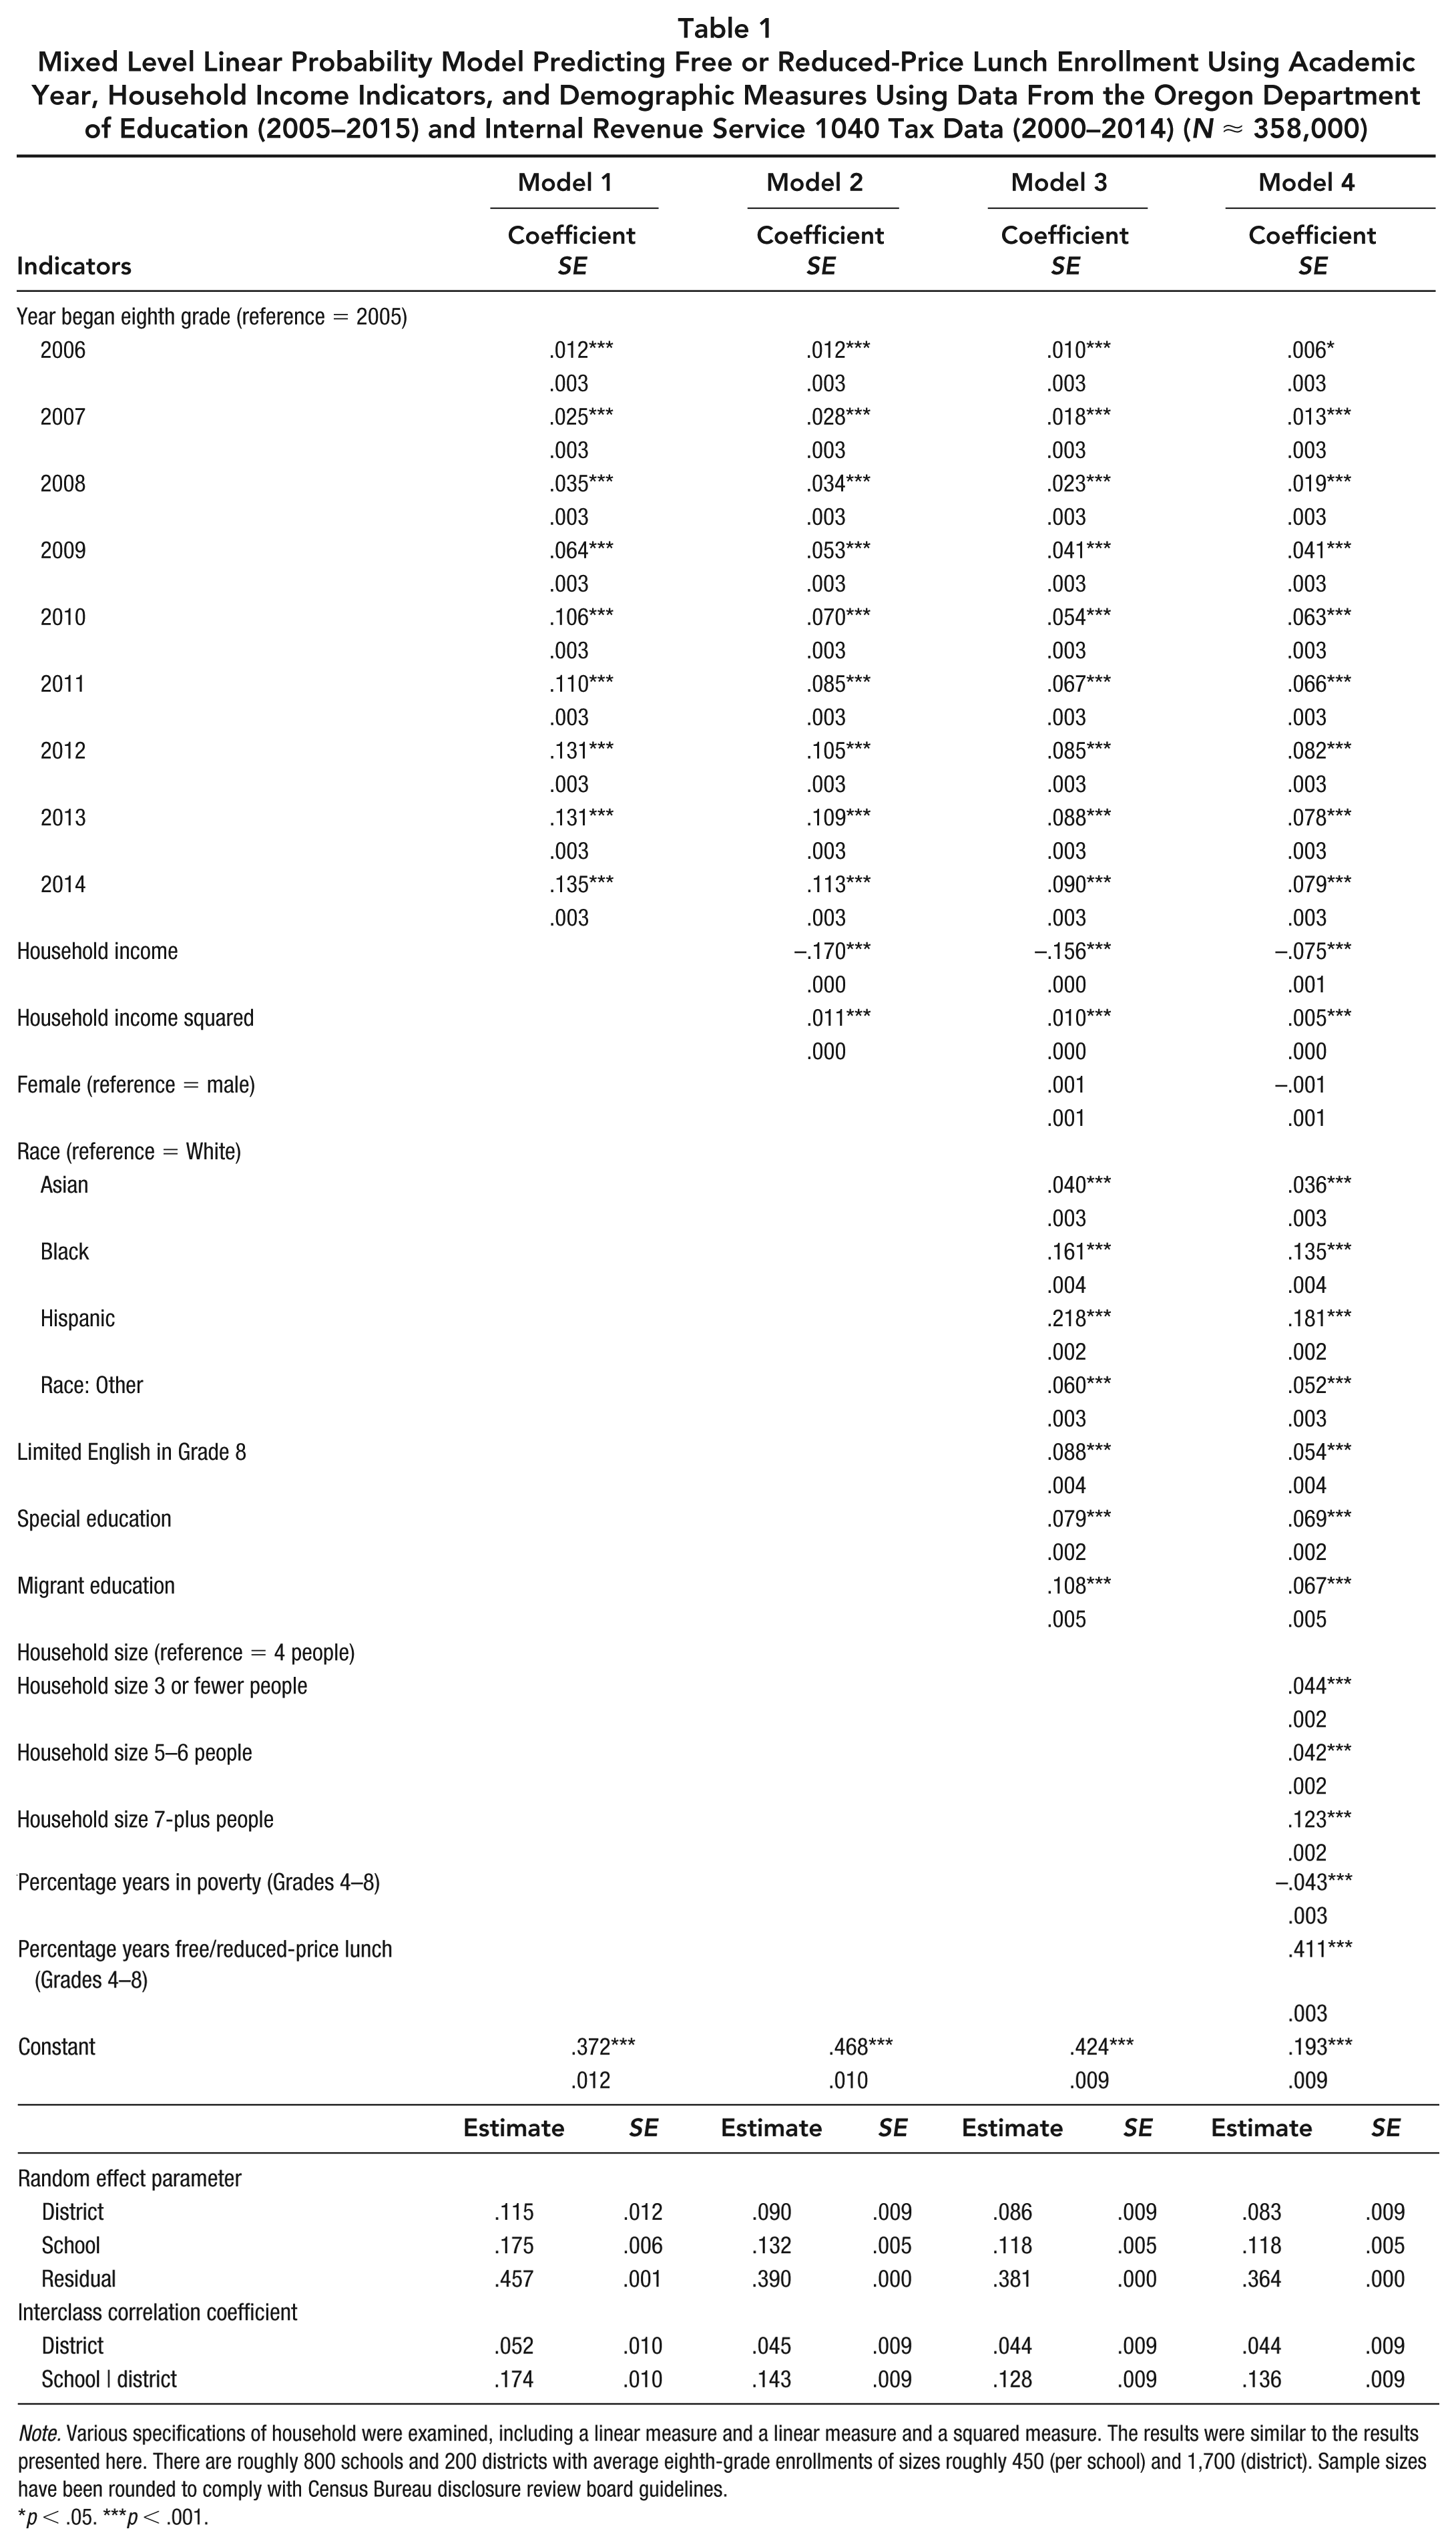
Note. Various specifications of household were examined, including a linear measure and a linear measure and a squared measure. The results were similar to the results presented here. There are roughly 800 schools and 200 districts with average eighth-grade enrollments of sizes roughly 450 (per school) and 1,700 (district). Sample sizes have been rounded to comply with Census Bureau disclosure review board guidelines.
p < .05. ***p < .001.
FRPL enrollment in Oregon is substantial and increasing over time. The results reported in Model 1 suggest that 37% of Oregon eighth graders enrolled in free or reduced-price lunch in 2005. That enrollment rate increased throughout the study period to more than 50% by 2014. This increase is evident in models with additional controls for student and family background.
FRPL enrollment rates also vary substantially across contexts. The results reported in Model 2 indicate that this is the case even after controlling for IRS-reported household income. The interclass correlations demonstrate that districts account for 4.5% of residual variation in FRPL enrollment while schools account for an additional 14% of the residual variation.
The results reported in Model 3 suggest that students of color are substantially more likely to be enrolled in FRPL than White students with similar IRS-reported household income. Migrant students and special education students also have elevated rates of free or reduced-price lunch enrollment net of controls. While student demographics vary substantially across schools, controlling for student demographics explains very little of the district- and school-level variation we observe in FRPL enrollment rates. However, as Model 4 indicates, including richer measures of student family background reduces the racial and ethnic differences in FRPL enrollment.
Predictive Validity
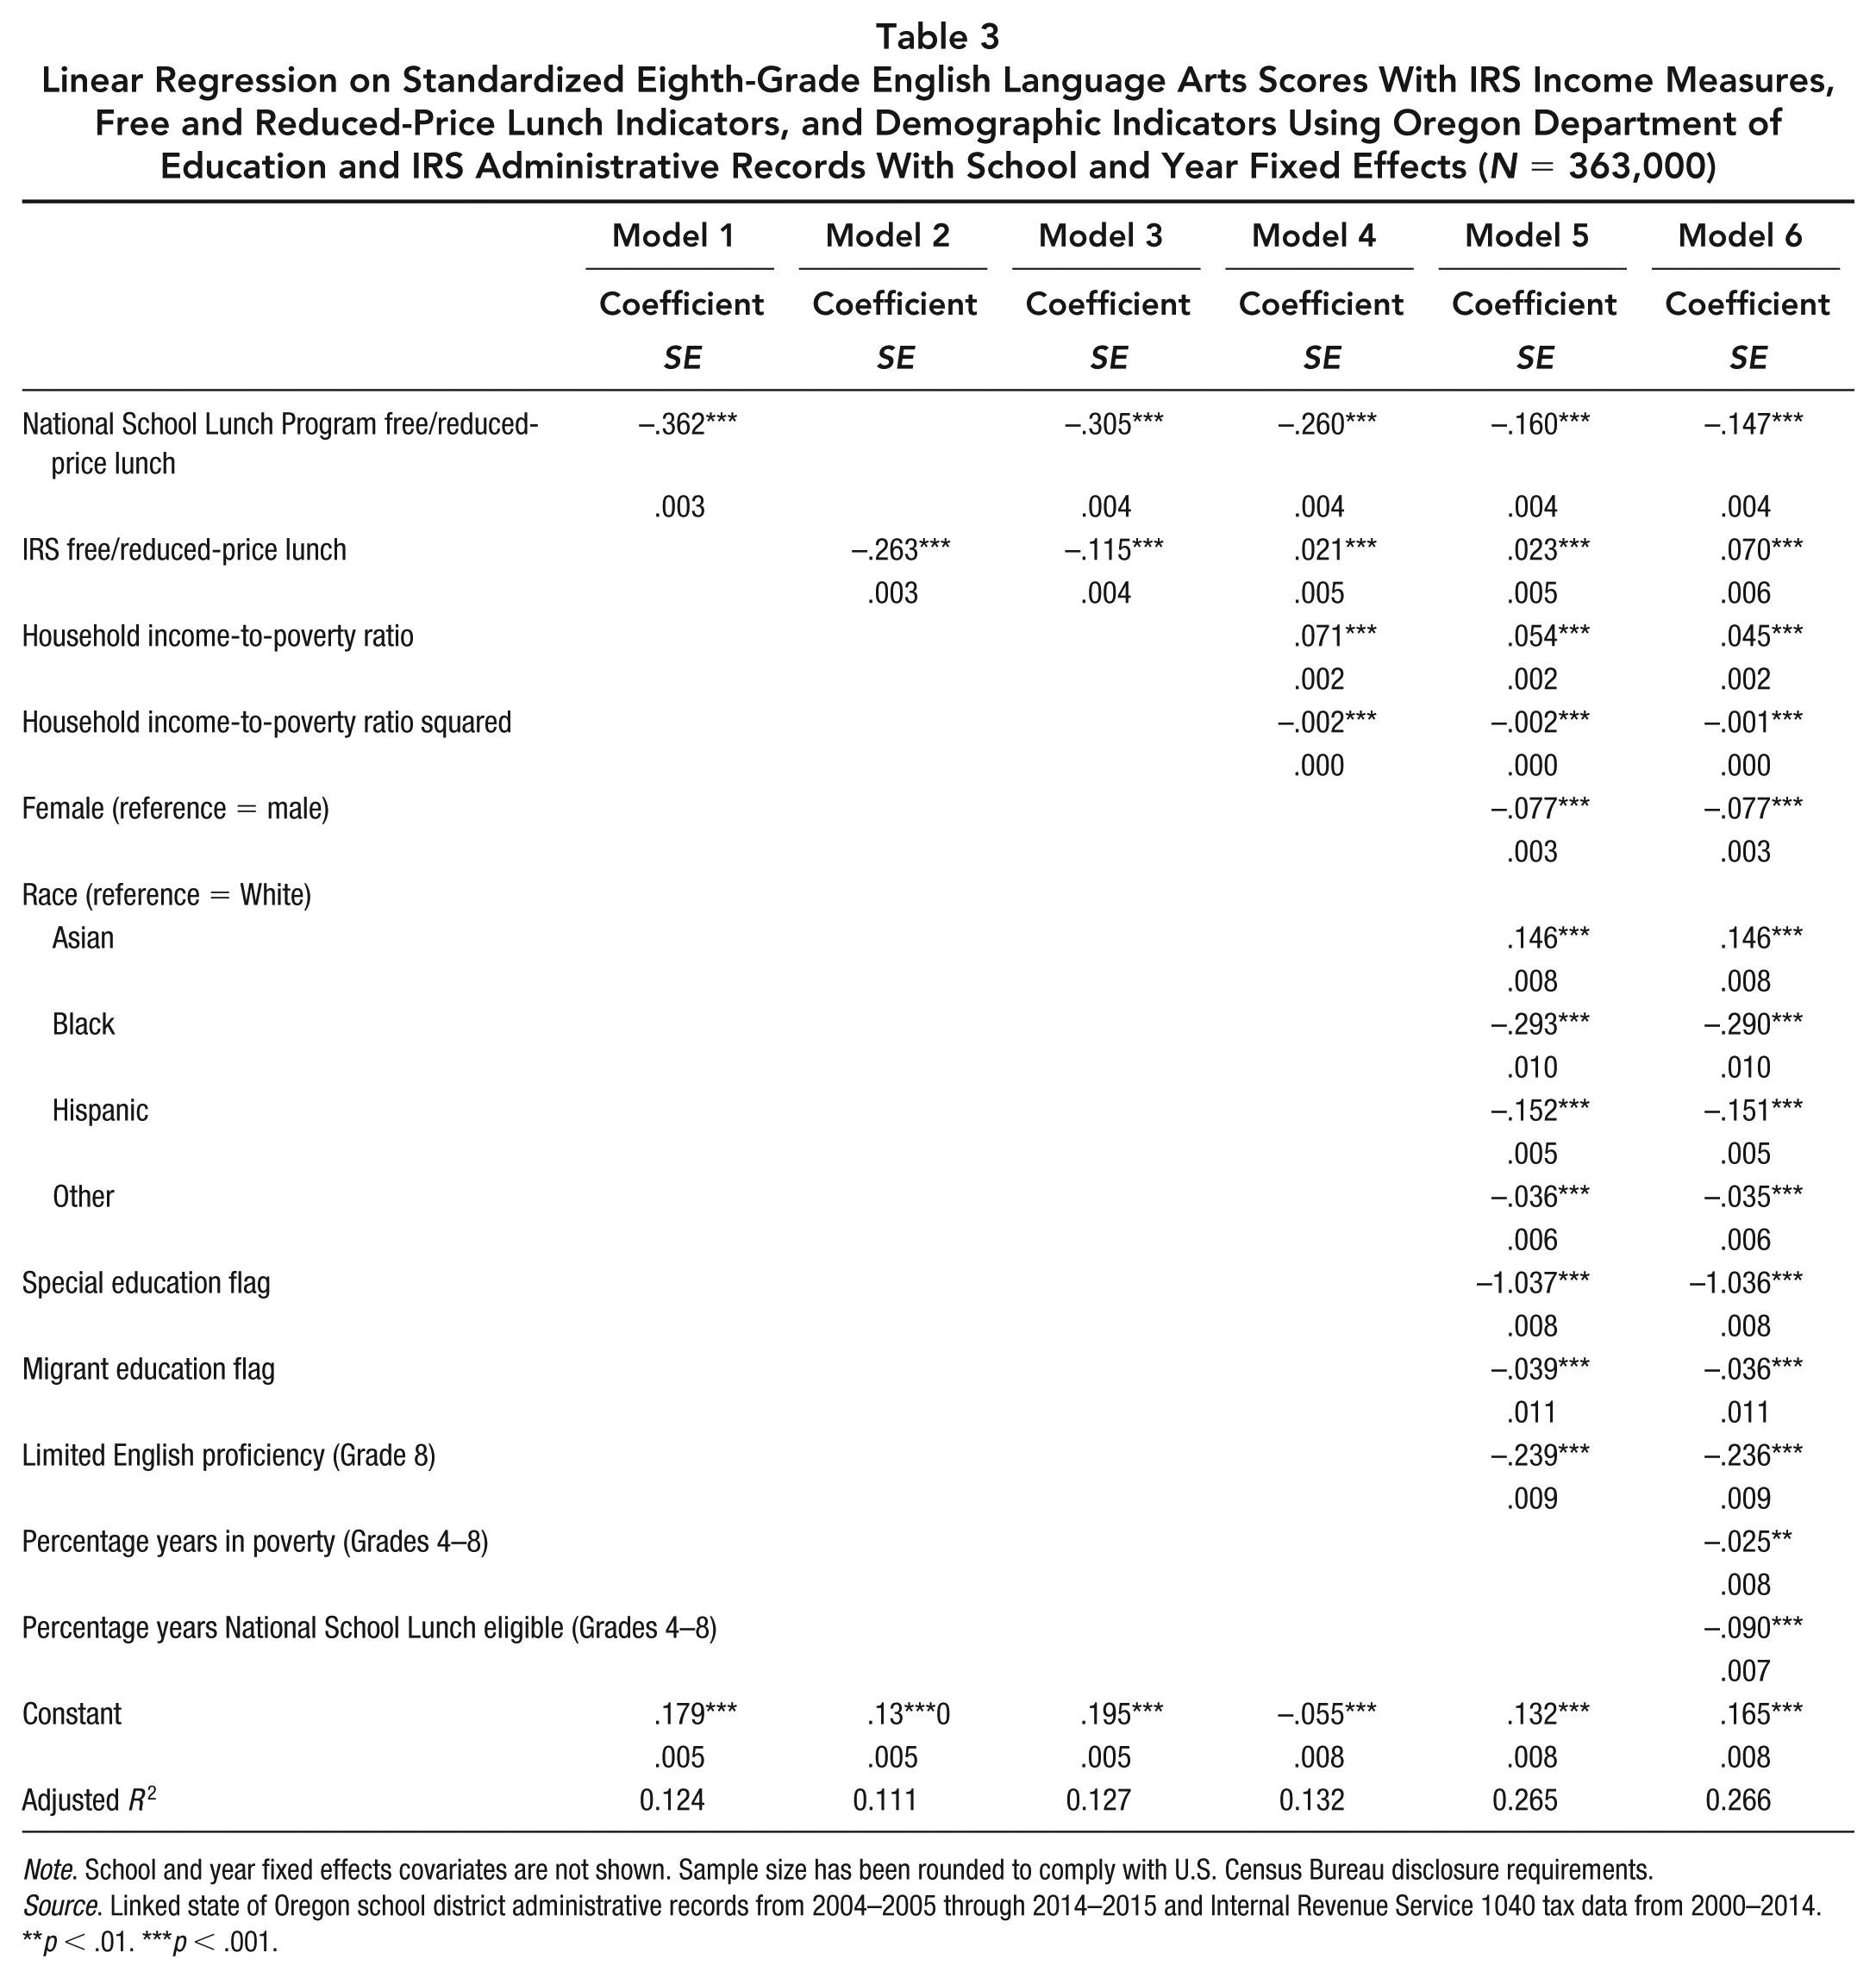
Tables 2 and 3 present results from OLS regression models examining the degree to which NSLP status and household income explain student ELA achievement in the California district and Oregon, respectively. Perhaps surprisingly, the results of these analyses indicate that school-reported FRPL status variables are more closely associated with student achievement on standardized tests in ELA than parallel categories constructed using IRS-reported household income.
Linear Regression on Standardized Eighth-Grade English Language Arts Scores With IRS Income Measures, Free and Reduced-Price Lunch Indicators, and Demographic Indicators Using California School District and IRS Administrative Records With School and Year Fixed Effects (N = 14,000)
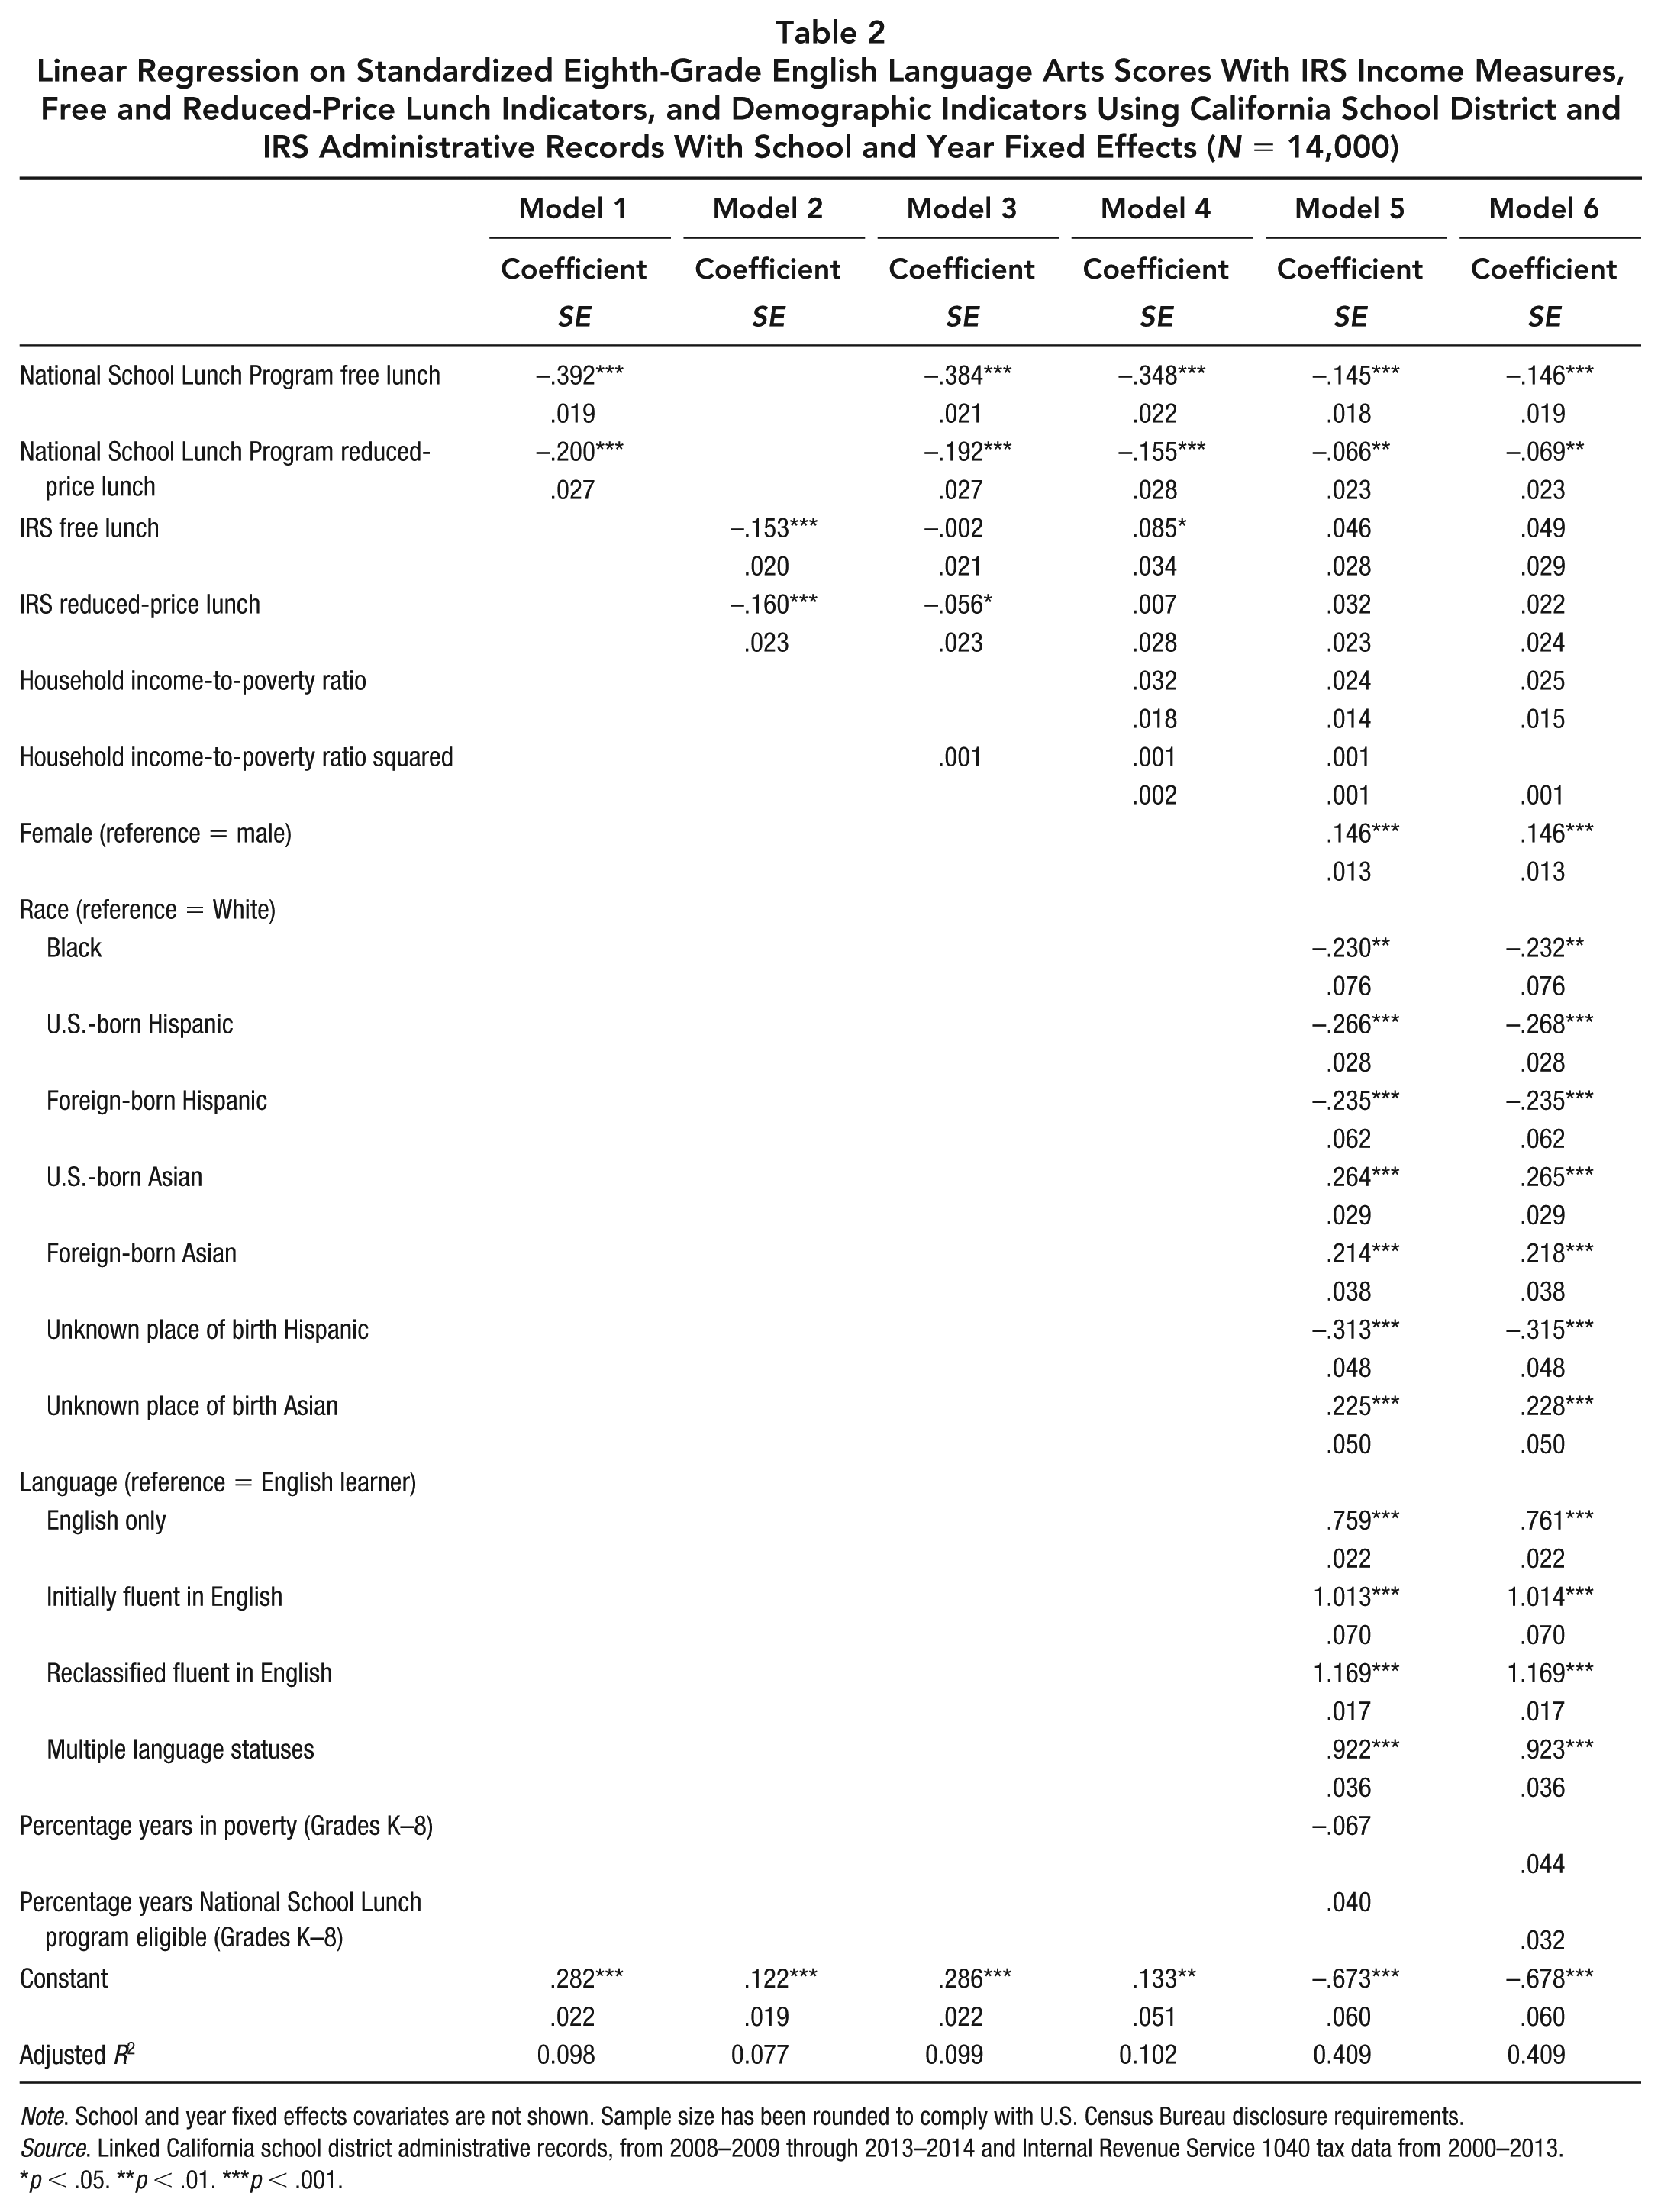
Note. School and year fixed effects covariates are not shown. Sample size has been rounded to comply with U.S. Census Bureau disclosure requirements.
Source. Linked California school district administrative records, from 2008–2009 through 2013–2014 and Internal Revenue Service 1040 tax data from 2000–2013.
p < .05. **p < .01. ***p < .001.
Linear Regression on Standardized Eighth-Grade English Language Arts Scores With IRS Income Measures, Free and Reduced-Price Lunch Indicators, and Demographic Indicators Using Oregon Department of Education and IRS Administrative Records With School and Year Fixed Effects (N = 363,000)
Note. School and year fixed effects covariates are not shown. Sample size has been rounded to comply with U.S. Census Bureau disclosure requirements.
Source. Linked state of Oregon school district administrative records from 2004–2005 through 2014–2015 and Internal Revenue Service 1040 tax data from 2000–2014.
p < .01. ***p < .001.
Results from the first model reported in Table 2 indicate that compared to non-FRPL students, students in the California district who are flagged as free lunch recipients score nearly 0.4 standard deviations lower on eighth-grade ELA tests and students who are flagged as reduced-price lunch recipients score 0.2 standard deviations lower than students who are not enrolled in FRPL. The R2 on this model is 0.098. Model 2 reports results predicting ELA achievement with IRS-validated income FRPL measures yielding a smaller R2 and coefficients than Model 1. Taken together, these results indicate that school-reported FRPL indicators explain more variation in ELA achievement than parallel variables constructed using IRS-reported household income. Interestingly, Model 2 also shows that students whose IRS-reported household income is less than 130% of poverty experience similar levels of educational disadvantage as students whose IRS-reported household income is between 130% of poverty and 185% of poverty (both score roughly 0.15 points lower than students who appear to be ineligible for FRPL based on their IRS-reported income).
The third and fourth models in Table 2 indicate that rather than being a simple but imprecise proxy for household income, FRPL enrollment appears to provide information about students that is unavailable in IRS-reported household income. We see in Model 3 that FRPL enrollment categories significantly predict ELA achievement after controlling for the IRS measures. Indeed, free lunch enrollment continues to predict ELA achievement even after controlling for linear and quadratic measures of IRS-reported household income-to-poverty ratios in Model 4.
Given that school-reported FRPL categories appear to contain information that is predictive of test scores above and beyond IRS-reported household income, we examine whether this might be explained by other student characteristics. Model 5 in Table 2 indicates that controlling for student race/ethnicity and language status substantially mitigates the relationship between school-reported FRPL categories and ELA achievement. However, even after including these demographic controls as well as controls for prior years of poverty from IRS records in Model 6, FRPL categories continue to predict ELA achievement. 14
Table 3 presents parallel models for the state of Oregon. The results of these models are strikingly consistent with the California district models. The administratively reported FRPL enrollment flag accounts for 16% of student-level variance in eighth-grade ELA scores, compared to just 13% of the variance for parallel flags constructed from IRS data. Further, FRPL enrollment continues to predict ELA achievement even after controlling for continuous measures of household income and other indicators of family background.
Discussion
Our analyses provide new evidence regarding the relationship between FRPL enrollment and socioeconomic and educational disadvantage. We find that while schools’ administrative FRPL category data are at best imperfect proxies for the household income of students in a given year, these data appear to capture additional aspects of disadvantage not captured by IRS income measures.
Before discussing the implications of these findings, we note several important data limitations. The most obvious of these is generalizability. Although we have consistent results from two distinct locations, future analyses should continue to investigate the extent to which the correspondence between NSLP participation and household income varies across schools, districts, and students’ grade level.
A second set of limitations involves measurement. Our IRS-validated household income measure captures income in a continuous fashion for all earners in a household from a broad array of sources, including employer W-2 earnings reports, investment returns, business income, and other sources. However, while the NSLP eligibility requirements are designed to extend nutrition support to students who are experiencing relatively short-term income fluctuations, our IRS income measure is not sensitive to month-to-month income volatility. Further, the calendar year covered by IRS data captures only a portion of the fall-to-spring school year. Additionally, we compute IRS household income based on all tax units in a household in an attempt to match the NSLP household definition, which includes all people that live together and share living expenses. However, this decision may lead us to overstate household income in cases in which individuals live in housing units without sharing living expenses. Finally, IRS data may undercount cash income and other informal income sources. In light of these measurement issues, it is important to recognize that our analyses cannot speak to questions around NSLP eligibility.
That said, these data provide previously unavailable information about the validity of FRPL data as a measure of socioeconomic disadvantage. In sum, our findings suggest that the quality of widely utilized FRPL enrollment variables depends on what precisely analysts want these data to measure.
Our analyses of the convergent validity of FRPL enrollment measures suggest that it may be inappropriate to think of FRPL as a proxy for household income. FRPL data do not capture student-level differences in household income-to-poverty ratios well. Likewise, school- and district-level aggregate measures of FRPL enrollment obscure important cross-school variation in school poverty and other school-level income measures. Our analyses raise important questions about the extent to which researchers and educators understand students’ household income and its relation to educational experiences.
At the same time, our predictive validity analyses indicate that FRPL enrollment predicts academic achievement more effectively than IRS-reported income data and that it continues to robustly predict achievement after controlling for household income. One potential explanation for this surprising finding is that enrolling in the FRPL program is itself an educational intervention. While it is unlikely that this nutritional intervention has unintended negative average effects on student achievement, the available evidence on this question is limited (for estimates of the educational consequences of FRPL in 1960s schools, see Hinrichs, 2010; for estimates of the effects of school breakfast programs, see Frisvold, 2015; Imberman & Kugler, 2014; Leos-Urbel, Schwartz, Weinstein, & Corcoran, 2013; Schanzenbach & Zaki, 2014). However, there is some evidence to suggest that FRPL carries a social stigma in certain settings (Poppendieck, 2011).
We believe a more likely explanation for the strong and robust negative association between FRPL enrollment and student test scores is that these measures tap into aspects of educational disadvantage that more precise IRS income data elide. Income volatility could be one such aspect. If students enroll in free or reduced-price lunch during periods in which their household incomes dip and if these income dips have long-term consequences for student achievement, NSLP enrollment may provide information that IRS-reported annual household income data—even over multiple years—do not. Additionally, educators may encourage students to apply for FRPL and provide families with application assistance based on their perceptions of student need. Consistent with this idea, we find that racial and ethnic minorities, special education students, and migrant students in Oregon enroll in free or reduced-price lunch at higher rates than expected based on their IRS-reported household income. Regardless of the precise cause, NSLP enrollment categories appear to reflect educational disadvantages that simple household income data and poverty line calculations overlook.
Our findings thus raise many questions for future analyses. Further research—both qualitative and quantitative—is needed to better understand the formal and informal processes that determine which children do and do not enroll in FRPL and the ways in which these enrollment processes vary across schools and districts. Future research should consider the ways in which FRPL enrollment patterns vary as students advance through school. Finally, we lack strong evidence regarding the consequences of FRPL for student school experiences and achievement outcomes.
In light of our findings, we believe that education researchers and policymakers need to reflect on what they mean by disadvantage and what they intend to measure when they use FRPL data. These data clearly capture important aspects of educational disadvantage. However, the nature of the disadvantage that FRPL captures is amorphous and may not be a simple function of family resources. From a policy perspective, federal and many state educational finance systems identify “high need” schools for targeted resources and other interventions based in part on the proportion of students in these schools who qualify for free or reduced-price lunch. If these criteria imprecisely distinguish poor and non-poor schools, they may impede efforts to provide educational opportunities for students from highly economically disadvantaged homes.
Footnotes
Appendix
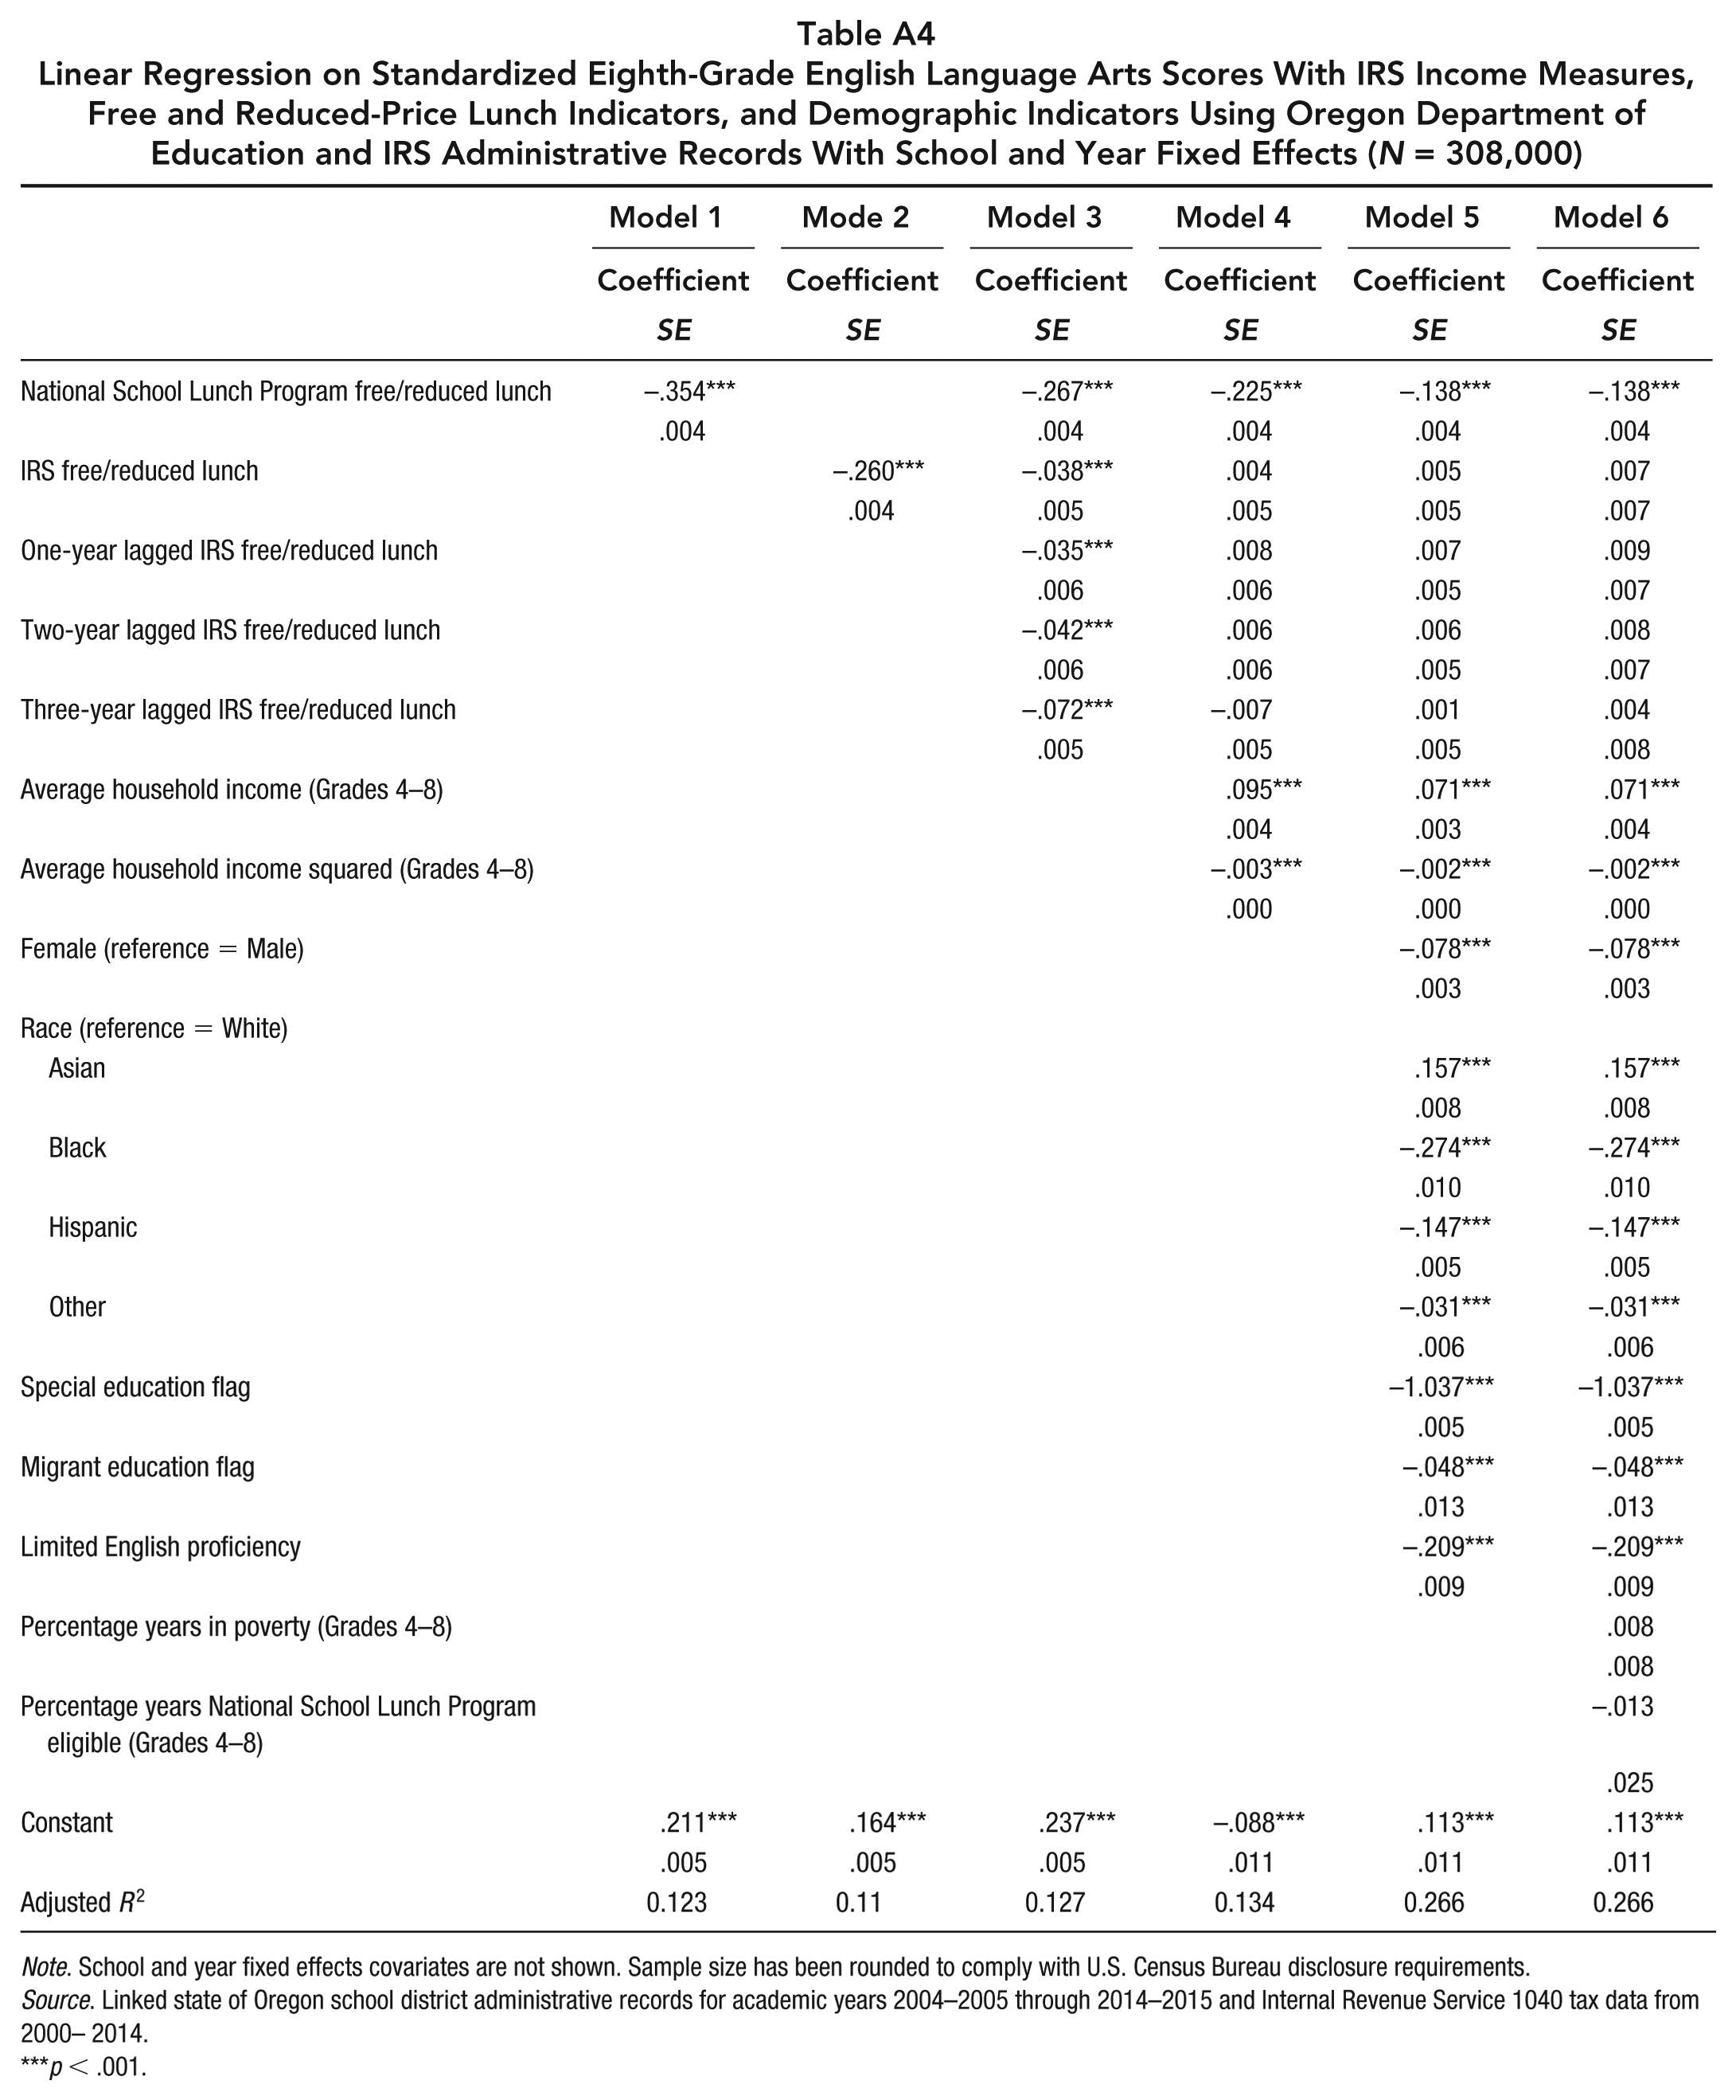
Linear Regression on Standardized Eighth-Grade English Language Arts Scores With IRS Income Measures, Free and Reduced-Price Lunch Indicators, and Demographic Indicators Using Oregon Department of Education and IRS Administrative Records With School and Year Fixed Effects (N = 308,000)
| Model 1 |
Mode 2 |
Model 3 |
Model 4 |
Model 5 |
Model 6 |
|
|---|---|---|---|---|---|---|
| Coefficient |
Coefficient |
Coefficient |
Coefficient |
Coefficient |
Coefficient |
|
| National School Lunch Program free/reduced lunch | −.354*** | −.267*** | −.225*** | −.138*** | −.138*** | |
| .004 | .004 | .004 | .004 | .004 | ||
| IRS free/reduced lunch | −.260*** | −.038*** | .004 | .005 | .007 | |
| .004 | .005 | .005 | .005 | .007 | ||
| One-year lagged IRS free/reduced lunch | −.035*** | .008 | .007 | .009 | ||
| .006 | .006 | .005 | .007 | |||
| Two-year lagged IRS free/reduced lunch | −.042*** | .006 | .006 | .008 | ||
| .006 | .006 | .005 | .007 | |||
| Three-year lagged IRS free/reduced lunch | −.072*** | −.007 | .001 | .004 | ||
| .005 | .005 | .005 | .008 | |||
| Average household income (Grades 4–8) | .095*** | .071*** | .071*** | |||
| .004 | .003 | .004 | ||||
| Average household income squared (Grades 4–8) | −.003*** | −.002*** | −.002*** | |||
| .000 | .000 | .000 | ||||
| Female (reference = Male) | −.078*** | −.078*** | ||||
| .003 | .003 | |||||
| Race (reference = White) | ||||||
| Asian | .157*** | .157*** | ||||
| .008 | .008 | |||||
| Black | −.274*** | −.274*** | ||||
| .010 | .010 | |||||
| Hispanic | −.147*** | −.147*** | ||||
| .005 | .005 | |||||
| Other | −.031*** | −.031*** | ||||
| .006 | .006 | |||||
| Special education flag | −1.037*** | −1.037*** | ||||
| .005 | .005 | |||||
| Migrant education flag | −.048*** | −.048*** | ||||
| .013 | .013 | |||||
| Limited English proficiency | −.209*** | −.209*** | ||||
| .009 | .009 | |||||
| Percentage years in poverty (Grades 4–8) | .008 | |||||
| .008 | ||||||
| Percentage years National School Lunch Program eligible (Grades 4–8) | −.013 | |||||
| .025 | ||||||
| Constant | .211*** | .164*** | .237*** | −.088*** | .113*** | .113*** |
| .005 | .005 | .005 | .011 | .011 | .011 | |
| Adjusted R2 | 0.123 | 0.11 | 0.127 | 0.134 | 0.266 | 0.266 |
Note. School and year fixed effects covariates are not shown. Sample size has been rounded to comply with U.S. Census Bureau disclosure requirements.
Source. Linked state of Oregon school district administrative records for academic years 2004–2005 through 2014–2015 and Internal Revenue Service 1040 tax data from 2000– 2014.
p < .001.