






Abstract
The Equality of Educational Opportunity Study (1966)—the Coleman Report—lodged a key takeaway in the minds of educators, researchers, and parents: Schools do not strongly shape students’ achievement outcomes. This finding has been influential to the field; however, Coleman himself suggested that—had longitudinal data been available to him—decomposing the variance in students’ growth rates rather than their levels of achievement would have provided a clearer insight into school effects. Inspired by an intriguing finding from an earlier study conducted in 1988 by Bryk and Raudenbush, we take up Coleman’s suggestion using data provided by NWEA, which has administered over 200 million vertically scaled assessments across all 50 states since 2008. We replicated Bryk and Raudenbush’s surprising finding that most of the variation in student learning rates lies between rather than within schools. For students moving from Grades 1 through 5, we found 75% (math) to 80% (English language arts) of the variance in achievement rates is at the school level. We find similar results in preliminary analyses of data from the Early Childhood Longitudinal Study-Kindergarten Class 1998-99 (ECLS-K:99). These results are intriguing because they call into question one of the dominant narratives about the extent to which schools shape students’ achievement; however, more research is needed. Our goal is to invite other scholars to conduct similar analyses in other data contexts. We delineate four key dimensions along which results need to be further probed, first and foremost with an eye toward the role of test score scaling practices, which may be of central importance.
Keywords
The Equality of Educational Opportunity Study (Coleman et al., 1966)—the Coleman Report—still undergirds the long-held understanding that schools play a limited role in shaping students’ outcomes. Because Coleman found that only 10% to 20% of the variation in student achievement scores lies among schools, it appeared that schools were simply not a powerful lever to affect students’ achievement relative to nonschool factors. This “schools don’t matter” narrative has long been taken up in a number of influential ways from both conservative and liberal perspectives (for a synthesis, see Hutt, 2017; Jencks, 1969). 1 Although critiques have been written 2 of the Coleman Report, this particular finding—the low proportion of variance in student achievement between (vs. within) schools—has been found many times over (for a compendium of intraclass correlations, see Bloom et al., 2007; Hedges & Hedberg, 2007).
The Coleman Report has led to a lasting pessimism about investing in school features because the results suggest that by the time students first arrive to school, their achievement is largely set. Ravitch (1981) captured this sentiment well when reflecting on the Report 15 years after its release: It is impossible to assess the damage done to the self-esteem of the education profession and the consequent demoralization of the very teachers dedicated enough to inform themselves about educational research. Whether students did well or poorly in schools seemed determined . . . little, if at all, by anything that teachers and schools did. (p. 719)
Given subsequent research that highlighted how the Coleman Report missed pathways through which schools affect students’ achievement, this pessimism was perhaps not entirely warranted. 3 Nonetheless, the Coleman Report’s findings continue to influence the field: A quick Google Scholar search returns over 1,600 articles that mention the “Coleman Report” since 2017 alone.
This raises perplexing questions: If it is really true that schools matter very little, how do we continue to justify research and investment on school-level programs, policies, and practices? How do we reconcile the seeming contradiction that school settings are deeply unequal and yet achievement is only weakly shaped by those inequalities? Why has this takeaway from the Coleman Report remained so pervasive even in the face of important critiques and developments? Whereas in fact, the concept of school-level value-added measures (Reardon & Raudenbush, 2009) offers a way to reconcile this seeming contradiction, that connection is indirect.
A Different Approach to Estimating School Effects
Coleman himself suggested that a better approach to capturing school effects would be to partition variation in learning rates—rather than levels—within and between schools.
4
He wrote: Had a number of years been available for this survey, a quite different way of assessing effects of school characteristics would have been possible; that is, examination of the educational growth over a period of time of children in schools. . . . This is an alternative and in some ways preferable method. . . . Thus, the present analysis should be complemented by others that explore changes in achievement over a large span of time. (Coleman et al., 1966, p. 292)
Students and their entering levels of achievement are allocated to schools in ways that are outside schools’ control. It makes sense, then, to not think of schools as influencing how students perform in a given grade but rather on how quickly they grow 5 over time. In 1988, Bryk and Raudenbush used Sustaining Effects Study data to implement Coleman’s recommendation. They adopted a three-level multilevel model 6 of vertically scaled test scores and partitioned variance within and between schools for both achievement status (akin to Coleman) and achievement rates from Grades 1 to 3.
With regard to status, Bryk and Raudenbush (1988) first replicated Coleman’s finding; only 14% of the variance in math achievement lies between schools (31% in English language arts [ELA]). However, their decomposition of the variance in learning rates showed a very different pattern. They wrote, “the results for learning rates, particularly in mathematics, are startling indeed. Over 80% of the variance in mathematics learning is between schools! These results constitute powerful evidence of school effects that have gone undetected in past research” (p. 96). Using Coleman’s own analytic recommendation, Bryk and Raudenbush’s results contradicted one of the key takeaways from the Coleman Report that schools must not have much impact on achievement. These findings are striking. However, they should also be revisited given that they were based on a small number of schools (86) with an average of only 7 students sampled per school or also could have been idiosyncratic to that particular test score scaling.
Current Analysis
We replicated and expanded on the Bryk and Raudenbush (1988) analysis, using a data set 7 provided by the NWEA, which has administered over 200 million assessments to nearly 18 million students in 7,500 districts across all 50 states in a very recent time period (2008–2016) wherein the average number of students per school is 118. Importantly, NWEA’s Measures of Academic Progress test is designed so that its scores can be expressed on a vertical scale (which NWEA calls the RIT 8 scale) and with the intent that it can be used to support equal-interval interpretations.
Before proceeding, we take a brief detour on achievement test score scaling. In theory, a vertical scale enables comparisons of student learning across grades, and the equal-interval property of the scale ensures that a unit increase in a student’s score represents the same learning gain across the entire score distribution. Because we attempt to trace learning growth across grades, vertical scaling was desirable, and interval scaling is essential for any test score comparison. However, there are many different ways of designing and calibrating a vertical scale, and there is little consensus with regard to the best methods for evaluating these properties (Briggs, 2013; Briggs & Dadey, 2015; Briggs & Domingue, 2013; Briggs & Weeks, 2009). Although some scaling practices are clearly not well suited for certain purposes, there will never be a way to identify the single correct scale. Because we do not have access to NWEA item-level responses, subsequent research is needed to probe sensitivity of our results to scale development practices.
We estimate a nested model with three levels: (up to) 10 test scores per student from Grades 1 to 5 in fall and spring (Level 1), students within schools (Level 2), and students across schools (Level 3). Just as for Bryk and Raudenbush (1988), this model allowed us to calculate the percentage of variance that lies across schools (intraclass correlations, or ICCs) both for achievement levels (like Coleman et al., 1966) and achievement growth (like Bryk & Raudenbush, 1988). In our primary specifications, 9 we used NWEA’s RIT scores at the outcome of interest. Here, we describe how results differed when we standardized within subject-grade-year. We also present results using a linear growth trajectory (Model 1) and a quadratic growth trajectory (Model 2). To consider the choice of functional form for growth, see Figure 1 to examine the observed RIT reading scores for 50 randomly sampled students. For a full discussion of functional forms considered and robustness of results to these choices, see Appendix A in the Supplemental Material available on the journal website. 10

Reading scores for 50 randomly sampled students.
Results
We report our ICCs alongside the relevant results from both the Coleman Report (Coleman et al., 1966) and the Bryk and Raudenbush (1988) study in Table 1 (for complete model results, including estimated fixed effects, variance components, 95% plausible value ranges, estimated total gains throughout the grade panel, and reliabilities, see Appendix C in the Supplemental Material available on the journal website). Our results replicated both the original Coleman Report ICCs as well as those from Bryk and Raudenbush’s study. In the left columns of Table 1 (variation in achievement levels), our results are largely consistent with the Coleman Report: Only 23.2% of the variance in math achievement levels lies between schools (21.1% in ELA). When it comes to linear growth rates (middle columns of Table 1), our results are quite similar to the surprising findings from Bryk and Raudenbush: The majority—75.4%—of the variance in math learning rates lies between schools (80.3% in ELA). This is similar to Bryk and Raudenbush’s estimate for math of 82.6% (although for ELA they found a somewhat smaller but still sizeable 42.5%).
Intraclass Correlations Across Studies: Proportion of Variance Between Schools for Achievement Levels, Linear Growth, and Growth Curve/Acceleration
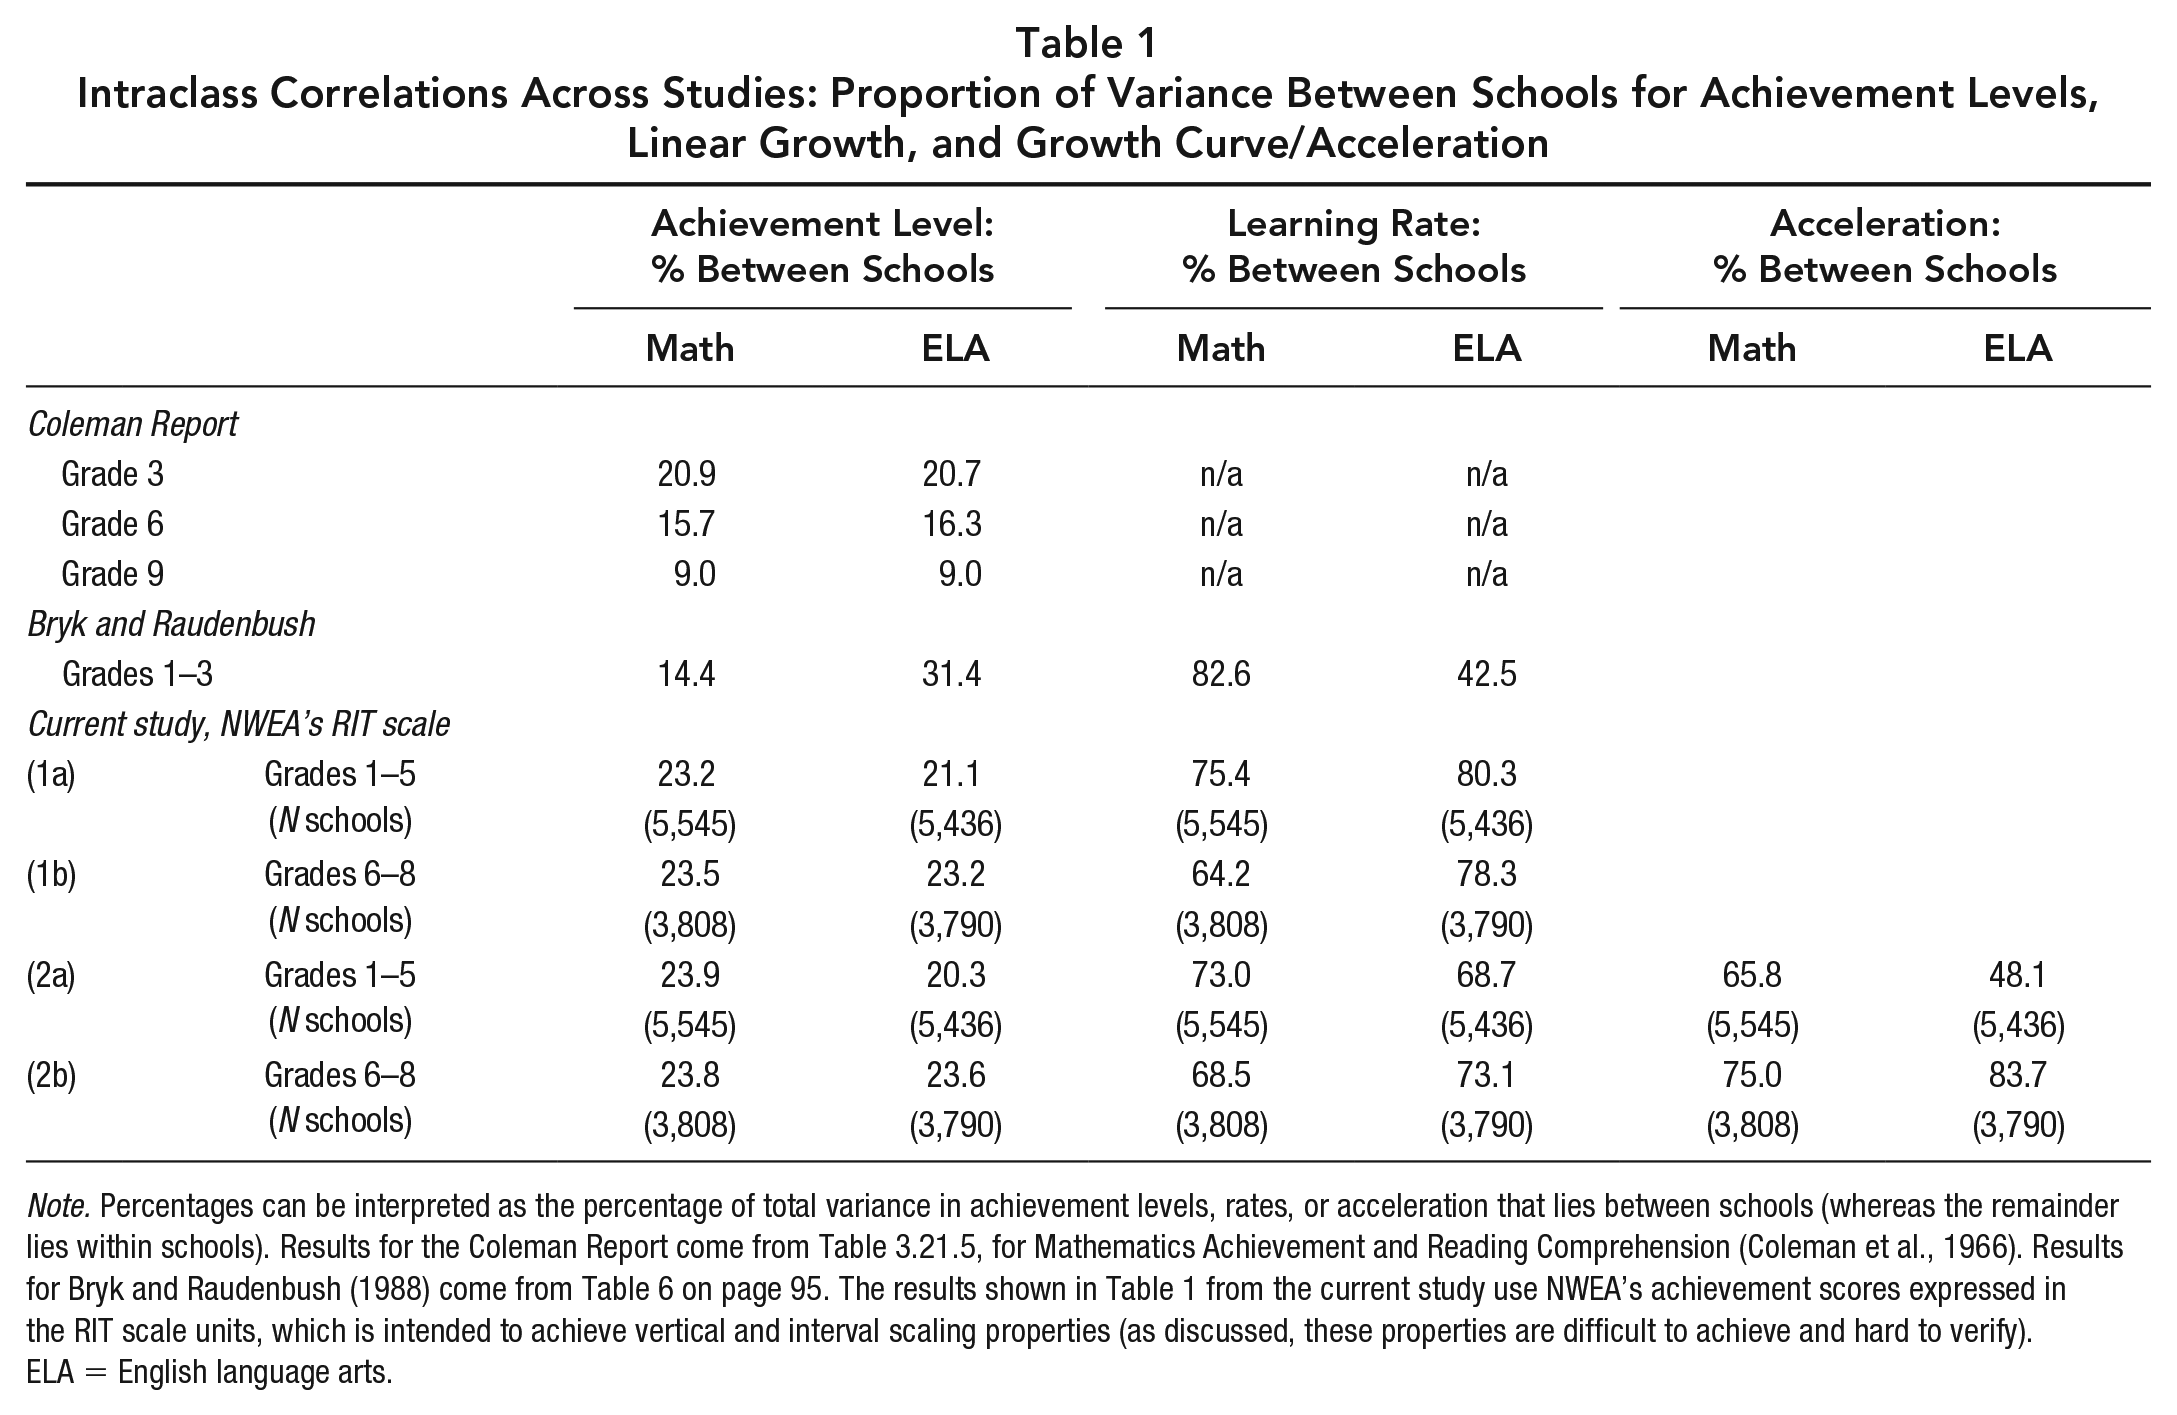
Note. Percentages can be interpreted as the percentage of total variance in achievement levels, rates, or acceleration that lies between schools (whereas the remainder lies within schools). Results for the Coleman Report come from Table 3.21.5, for Mathematics Achievement and Reading Comprehension (Coleman et al., 1966). Results for Bryk and Raudenbush (1988) come from Table 6 on page 95. The results shown in Table 1 from the current study use NWEA’s achievement scores expressed in the RIT scale units, which is intended to achieve vertical and interval scaling properties (as discussed, these properties are difficult to achieve and hard to verify). ELA = English language arts.
We also extended this analysis to Grades 6 through 8, shown in row (1b) of Table 1. Again, we found that the majority of the variation in achievement levels is within schools but that the majority of the variation in learning rates is between schools (64.2% in math, 78.3% in ELA). When using a quadratic growth model (Model 2) instead of a linear function, we again found that most of the variation in both instantaneous learning rates at the midpoint and acceleration of learning lies at the school level; see rows (2a) and (2b) of Table 1. 11 Moreover, we found that this pattern held when we considered other model specifications or analytic samples (see robustness checks 12 in Appendix C in the Supplemental Material available on the journal website).
To visually illustrate this finding, Figure 2 presents boxplots of estimated 13 achievement levels for the students nested within 20 randomly sampled schools (left) alongside a boxplot of schools’ mean achievement levels across all schools in the sample (right). Here one sees the classic Coleman pattern: Any given school seems to have a wide vertical distribution of achievement scores among its students, whereas the mean achievement levels (red dots) across schools are not very different from one another. In the lower panel of Figure 2, we make the same visualization for achievement rates and see the opposite pattern: Students in a given school exhibit similar learning rates to one another, and average learning rates vary considerably 14 from school to school.

Boxplots of empirical Bayes estimates both among students within a random sample of 20 schools (left) and across all schools (right). Achievement levels (upper) versus achievement rates (lower).
Finally, we simulated a more common policy context in which only spring test scores were available and scores were not vertically scaled. When we removed fall scores and standardized RIT scores within subject-grade-year, the findings changed. In these models, less than half of the variation in learning rates lies between schools (from 37% to 44%, see row [D] of Appendix Table C3 in the Supplemental Material available on the journal website). Of course, grade-standardized test scores are not designed to capture growth over time, so this is perhaps not entirely surprising. These results, which are consistent with results from at least one other study, 15 suggest that the practice of standardizing within subject-grade-year would likely mask our overall finding, which could explain why this result is not commonly reported. It also underscores the centrality of achievement scaling practices when examining variation in student learning trajectories.
Replication Efforts
We think the current results are intriguing because they call into question one of the dominant narratives about whether schools shape students’ achievement; however, more research is needed to understand them. Our results do not definitively establish that schools strongly shape growth rates, but rather, they raise the possibility that our conventional wisdom needs to be revisited. Our goal in this policy brief is to invite other scholars to conduct similar analyses in other data contexts, particularly where item-level data are available. Given that the current multilevel model is not particularly complex or novel, we anticipate that others either can or already have conducted analyses that would yield between-school ICCs in student growth rates. For instance, we are aware of at least three studies 16 that have implemented a similar multilevel model, and—although the published studies did not report the unconditional variances needed to calculate the relevant ICCs—the authors might be able to examine them retrospectively.
It is possible that our results are simply an artifact of NWEA’s scaling practices. To partially address this concern, we ran a similar analysis using the Early Childhood Longitudinal Study Kindergarten Cohort 1998–99 (ECLS-K:99) public use data set. Using a range of approaches to define the analytic sample and different growth functions, 17 preliminary results were consistent with NWEA patterns: The average ICC for achievement levels was 29%, the average ICC for linear growth rates was 59%, and the average ICC for rates of acceleration was 71% across specifications.
We encourage other researchers to reproduce these analyses along four key dimensions: First and foremost, for those who have access to item-level response data, sensitivity to scaling practices may be of paramount importance. Briggs and Domingue (2013) indeed found that their estimates of within-district (and residual) variance in student growth rates were nearly 3 times larger when using a z-score scale than when using a vertical scale, which means the vertical scale would produce larger ICCs. The degree of sensitivity to score scaling properties, they showed, is a function of differential scale expansion or compression across grades. On this point, von Hippel et al. (2018) showed that in ECLS-K data, inferences about whether achievement disparities grow as students move through school depends on whether one uses theta scores (in which variance is constant across grades K–2) or item-response theory (IRT) based scale scores (in which variance notably increases across grades). Together, this research suggests that measurement properties of achievement scores will be central to this story.
Second, we hypothesize that estimated ICCs in growth rates could be sensitive to a data set’s within- and across-school sampling frame. Most nationally representative data sets constructed by the National Center for Education Statistics (e.g., ECLS-K) sample a small number of students per school, which may hinder estimating reliable within-school variance parameters. Third, it will be important to continue to explore whether results are sensitive to the growth function specified and/or inclusion criteria for students in the analytic sample. Fourth, findings may in turn differ depending on the length of the longitudinal panel at hand as well as the grade range of study.
Takeaways
The narrative that schools play a relatively small part in shaping students’ achievement, which has roots in the Coleman Report, remains a powerful demotivator in research about the U.S. public education system. That finding has also managed to transcend the divide between research and public discourse, affecting how parents, the media, and policymakers think about the value of public schooling. Yet if our results were to hold, it suggests a need to update this conventional wisdom. Although it is true that students enter kindergarten with a wide range of school readiness, students’ school age outcomes might not be as fixed as is widely believed. Our estimates suggest that students appear to vary more from school to school in terms of how fast they grow. Although schools may not have much control over who enrolls, they may have an impact on how fast students’ achievement improves.
The Coleman Report is often required reading for new graduate students in schools of education; as it should be, given its undeniable impact on the history of U.S. public education. However, when students learn about Coleman et al.’s (1966) finding that only 10% to 20% of the variation in student achievement exists at the school level, we should also point to subsequent research about the many school factors that do affect students’ outcomes. Graduate students often walk away from the Coleman Report with a forever-damaged perception of schools as a limited lever for change. The simple analyses presented here provide one way to understand how this Coleman Report ICC statistic (and all those that followed) could be correct but at the same time may only partially capture the role of schools in shaping students’ outcomes.
Finally, while conducting these analyses, schools across the world are currently shut down by the COVID-19 pandemic. If our results hold, it suggests that schools will likely play a crucial role in students’ recovery from widespread school closures and other related social, economic, and health care crisis from the pandemic. Given the uncertainties of what school will look like in the upcoming school years, we will need revisit these questions using data from the post-COVID period.
Supplemental Material
Atteberry_Online_Supplement – Supplemental material for Not Where You Start, but How Much You Grow: An Addendum to the Coleman Report
Supplemental material, Atteberry_Online_Supplement for Not Where You Start, but How Much You Grow: An Addendum to the Coleman Report by Allison C. Atteberry and Andrew J. McEachin in Educational Researcher
Footnotes

Notes
Authors
References
Supplementary Material
Please find the following supplemental material available below.
For Open Access articles published under a Creative Commons License, all supplemental material carries the same license as the article it is associated with.
For non-Open Access articles published, all supplemental material carries a non-exclusive license, and permission requests for re-use of supplemental material or any part of supplemental material shall be sent directly to the copyright owner as specified in the copyright notice associated with the article.
