






Abstract
How are teacher pension benefits funded? Under traditional plans, the full cost of career teachers’ benefits far exceeds the contributions designated for them. The gap between the two has three pieces, which may (with some license) be mnemonically tagged the three R’s of pension funding: redistribution, return, and risk. First, some contributions made for the benefits of short-term teachers are redistributed to fund the benefits of career teachers. Second, pension plans assume rosy returns on their investments, which push costs onto future teachers and taxpayers. Finally, the risk inherent in providing guaranteed pensions carries other costs, tangible and intangible, notably including the nontrivial risk of insolvency, which would dramatically raise mandated contributions and endanger future teacher benefits. I quantify these three components of the gap between benefits and contributions using the same metric as annual contributions. Illustrating with the California plan, I find the full cost of a career teacher’s annual accumulation of benefits can be as high as 46.6% of earnings, nearly triple the corresponding contributions of 17.5%. To understand this gap, which fiscally affects all areas of education policy, researchers and practitioners may find it helpful to think of the three R’s of pension funding: redistribution, return, and risk.
Introduction
How are teacher pension benefits funded? In 401(k)-style plans, the answer is simple: A member’s benefits are funded by the contributions of the member and her employer over the course of her career. But this is not the system we have for teachers. Under traditional plans, where members are promised a specific (defined) benefit, the full cost of that benefit for a career teacher far exceeds the contributions made on her behalf. The gap between the two has three pieces, which may (with some license) be mnemonically tagged the three R’s of pension funding: redistribution, return, and risk—which can be explained more specifically as follows:
Redistribution from early leavers to stayers: Most teachers earn little or no employer-funded benefit if they leave before about age 50. The employer contributions made on their behalf help fund the benefits of those who stay longer. This is intragenerational redistribution.
Costs of unfulfilled returns: Much of the contributions for future teachers will go to cover unfunded benefits for today’s teachers, just as much of today’s contributions go to cover unfunded benefits from the past. The main source of underfunding has been overoptimistic assumptions of the expected return on investments. This keeps contributions low in the short run but ultimately generates higher contributions and/or lower benefits for future entrants. This is intergenerational redistribution.
The cost of risk: Teachers are promised fixed benefits, largely funded by investment in risky assets. Returns fluctuate dramatically, and contributions do not readily adjust in the short run. In addition, the plan’s assumptions about mortality, early retirement, and wage growth are also risky. This tension between fixed benefits and risky funding imposes costs that are off-the-books under public pension accounting. These costs—both tangible and intangible—derive from uncertainty regarding the level and fluctuations of required public contributions, the political risk of cutting benefits for new teachers when assumptions do not pan out, and, in extremis (albeit less “extremis” of late), the risk of fund insolvency, incurring a host of additional costs. These costs of uncertainty are ultimately borne by the public and future teachers.
In this article, I quantify these three components of the gap between benefits and contributions in a simple integrated framework, using the same metric as annual contributions. Illustrating with the California plan, I find the full cost of a career teacher’s annual accumulation of benefits can be as high as 46.6% of earnings, nearly triple the corresponding contributions of 17.5%. The impact of such a gap on school budgets and all areas of educational policy cannot be overstated.
K–12 pension costs have risen dramatically over the past two decades. Employer contributions now account nationally for about $1,600 per pupil, up from $500 (inflation adjusted) since 2001 (Costrell, 2015). 1 The fiscal stress occasioned by this rise has squeezed salaries and likely constrains other classroom expenditures in an era of tightening revenues. This growth in pension costs represents the payments due on the rise in unfunded benefits earned in the past. Going forward, newly earned benefits continue to cost more than the contributions designated to fund them. To understand this huge gap, educational researchers and practitioners may find it helpful to think of the three R’s of pension funding: redistribution, return, and risk.
The Annual Cost of Funding Retirement Benefits: Background and Basic Concept
Consider a standard retirement plan in the private sector—a 401(k)-style plan. This is referred to as a “defined contribution” (DC) plan. The annual cost of funding such a plan is straightforward: The employee contributes, say, 10% of salary, and the employer matches with, say, 5% to an individual retirement account. The cost of the plan is 15% of the salary, split, as specified, between employer and employee. There are various details, but the general idea is simple: The cost of the plan is fully captured by the contribution rate, as advertised. There are no hidden costs to be paid later. There are no hidden subsidies from some employees to help cover the retirement costs of other employees: Each employee has his or her own retirement account. The ultimate retirement benefit is uncertain, depending on the choice of investments and the return, but the cost is not. The contribution is well “defined” in a DC plan.
Teacher retirement plans are different. They are “defined benefit” (DB) plans. The benefit is well-defined, by a formula traditionally based on years of service, final average salary, and age of retirement. The annual cost, however, is harder to discern. There are the out-of-pocket contribution rates for employee and employer, but these are only the beginning of the story. Since these contributions go into a pooled pension fund, rather than individual retirement accounts, part of the contributions for some employees (typically short-termers) go to fund the benefits of others (career teachers). Even taken all together, the contributions designated to cover the benefits of current teachers typically fail to do so. Ultimately, current contributions will be supplemented by future taxpayers and teachers, just as current contributions cover past unfunded benefits. Cuts to future teacher benefits also loom. Finally, there are the hidden costs of funding guaranteed pensions (“defined benefits”) from risky investments, often intangible but also including the prospect of very tangible costs in the event of future insolvency.
All of these costs can be estimated on a common basis, as a percentage of salary, comparable with the contribution rates in DC plans. The technical term for the cost of newly earned benefits is the plan’s “normal cost.” The standard measure of the normal cost is the annual contribution rate (from employee plus employer—the joint rate), collected over employees’ careers, which would fund the benefits for any given cohort of entering teachers. These contributions are designed to accumulate over time and earn interest—or a return on investment—that will be sufficient to fund retirement benefits when the time comes (or refunds for the cohort’s early leavers). In this article, I extend this measure to convey the explicit and hidden elements of a teacher pension plan’s costs, including both present contributions, likely hikes in future contributions or cuts in benefits for future teachers, and other intangible costs of risk. In short, my analysis will build on the basic standard measure of the annual contribution rate for newly earned benefits, adapting it in three ways to capture the full costs of teacher pension benefits, reflecting our three R’s: redistribution, return, and risk.
Redistribution: Individual Versus Average Cost of Funding Retirement
Employer and employee contributions go into a pooled pension fund rather than individual accounts. The cost rate designed to fund the benefits of the whole cohort is a weighted average of the cost for each individual. These individual cost rates vary widely; it costs much more on an annual basis to fund the benefits of a career teacher who retires at or beyond the “normal retirement age” than a teacher who leaves early. And yet the annual contributions made by or for each teacher are the same. Thus, a career teacher will earn benefits that cost much more than the contributions made on her behalf, and conversely, a short-term teacher earns benefits that cost much less—often little more (and possibly less) than her own individual contribution. Some portion of the employer contributions for the short-termer help fund the benefits of the career teacher. In this sense, there is a redistribution of those contributions.
To illustrate, consider the California State Teachers’ Retirement System (CalSTRS). 2 Based on the plan’s benefit formula for recent hires and its actuarial assumptions, I calculate the individual cost rate by age of entry and of exit. It is the annual contribution rate, collected over such an individual’s career, that would fund her benefits. Figure 1 depicts these cost rates for an individual exiting at any given age, averaged over all entry ages. The highest cost rate is for a career teacher, exiting at age 65. 3 It would require contributions of 21.3% per year throughout her career to fund her expected retirement benefits.
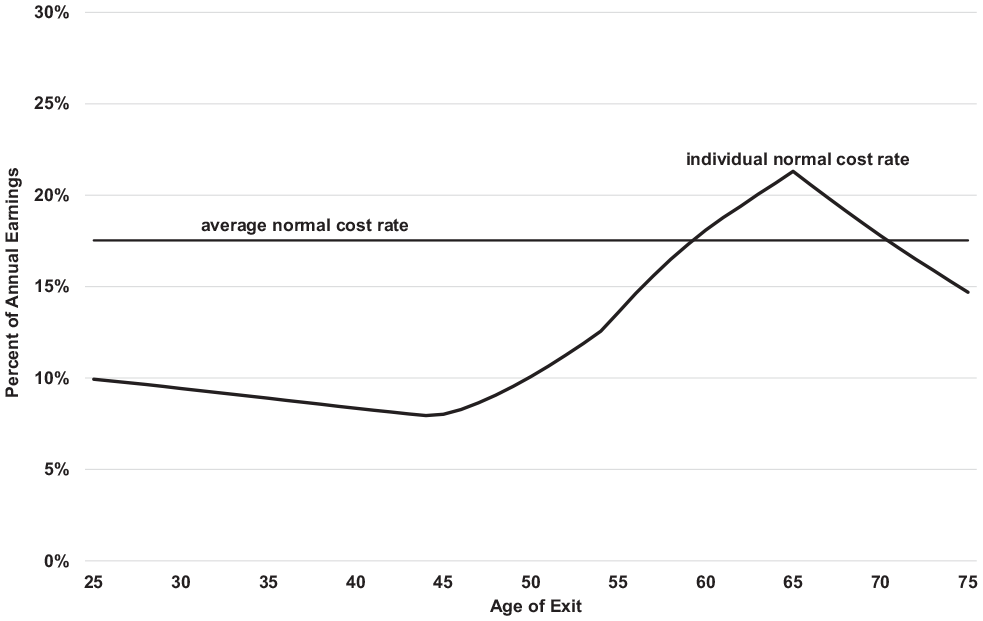
Normal cost rates, 7% return assumed by plan (estimated using 2019 CalSTRS assumptions and benefit formula for new hires, slightly modified). From “Recent Research on Teacher Pension Funding, Benefits, and Policy Debates,” by R. M. Costrell and J. B. McGee, in T. Downes and K. M. Killeen (Eds.), Recent Advancements in Education Finance and Policy (p. 404), 2022, IAP. Reprinted with permission.
For those who exit early, however, the cost is very different. Those who exit before vesting (at 5 years of service) are only entitled to a refund of their own contributions, which are 10.2% of the salary. The cost of providing these refunds is even lower, since the plan assumes it will earn 7% return on those funds and pays only 3% interest to the member on withdrawal. Even after vesting, it takes some years of service for the cost of the pension to surpass the cost of the refund because the pension must be deferred until age 62. The average entrant would be better off taking the refund than the pension all the way up to an exit age of 45 (the point at which the individual normal cost curve bottoms out and turns up in Figure 1). Throughout this period, the contribution rate needed to cover the refund falls as the difference accumulates between the plan’s assumed investment return and the interest paid to the member. For exit age 45, the individual’s refund could be funded with contributions of only 8.0% per year. The difference between the low annual cost of funding short-termers and the high cost of funding career teachers is a manifestation of the well-known backloading of benefits that favors long-termers under traditional pension formulas (Costrell & Podgursky, 2009).
This wide variation among individual cost rates contrasts with the uniform contribution rate designated to cover newly earned benefits for the cohort taken as a whole—the overall normal cost rate. This is a weighted average of the individual cost rates, depicted in Figure 1 by the horizontal line at 17.5%. This is the number typically reported as the cost of teachers’ benefits. The gap between Figure 1’s curve for individual cost rates and the horizontal contribution line represents the redistributions. Those above the line receive benefits that are partly funded from the contributions made on behalf of those below the line. So, for example, an individual who leaves at age 45, with benefits that cost only 8.0% of earnings, is effectively seeing almost 10 percentage points worth of contributions redistributed to fund the benefits of others. Conversely, the benefits for an individual exiting at age 65, which cost 21.3% of earnings, are effectively being funded by contributions for others of almost 4% of earnings, on top of the contributions made by or for herself.
These redistributions are built into the funding plan. The plan counts on using some or all of the employer contributions made on behalf of those below the horizontal line—plus, the plan’s profits on refunded employee contributions—to help fund the benefits of career teachers. This is the first departure from the DC funding model, where an individual’s benefits are funded entirely by the person’s own contributions and the employer match. In a traditional DB plan, career teachers’ benefits are funded additionally by contributions redistributed from short-termers.
Return: Future Payments due to Today’s Overly Rosy Expectations
The analysis above would be the end of the story if everything went according to plan. Contributions at the overall normal cost rate would cover benefits for the cohort as a whole (if not each individual), and there would be no need for extra future contributions to fund benefits earned today. In actuarial language, there would be no unfunded liabilities—no pension debt to be paid off at some point in the future. As we all know from the headlines, however, that has not been the case for some time. Pension funds are carrying large debts and are paying far more than the cost of benefits earned today. These extra contributions, over and above the normal cost, are payments on the pension debt—analogous to mortgage payments on a house. In the case of CalSTRS, these payments are currently running at about 18% of payroll—doubling the contribution rate for normal costs alone.
There are several historical reasons for this, but the main reason has been overoptimistic assumptions for the return on investments (Costrell, 2018a). Rosy scenarios are appealing to pension plans (as to all of us) because they allow the plans to keep contributions lower than would otherwise be required. Long after the bull market of the 1990s had passed, most plans continued to assume their investments would earn 8% or more annually, year after year. Clearly this became untenable following the crash of 2008. Starting in 2010, for example, CalSTRS gradually reduced its assumed return from 8.0%, finally reaching its current rate of 7.0% in 2017. In the meantime, however, the actual market return for CalSTRS over the period 2001–2019 has been 5.8%. The failure to meet expectations and to pay down its growing debt led to the current situation. It is now paying 18% of payroll, on top of normal costs, in an attempt to pay off its pension debt by 2046. Thus, CalSTRS—like almost all teacher pension plans—is paying extra now for benefits earned by prior cohorts, on top of its payments estimated to fund benefits earned by current teachers.
These debt payments today are indicative of how costs can be shifted forward again, from current cohorts to future ones. However, these extra costs from past shortfalls do not directly represent the underfunding of currently earned benefits to be paid in the future. That is, today’s debt payments do not necessarily predict future debt payments, arising from the failure to fully fund today’s earned benefits. Indeed, current assumptions are more conservative than past ones (7.0% assumed return instead of 8.0%), so the contributions calculated to cover new benefits today are higher than they would be if calculated under the old assumed return. Moreover, if all current assumptions were to hold, debt payments would go away by 2046, and contributions would fall in half to the normal cost alone. That is, indeed, CalSTRS’s published projection.
That said, there is good reason to suspect that current assumptions may still be too optimistic, in which case the contributions made to cover currently earned benefits (17.5%) would not suffice. New pension debt would accrue, raising future contributions once more, even after past pension debts are paid down. Suppose for example, that future investment returns average 6.0% (slightly better than CalSTRS’s actual record from 2001 to 2019) instead of 7.0%. Figure 2 depicts what normal costs would be under this assumption.
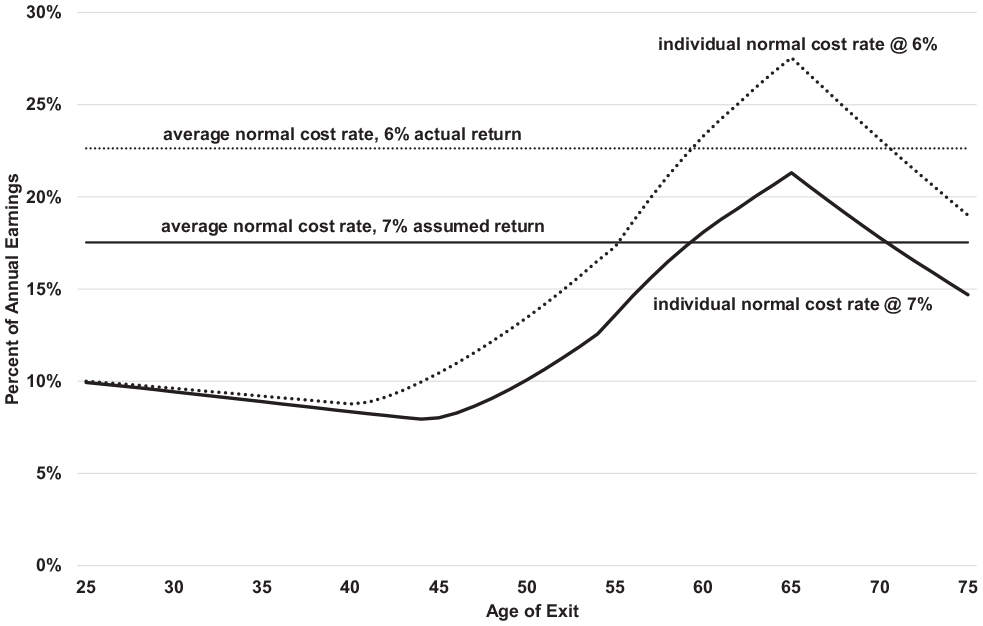
Normal cost rates, 6% actual return versus 7% assumed (estimated using 2019 CalSTRS assumptions and benefit formula for new hires, slightly modified). From “Recent Research on Teacher Pension Funding, Benefits, and Policy Debates,” by R. M. Costrell and J. B. McGee, in T. Downes and K. M. Killeen (Eds.), Recent Advancements in Education Finance and Policy (p. 408), 2022, IAP. Reprinted with permission.
Overall, the normal cost rate would be 5.1 percentage points higher at 6.0% return than at the currently assumed 7.0% (compare the dotted horizontal line with the solid one). This 5.1% figure represents the extra contributions that would be required to cover the cohort’s benefits earned today but not funded by current contributions. They would have to be made good in the future. These extra future contributions would retroactively fund benefits that are concentrated among today’s career teachers. As the previous section showed, the benefits for those teachers are already being funded, in part, by contributions made on behalf of short-termers, so the extra future contributions for them are on top of that. For example, the benefits of those retiring at age 65 would cost 27.5% of earnings over their careers, of which 17.5% is covered by current contributions, 3.8% by contributions made on behalf of others, and 6.2% by future contributions. These are represented in Figure 2 by comparing the dotted curve, the solid curve, and the solid horizontal line.
It may be noted that the overall rate of unfunded normal costs, 5.1 percentage points, is much lower than the current rate of debt payments, 18 percentage points. However, this does not mean that contributions will go down after the current debt is paid off. The fact that currently earned benefits are not being fully funded in this scenario means that new debt is accruing. Thus if in the future normal costs are more fully funded, at a higher rate (adding 5.1 points to the current 17.5), there will also be contributions required to pay down the additional debt that is likely accumulating now.
Finally, the scenario considered thus far assumes the returns on investment are certain at 6.0%, year after year. There is, of course, uncertainty on that return, as well as its annual fluctuation, and other variables as well. These risks carry additional costs, to which we now turn, as the third R, the additional costs of risk.
Risk: The Hidden Costs, Tangible and Intangible 4
There are a host of costs, thus far not considered, embedded in the very nature of DB pension plans that fund risk-free benefits from investments in risky assets. As illustrated in Figure 2, the first obvious risk is simply that the assumed return on investments may be overly optimistic: 6.0% is arguably more realistic than 7.0%. But even 6.0% is an estimate of the expected return, which is an average of possible outcomes. The long-run return may well be lower than 6.0%, in which case the contributions that would be required to fund benefits as they are earned would exceed those depicted in Figure 2.
In addition, even if the long-run return clocks in at 6.0%, pension plans incur costs from year-to-year volatility. These include the tangible and intangible costs of fluctuating contributions to offset this volatility. They also include the risk of insolvency if bad years precede good ones (Boyd & Yin, 2018). Costrell and McGee (2020) estimate for CalSTRS that, even with long-run returns at 6.0% and contributions at the 2018 rate, market fluctuations would generate a 15% chance of insolvency within 30 years. Insolvency means guaranteed benefits must be funded at the pay-as-you-go rate, which would mean a jump in contributions of more than 20 percentage points.
Over and above risky investment returns, there are risks in a variety of other actuarial assumptions (mortality, retirement rates, salary growth, etc.) on which the contributions are based. If any of these assumptions turn out to be overly optimistic, benefits will again turn out to be underfunded, and hidden costs will emerge.
One approach to totaling up the costs of risk would be to itemize and price the separate costs identified above, along with other intangibles. Alternatively, I will use a direct and comprehensive approach, based on a fundamental tenet of finance economics: The full cost of risk-free benefits is evaluated using the return on risk-free assets rather than risky ones (Biggs, 2011; Brown & Wilcox, 2009; Novy-Marx & Rauh, 2009). The return on risk-free (or low risk) assets is lower than the expected return on risky assets. The difference, known as the “risk premium,” is the market measure of what investors are willing to pay to avoid the costs of risk. Thus, the full cost of risk-free benefits is much higher than that calculated by public pension plans.
To understand this principle, consider an alternative pension portfolio. To avoid all costs of investment risk, the pension plan would have to fully hedge with fixed-income assets that match the plan’s income stream to its payment obligations. That is, instead of the current portfolio, typically about 75% risky assets and 25% fixed income, plans would have to shift entirely to fixed-income assets. This would call for higher contributions to acquire these assets, since their returns are lower and more assets would be required to fund a given stream of benefits. The difference between the two contribution rates is the extra cost of providing the pension guarantee. Plans may well decline this alternative, choosing to continue funding promised benefits with risky investments, acquired with lower contributions, but the costs of risk (tangible and intangible) do not go away—they are still borne by the plan. Recognizing this principle, the financial reporting rules for private sector DB plans require them to calculate the full cost of their obligations using a “discount rate” 5 equal to the low-risk return on high-grade corporate bonds, regardless of the plan’s actual portfolio.
An alternative way of understanding this principle is to consider the market value of the guaranteed benefits. For an individual to obtain such an income stream, he or she would have to buy an annuity, priced in the market using a low-risk interest rate. Again, such an annuity would cost far more than what public pension plans calculate for the cost of the equivalent pension, using the expected return on a risky portfolio. The point here is this: The guarantee on a teacher’s pension has a high market value. This is not a controversial statement; both defenders and critics of DB pension plans make the same point—that a guaranteed pension has greater value than a DC plan, where the risk is borne by the individual instead of the plan. However, there is no free lunch: The full cost of providing this guarantee is borne by the DB plan, even if it is off-the-books. 6
To summarize, the full cost of guaranteed pension benefits, as they are earned, is the normal cost calculated with a low-risk rate of return rather than the expected return on risky assets. Figure 3 provides my estimates using a 4.0% discount rate, which is about the return on high-grade corporate bonds used to evaluate the cost of private sector DB plans. I find that the full cost of CalSTRS benefits is 38.8%. This is more than double the normal cost contributions of 17.5%, calculated at the plan’s assumed return of 7.0%. The extra 21.3% includes the cost of overestimating the long-run return on risky assets (illustrated here by the extra 5.1% contributions if the long-run return is 6.0%) and the other tangible and intangible costs of risk (illustrated by the extra 16.2% between the top two horizontal lines). Of course, we do not know what the true dividing line is between these two costs of risk (i.e., what the true overestimate is for long-run expected return), but we do know that the market value of the guaranteed benefits exceeds the reported cost of newly earned benefits by more than 20% of earnings, as depicted.
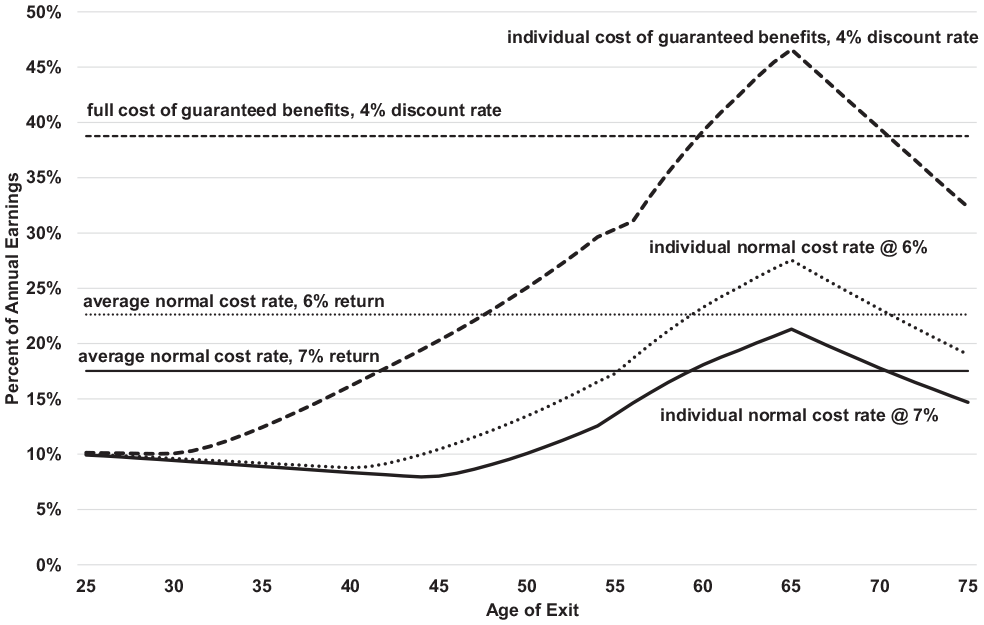
Full cost of guaranteed benefits, 4% discount rate (estimated using 2019 CalSTRS assumptions and benefit formula for new hires, slightly modified.
The extra cost of the pension guarantee covers benefits that are concentrated on career teachers. The full cost for 65-year-old retirees is 46.6% of their career earnings. The breakdown of this full cost is depicted in Figure 4. Again, 17.5% is funded by uniform contributions, another 3.8% is redistributed from contributions for others, 6.2% is the deferred cost if long-run returns come in at 1.0% below assumed (but are otherwise certain and constant), and the extra cost of the risk borne to guarantee their pension is 19.1% of their earnings. The benefits for career teachers incur the highest annual cost before accounting for risk (Figure 1), and that cost is magnified the most when the risk premium—the higher expected return on risky assets—is stripped out of the discount rate.
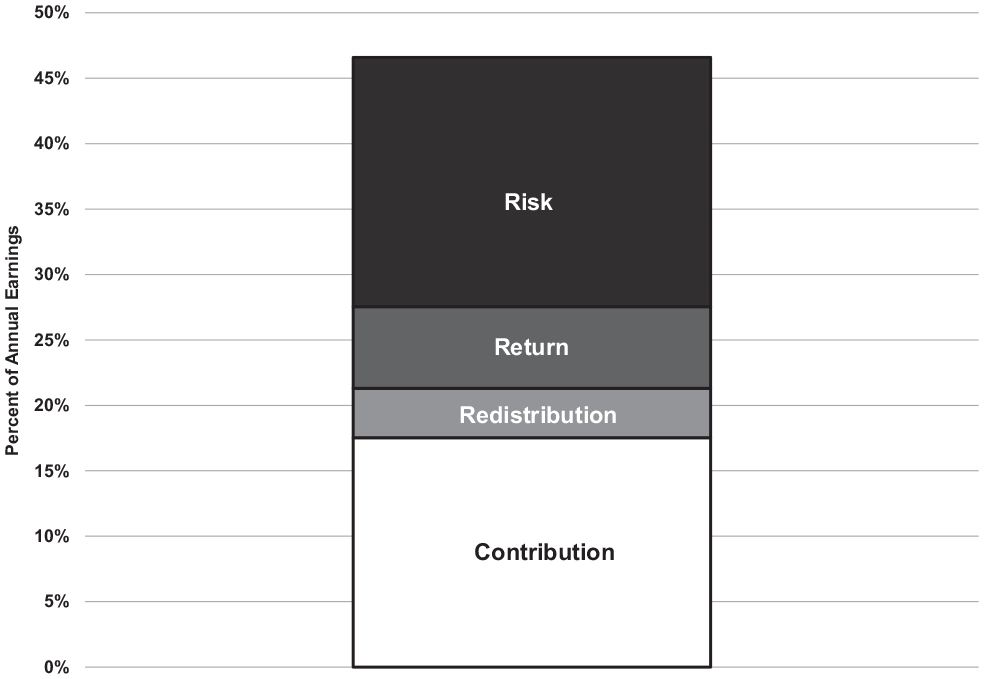
Full cost of pension for career teachers in California.
Comparison With Other State Plans 7
One may ask if the case of California, important in its own right by virtue of its size, is also representative of other states more generally. Table 1 presents cost estimates from other states previously studied, for comparison: Arkansas, Massachusetts, and Kansas. This table presents the maximum full-cost rate for 25-year-old entrants. 8 Among these states, California’s full-cost rate of 47.0% is on the high end but not an outlier; Arkansas matches it at 46.7% and, moreover, reaches that rate for retirement at age 53 (instead of 65 in California). 9 At the other end, Kansas’s final average salary plan reaches a full cost of only 26.1%. That is because Kansas had trimmed the plan repeatedly under fiscal duress before replacing it entirely for new hires (Costrell, in press). Among these states, the breakdown of full cost between contributions, redistribution, return, and risk is of comparable proportions. In each state, the hidden cost of risk, including optimistic assumed returns, is well over half the full cost for career teachers.
Maximum Cost Rates, Selected State Plans: 25-Year-Old Entrants; Cost Rates as a Percentage of Annual Earnings
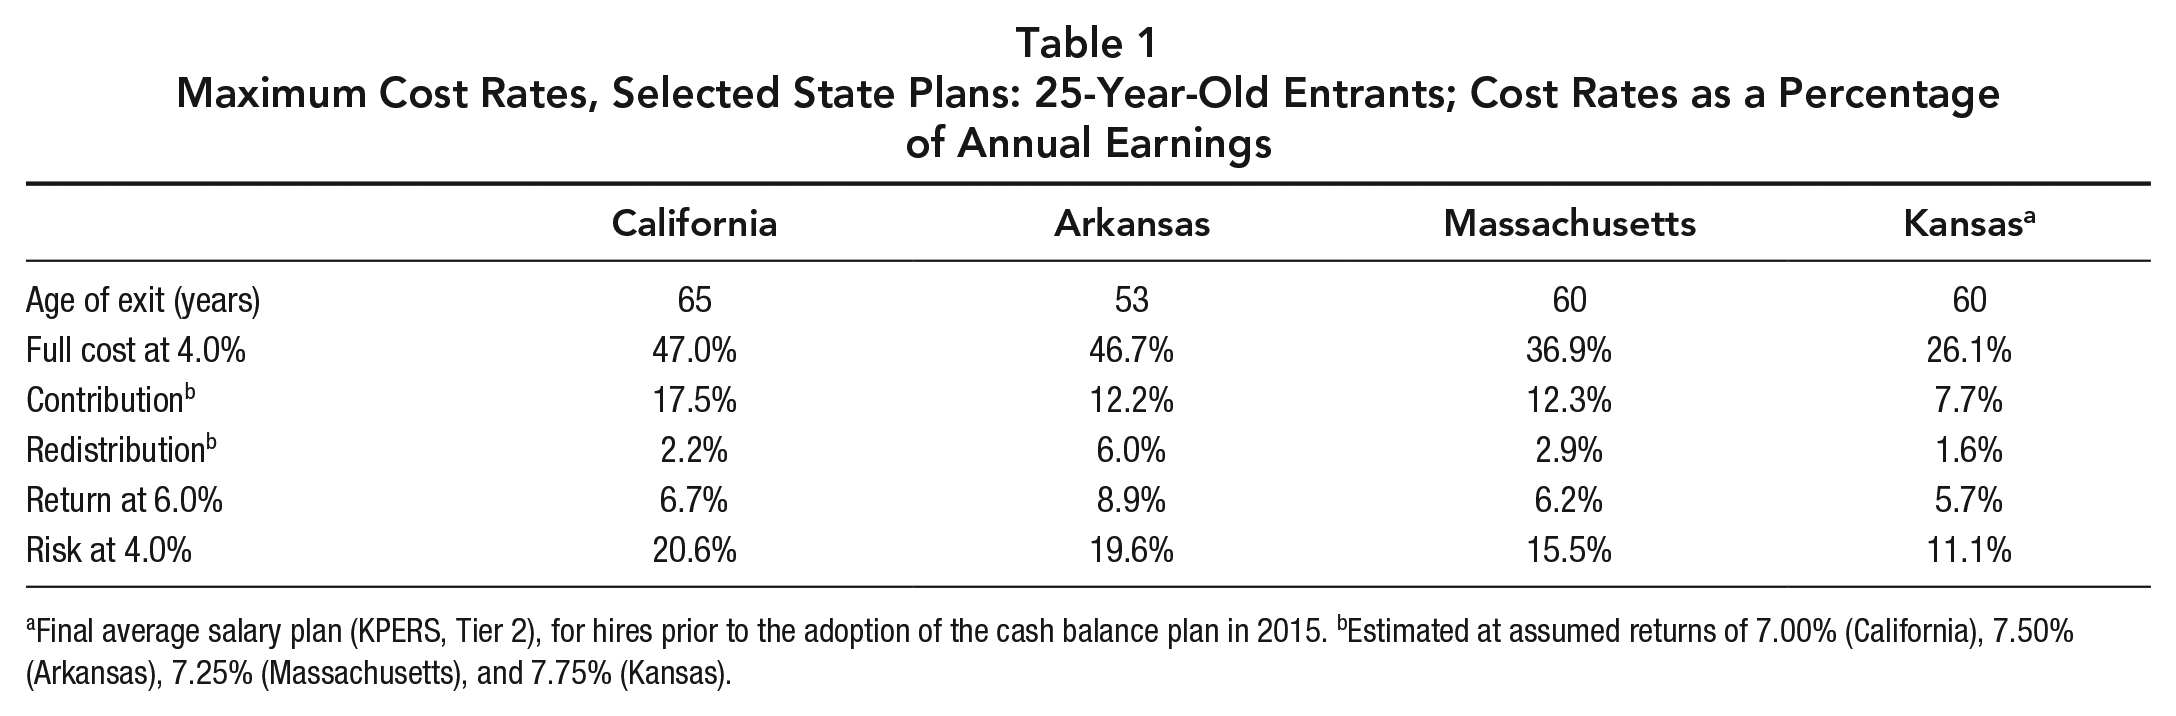
Final average salary plan (KPERS, Tier 2), for hires prior to the adoption of the cash balance plan in 2015. bEstimated at assumed returns of 7.00% (California), 7.50% (Arkansas), 7.25% (Massachusetts), and 7.75% (Kansas).
Conclusion: The Cost of Unfunded Benefits, Past and Future
K–12 pension costs have tripled since 2001, due to rising payments for benefits previously earned but not funded. The ensuing fiscal strains have, in many cases, led to lower pension benefits for new hires, higher employee contributions, and reduced cost-of-living adjustments for retirees. They have also likely curbed nonpension expenditures, slowing salary growth and reducing other classroom expenditures.
Conceptually, the past rise in pension costs differs from the object of this article’s analysis, which is the unfunded cost of currently earned benefits. The past rise has been driven by escalating payments to make good on the failure to fund benefits previously earned. There are those who contend that such payments will not or should not remain at these elevated levels indefinitely. The official funding plans project that these payments will extinguish outstanding pension debt at a specified date (2046 for CalSTRS) and that contributions will then drop dramatically to cover only the cost of newly earned benefits. There are also those who contend that we should not even aim at paying off that debt (Lenney et al., 2019 10 ). Moreover, the cost of newly earned benefits will gradually decline as the workforce increasingly comprises those who were hired under newer, less generous benefit formulas. None of these points, valid or not, pertain to my analysis here. 11
This article’s subject is the gap between the full cost of newly earned benefits and the contributions designated to fund them. Even though the object of analysis is conceptually distinct from the high level of current contributions, including payments on pension debt, it is worth comparing the two to discern what the future may portend. The point here is that even if the future is no longer burdened by debt payments, the full cost of newly earned benefits, as illustrated in Figure 3 for CalSTRS, will not be lower than current contributions.
This is not to say that current contributions for newly earned benefits should necessarily be raised to the level required to guarantee these benefits, on top of current debt payments. It is a policy decision beyond the scope of this article to decide how much to contribute now, in the face of budgetary pressures, versus how much risk to bear regarding future outcomes. This is a matter of intergenerational equity, requiring a value judgment reserved for the political process. The point of this article is to help guide the community of education researchers and practitioners regarding the nature and extent of the trade-offs. The failure to cover today the full cost of the risk borne to guarantee future benefits likely means new debt payments in the future, the additional political and educational cost of potential benefit cuts, and even the distinct possibility of insolvency for some pension plans. Our imperfect polity may well choose to defer costs to the future, but we should at least be informed—and in a transparent way—about their magnitude. The cost of the pension guarantee is off-the-books in public pension accounting. We should also be clear that the benefits of that guarantee are concentrated on career teachers, and it will likely be future career teachers who will bear the burden of potential benefit cuts if current bets do not pan out. Pension funding is a technical subject, but since the gap between the full cost of benefits and the contributions to fund them fiscally affects all areas of educational policy, we all need to understand it. To that end, educational researchers and practitioners may find it helpful to bear in mind the three Rs of pension funding: redistribution, return, and risk.