
Abstract
What difference do open educational resources (OER) make compared with publisher content (non-OER) when costs and instructors remain constant? A total of 215 community college students enrolled in online, introductory courses were randomly assigned to OER or non-OER sections and compared on retention at the tuition drop date, completion with a C or better, course completion, and mean final exam scores. Students in the OER sections were retained and persisted at a statistically significant higher rate, lending credibility to the findings of former studies regarding retention and persistence rates in courses taught with OER materials. No statistically significant differences were found on completion rates or final exam scores. OER course materials should be considered in broader initiatives for student success in community colleges.
Keywords
The cost of student textbooks is a critical barrier to student success in community colleges. Since 1975, the cost of college textbooks has outpaced inflation by more than three times (Student PIRGs, 2012). Senack (2014) reported that 65% of students do not purchase a required textbook due to high prices. Those same students, however, reported that they thought that this could hurt their grade. Textbook costs can be prohibitive, causing students to forego purchasing texts and putting their ability to learn the materials at risk (Wiley et al., 2016). The latest College Board analysis of the costs associated with 2-year in-district commuter colleges found that students spent an average of $410 on course materials, on top of an average $3,770 in tuition and fees (Ma et al., 2020). Although sunk-cost theory (Arkes & Blumer, 1985) and subsequent studies examining this phenomenon in a variety of contexts suggest that commitment, decision making, motivation, and value orientation can be influenced by cost expenditures, research exploring this relationship within an education context has yielded mixed results (Beneito et al., 2018; Hidalgo et al., 2013; Ketel et al., 2016; Levitt et al., 2016).
The U.S. Bureau of Labor Statistics (2016) reported that textbook costs increased by 88% between 2006 and 2016 and the financial burden is felt more deeply by the most economically vulnerable, who rely on financial aid. In particular, 50% of community college students report using financial aid to buy textbooks compared with 28% of students in 4-year public universities (Senack & Donoghue, 2016). Individuals from lower socioeconomic levels are more likely to postpone college enrollment than their more economically advantaged peers, and they often choose to attend a community college for affordability reasons (Hilton et al., 2014). As a point of comparison, 50% of community college students tend to be from the two lowest income quartiles compared with 38% of public 4-year students (Bailey et al., 2005). Students from the lowest family income quartiles are five times less likely to attain a bachelor’s degree by age 24 years than those in the highest family income quartile (Pell Institute, 2018).
In response to this prohibitive cost, many educators and nonprofit foundations support the open education movement and the development of open educational resources (OER; Caswell et al., 2008). Courses taught with OER materials help reduce textbook cost barriers as they are often free or sold at minimal cost. They also provide students with immediate access to learning materials. OER content includes openly licensed teaching materials that are freely available online for an instructor, student, or self-learner (McGill, 2013). Examples of OER materials include but are not limited to full course content, course modules, syllabi, lectures, homework assignments, quizzes, lab and classroom activities, pedagogical materials, games, simulations, and more, all of which are contained in digital media collections from around the world (Atkins et al., 2007).
In 2002, the United Nations Educational Scientific and Cultural Organization (UNESCO) convened a forum on the impact of open courseware for higher education in developing countries. At the forum, the phrase “open education resources” was coined to describe their model of sharing educational materials (UNESCO, 2002). OER were defined as “the open provision of educational resources, enabled by information and communication technologies, for consultation, use and adaptation by a community of users for non-commercial purposes” (UNESCO, 2002, p. 24). From there, the OER movement was launched with initiatives funded by the Bill and Melinda Gates Foundation, Hewlett Foundation, Carnegie Mellon, and individual governments (Hilton et al., 2014).
In the past 4 years, the OER community has grown exponentially by making openly licensed educational resources freely available online under intellectual property licenses that permit their free use and repurposing. This affords opportunities for people to share, use, and reuse quality materials and tools (Jung et al., 2016).
Literature Review
There are several potential benefits in teaching with OER materials. Studies show that courses taught with OER materials save students money (Chiorescu, 2017; Hilton et al., 2014; Wiley et al., 2016). In addition, several studies found that students in OER courses tend to remain enrolled at a higher percentage at the tuition drop date compared with their non-OER counterparts (Hilton et al., 2016). Moreover, Wiley et al. (2016) calculated the tuition cost savings in OER courses, based on students who remained at the tuition reimbursement date, translating into more tuition revenue.
Drop Rates in OER and Non-OER Courses
Two studies compared the drop rates of OER and non-OER courses in a pilot program for a business administration degree at a community college. Named the Z degree, faculty developed 21 courses in business administration with OER material, eliminating textbook costs for students. After the first year of the pilot program, Wiley et al. (2016) investigated if adopting OER led to lower student drop rates at the tuition reimbursement date. A z test of proportions confirmed that the difference in drop rates was statistically significant in two different semesters.
After the 2-year Z-degree pilot program was completed, Hilton et al. (2016) examined the difference in drop rates between OER and non-OER courses, factoring in course delivery modality. The results indicated no statistically significant differences between the drop rates of OER and non-OER face-to-face courses. However, for online/hybrid courses, there was a statistically significant difference in drop rates, favoring OER sections.
Success Rates in OER and Non-OER Courses
Prior studies have examined success rates across OER and non-OER courses, with results favoring OER courses. Hilton and Laman (2012) measured success rates as the final grade point average (GPA) for students using an OER psychology textbook, compared with students using traditional textbooks. The results indicated that in OER textbook courses, students’ GPAs were 0.40 percentage point higher than the GPAs of students enrolled in the traditional textbook class. Feldstein et al.’s (2012) results similarly showed that students in OER business courses had statistically significant higher grades than students in non-OER courses. In a larger study, Pawlyshyn et al. (2013) compared OER and non-OER success rates in a critical inquiry course and a math course. When analyzing OER and non-OER course sections for the critical inquiry course, the researchers found that success rates were higher in courses taught by faculty who utilized OER. Additional studies also showed a statistically significant difference in success rates between OER and non-OER courses. Hilton et al.’s (2016) analysis of Z-degree success rates showed that students enrolled in hybrid/online courses taught using OER were more likely to earn final grades of C or higher than students in non-OER courses.
Despite the successes summarized above, some studies showed no difference in success rates. For example, Hilton et al. (2013) analyzed student success rates in OER and non-OER math courses taught at a community college and found no statistically significant changes in student success rates. A study comparing OER and non-OER outcomes on student success rates for 14 general education courses at a community college also demonstrated no differences for continuing students (Winitzky-Stephens & Pickavance, 2017).
Exam Scores in OER and Non-OER Courses
Common exam or test scores have been employed as another index comparing OER and non-OER course sections. Hilton and Laman (2012) compared students’ scores on a common final exam and found that students using OER had a statistically significant increase in final exam scores. Pawlyshyn et al. (2013) also found that the exam scores in OER math courses were higher than in the non-OER courses. This difference was statistically significant. Other studies, however, found no statistically significant differences. Lovett et al. (2008) analyzed exam scores for students enrolled in a statistics course utilizing OER as part of the Open Learning Initiative. The results indicated no statistically significant difference for students across courses. Lovett et al. described these results as indicative of “do no harm” because students performed the same in OER courses as in traditional courses (p. 10). Findings from additional studies indicated a lack of statistically significant differences in exam scores obtained in OER and non-OER courses (Allen et al., 2015; Hilton et al., 2013).
Purpose
Overall, research examining whether OER materials can improve student retention, completion, and exam scores has yielded mixed results, suggesting that more research is needed, using stronger designs, with students randomly assigned to courses with OER and non-OER materials (Hilton, 2016). The purpose of this study was to understand whether the use of OER course materials improved student drop, completion, and persistence rates in comparison with the same course taught using non-OER course materials, controlling for cost and volunteer bias. Non-OER students were provided with free publisher course access codes, and students were randomly assigned to an OER or non-OER section. To date, no other OER study has controlled for cost in the OER course and publisher course. By removing the cost, the researchers tried to determine whether the students would be retained at different rates in the two types of courses. To help control for instructor bias, the same instructor taught both OER and non-OER sections. At the end of the semester, the students in both sections completed a common final exam. The researchers examined what happens when course material costs are removed and OER goes head-to-head with publisher content.
Before presenting the research questions, an explanation of some of the outcomes is in order. Tuition drop date was operationalized as 10 days after the course began by the number of students who remained in the sections. At that point in the semester, if a student drops the course, they can receive a tuition refund. The persistence calculation included students who earned a grade of D. A grade of D allows a student in a community college to progress in their program. This is important if a student is in an applied degree program (e.g., nursing, business administration, robotics), but the D grade does not allow the credit to transfer to a 4-year institution. For course credits to transfer, a student needs to earn a C or better. Therefore, in our study, we measured persistence as the number of students who completed the course and successful completion rates as earning a C or better in the course.
We address the following research questions in our study:
To what extent do retention rates at the tuition drop date differ between students in OER and non-OER online courses?
To what extent do successful course completion rates differ between students in OER and non-OER online courses?
To what extent do persistence rates differ between students in OER and non-OER online courses?
To what extent do exam scores differ between students in OER and non-OER online courses?
Methodology
Design
The researchers employed a true experimental design to address the research questions. Four instructors were recruited to teach one of their online course sections using OER course materials and the other using non-OER course materials. Course sections were randomly assigned to conditions. Instructors and all other course requirements, including format (online), assignments, and activities, were held constant across the two sections. Therefore, the manipulated variable was use of OER or non-OER course materials. The other independent variable was the subject matter or discipline of the courses.
Setting
The setting for the study was a multicampus community college in the mid-Atlantic region of the United States. In 2017, the student head count was approximately 24,000, with 64% of students attending part time. The student body is diverse; 45% percent of the students identify as white, 34% as African American, and 11% as other racial/ethnic group minorities. Forty-two percent of the students attending the college receive federal Pell Grants—needs-based grants awarded to students who are unable to afford college fees (National Center for Education Statistics [NCES], 2017).
The community college was selected for this study for its robust OER program. The college is considered a leader in OER training, policy, and research. It was also one of the first colleges nationwide to introduce a textbook-free degree, and the system’s OER policy recommends that a faculty member participate in a six-module online training program before teaching an OER course. The training program focuses on alignment, course mapping, OER materials procurement, Creative Commons licensing, and building a learning module. Three of the four instructors in the study participated in the training program. The instructor who did not complete the training course was given permission to teach an OER course because they received training from an outside consulting firm when the college system implemented its first textbook-free degree.
Participants
The study gathered data from two sample groups, community college students and full-time faculty members. To conduct the OER versus non-OER study, the researchers worked with the college system to recruit faculty members who were willing to teach using both types of course materials in one semester. Four faculty members volunteered, all female and all of whom typically teach using an online delivery modality. Therefore, all the courses in this study were taught online. The faculty members were not paid for participating in the study. Each instructor taught two sections of a course in their discipline, one of which was taught using OER course materials, either an OER textbook or the instructor’s own OER course materials. See Table 1 for the instructor codes and type of OER learning materials used.
Disciplines, Instructors, and Types of OER Materials Used
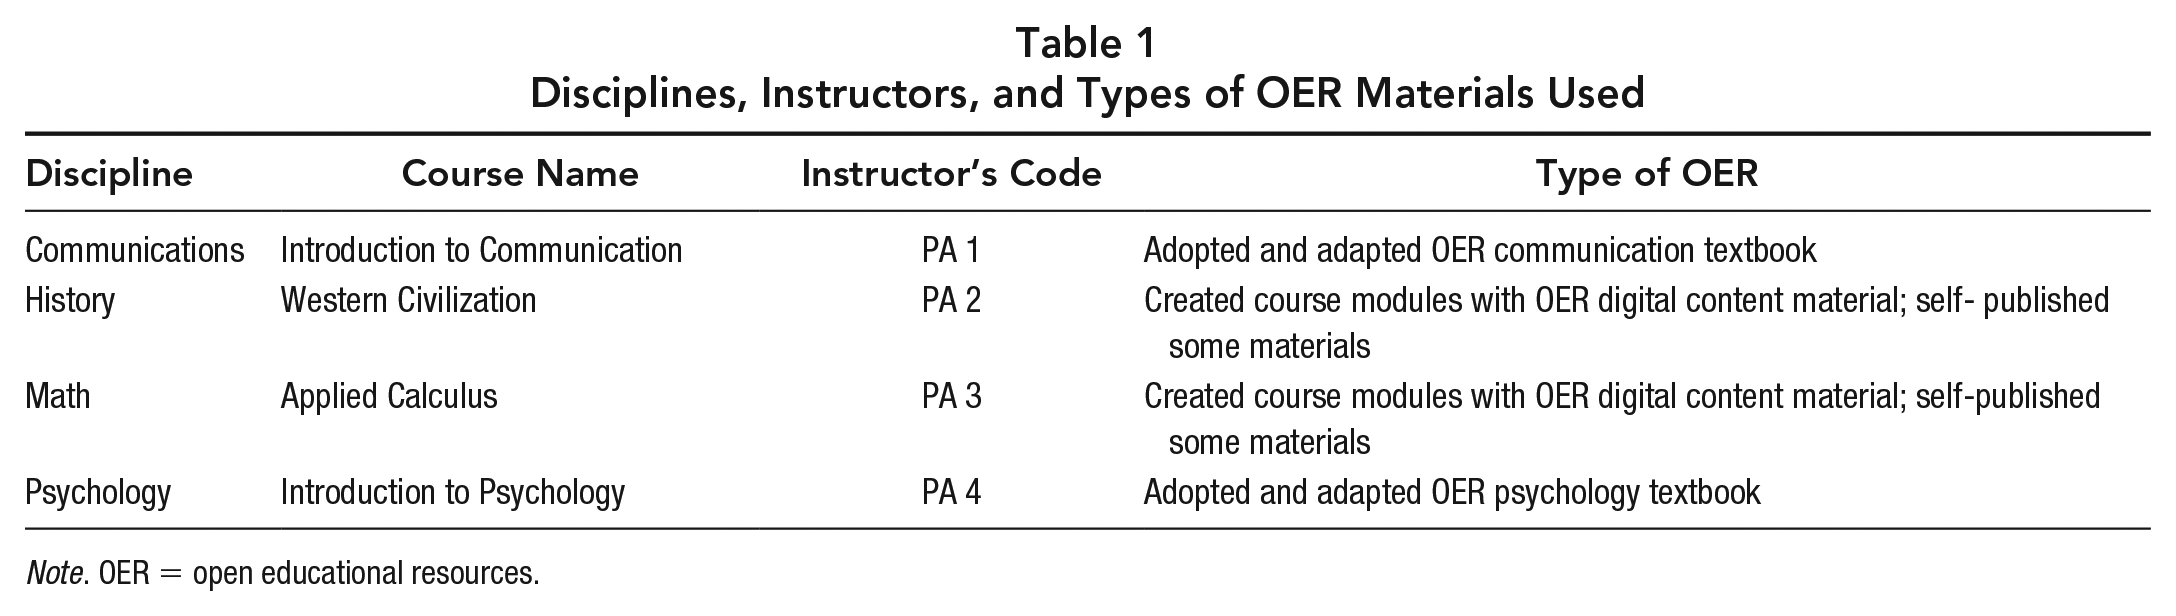
Note. OER = open educational resources.
Measures
The measures used to address the first three research questions were the number of students who remained enrolled in each section of the OER and non-OER courses at the drop date, for retention; the number of students who earned a C or higher, for completion; and the number of students who finished the course, for persistence. Using percentages, the data were compared between the two course sections (OER and non-OER) in each discipline. The fourth research question was measured using the scores of the final exams. The mean of the exam scores from each OER course section was compared with the mean of the exam scores from each non-OER course section.
Data Collection
Two national publishing firms donated the codes for accessing online textbooks and websites for the students enrolled in the non-OER sections. Representatives from the publishing firms worked with each faculty member to set up non-OER courses before the semester began and continued to offer technology support during the semester.
Student outcome data were obtained from the 2018 spring semester. Data on 215 students were analyzed. Prior to the spring registration, the enrollment limits for the online sections of two courses, Introduction to Communication and Applied Calculus, were capped at 50 students, while the limits for Western Civilization and Introduction to Psychology were capped at 60 students. Once the enrollment reached 50 or 60 students, the section was closed. Three days before the semester began, the students were randomly assigned by the college’s enrollment office into an OER or non-OER section.
Results
Research Question 1: Retention Rates
The first research question examined whether there was a difference in retention rates at the tuition drop date between the students in the OER online courses and those in the non-OER courses. As previously mentioned, drop date was operationalized as 10 days after the course began by the number of students who remained in the sections as at that point in the semester, if a student drops the course, they can receive a tuition refund. Table 2 shows the drop date results by course, with data aggregated across disciplines.
Difference in Drop Rates Between the OER and Non-OER Sections
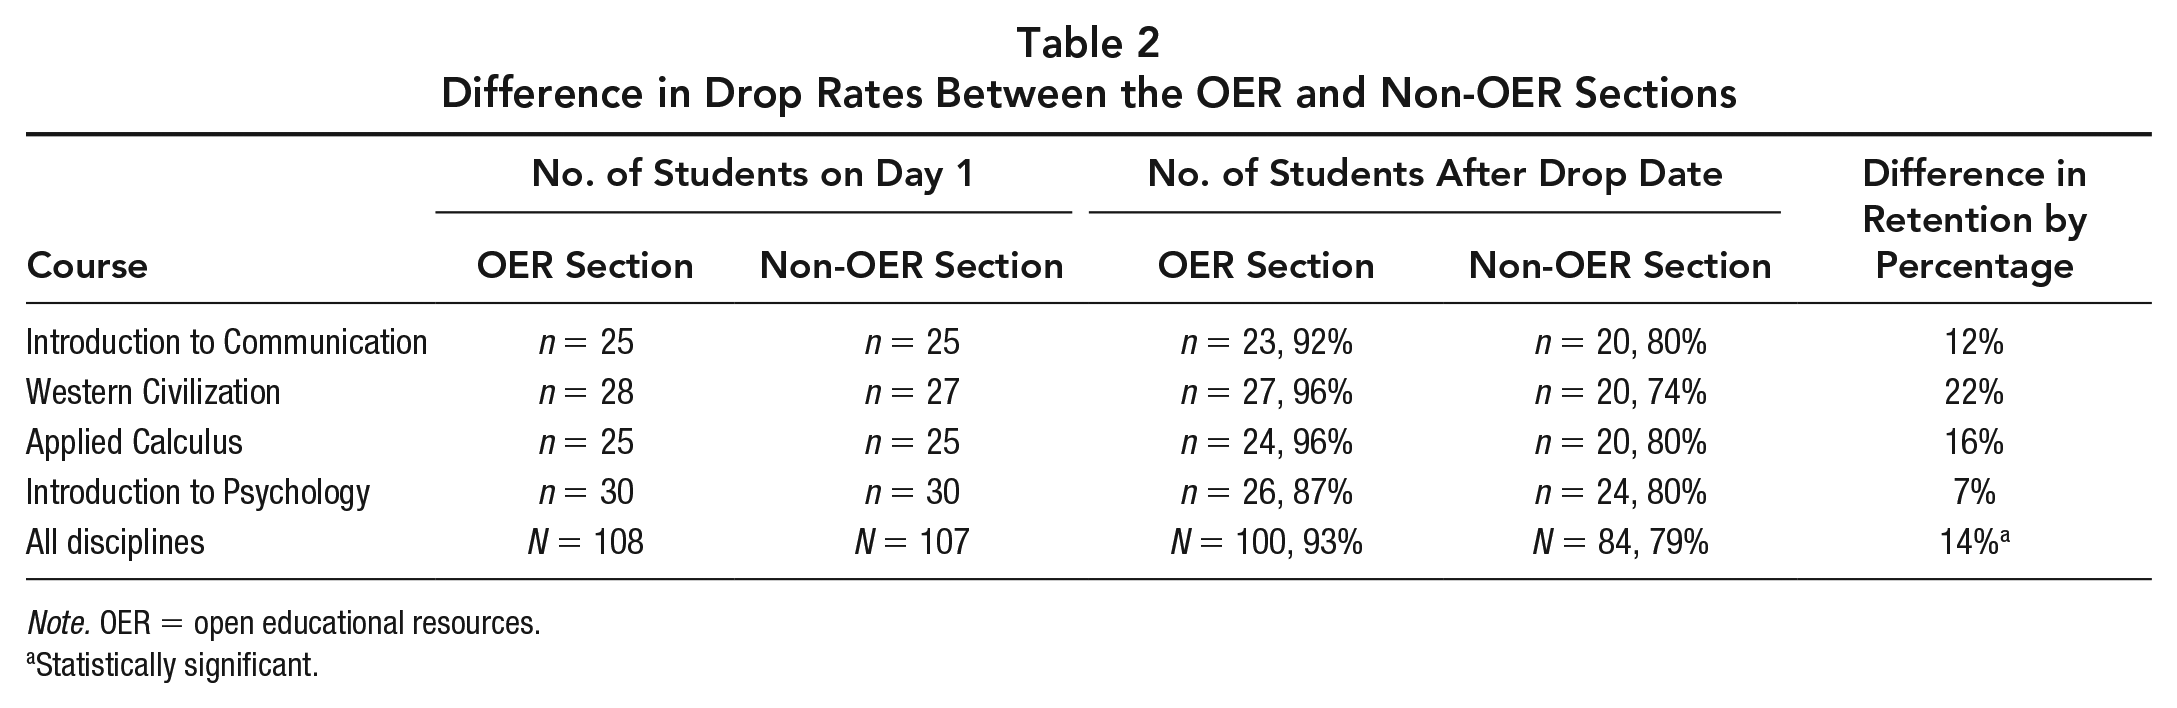
Note. OER = open educational resources.
Statistically significant.
As seen in Table 2, in specific courses, students in the OER sections remained enrolled in the course at a higher percentage rate than students in the non-OER sections at the drop date. When aggregating the data across disciplines and conducting a z test of the proportions, a statistically significant difference in retention rates at the drop date was found for students in the OER compared with students in the non-OER sections: z = 3.00, p < .05, Φ = 0.20. From the total sample, the institution retained 16 more students at the drop date in the OER course sections as compared with the non-OER course sections.
Research Question 2: Success Rates
The second research question explored whether there was a difference in the successful course completion rates between students in the OER and those in the non-OER online courses. As mentioned, successful course completion is determined by a final Grade C or higher within the OER research literature because it would be considered a transferable credit (Hilton et al., 2016; Wiley et al., 2016). Table 3 shows the success rates results by discipline and across all disciplines.
Difference in Success Rates Between the OER and Non-OER Sections
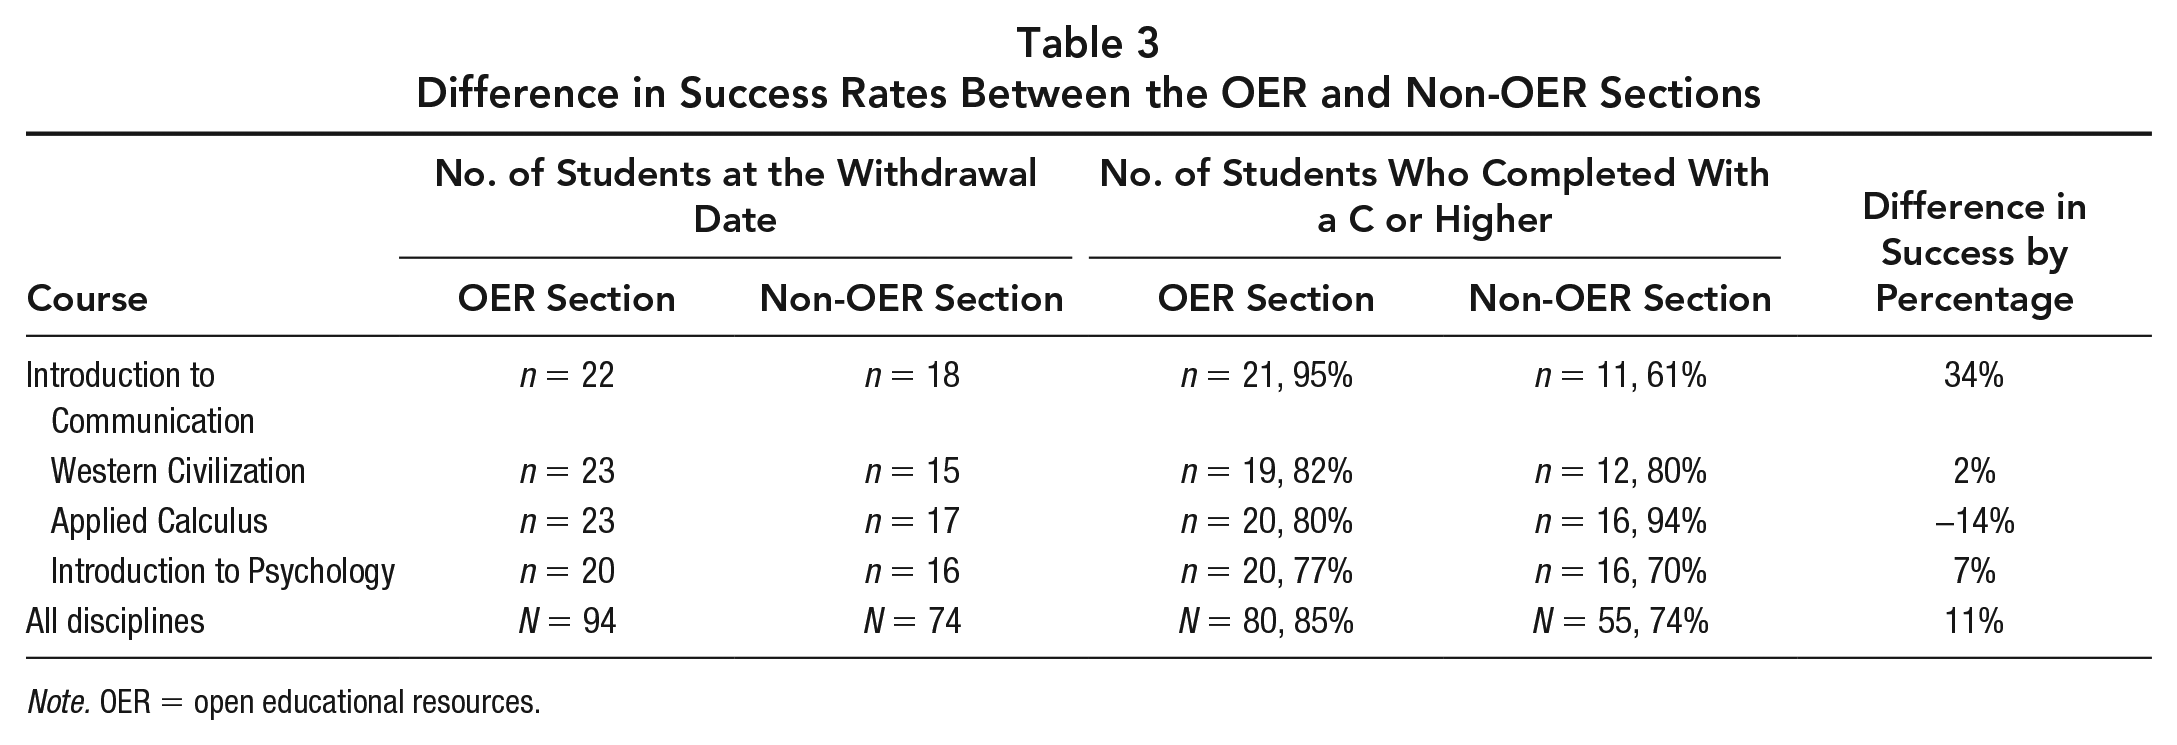
Note. OER = open educational resources.
To reflect the percentage of students who successfully completed their courses, numerical data were compared with the number of students who remained enrolled after the withdrawal date rather than the number of students enrolled on the first day of class. Results show that students successfully completed three of four OER sections at a higher percentage rate than students in the non-OER sections. Four more students successfully completed the OER section of Applied Calculus; however, when comparing by percentage, calculated using the number of students enrolled after the withdrawal date, the non-OER section of Applied Calculus had a higher completion rate by percentage. When aggregating the data across disciplines and conducting a z test of the proportions, no statistically significant difference was found in the success rates of students between the OER and non-OER sections: z = 1.72, p = .08, Φ = 0.13.
Research Question 3: Persistence Rates
The third research question examined whether there is a difference in persistence rates between students enrolled in the OER course sections and those enrolled in the non-OER course sections. Persistence was measured as the number of students who enrolled in the course and completed the course. Persistence was further operationalized to include students who completed the course with a passing grade of D or higher. Table 4 shows the results of persistence rates in the OER and non-OER course sections by discipline and in the aggregate.
Difference in Persistence Rates Between the OER and Non-OER Sections
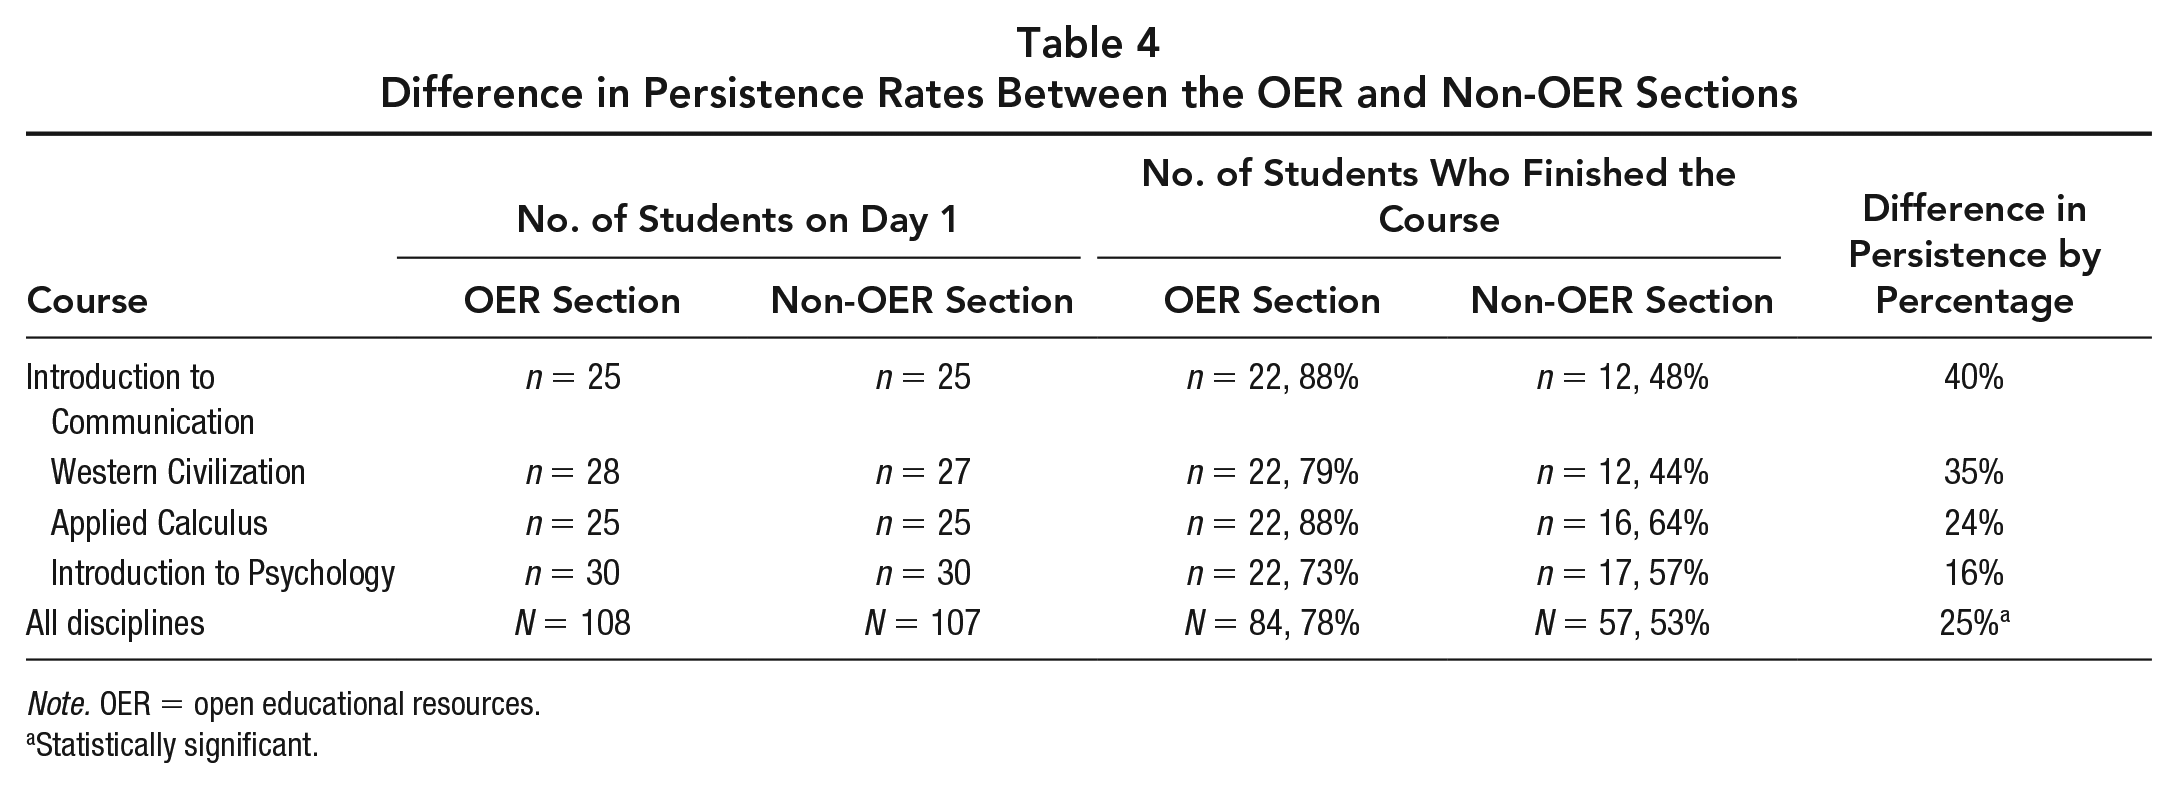
Note. OER = open educational resources.
Statistically significant.
The results indicate that across all four disciplines, students in the OER sections persisted at a higher percentage rate than those in the non-OER sections. Overall, 27 more students persisted in the OER sections. When aggregating the data across disciplines and conducting a z test of proportions, a statistically significant difference was found in the persistence rates of students between the OER and non-OER sections: z = 3.91, p < .05, Φ = 0.26. From the total sample size, 27 more students persisted in the course sections taught with OER material as compared with the course sections taught with publisher content material.
Research Question 4: Final Exam Scores
The last research question addressed in this study explored whether there was a difference in exam scores between students in the OER and non-OER online course sections. Instructors in each discipline developed a final common exam that they administered across sections. Students who remained enrolled after the withdrawal date were instructed to complete the common exam. Students who did not take the exams were omitted from the statistical analysis. Collectively, 24 students did not take the final exam. Sixteen students in the non-OER sections and eight students in the OER sections did not take the final exam. However, depending on the instructor and the course, the final exam accounted for different percentages of the final grade. For example, 2 students in Western Civilization, 2 students in Introduction to Communication, and 1 student in Applied Calculus did not take the final exam but were still able to complete the course successfully or persist.
The mean of the final exam scores was compared between the OER and non-OER sections within disciplines. Table 5 shows the results comparing mean scores and effect sizes for each final course exam by discipline.
Mean of Final Exam Scores by Discipline
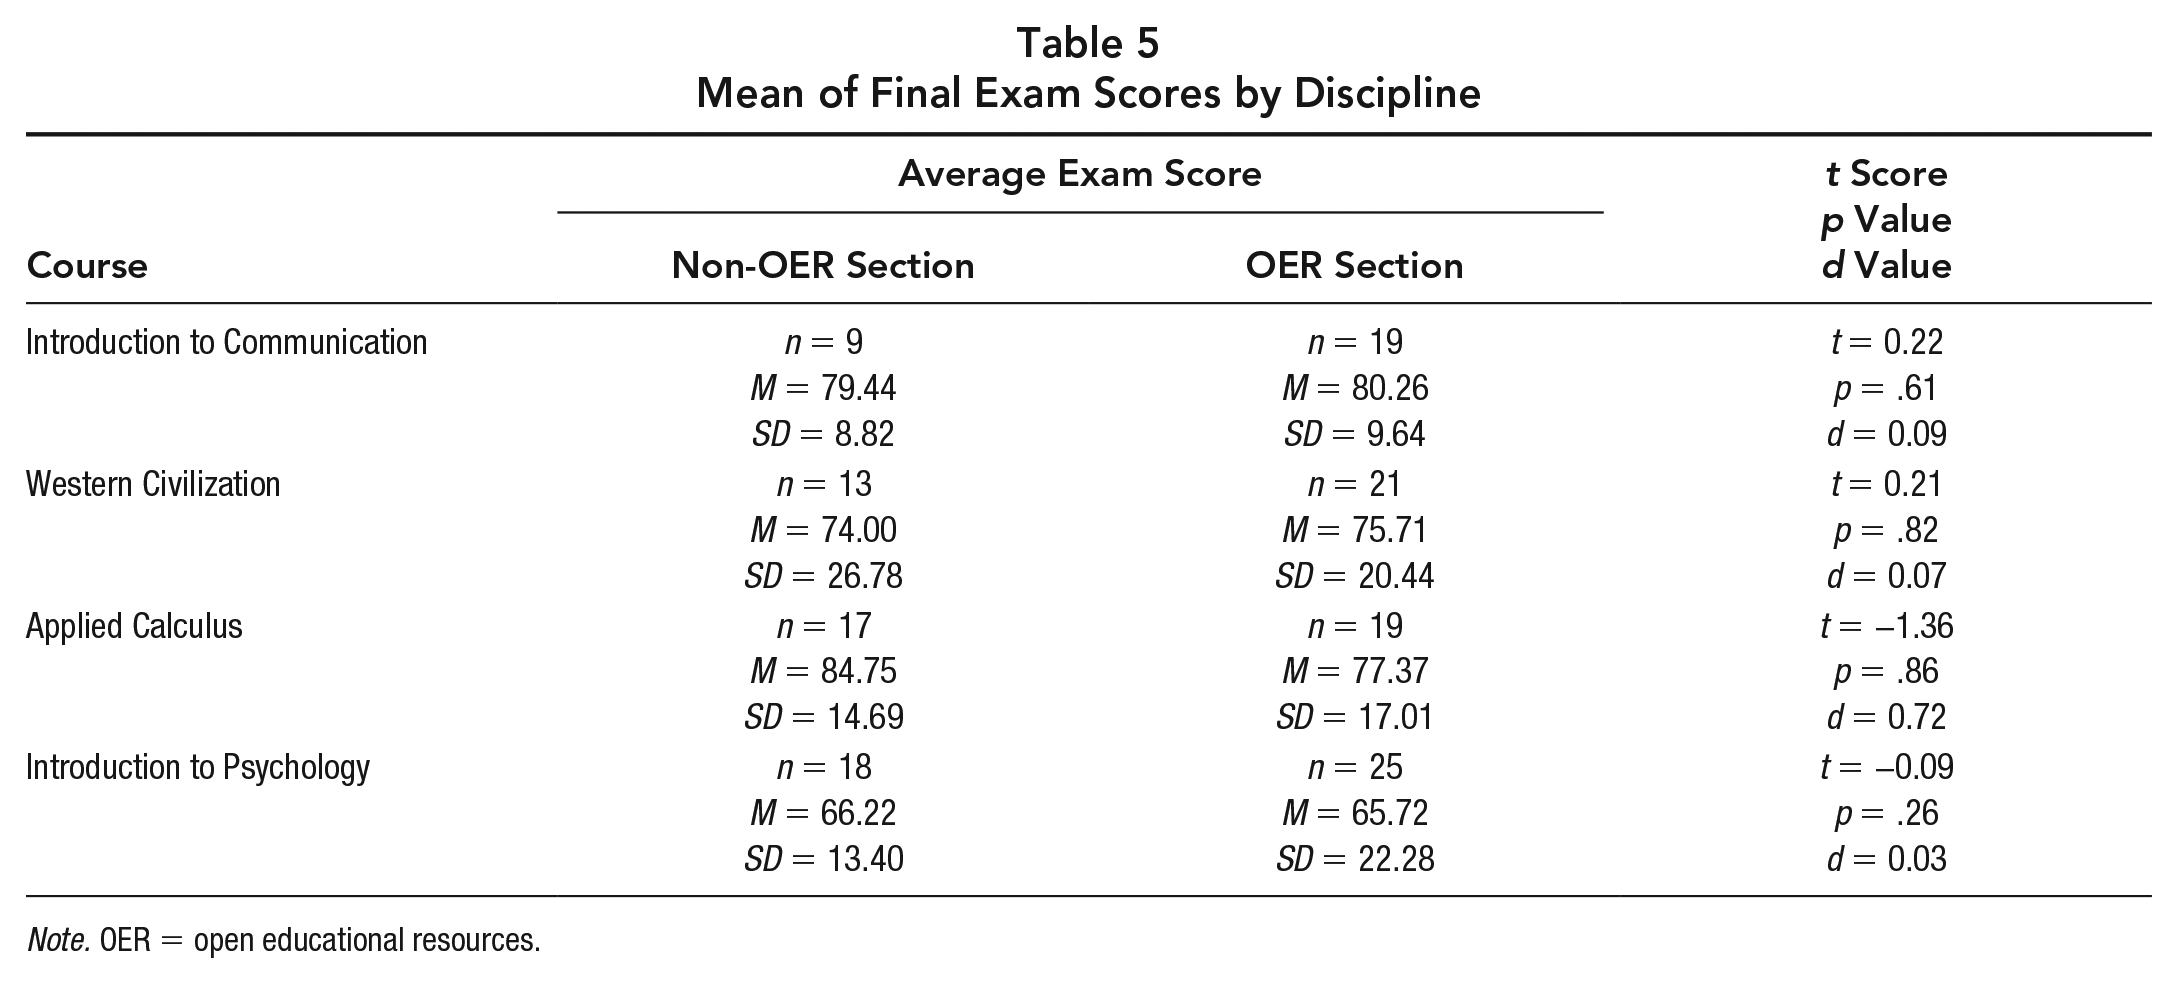
Note. OER = open educational resources.
Results indicate that students in the OER sections of Introduction to Communication and Western Civilization had a slightly higher mean score on the final exam. In Applied Calculus and Introduction to Psychology, students in the non-OER sections, on average, scored higher on the final exam in comparison with their OER counterparts. Cohen’s d effect sizes ranged from a low of 0.03 for psychology to a high of 0.72 for calculus.
When conducting an independent t test on the mean of final exam scores, no statistically significant difference was found for any of the disciplines.
Discussion
The purpose of this study was to understand whether the use of OER course materials improves student drop, completion, and persistence rates when compared with the same course taught using non-OER course materials, after eliminating cost barriers and accounting for instructor bias. In addition, we examined whether final exam scores differed between the OER and non-OER courses.
Student Retention
Student retention was measured by comparing the number of students enrolled in a course section the first day of class with the number of students who remained enrolled after the tuition drop date (i.e., 10 days after the start of a 16-week semester). Results showed that overall, 100 students remained in the OER course sections across disciplines while 84 students remained enrolled in the non-OER sections, demonstrating a statistically significant difference of 14% in the retention rate. These results are similar to those reported by Wiley et al. (2016), who compared retention in OER and non-OER courses over two semesters. Wiley et al. subsequently tested drop rates again over four semesters, comparing students enrolled in OER courses with their non-OER counterparts, and once again found a statistically significant difference in the drop rate favoring the OER courses (Hilton et al., 2016).
However, in neither of the previous studies cited were students randomized. Students in OER courses self-selected, with the OER sections designated using a “Z” to indicate that they were textbook free. In this study, students were randomized into OER and non-OER course sections. OER researchers have hypothesized that students in OER courses have a lower drop rate because they have early access to course materials and do not have to buy textbooks. Studies have shown that students often report they had postponed purchasing textbooks because they needed to save money first (Florida Virtual Campus, 2016). This was not the case in this study as costs were neutralized between the OER and non-OER course sections. There may, however, be other contributing factors leading students to remain enrolled in an OER section versus a non-OER section (e.g., the course design or ease of use of the course materials) that must be explored further. Instructors have more control and ownership over OER materials, and the instructor’s engagement might translate into an increase in student engagement and commitment to the course. Further research might explore student opinions about the design of OER versus that of publisher content. Publishers host materials through their own proprietary platforms, and these may be more difficult for students to navigate, particularly in the first few days of class. OER materials might lend themselves more easily to existing course management systems or the variety of student devices used to access content.
Student Completion
Student completion was measured by how many students successfully passed the course with a final grade of C or higher. When aggregating completion data across disciplines after the withdrawal date, 80 students successfully completed in the OER sections of a course and 55 students successfully completed in the non-OER sections. The difference favored the OER sections by 11% but was not statistically significant.
These results are consistent with what Hilton et al. (2013) found in their study on OER math courses at a community college, where no statistically significant difference in successful completion in OER math courses was reported in comparison with non-OER courses. More recently, Winitzky-Stephens and Pickavance (2017) found that OER was not a statistically significant factor for student success in 14 general education courses. Their study found that course- and student-level variables were more predictive than the OER variable. However, their study did find that OER has a small positive effect on new students and their course grades, indicating that OER may be of importance to first-time college students who are not used to purchasing textbooks for a course. The researchers in both studies concluded that implementing OER in the classroom does not seem to harm students and has no negative effect on their final grade or their ability to pass (Hilton et al., 2013; Winitzky-Stephens & Pickavance, 2017), while reducing cost.
Unlike the studies cited above, several other previous OER studies reported statistically significant differences in completion between OER and non-OER courses. Feldstein et al. (2012) found statistically significant lower failure rates in an OER business course using an open textbook when compared with courses taught using publisher content material. Similar and statistically significant results favoring OER were found for students in a Hilton et al. (2016) study analyzing completion rates in OER and non-OER courses over a five-semester period. In Chiorescu’s (2017) study of an open-textbook course for college algebra, students had statistically significant higher completion rates in the OER section than in the non-OER section. In addition, Aragon and Johnson’s (2008) study found that students who completed online classes tended to enroll in more online classes, the format for most OER courses. All these studies indicate that there may be a correlation between OER course materials and completion.
A concern with OER efficacy lies in the inconsistency of findings concerning successful completion. The inconsistency in results could be from the research design, the instructional design of the course, the type of OER material used, the length of the study, the sample size, or a number of other unaccounted for factors. However, in this study, when comparing the OER sections with the non-OER sections by percentage, the results showed that more students successfully completed the OER sections.
Student Persistence
Persistence was measured as the percentage of students who finished a course compared with students who enrolled in the OER or non-OER courses. The measurement is based on the Successful Course Completion Ratio for persistence (Hagedorn, 2006). Overall, a statistically significant difference in persistence rates was found, with a difference of 25 percentage points favoring the OER sections.
As of this writing, the authors have found only one OER study that supports the findings of this study for the persistence outcome. Grewe and Davis (2017) found that the use of OER course materials was a statistically significant predictor of student achievement in online history courses. The researchers assigned numbers to letter grade variables in their regression model to account for student achievement, measuring persistence as students who earned a grade of D or higher. Several studies, however, have cited financial reasons as a critical factor that prevents community college students from persisting. Nakajma et al. (2012) found that although the largest predictor of persistence was a student’s overall GPA, financial variables also affected student persistence. For example, the total number of hours students worked was negatively correlated with persistence (Nakajma et al., 2012), a correlation that was found to be statistically significant. The need to work long hours may be related to financial hardship, which affects persistence. In a different study, students in a community college STEM program mentioned financial reasons for not persisting in the program (Chan & Wang, 2017). Wood and Harris (2015) further showed how living expenses were a statistically significant predictor of persistence for Black and Latinx males in community colleges. Prior OER studies have articulated the cost savings associated with taking OER classes (Chiorescu, 2017; Hilton et al., 2013), and based on findings related to persistence and the financial factors associated with persistence, it is possible to offer OER courses as a way to increase persistence among community college students.
Student Exam Scores
The results of comparing the means of final exam scores showed that students in the OER sections of Introduction to Communication and Western Civilization had a slightly higher, although not statistically significant, mean score difference between 0.82 and 1.71. Students in the non-OER sections of Applied Calculus had a higher mean score difference of 7.38 points. This difference, however, was not statistically significant. In the non-OER section of Introduction to Psychology, final exam mean scores were slightly higher by 0.5, although not statistically significant.
Findings from this study are consistent with those of previous OER studies examining final exam score differences between OER and non-OER course sections. Lovett et al. (2008) found no statistically significant differences in exam scores when comparing course materials in a statistics course. No statistically significant differences were found in exam scores for an OER chemistry course when compared with a non-OER course (Allen et al., 2015). One study did show higher exam scores for an OER psychology course over the traditional textbook course, but the researchers did not test for significance (Hilton & Laman, 2012).
Limitations
This study has some limitations. Although we attempted to control for confounding variables, there are other possible explanations for the results. One potential confound was diffusion of treatment. However, the classes were delivered fully online, and any cross talk among students in the different sections was very unlikely. Another potential confound was instructor bias. The instructors volunteered to participate in the study and had all taught OER courses previously. They reported that their interest in participation stemmed from the removal of cost as a factor via publisher-donated codes and thought that student preference for OER courses was due to their being cost free. They seemed to want to know the answers to the research questions posed and attempted to minimize any bias. The instructors also stated that students reported greater difficulty accessing material from the publisher’s website. Differences in student effort and interest may have affected the results.
Beyond these potential confounds, other limitations warrant mention. Archival student data were obtained from one community college, precluding extrapolation of the results to other institutions. Missing data was another problem. A total of 22 students did not complete the final exam for unknown reasons; perhaps this was related to the percentage of the total grade associated with the final exam (i.e., students could successfully complete the course without taking the final exam). These students were not included in the statistical analysis of the final exam scores in the OER and non-OER course sections. Student data were collected from courses taught online, which tend to have high drop, withdrawal, and failure rates for community college students (Xu & Jaggars, 2011). Finally, the study was limited to four faculty members, and there were some differences among them in terms of course design. The instructors had the freedom to choose the type of OER material they wanted to use; two used OER textbooks, while the other two used OER digital content.
The mean differences in final exam scores between the non-OER and OER sections were not statistically significant. Using final exam scores is not the only or best metric of students’ learning. Multiple and more varied indices of student learning would improve the study.
Lack of institutional policies and supports is a barrier identified by faculty as affecting the implementation of OER (Belikov & Bodily, 2016; Jhangiani et al., 2016). The leadership position of the OER faculty training at the institution in this study may limit the generalizability of the findings. Sustaining an OER initiative requires institutional support, such as professional development for faculty, along with recognition, time, and stipends to develop and adapt OER course materials. In the absence of these kinds of administrative support, OER only exists in pockets and is solely faculty driven.
Implications
Previous OER research has established that the main advantage of OER lies in the cost savings for students (Chiorescu, 2017; Hilton et al., 2013; Hilton et al., 2014). This study eliminated the costs for the OER and non-OER sections, and the results favored the OER sections. Future iterations of OER research must broaden their focus. For example, research might examine whether the benefit of OER courses lies in the instructional design and ease of navigability, leading to lower drop rates and higher persistence rates. Further research with larger and more representative samples of students and instructors is also needed to build on the findings of this study and to explore which OER components (material and/or design) may affect student academic outcomes.
In addition to an expanded focus, future OER research might focus more intentionally on gatekeeper courses. One obstacle to student success is math completion in community colleges. Successfully passing a math course removes a barrier for a student’s ability to earn a certificate or degree. The results of this study showed that students enrolled in the OER section of Applied Calculus persisted at a higher percentage rate than students in the non-OER section. Although this study did not account for student demographics, it does suggest that some type of barrier was removed for students in the OER sections. In this vein, this study falls into the “do no harm” category established by researchers in the OER field (Hilton et al., 2013). This category of research establishes that although researchers may not know what factor caused students to persist at higher rates in the OER sections, OER course materials did not harm the students’ ability to persist. The small to medium effect sizes calculated reinforce the “do no harm” contention. Although the differences in outcomes were relatively modest, they are important given the increasing costs associated with attending college and the cost savings benefits of OER.
Finally, even though the focus of this study was not the fiscal implications and advantages for the institution, the college retained an additional $9,152 in tuition revenue from students enrolled in the OER sections at the drop date, and additional cost savings when the cost of recruiting new students and replacing a lost student enrollment is factored in, estimated as $5,460 in 2011 dollars and approximately $6,500 in 2021 dollars (Raisman, 2013). The tuition dollars retained and additional cost savings support a hypothesis proposed by Wiley et al. (2016) that due to lower drop rates, courses taught with OER materials create a source of revenue for the institution. Institutional leaders may wish to conduct a cost–benefit analysis to determine the rate of return on retained tuition dollars and cost savings. A portion of this money could fund an OER coordinator and a technology support program to sustain an OER program.
Conclusion
Student enrollment in community colleges has decreased since 2012 (NCES, 2017). The financial focus of community colleges has changed from enrollment to retention, completion, and persistence (Phelan, 2016). More than 32 states now have some type of performance-based funding tied to student outcomes. Offering OER courses can be an innovative solution to increase student completion and persistence in community colleges. Teaching courses using OER alone may not be the answer; however, it may be useful to integrate the practice with other initiatives.