
Abstract
We use data on over 14,000 teacher candidates in Washington state, merged with employment data from the state’s public schools and Unemployment Insurance system, to investigate the career paths of recently certified teacher candidates in the state. About two thirds of these candidates are observed as public school teachers at some point within 5 years after completing student teaching, many of whom transition from nonteaching education positions into public school teaching positions within a few years of student teaching. We also find that candidates with STEM endorsements and candidates who graduated after the Great Recession are far more likely to be employed in public K–12 teaching positions within the first several years after student teaching.
There are a number of compelling reasons to better understand the early teacher pipeline. The first is that the considerable variation in teacher effectiveness in the workforce (Rivkin et al., 2005)—and evidence that changing the effectiveness of new teachers is challenging (Atteberry et al., 2015)—suggests that it matters who becomes a teacher. Understanding who enters and stays in the teacher workforce provides insights into how desirable teaching is as a profession to individuals with differing backgrounds and provides the capacity to address policy objectives such as diversifying the teacher workforce (National Academies of Sciences, Engineering, and Medicine, 2020). Second, there is also a need to better understand what happens to teacher candidates with science, technology, engineering, and mathematics (STEM) credentials given the widespread agreement that increasing the supply of STEM teachers is a national priority (Dee & Goldhaber, 2017).
Although information about the specific attributes of the teacher candidates who transition (or do not) into the teacher workforce is somewhat sparse, there is evidence that many teacher candidates fail to enter the teacher workforce in the near term, that is, in the years immediately after receiving a teaching credential (Bardelli & Ronfeldt, 2021; Cowan et al., 2016). Where these candidates go and whether they eventually return to teaching provides insights into how we should think about the importance of supply and demand in the teacher labor market and the current capacity of teacher preparation to address current and future teacher staffing needs. For example, large fluctuations in teacher hiring rates corresponding with broader economic conditions—and specifically, the very low percentage of teacher candidates hired into public teaching positions during the “slack” labor market during Great Recession (Goldhaber et al., 2021)—suggests that demand for teachers drives much of the variation in hiring rates in the labor market. Moreover, high rates of delayed teacher workforce entry during these periods (Goldhaber, Krieg, & Theobald, 2014) suggests the presence of a “bench” of individuals who may be thought of as potential teachers in that they have completed teacher preparation and the requirements for teacher licensure, actively seek a teaching position, but who have not yet been hired as a teacher. But there is no evidence about what potential teachers are doing in the years before they enter the teaching workforce, which has important implications for projections of future teacher supply and the potential that we may face teacher shortages (e.g., Sutcher et al., 2016).
Research Questions
Using a unique panel data set on 11 cohorts of over 14,000 teacher candidates from Washington state, we provide descriptive evidence about the propensity of teacher candidates to transition into the teacher workforce, or into alternative positions inside and outside of education, in the years after they graduate from teacher education programs (TEPs). We use information on teacher candidates supplied by 15 TEPs in Washington state, linked to state administrative data on inservice teachers and Unemployment Insurance (UI) data maintained by the state, to answer two specific questions:
To our knowledge, the descriptive findings we describe here represent the first documentation of the employment outcomes for a large sample of recently credentialed teacher candidates who enter public school teaching positions or other employment positions.
Background on Who Chooses to Pursue a Public School Teaching Career
Much of what is known about the early teacher pipeline and decisions to pursue a teaching career is derived from national surveys of college students (e.g., Corcoran et al., 2004; Hanushek & Pace, 1995; Hoxby & Leigh, 2004; Ingersoll & Perda, 2010; Podgursky et al., 2004). On the whole, this body of work finds that female and White college students are more likely, and college graduates who are more academically capable are less likely, to pursue a public school teaching career. The demographic findings comport with the overall public teacher workforce, which is predominantly White (about 80%) and female (about 75%) according to the National Center for Education Statistics (2020), though there is some evidence that the academic qualifications of the incoming teacher workforce has been improving in recent years (e.g., Lankford et al., 2014).
A number of studies explore potential explanations for these trends. Teachers who are more effective or have a math and science background tend to earn more outside of public school teaching jobs (Chingos & West, 2012; Goldhaber & Player, 2005; Han, 2020), while female and higher-paid teachers are more likely to return to the teaching profession after leaving (Elsayed & Roch, 2021). Other research provides contrasting evidence about whether teacher licensure requirements are positively (Larsen et al., 2020) or negatively (Angrist & Guryan, 2008; Hanushek & Pace, 1995) related to the academic caliber of those who opt into teaching. There is also mixed evidence about the extent to which school systems favor hiring more academically capable teachers (Ballou, 1996; Boyd et al. 2011; Boyd et al., 2013; Hinrichs, 2014).
This study is most closely related to previous work that examines transitions from TEPs into the teacher workforce, and whether aspects of teacher education, and student teaching experiences in particular, are related to the likelihood of observing teacher candidates in public teaching positions. Several studies show that teacher labor markets are quite localized in the sense that teacher candidates tend to find employment in districts that are close to both where they received their teaching credentials and their hometown (Boyd et al., 2005, Goldhaber, Krieg, & Theobald, 2014; Reininger, 2012), and that where student teaching occurs (Krieg et al., 2016) is also highly predictive of the location of a first teaching job.
Research on the attributes of individual teacher candidates, and their student teaching experiences, finds relatively few predictors of whether they teach. One notable exception is that younger candidates and candidates who hold STEM or special education endorsements tend to be more likely to enter the teaching workforce (Goldhaber et al., 2021; Goldhaber, Krieg, & Theobald, 2014;). The large differences in hiring rates by endorsement area illustrate the challenges that school systems face in staffing STEM and special education classrooms (Dee & Goldhaber, 2017). Data from one school district in Washington, Spokane Public Schools, documents an explanation for these staffing challenges: the district receives roughly ten times as many applicants for each open elementary position than for each open secondary math or science position (Goldhaber, Grout, & Huntington-Klein, 2014). Recent evidence also suggests that more qualified teacher candidates, as measured by licensure test scores (e.g., Cowan et al., 2020) and clinical teaching observation scores (Bartanen & Kwok, 2021; Vagi et al., 2019), are more likely to enter the teaching workforce.
Goldhaber et al. (2021) find, related to the slackness of the labor market generally, that there are also dramatic differences in the hiring rates of teacher candidates over time. This complements research showing that the academic caliber of individuals who pursue teaching improves in weaker labor markets (Nagler et al., 2020). However, we are unaware of any research that uses longitudinal information from TEPs to assess the employment outcomes of the relatively large share of teacher candidates who do not end up in the teacher workforce immediately. Nor are we aware of research that assesses the extent to which these candidates later return to the teacher labor market. This represents a significant gap in the literature, given the aforementioned challenges school systems face in recruiting and retaining teachers in particular areas and the ensuing policy debates about whether the supply of teachers is adequate to meet the demand (e.g., Sutcher et al., 2016).
Data and Methods
We use three sources of data to investigate entry into either the public school teaching workforce or other sectors of the workforce in Washington state that are covered by UI. The first is information on teacher candidates provided by 15 Washington TEPs participating in the Teacher Education Learning Collaborative (TELC). 1 The TELC data include information about when and where each teacher candidate’s student teaching occurred. For the purposes of this analysis, we focus on teacher candidates who student taught between 2004–2005 and 2014–2015. Importantly, we limit the sample to candidates who completed their student teaching and were licensed to teach in Washington; thus, we focus on the employment outcomes of teacher candidates who appeared to have a strong desire to teach, given that they obtained the legal credentials necessary to become public school teachers in the state.
One limitation of the TELC data is that we only have information on student teaching placements for teachers who graduated from the 15 TEPs participating in TELC. This excludes in-state teachers from the six other non-TELC TEPs that were certified to train new teachers during the years we consider. New teachers in the TELC data are not representative of all new teachers in the state; for example, as shown in the Supplemental Appendix Figure A1 (available on the journal website), TELC programs prepare over 90% of all new in-state teachers west of the Cascade Mountains but only about 60% of new in-state teachers in the eastern half of the state. Institutions participating in TELC also tended to graduate a higher percentage of candidates of color during these years of data (9%) than institutions not participating in TELC (6%). Thus, the results of this analysis should only be generalized to graduates of the 15 TEPs that participated in this study.
We merge the TELC data to public school employment records maintained by the Washington Office of the Superintendent of Public Instruction (OSPI). Specifically, the OSPI employment data include annual records of classroom assignments for all certificated public school employees in the state who were employed by October 1 of each school year. The OSPI data include information on public school employee positions that allow us to create indicators for whether each candidate was employed in a teaching position (“Public K–12 Teacher”) or other certificated position (“Public K–12 Other Certificated Employee”; e.g., paraprofessional) in each school year after they completed student teaching. Unfortunately, the OSPI data do not systematically track substitute teachers, so we cannot observe whether they are teaching in that capacity in public schools. The OSPI teacher credential records also include demographics, credentialing information, and licensure test scores for each candidate. For the purposes of this analysis—and motivated by prior work discussed above about employment outcomes for different candidates—we focus on five candidate characteristics in this analysis: age during student teaching; licensure test scores on the Washington Educator Skills Test–Basic (WEST-B) averaged across mathematics, reading, and writing; and indicators for female candidates, candidates of color, and candidates who are endorsed in a STEM subject.
This data set was then merged with data maintained by Washington State’s Education Data and Research Center (ERDC), which is the state agency tasked with maintaining the state’s P–20 data warehouse. Key for the work described here, the ERDC data have information on employment outcomes, including quarterly earnings, hours worked, and North American Industry Classification System employment sectors for all individuals employed in occupations covered by Washington State UI. These data generally exclude individuals who are self-employed or in the military, but otherwise provide comprehensive coverage of employment outcomes in Washington state between 2006 and 2018.
To create the analytic data file for this analysis, we first collapse the UI data to the school year level by collapsing across quarters within a school year. 2 For candidates who are employed in more than one employment sector in a given school year, we keep the employment sector for which the candidates receive the highest earnings within a given school year. While the UI data do not explicitly flag public schools, we are able to identify public schools as employers for whom at least 50% of their employees appear in the state’s public school employment records. This allows us to capture two predominant types of public school employment—noncertificated public school employees like substitute teachers, and employees who were hired after the October 1 deadline for the state’s public school employee data collection—in a “Public K–12 Other” category.
For candidates who were not employed in K–12 public schools in a given year (i.e., as a “Public K–12 Teacher,” “Public K–12 Other Certificated Employee,” or “Public K-12 Other”) but are observed in the UI data, we create two additional employment categories: “Other Educational Services” (e.g., private school teachers, early childhood teachers, and childcare providers) and “Other” (i.e., all noneducation employment). 3 Finally, any candidates who are not observed in the UI data in a given year are placed into a separate category, “Not in UI Data.” This category consists of individuals who were teacher candidates in Washington but subsequently left the state, teacher candidates who remained in the state but were not employed at all, or those who were employed but not covered by UI. The final merged data set includes 14,020 teacher candidates who student taught in 2014–2015 or earlier and can therefore be observed for at least 3 years after they completed student teaching (i.e., through the end of the 2017–2018 school year). For subsets of the analysis, we focus only on the 12,546 candidates who student taught in 2012–2013 or earlier (and thus can be observed for at least 5 years after student teaching). 4
Our analytic approach to the research questions outlined in Section 1 is entirely descriptive. To answer our first research question (RQ1) on employment outcomes for different types of candidates the year after student teaching, we present summary statistics and t tests of differences in outcomes between different types of candidates. To investigate transitions between different types of employment outcomes for our second research question (RQ2), we present Sankey plots that track the distribution of employment outcomes in each year after student teaching and also the frequency of transitions between these outcomes across years.
Results
Sample Statistics for Newly Credentialed Teacher Candidates (RQ1)
In Table 1, we report sample statistics for teacher candidates in the year after completing student teaching. In column 1 are the sample means for all teacher candidates, and the subsequent columns are for candidates who end up in the different employment categories defined earlier. On average (across all of the cohorts), the vast majority of teacher candidates were employed in either K–12 public school teaching positions (40.5%) or Public K–12 Other positions (26.0%). A much smaller share either did not show up in the UI data (8.2%), were employed in a nonteaching certificated position in K–12 schools (4.5%), a position in Education Services but outside of public schools (5.1%), or in positions outside of Educational Services (15.7%).
Summary Statistics, 1 Year After Student Teaching
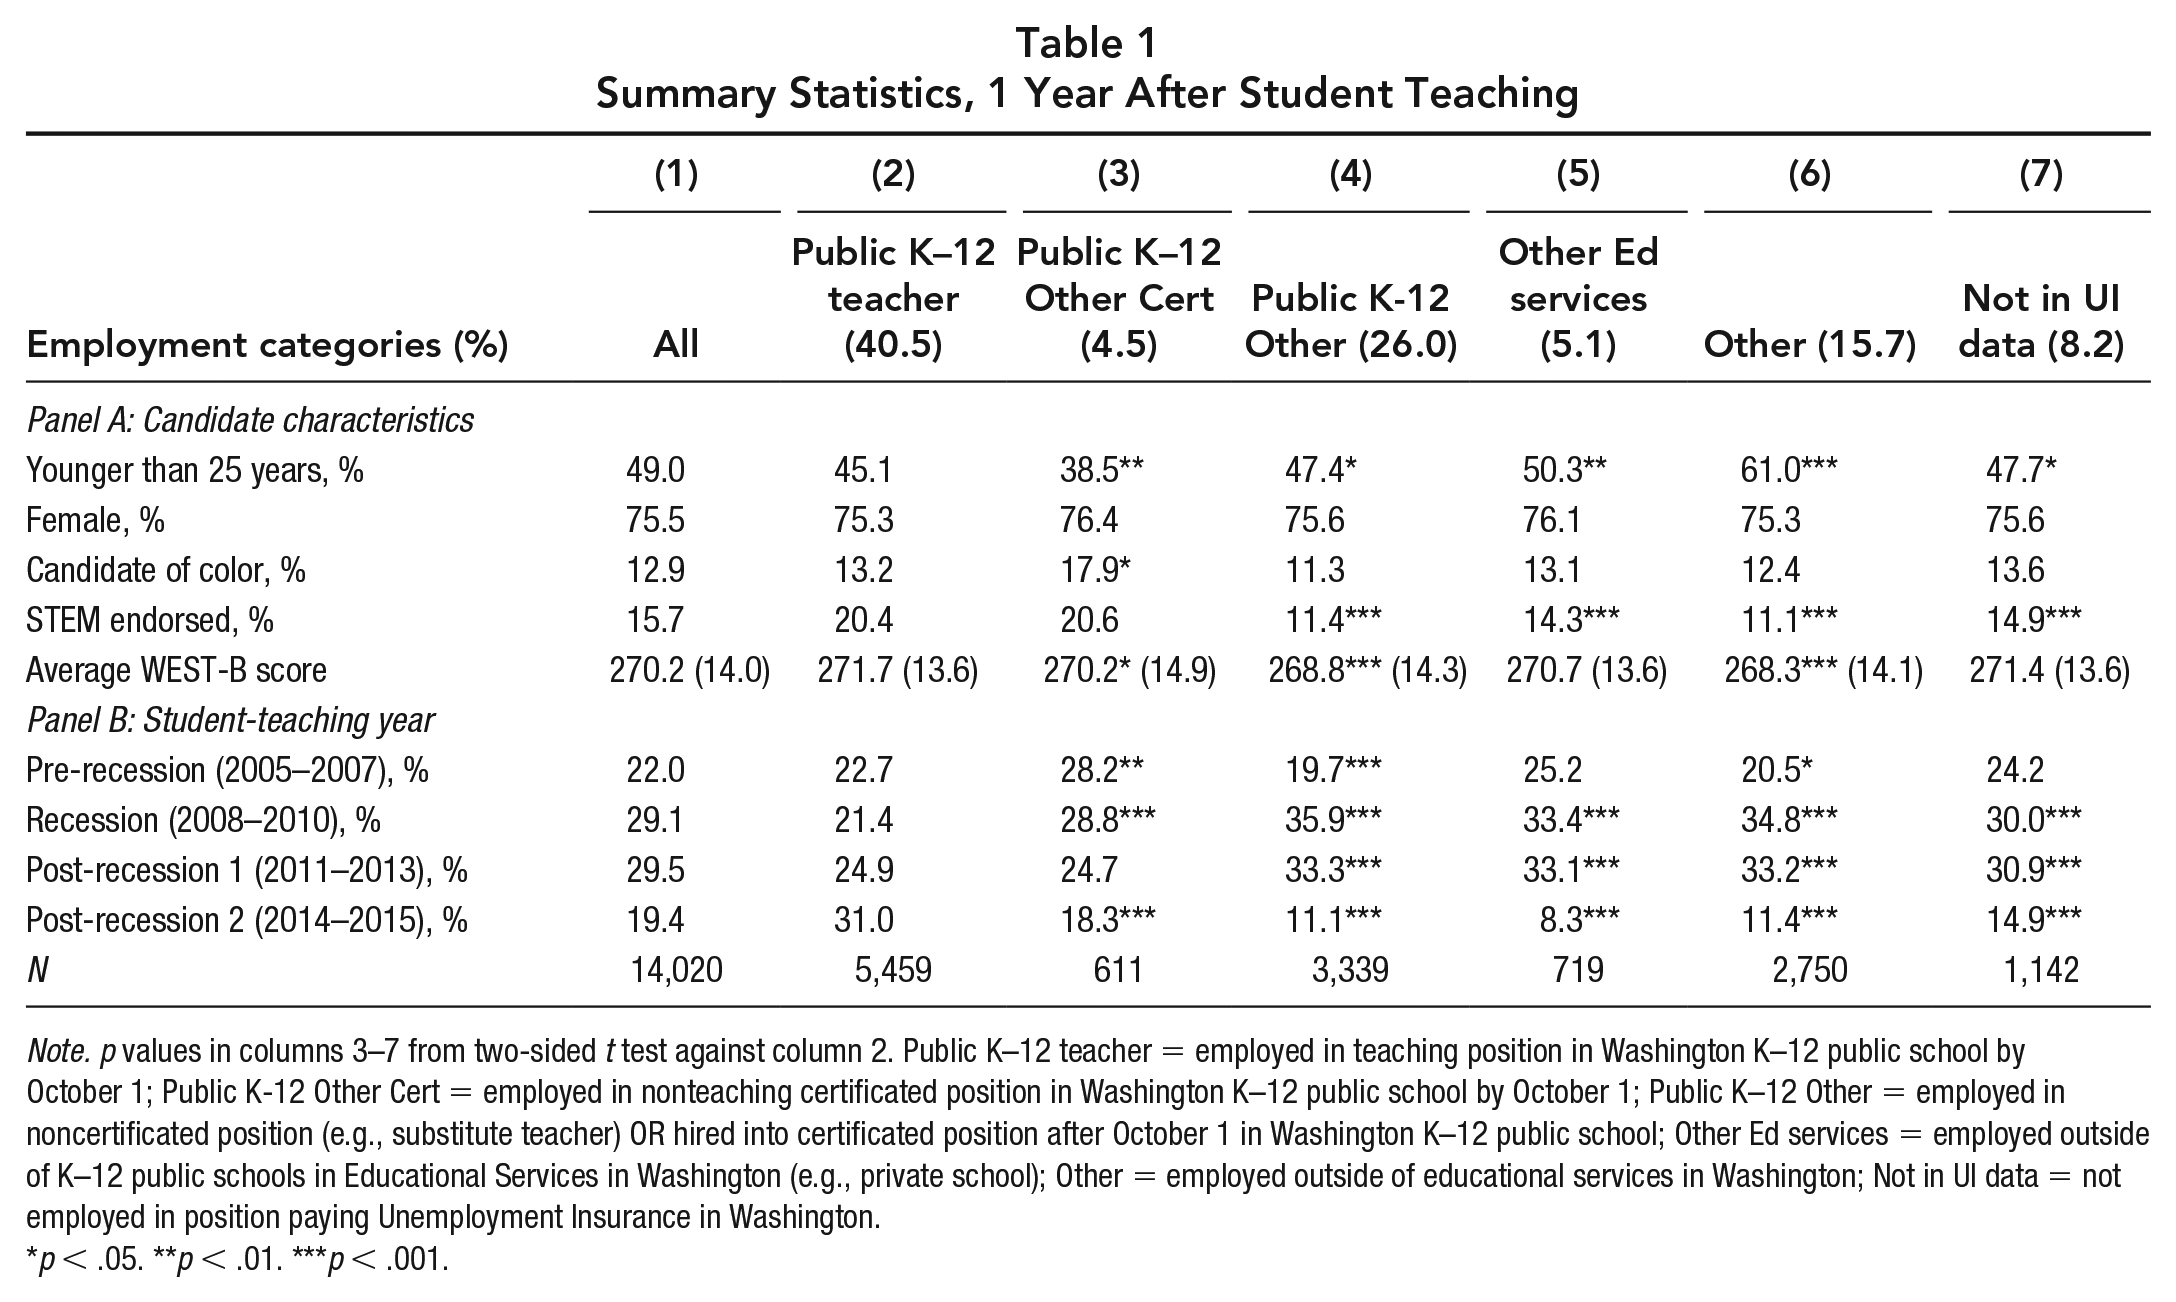
Note. p values in columns 3–7 from two-sided t test against column 2. Public K–12 teacher = employed in teaching position in Washington K–12 public school by October 1; Public K-12 Other Cert = employed in nonteaching certificated position in Washington K–12 public school by October 1; Public K–12 Other
p < .05. **p < .01. ***p < .001.
For each of the five teacher candidate characteristics (described earlier), we tested for differences between the various employment categories in columns 3 through 7 and candidates employed as public K–12 teachers (column 2). We found no significant differences in initial employment outcomes by gender, and few differences by race/ethnicity; the one exception is that candidates of color were more likely to be employed in Public K–12 Other Certificated positions than White candidates in the year after student teaching.
By contrast, we observe substantial differences in employment sectors by candidate age, WEST-B scores, and for candidates that have a STEM endorsement. For instance, STEM-endorsed teacher candidates are only about 16% of all candidates but they represent 20% of those who show up as teachers 1 year out. Likewise, candidates immediately employed as teachers tended to have higher licensure test scores (by nearly one fifth of a standard deviation) than candidates in the other categories. They were also more likely to be younger than 25 years compared with candidates employed in other Public K–12 positions, but less likely to be younger than 25 years compared with candidates employed outside of Educational Services or who did not appear in the UI data at all.
Finally, to explore variation in first-year employment outcomes over time, we present stacked bar plots in Figure 1 that show these outcomes for candidates who did their student teaching in each school year from 2005 through 2015. While the early years of data (2005 through 2008) largely line up with the overall Public K–12 teacher hiring rates shown in the first row of Table 1, subsequent years show massive variation in first-year hiring outcomes by student teaching year. Specifically, Public K–12 teacher hiring plummeted to near 20% during the Recession (2009 through 2011), slowly recovered in the years following the recession (2012 through 2013), and then well surpassed the prerecession hiring rates in the last 2 years of data (2014 through 2015). During the Recession, around 40% of candidates were employed in nonteaching positions in public schools during their first year after student teaching, while another 20% were employed outside of education altogether (“Other”). By 2014, these percentages were each about 10%. Finally, beyond the first year of data, there is relatively little variation in the percent of candidates who fail to appear in the UI data across years.
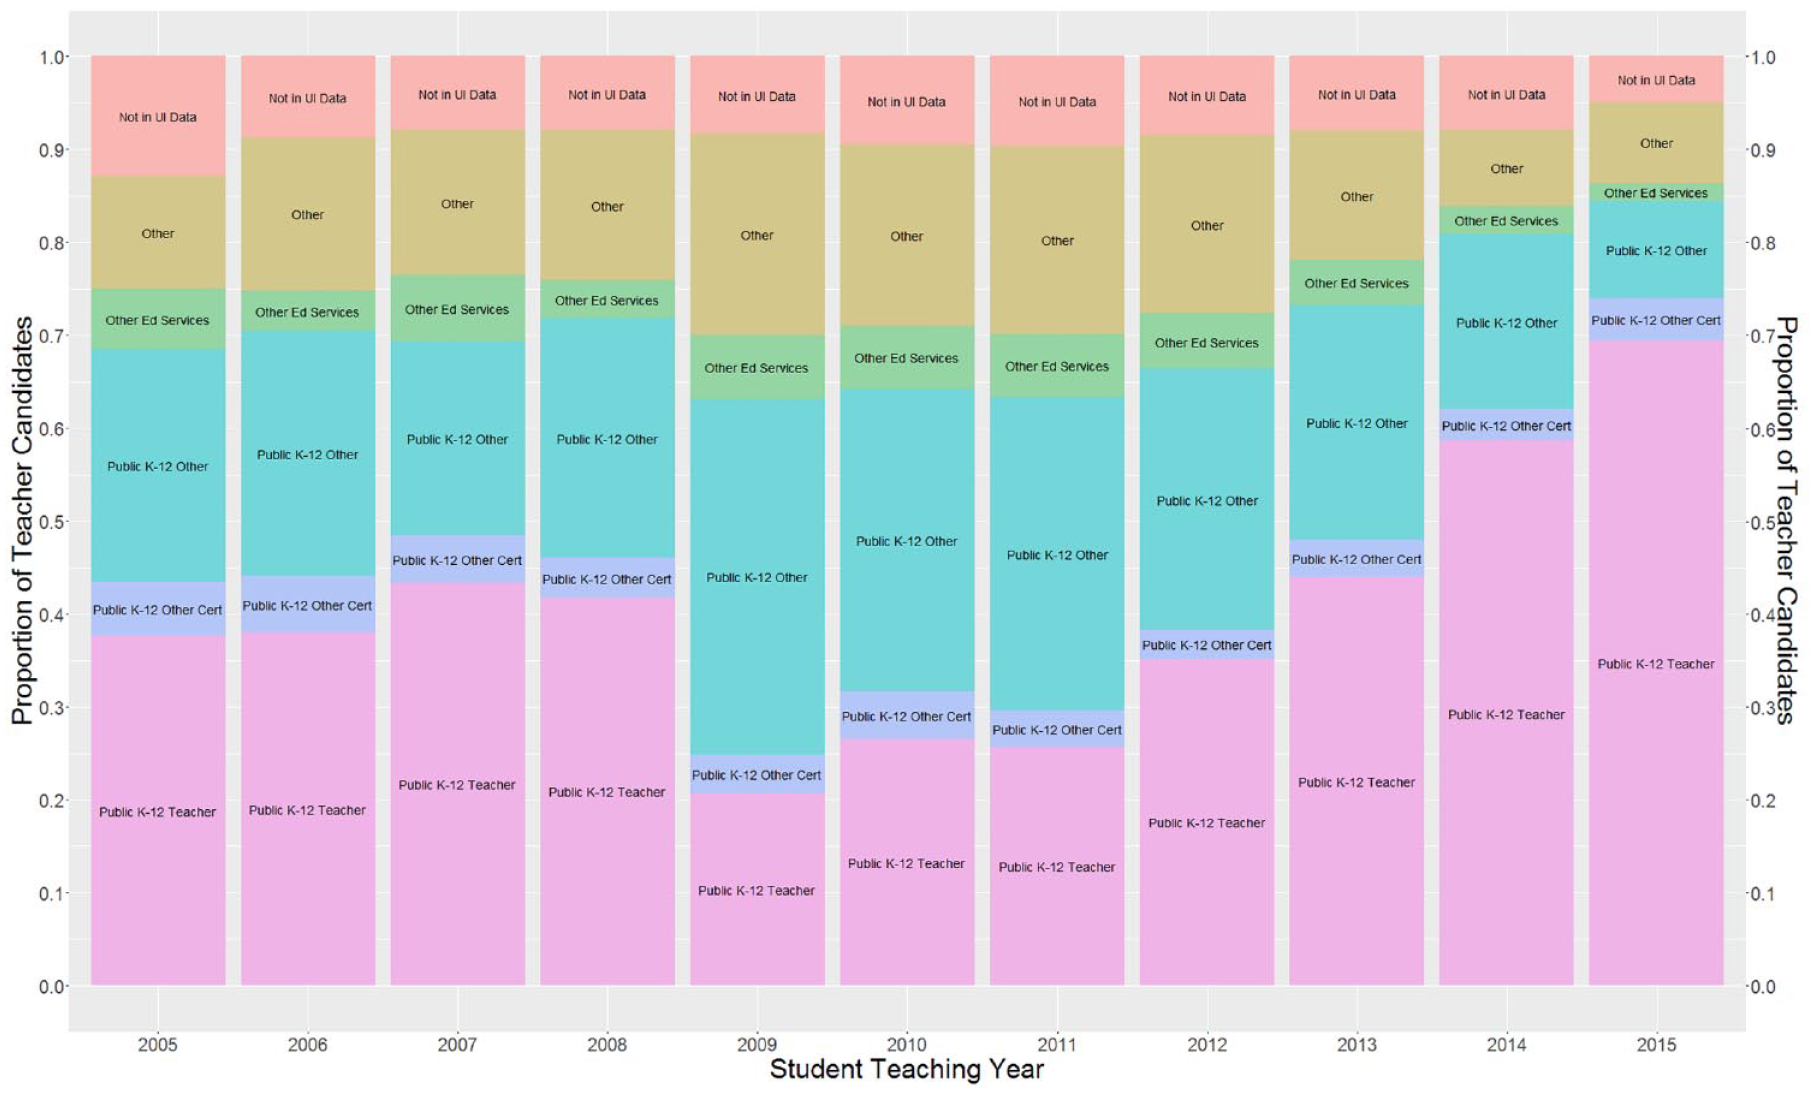
Employment outcomes 1 year after student teaching by student teaching year.
Because of the variation across student teaching years shown in Figure 1, we divide future analyses into four time periods according to when teacher candidates received their credentials: pre-recession (2005 through 2007); recession (2008 through 2010); post-recession 1 (2011 through 2013); and post-recession 2 (2014 through 2015). These categories in Panel B of Table 1 show that candidates who student taught during the recession were much less likely to be employed in public K–12 teaching positions, while candidates who student taught in the second postrecession period were much more likely to be employed in K–12 teaching positions.
Career Transitions of Teacher Candidates (RQ2)
To visualize candidates’ employment outcomes and transitions between employment outcomes over time, we plot outcomes over the first 5 years of teaching for the 12,546 candidates who student taught in 2013 or earlier (and thus can be observed for at least 5 years after student teaching) in the Sankey plots in Figure 2. The stacked bars for each year represent the proportion of candidates in this sample who were observed in each employment sector across the first 5 years after student teaching, while the width of the path between each segment of the stacked bars in years t and t + 1 represents the proportion of candidates who transitioned between the different employment categories year over year.
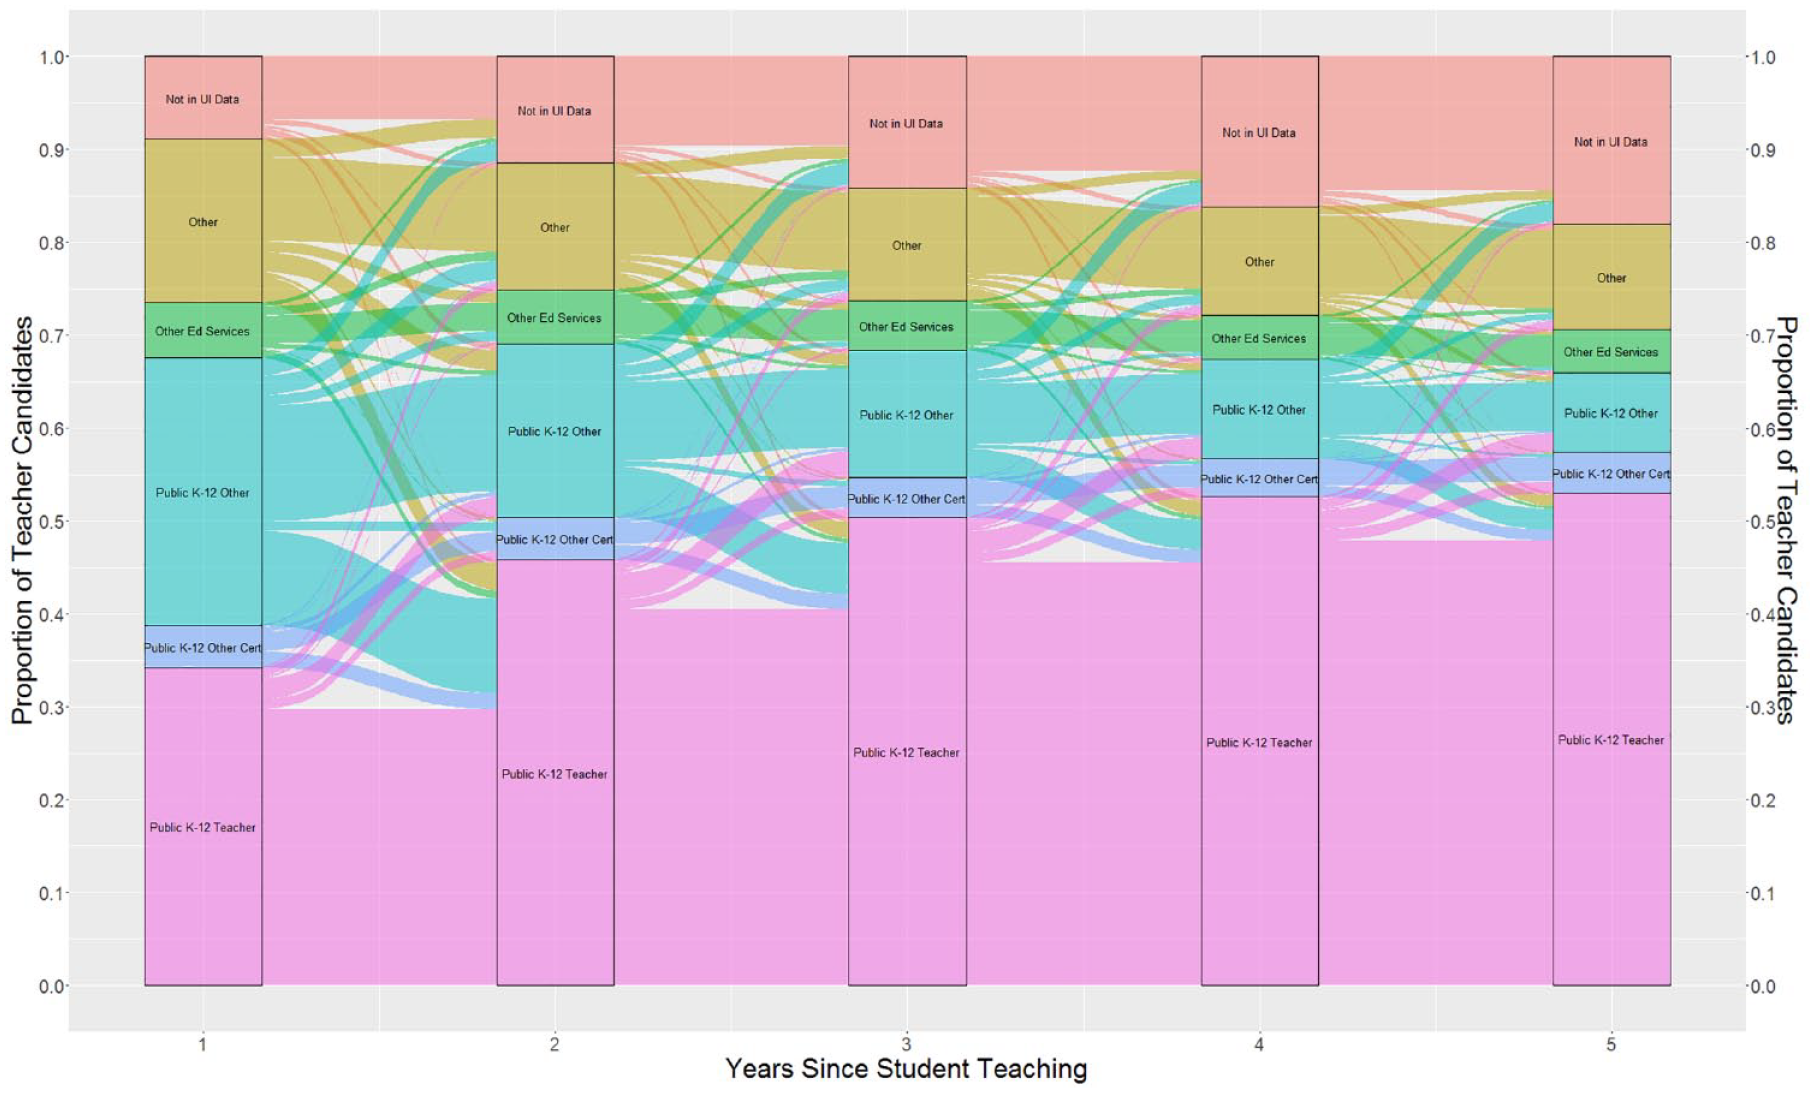
Employment outcomes and transitions, first 5 years (all candidates student teaching 2013 or earlier).
There are a number of interesting patterns that emerge in Figure 2. First, consistent with prior work discussed in the Introduction, rates of employment as a public K–12 teacher increase substantially over the first several years after student teaching. Combining rates of entry with rates of early-career attrition, Figure 2 shows that a little more than half of all teacher candidates were employed as in-state public K–12 teachers 3 to 5 years after student teaching; this is nearly 20 percentage points more than is observed simply looking at the first year after student teaching. Overall (and not shown directly in Figure 2), 66% of all candidates are employed in a Public K–12 teaching position in one of their first 5 years after student teaching.
What has not been shown in prior work are employment outcomes for teacher candidates with delayed entries into the public K–12 teacher labor market. Figure 2 illustrates that the majority of candidates who enter public K–12 teaching 2 to 5 years after student teaching transitioned from employment in other public school positions (e.g., substitute teaching and late hires). In fact, 28% of all teacher candidates who were employed in public K–12 teaching positions 5 years after student teaching were employed in these “Public K–12 Other” positions the first year after student teaching. There are notable transitions into public K–12 teaching from other certificated employment in K–12 public schools (e.g., paraprofessional), but quite little movement into K–12 public teaching for individuals employed outside of public schools immediately after graduation or who were not observed in the UI data. For example, while about 60% of candidates who initially find employment in nonteaching positions in public schools eventually transition into public K–12 teaching positions in their next 4 years after student teaching, less than a third of candidates who are not initially employed in public schools (because they are employed outside of public schools or are not in the UI data) eventually transition to K–12 public teaching positions in the next 4 years.
Figure 2 also illustrates some movement out of K–12 public teaching positions in the first 5 years after student teaching. The overall rates of teacher attrition are in line with national estimates (Goldring et al., 2014)—for example, about 11% of candidates who immediately enter Public K–12 teaching positions the first year after student teaching leave after their first year—but this article provides unique evidence about the employment categories that these individuals enter after leaving the Public K–12 teaching workforce. The most common types of moves are to other employment in K–12 public schools. As with movement into public K–12 teaching, it is relatively rare for candidates to leave K–12 public teaching directly for employment in a field outside of education (“Other” in Figure 1). Finally, while the “Not in UI Data” group does grow over the first 5 years (largely due to transitions from “Public K–12 Other” and “Other” categories), less than 1% of public K–12 teachers move directly from K–12 teaching to this category (i.e., disappear from the UI data altogether).
One of the notable findings in Table 1 is the relatively high rate of public school teaching employment for teacher candidates with STEM endorsements. In Figure 3, we present Sankey plots for the first 3 years after student teaching, separating the sample by candidates with STEM endorsements (Panel A) and without STEM endorsements (Panel B). Figure 3 illustrates two key differences between the early career paths of STEM and non-STEM candidates. First, consistent with Table 1, STEM candidates are hired into public K–12 positions more quickly than non-STEM candidates; specifically, over half of STEM candidates are employed as public K–12 teachers the year after student teaching, compared with less than 40% of non-STEM candidates. Second, STEM candidates are between 7 and 8 percentage points more likely to be employed in education—either in public schools or in positions outside of public schools—than non-STEM candidates in each of the first 3 years after student teaching. This is primarily due to STEM candidates being less likely to be employed outside of education (“Other”), as opposed to not being observed in the UI data at all.
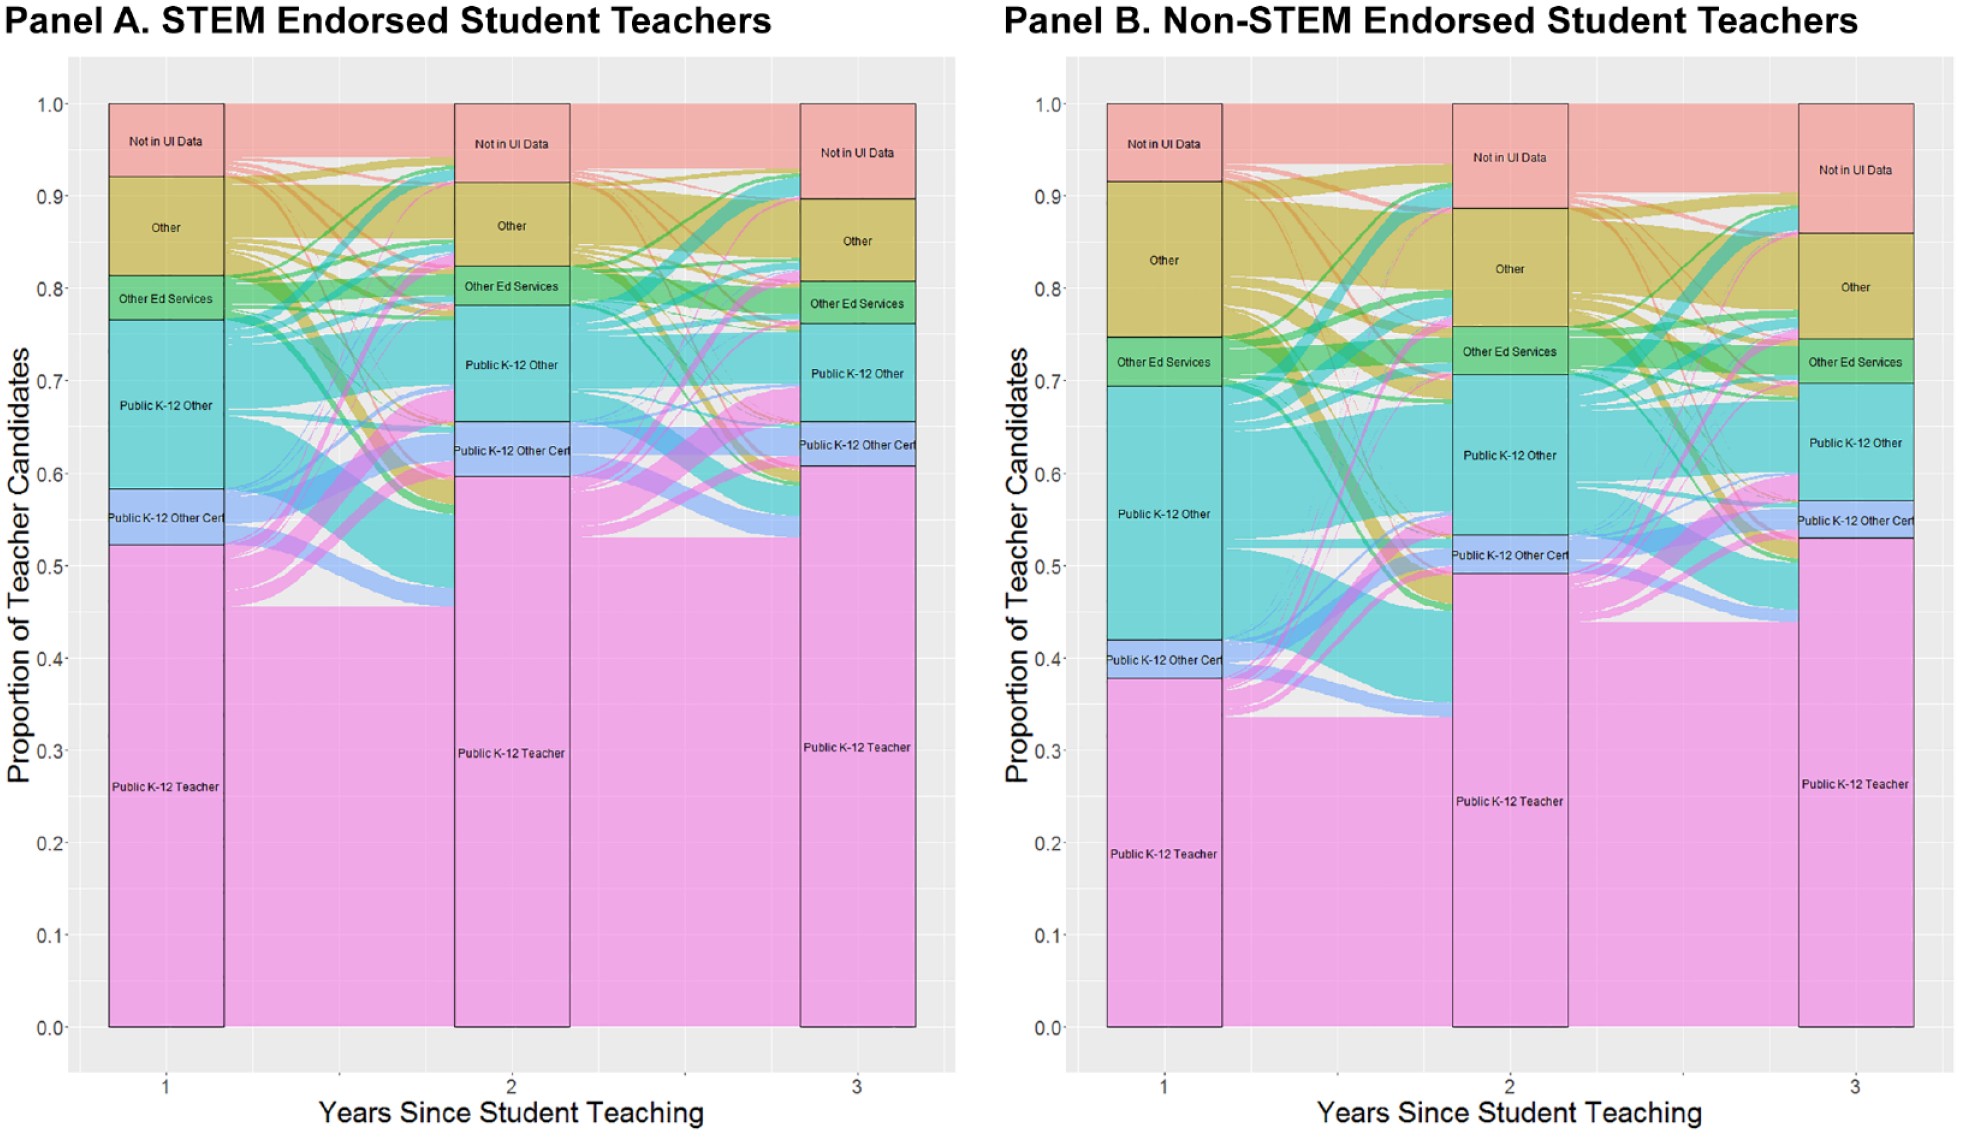
Employment outcomes and transitions, first 3 years (STEM and non-STEM student teachers). Panel A: STEM endorsed student teachers. Panel B: Non-STEM endorsed student teachers.
We next divide the sample into two of the four periods motivated by the trends in Figure 1 and summarized in Table 1—the “Recession” group (those who student taught 2008 through 2010) and the “Post-recession 2” group (those who student taught 2014 through 2015)—and present Sankey plots for these groups in Figure 4 to explore variation in subsequent employment outcomes for candidates in these years. As shown in Figure 1, the most notable difference between these time periods is the rate of initial employment as public K–12 teachers. Specifically, candidates who student taught in the post-recession period were more than twice as likely to be hired into a public K–12 teaching position their first year after student teaching (65%) compared with candidates who student taught during the Great Recession (30%). Most of this difference can be explained by employment in other public school positions and outside of education altogether; for example, candidates from the “Recession” period are twice as likely to be employed outside of education in the year after student teaching. And even 3 years after student teaching, candidates who graduated during the recession are over 20 percentage points less likely to be employed as a public school teacher than candidates in the post-recession period in their first year after student teaching. It is also worth noting that, as shown in Supplemental Appendix Figures A2 and A3 (available on the journal website), the difference in hiring rates between STEM and non-STEM candidates during the recession was greater than after the recession, suggesting that demand for STEM teachers somewhat protected these candidates during the recession.
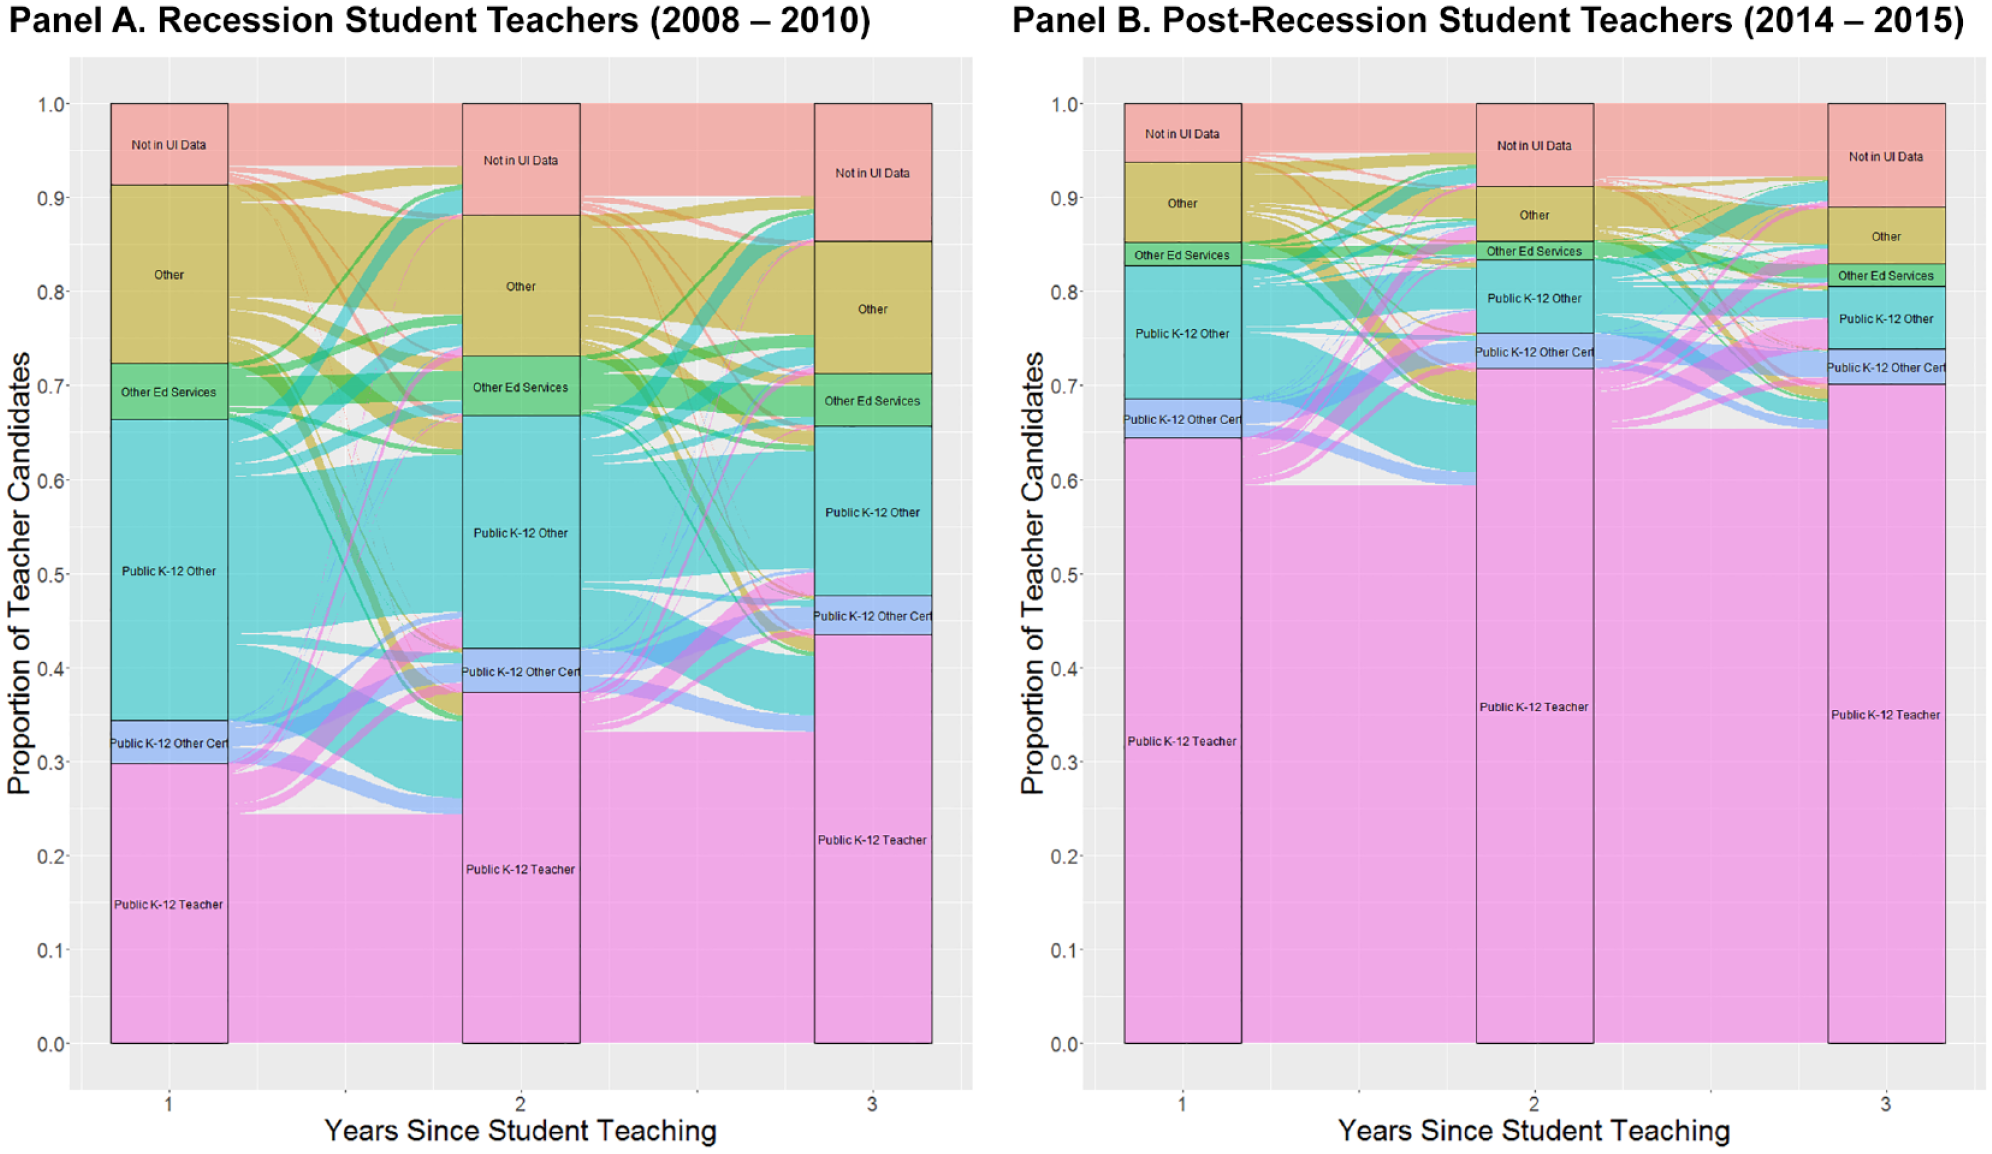
Employment outcomes and transitions, first 3 years (recession and post-recession student teachers). Panel A. Recession student teachers (2008–2010). Panel B. Post-recession student teachers (2014–2015).
There are also some interesting differences in patterns of teacher mobility between these time periods. As one notable example, the proportion of candidates who started in public K–12 positions and transitioned to other public school employment after their first year of teaching is considerably higher for the recession group than for the post-recession group. One potential explanation for this is that extensive Reduction-in-Force (RIF) notices were given to early-career teachers in 2009 and 2010 (Goldhaber & Theobald, 2013), and while few of these teachers were ultimately laid off, there is some evidence of RIF-induced early-career attrition from the teacher workforce (Goldhaber et al., 2016). Finally, it is notable that rates of “Not in UI Data” do not vary by more than a few percentage points between the two groups; this is important as it suggests that the recession primarily influenced the type of employment teacher candidates found after student teaching, not whether they found employment in Washington at all.
Discussion
As we describe above, the past decade has seen a large increase in quantitative research connecting preservice teacher education experiences, particularly student teaching, to inservice teacher outcomes. But to our knowledge, this is the first study to document employment outcomes for a large sample of credentialed teacher candidates who never enter the teaching workforce. We find that in the year after student teaching many teacher candidates were initially employed in positions that might be seen as adjacent to public school teaching, and that many of these people ended up in the teacher labor market in later years.
There are a number of limitations to this study. In particular our findings should be interpreted as descriptive and focused on a set of 15 TEPs within a single state (Washington). We also cannot know whether the career transitions of teacher candidates reflect supply- or demand-side factors in the labor market (because we do not observe job applications or offers). That said, the patterns we observe in Washington are at least consistent with prior claims based on national data (e.g., Cowan et al., 2016) that entry into the labor market is driven more by demand than supply. In particular, we document large differences in the likelihood of observing teacher candidates in public school teaching positions that correspond to the economic cycle, which corresponds with the number of teaching slots available. Were the changes in workforce entry driven mainly by the preferences of teacher candidates, we might expect that probability of entry to drop as the broader labor market becomes tighter. Instead, we see the opposite.
Moreover, it is clear that a significant share of those who move into teaching positions in later years (more than a year after student teaching) do so from what we might consider teacher employment “bench” positions, such as substitute teaching or paraprofessionals. This lends credence to the unsurprising conclusion that a high share of those who train to become a teacher but do not immediately enter a teaching position are outside of the teacher labor market not because it reflects their preferences, but rather because they cannot find a position. Alternatively, it is possible that candidates view these “bench” positions as a way of determining whether a teaching career is right for them.
The results also have important implications for how policymakers should think about the “bench” of potential K–12 teachers, and, in turn, the prospect of future “teacher shortages.” In particular, our results suggest that the bench of potential K–12 teachers is quite large, as almost half of all credentialed teacher candidates are not teaching in K–12 public schools in any given year, but many of these end up in the teacher workforce in later years. Clearly then, for accuracy, it is important for teacher supply and demand estimates to consider the dynamic nature of entry of teacher candidates into the teacher workforce (e.g., Lindsay et al., 2016; Sutcher et al., 2016).
With that said, the bench of individuals who could serve as teachers is less robust when we drill down to examine the transitions of STEM teacher candidates. Indeed, our study, from a different angle, is just the latest of many to document or raise concerns (e.g., American Association for Employment in Education, 2008) about the challenge the country faces in increasing the front-end of the STEM teacher pipeline. Indeed, when we dig into the bench of potential teachers, we see vast differences according to whether a teacher candidate has STEM preparation. This is likely related to the supply and demand for STEM teachers in the state. For example, using data on all teachers and initial credentials in Washington (i.e., not just limited to the 15 TEPs participating in TELC) for the same years of data we use for this study (2004–2005 through 2014–2015), we find that the state granted fewer initial STEM teaching credentials (7,139) than the number of teachers with STEM credentials who left the workforce (7,235). This is consistent both with the trends in Figure 2 and the difficulties that districts experience in recruiting and retaining STEM teachers (Dee & Goldhaber, 2017; Goldhaber, Krieg, & Theobald, 2014).
On the other hand, over this same period, the state granted almost 25,000 new elementary credentials (24,838), while only about 20,000 teachers with this endorsement left the state’s teaching workforce (20,066). Not surprisingly, then, when we examine the bench further, we find that it is dominated by candidates with an elementary endorsement. For example, while only 41% of candidates hired immediately after student teaching have an elementary endorsement, over half (55%) of candidates employed in noncertificated education positions—and thus appear to be “on the bench” waiting for a public school position to open—have an elementary endorsement. This has important implications for how we think about the pool of potential public school teachers and the misalignment between the supply and demand for K–12 public teachers in different subject specialties. As one example, these trends are difficult to square with Elementary Education being listed as a “shortage area”—and thus an area in which teacher candidates in Washington are eligible to receive TEACH grants—in recent Teacher Shortage Areas data (U.S. Department of Education, 2021), and also suggests that TEPs and states should provide better signals to potential teachers about demand for teachers in different subject areas.
Finally, this analysis may be helpful in pointing policymakers toward places to look (or advertise) for teachers when labor markets are tight. Transitions within education employment (e.g., from other public K–12 positions like substitute teaching and early childhood education to public K–12 teaching) are much more common than transitions to K–12 teaching from employment outside of education. This suggests that, even in times of slack labor markets, states and school systems may want to find ways to keep candidates who do not find immediate K–12 teaching employment engaged with the education system. This could be as simple as encouraging candidates to apply for substitute teaching credentials or finding other ways of employing these candidates within the public school system. By doing this, states and districts could plausibly increase their bench of potential K–12 teachers for times when labor markets tighten again.
Supplemental Material
sj-pdf-1-edr-10.3102_0013189X221077042 – Supplemental material for Lost to the System? A Descriptive Exploration of Teacher Candidates’ Career Paths
Supplemental material, sj-pdf-1-edr-10.3102_0013189X221077042 for Lost to the System? A Descriptive Exploration of Teacher Candidates’ Career Paths by Dan Goldhaber, John Krieg, Roddy Theobald and Stephanie Liddle in Educational Researcher
Footnotes
Notes
Authors
References
Supplementary Material
Please find the following supplemental material available below.
For Open Access articles published under a Creative Commons License, all supplemental material carries the same license as the article it is associated with.
For non-Open Access articles published, all supplemental material carries a non-exclusive license, and permission requests for re-use of supplemental material or any part of supplemental material shall be sent directly to the copyright owner as specified in the copyright notice associated with the article.