
Abstract
The COVID-19 pandemic has been a seismic and ongoing disruption to K–12 schooling. Using test scores from 5.4 million U.S. students in Grades 3–8, we tracked changes in math and reading achievement across the first 2 years of the pandemic. Average math test scores in the fall of 2021 in Grades 3–8 were .20–.27 standard deviation (SD) lower relative to same-grade peers in the fall of 2019, while reading test scores decreased by .09–.18 SD. Achievement gaps between students in low-poverty and high-poverty elementary schools grew by .10–.20 SD, primarily during the 2020–2021 school year. Achievement disparities by student race/ethnicity also widened substantively. Observed declines are more substantial than during other recent school disruptions, such as those due to natural disasters.
Keywords
Background
Since the COVID-19 pandemic began in March 2020, educators, parents, and policy makers have been concerned about potential lost learning associated with ongoing disruptions to schooling. Initial predictions drawing from research on summer learning loss, school disruptions due to inclement weather, and absenteeism research projected that students would not acquire 30%–50% of their expected learning due to the school closures in the spring of 2020 (Kuhfeld, Soland, et al., 2020). Researchers and educators also expected pandemic shocks to widen existing educational inequalities, both on the basis of race and income. For example, a survey of education researchers in November 2020 predicted that by the spring of 2021, there would be large increases in achievement gaps between low- and high-income students in elementary school (Bailey et al., 2021). Gaps were hypothesized to widen due to in-school factors, such as educational resources, and out-of-school factors, such as higher COVID-19 exposure risks and less access to high-quality health care coverage for poor families.
Assessment data collected during the 2020–2021 school year provide an initial understanding of student achievement during the early stages of the COVID-19 pandemic. In some cases, related research has relied on state summative assessments, with results indicating larger declines in math than in reading between the spring of 2020 and the spring of 2021 (Halloran et al., 2021; Thorn & Vincent-Lancrin, 2021; West & Lake, 2021). However, many critics have cautioned against interpreting trends in achievement test results between 2019 and 2021 due to differences in (a) testing population (Ho, 2021), (b) test mode of administration (Barnum, 2021), and (c) the length and content of the tests themselves (Gerwetz, 2021). In other cases, interim achievement tests have been used to examine student growth, including during the 2020–2021 school year. For example, Lewis et al. (2021) show that although the average student demonstrated positive gains in math and in reading during the 2020–2021 school year, they were still behind typical (pre-pandemic) averages by the spring of 2021. Finally, summative and interim tests show preliminary evidence of widening achievement gaps by race/ethnicity and income (Halloran et al., 2021; Thorn & Vincent-Lancrin, 2021; West & Lake, 2021), although these studies are not able to differentiate the period(s) in which gaps widened the fastest.
These initial findings coalesce around a similar story, but important gaps remain in our understanding of how COVID-19 has affected achievement. First, although evidence suggests that students began the 2020–2021 school year less prepared than in prior years (Kuhfeld, Tarasawa, et al., 2020), little is known about how prepared students were when they entered school in the fall of 2021, relative to both the fall of 2020 (directly following the pandemic’s onset) and the fall of 2019 (prior to the emergence of COVID-19). Such information could help educators and policy makers contextualize the academic challenges that students currently face and, it is hoped, provide data germane to addressing those challenges. Second, although many researchers anticipated income-based achievement gaps widening approximately 25%–30% by the spring of 2021 (Bailey et al., 2021), little is known about how these forecasts played out, including how gaps have changed over the entire scope of the pandemic thus far. 1 Finally, although initial research has indicated that students of color were disproportionately affected by the pandemic (Dorn et al., 2020; Lewis et al., 2021), little is known about the educational progress of minoritized students across the pandemic.
This Study
This brief uses new achievement data from the fall of 2021 (as well as fall data from the 2 prior years) to examine how student reading and math achievement at the beginning of the school year has changed across the course of the COVID-19 pandemic thus far. Using data from more than 5.4 million students in Grades 3–8 who took MAP Growth assessments in reading and math, we compared test scores in the fall of 2021 relative to those of same-grade peers in the fall of 2020 and the fall of 2019 in 12,000 schools that administered MAP Growth 2 assessments consistently across all three pandemic-impacted school years (2019–2020, 2020–2021, and 2021–2022). We addressed two research questions:
Have test scores decreased during the first 2 years of the pandemic (e.g., comparing third-grade achievement in the fall of 2019 and the fall of 2021)? If so, is that decline attributable to drops occurring (a) in the early phase of the COVID-19 pandemic, immediately following school closures, or (b) during the 2020–2021 school year?
Did achievement gaps by school poverty and race/ethnicity widen following the onset of the COVID-19 pandemic? If so, did gaps primarily increase (a) in the early phase of the COVID-19 pandemic, immediately following school closures, or (b) during the 2020–2021 school year?
In examining these questions, we used several strategies to help stave off threats to test score comparability before and after the pandemic. For example, we limited analyses to schools that tested at all timepoints to help address attrition and used an achievement test that was the subject of a “mode” study examining the comparability of in-person versus remotely administered assessments (Kuhfeld, Lewis, et al., 2020). These strategies are detailed more in the supplemental online materials. However, we cannot rule out that such issues may contribute to changes in achievement over time to some degree.
Results
Math Achievement Dropped Across the First 2 Years of the Pandemic, While Reading Achievement Dropped Primarily Between the Fall of 2020 and the Fall of 2021
Figure 1 presents changes in average test scores in standard deviation (SD) units 3 in the fall of 2020 and the fall of 2021 relative to the fall of 2019. Depending on grade, math test scores were .11–.18 SD (the value denoted by the green bars) lower in the fall of 2020 relative to the fall of 2019 4 and then decreased an additional .09–.13 SD by the fall of 2021 (the difference between the green and purple bars). These results imply that the first and second years of the COVID-19 pandemic each resulted in similar math declines and that students have begun the school year less prepared in each year since the pandemic began. Meanwhile, reading shows a notably different pattern across the 2 years. Specifically, students showed mostly similar performance in the fall of 2020 compared to their same-grade peers before the pandemic (changes ranging from –.02 to .05 SD by grade). However, sizable drops occurred between the fall of 2020 and the fall of 2021 (.13–.23 SD).
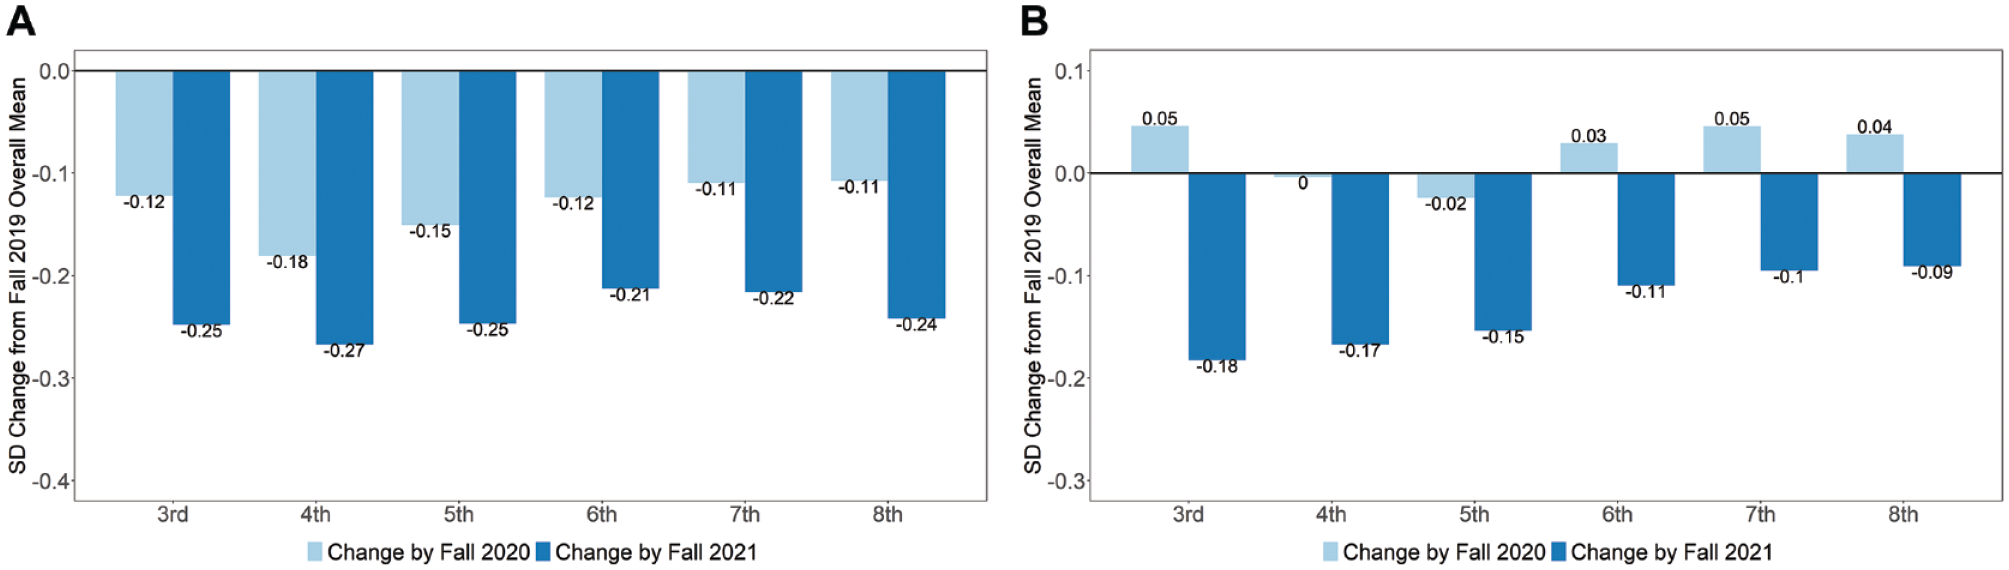
Trends in MAP growth test scores in the fall of 2020 and the fall of 2021 (relative to same-grade peers in the fall of 2019). (A) Math. (B) Reading.
Gaps Between Low- and High-Poverty Schools Increased Primarily During the 2020–2021 School Year
Figure 2 displays changes in achievement gaps for low-poverty versus high-poverty schools between the fall of 2019 and the fall of 2021 (see the online supplemental materials for calculations). Prior to the pandemic (e.g., the fall of 2019), there was already an approximately 1 SD difference in achievement between students in low- and high-poverty schools in both subjects (denoted by the circle at the base of the arrow). 5 In the elementary school grades, these gaps are now approximately 20% wider in math and 15% wider in reading relative to before the pandemic (corresponding to a .20 SD change in math and a .13 SD change in reading). However, changes in gaps by school poverty were much more modest in the middle-school grades.
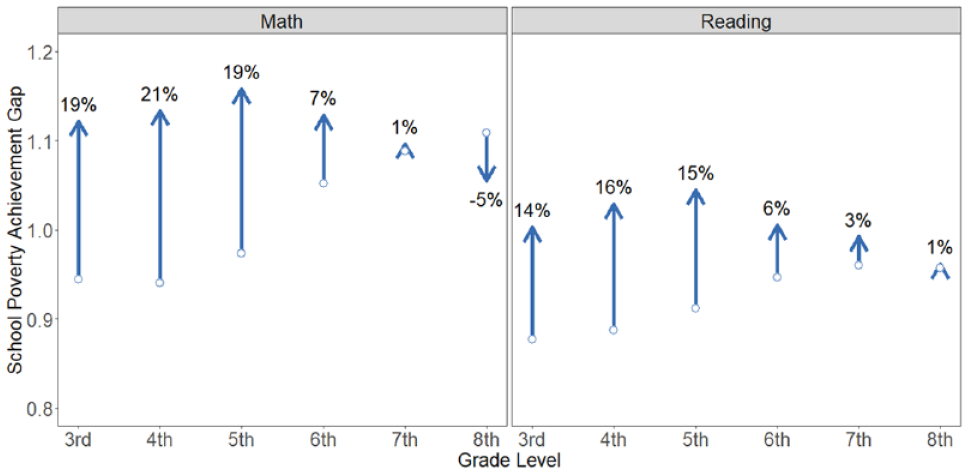
Changes in achievement gaps between low- and high-poverty schools between the fall of 2019 and the fall of 2021 by grade and subject.
We also investigated the timing of when the school poverty achievement gap widened. Figure 3 displays the changes in average performance by school poverty level during the early stages of the pandemic (the fall of 2019 vs. the fall of 2020) and the 2020–2021 school year (the fall of 2020 vs. the fall of 2021). Although students in low- and high-poverty schools showed declines in math following the onset of the pandemic, there are striking differences in the patterns observed during the 2020–2021 school year by school poverty. Test scores continued to slide considerably for students in high-poverty elementary schools between the fall of 2020 and the fall of 2021, but they declined much more modestly in low-poverty elementary schools. In reading, both groups held steady between the fall of 2019 and the fall of 2020 and then showed sizable declines between the fall of 2020 and the fall of 2021, with moderately larger declines for students in high-poverty schools such that gaps widened.
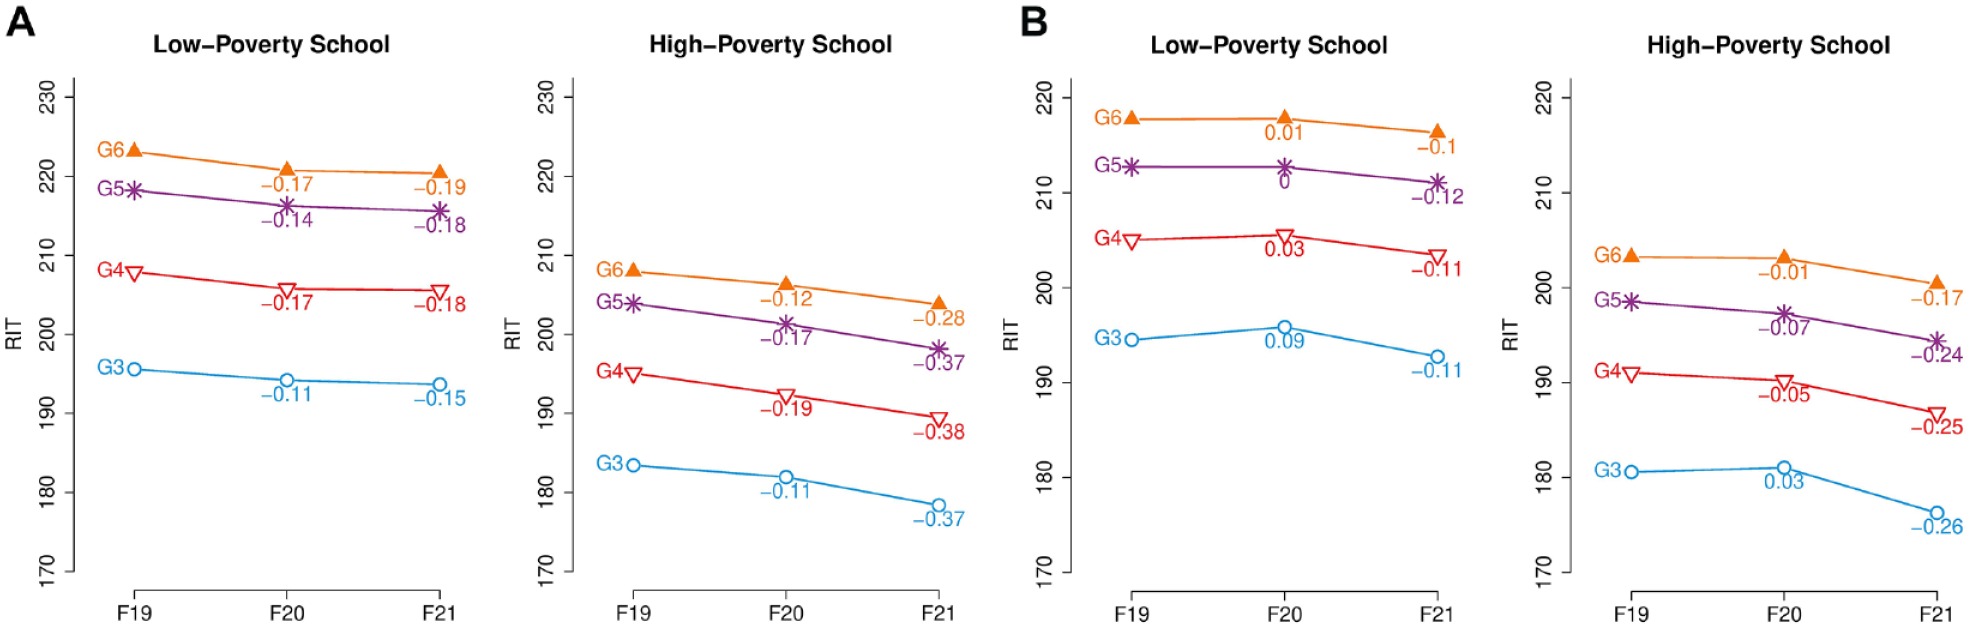
MAP growth test scores in the fall of 2019, 2020, and 2021 by school poverty in math and reading. (A) Math. (B) Reading.
Finally, Figure 4 shows trends in achievement by race/ethnicity. Our results indicate that Black and Hispanic students testing in the fall of 2021 were already scoring substantially lower than the national averages in the fall of 2019, and the magnitude of those gaps widened considerably by the fall of 2021. For example, the math test scores for Hispanic third graders were .30 SD below the national average in the fall of 2019, a gap that grew to .61 SD for Hispanic third graders in the fall of 2021. Black students scored .44–.52 SD below the national average in the fall of 2019, which widened to .75–.86 SD below the pre-pandemic mean by the fall of 2021. In reading, test scores for Black, Hispanic, and American Indian and Alaska Native students showed sizable test score drops between the fall of 2019 and the fall of 2021, whereas White and Asian students’ reading test score drops were much more modest.
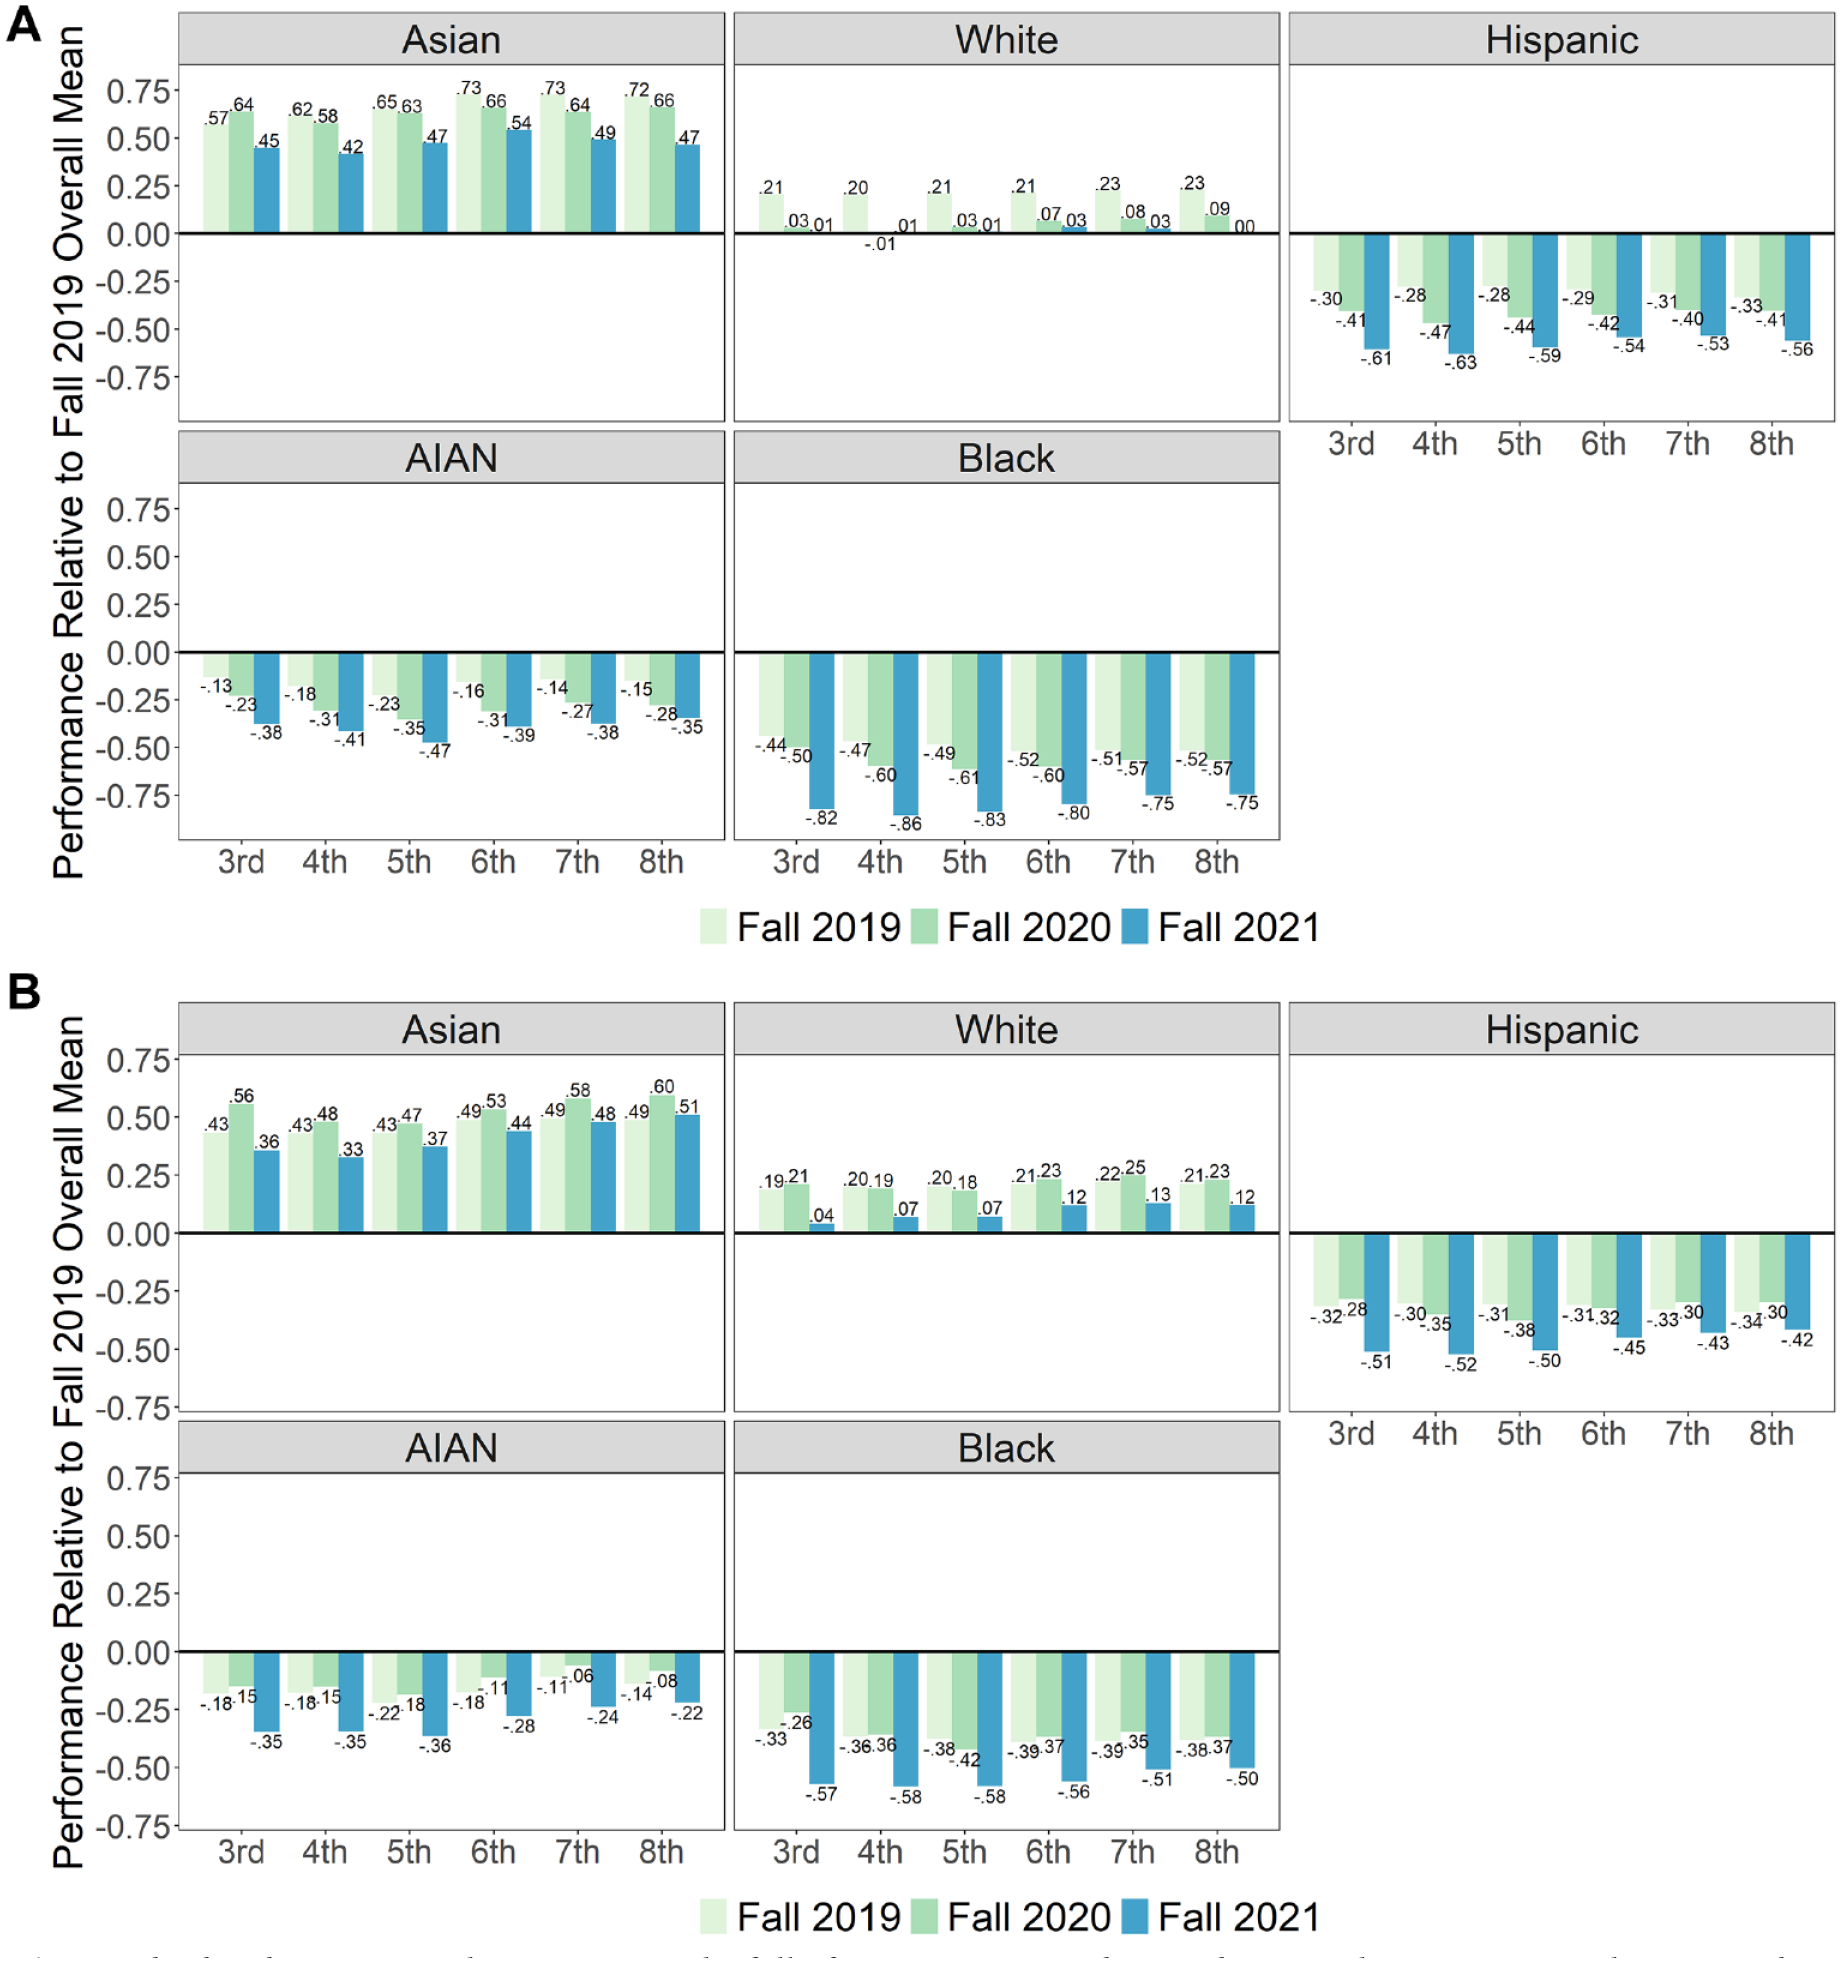
Standardized MAP growth test scores in the fall of 2019, 2020, and 2021 by race/ethnicity. (A) Math. (B) Reading.
Discussion
The COVID-19 pandemic represents an unprecedented interruption to students’ lives and schooling experiences, so it is perhaps not surprising that large academic declines were observed during this period. We found that average same-grade math test scores dropped by .20–.27 SD between the fall of 2019 and the fall of 2021. These drops are significantly larger than estimated impacts from other large school disruptions, such as after Hurricane Katrina (Sacerdote [2012] reports that math scores dropped .17 SD in 1 year for New Orleans evacuees). Further, while we observed the effects of the early phase of the pandemic mainly on math, large declines in reading test scores emerged between the fall of 2020 and 2021, suggesting that reading has also been negatively affected. Although we should not speculate about the potential causes of the decline in reading between the fall of 2020 and 2021, understanding it will likely be vital to helping students catch up as they continue to move through school.
Second, we show that, as hypothesized by educational researchers (e.g., Bailey et al., 2021), gaps by school poverty have indeed expanded substantively during the COVID-19 pandemic. In the elementary grades (where widened gaps were most evident), school income-based gaps increased by roughly 20% in math and 15% in reading. These estimates are similar to, but slightly lower than, researcher’s projections. 6 However, our results corroborate the prediction that math would be more affected than reading (in terms of overall achievement declines and widening of achievement gaps). Although speculative, this result is possibly because parents have more capacity to support learning in reading and are more likely to routinely engage their children with reading as opposed to math learning (Sawchuk & Sparks, 2020). Beyond subject differences, several potential mechanisms could be driving these changes in gaps. For example, Bailey et al. (2021) articulate mechanisms including (a) worse health care coverage among low-income families, affecting parents’ ability to provide for their children; (b) poorer access to computer technology/Wi-Fi among low-income families, affecting access to online instruction; (c) fewer resources available to high-poverty schools to address learning disruptions; and (d) the ability of higher-income families to afford tutors and other forms of instruction to supplement public school offerings. Unfortunately, our study cannot disentangle these factors.
Consistent with studies conducted earlier in the pandemic (Dorn et al., 2020; Lewis et al., 2021), we observed that existing achievement disparities by race/ethnicity were exacerbated between the fall of 2019 and the fall of 2021. This finding is aligned with the growing body of evidence that communities of color disproportionately bore the economic, social, and health consequences of the pandemic (Centers for Disease Control and Prevention [CDC], 2022). Black and Hispanic children were more likely than White and Asian children to have a family member get sick or die from COVID-19, to struggle with food insufficiency, and to face eviction or housing instability (CDC, 2021; Center on Budget and Policy Priorities, 2022). Additionally, students in majority Black and Hispanic schools were more likely to attend school remotely during the 2020–2021 school year (Camp & Zamarro, 2021) and reported facing more obstacles to learning during the pandemic, including feeling depressed, stressed, or anxious and having concerns about the health of their family members (YouthTruth, 2021).
The widening of school poverty and racial/ethnic gaps is in part attributable to differential patterns in how test score declines have accumulated across the scope of the pandemic. Specifically, during the 2020–2021 school year, high-poverty schools continued to experience declines in math and had larger losses in reading, whereas low-poverty schools avoided further losses in math and saw less severe losses in reading. The result is that the pandemic has taken a larger toll on students in high-poverty schools. Thus, educators working in high-poverty schools likely have an even more difficult task to address the effects of COVID-19. Although our study covers multiple years, the ultimate effects of these learning disruptions and their impact on gaps remain difficult to ascertain. More concretely, lower achievement could be a proxy for long-term learning challenges that will persist in the coming years. On the other hand, test score declines might mostly reflect the deprivation of learning opportunities and missed curricular content specific to the COVID-19 schooling disruptions. If this is the case, we might expect a rebound in future years as schools implement supplemental recovery programs and interventions. As evidence supporting the potential for recovery, students in New Orleans affected by Hurricane Katrina saw large drops in achievement immediately following the storm, but achievement generally rebounded 2 years out (Sacerdote, 2012).
These findings point to some important implications for setting policies to support academic recovery in the wake of the pandemic, although we encourage district leaders to use local data to understand whether national trends are reflective of their students. First, our results show that math declines were larger than in reading, suggesting that more resources to support math instruction may be warranted. Second, we find evidence of increasing poverty gaps, particularly for the younger grades, which may call for targeting additional supports and resources toward schools in high-poverty areas, and elementary schools in particular. Given that students in poorer communities have also likely been affected more by economic, health, and socioemotional effects of the pandemic (Thorn & Vincent-Lancrin, 2021; West & Lake, 2021), policy makers may need a strategy that addresses educational, health, and economic impacts of the pandemic in tandem. Finally, understanding the magnitude of the declines may also be useful in matching recovery needs with interventions that are likely to be able to produce the test score gains required to recoup lost ground. For instance, policy makers may wish to employ such interventions as high-dosage tutoring that have been shown to produce effect size gains on par with the losses associated with the pandemic, a topic discussed in more detail by Kraft and Falken (2021) as well as by Kuhfeld et al. (2022).
Supplemental Material
sj-pdf-1-edr-10.3102_0013189X221109178 – Supplemental material for Test Score Patterns Across Three COVID-19-Impacted School Years
Supplemental material, sj-pdf-1-edr-10.3102_0013189X221109178 for Test Score Patterns Across Three COVID-19-Impacted School Years by Megan Kuhfeld, James Soland and Karyn Lewis in Educational Researcher
Footnotes
Notes
Authors
References
Supplementary Material
Please find the following supplemental material available below.
For Open Access articles published under a Creative Commons License, all supplemental material carries the same license as the article it is associated with.
For non-Open Access articles published, all supplemental material carries a non-exclusive license, and permission requests for re-use of supplemental material or any part of supplemental material shall be sent directly to the copyright owner as specified in the copyright notice associated with the article.