
Abstract
How school districts measure homelessness among their students has implications for accountability and funding, as well as for supporting student success. Yet, measuring homelessness among high school students is challenging because students move in and out of experiencing it. Using administrative student-level data from a mid-sized public school district in the southern United States, we show that different commonly used procedures to measure which students are considered homeless can yield markedly different estimates of high school graduation rates for these students. This is largely because of differences in how districts classify students who experience homelessness but later become housed. To address the potentially negative effects of housing insecurity on academic achievement, it is important to first identify a common way to diagnose the problem.
Keywords
How school districts measure homelessness among their students has implications for understanding academic outcomes, accountability, and funding. Yet, measuring homelessness among high school students is challenging because homelessness is a dynamic experience, not a stable characteristic (Cutuli & Herbers, 2019; Kang, 2021). Using administrative student-level data over 12 years from a mid-sized public school district in the southern United States, referred to as the District, we aim to understand: (1) how students move in and out of experiencing homelessness in high school; (2) whether different ways of characterizing patterns of student housing insecurity leads to distinct estimates of graduation and college-going rates among students who experience homelessness; and (3) how experiences of homelessness in high school relate to graduation and college-going.
Students experiencing homelessness can face a myriad of problems that challenge their academic achievement and overall welfare (Cowen, 2017; GAO, 2016). But to address problems related to homelessness, school districts and states must first effectively diagnose the problems, including determining homelessness’s prevalence. Federal guidance instructs districts how to define homelessness at a given point in time (42-U.S.C.-§11434a); however, there is no national consensus on how districts should measure homelessness when estimating aggregate outcomes or considering housing insecurity over time. Understanding the difficulties faced by housing-insecure high school students is important so that schools can target and deploy aid. Supporting these students can be imperative for their contemporary academic achievement and future well-being: students who do not graduate high school are more likely to experience homelessness later in life than peers who graduate (Morton et al., 2017). Moreover, using different measures across districts to estimate homelessness’s prevalence can lead policymakers to have different understandings of the magnitude of students’ challenges and result in suboptimal solutions (Davidson et al., 2015; NCHE, 2020). Such differences can impede across-state comparisons that contribute to targeted and efficient policymaking and have implications for funding since the federal government targets funds through the McKinney-Vento Act to districts that have the most students experiencing homelessness and lowest achievement (Cunningham et al., 2010). Furthermore, for researchers, although different definitions may allow more flexible exploration of different research questions, clear and consistent measurement better enables comparability across studies and reproducibility.
In this study, we first document how students move in and out of experiencing homelessness in the District. Studies of other measures of material insufficiency have recognized the importance of such dynamics. For example, researchers have attempted to understand patterns and consequences for children’s transitioning in and out of food insecurity rather than having persistent food insecurity across their whole lifetime, and scholars have studied how residential mobility heterogeneity affects student performance, such as short- or long-distance moves and frequency (Cordes et al. 2016, 2019; Hamersma & Kim, 2016; Rank & Hirschl, 2009). We then show how common approaches that districts and researchers use to measure homelessness can yield widely different estimates of high school graduation and college matriculation, two often studied outcomes of high school education.
Our study complements the homelessness-academic outcomes literature with a focus on high school students, an area that has received less research attention relative to homelessness in K–8. Additionally, ESSA’s newly requiring disaggregation of graduation rates by housing status and potential implications for states' McKinney-Vento funding decisions suggest policy implications in how states allocate scarce resources. Prior research on high school found that runaway youth and students experiencing homelessness specifically in the twelfth grade were relatively less likely to graduate (Aratani & Cooper, 2015; Low et al., 2017; Pavlakis et al. 2020). Studies concentrating on primary and middle school students generally found that students experiencing homelessness tend to score lower on standardized tests than housed students (e.g., Cowen, 2017; De Gregorio et al., 2022). Other studies generally found that college students experiencing homelessness face significant barriers to affording college, meeting basic needs, and receiving housing services (e.g., Broton, 2021; Broton & Goldrick-Rab, 2018; Crutchfield, 2018; Skobba et al., 2018). We build on this literature by examining the dynamic nature of homelessness, and we help fill the gap in knowledge about transitions from high school to college for students who experience homelessness.
Background
Federal policy through the McKinney-Vento Homeless Assistance Act (M-V) defines a child or youth as homeless if they lack a “fixed, regular, and adequate nighttime residence” (42-U.S.C.-§11434a). In practice, this encompasses students living in motels/hotels, emergency shelters, transitional housing, cars, public spaces, or similar places not designed to be sleeping accommodations. It additionally includes those living doubled-up—that is, living with friends or family due to losing housing, economic hardship, or a similar reason. Federal funding to school districts to remove educational barriers students face and guidance for implementing homeless assistance programs come through McKinney-Vento (42-U.S.C.-§11432). McKinney-Vento also requires school districts to identify students experiencing homelessness and appoint a “homeless liaison,” an administrator responsible for identifying students and providing services (42-U.S.C.-§11432(g)(6)).
Students who experience homelessness often face educational challenges, which McKinney-Vento provides funding and guidance to schools to remove (GAO, 2016; Parrott et al., 2022). About 76% of students identified as homeless live doubled-up, which can shape students’ educational experiences through issues like intra-household conflicts, lack of study space, and competing demands (Edwards, 2019; Hallett, 2012). Students experiencing homelessness are more likely than housed students to change residences and schools, both of which can reduce scholastic engagement, hinder participation in extracurricular activities, or lead students to miss opportunities such as dual-enrollment classes and college counseling (GAO, 2016). Further, poverty and food insecurity commonly accompany homelessness, and these shortages can negatively affect academics and limit students’ ability to afford postsecondary expenses (e.g., Harvey, 2020; Heflin et al., 2019; Michelmore & Dynarski, 2017). Improving these students’ academic performances necessitates understanding these challenges and offering solutions, such as McKinney-Vento’s providing students the right to remain at their school of origin or assistance in college enrollment.
Housing security is best characterized as existing on a spectrum ranging from secure—where a student has fixed, regular, and suitable housing—to insecure, where housing is less stable, more variable, and less adequate; homelessness occurs at the severe insecurity end of the spectrum (Cutuli et al., 2013; Cutuli & Herbers, 2019). Students can cross into and out of what is considered homelessness repeatedly, which is one reason scholars and practitioners have characterized homelessness as an experience rather than a permanent condition (O’Flaherty, 2019). Experiences vary based on length, timing, and past events, making analyzing their consequences more complicated (Lee et al., 2021).
Measuring Achievement by Housing Status
We explore ways to categorize students as homeless by first considering two different procedures for disaggregating achievement by housing status—heretofore referred to as “measurement”—based on common state and district practices (NCHE, 2020). First, in estimating the graduation rate among students experiencing homelessness, a district might consider students as homeless only if they were homeless when the district last observed them. We depict this scenario in Table 1 as characterizing students based on their Last-Status measurement. Alternatively, a district could consider students homeless if they ever experienced homelessness during their high school tenures, regardless of whether they later became housed. We depict this scenario in Table 1 as characterizing students based on an Ever-Homeless measurement.
Student Housing Status and Measuring Homelessness
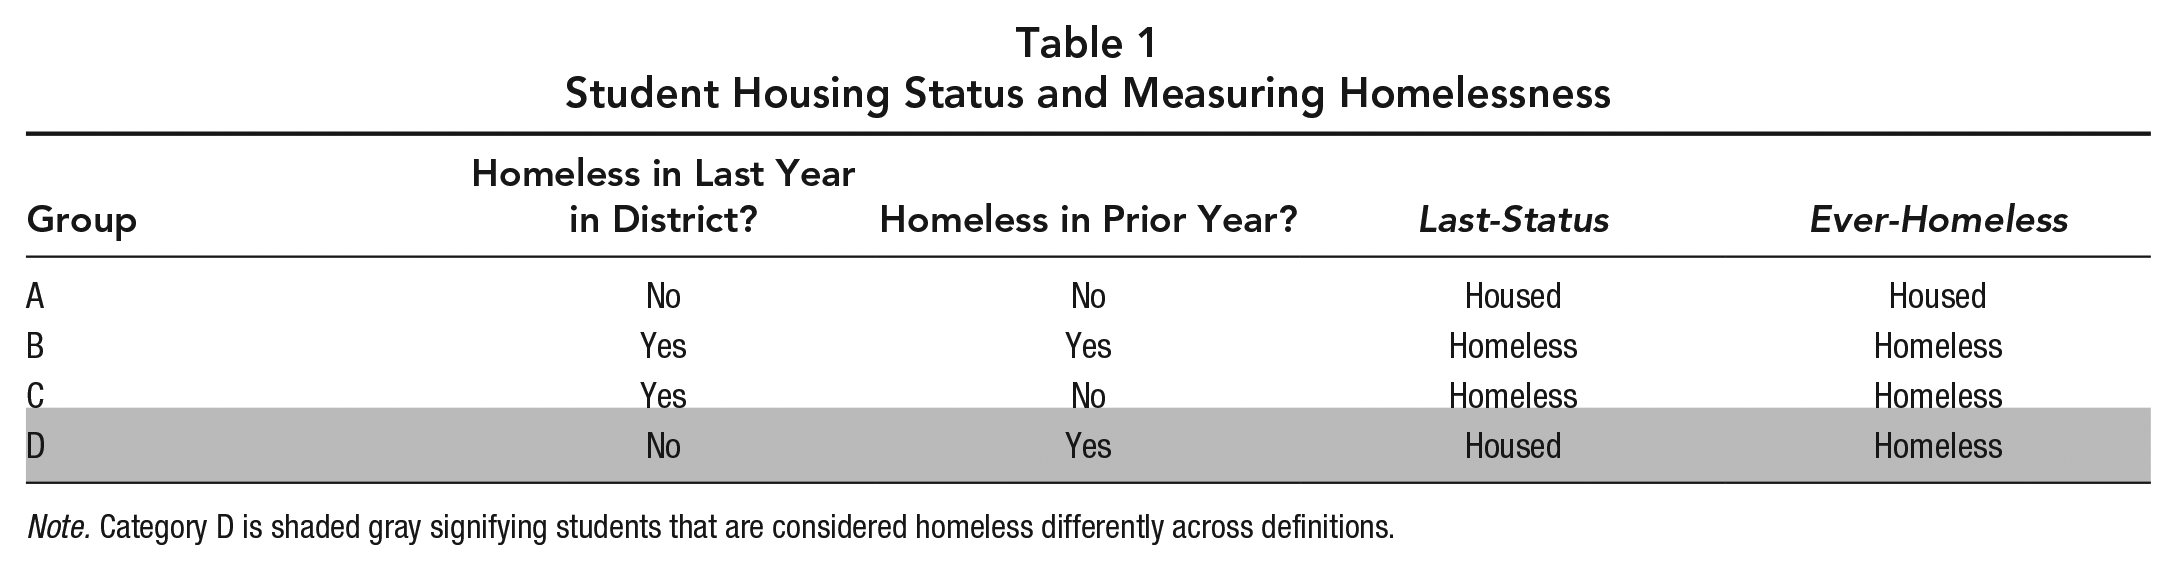
Note. Category D is shaded gray signifying students that are considered homeless differently across definitions.
Consider the four student groups in Table 1. For the first three groups, the consideration of homelessness is consistent across these measures. Students in group A were housed throughout high school so are considered housed under both measures. Students in groups B and C experienced homelessness when the district last observed them, such as in twelfth grade, whereas students in group B also experienced homelessness in high school before that point (such as in ninth, tenth, or eleventh grade). Students in both groups are considered homeless under both the Last-Status and Ever-Homeless measurements.
The main difference between these two measurements arises when considering students who were homeless at some point in high school but later became housed. For example, this could be a student who experienced homelessness in eleventh grade but was housed in twelfth grade. We depict this scenario in the fourth row—that is, students in group D in Table 1. Under the Last-Status definition, these students would be considered housed, whereas under the Ever-Homeless definition, these students would be considered homeless. For our sample, about 51% of the Ever-Homeless students would be considered housed using the Last-Status measurement given the dynamic nature of housing insecurity that we illustrate in the results section.
When districts calculate the high school graduation rate for students who experience homelessness or the difference between graduation rates among homeless and housed students using the Last-Status definition, these estimates are likely to reflect the impact of homelessness during the times at which it is most acute. For example, De Gregorio et al. (2022) found students who experienced homelessness have lower test scores and attendance rates during the school year they experience homelessness compared to students with a past experience. However, the Ever-Homeless definition reflects a more complete picture of students experiencing homelessness because it captures homelessness at any point during high school. As such, the Ever-Homeless measurement recognizes that the barriers faced during homelessness—for example, material insufficiency and instability—often persist when transitioning back to being housed and that homeless can have lasting effects (Cutuli & Herbers, 2019). Once a student becomes housed, they may still face housing precarity and other difficulties that continue to negatively impact students’ academic achievement, such as living in unaffordable housing or being vulnerable to negative shocks like unemployment (Aviles de Bradley, 2011). Further, students may be highly mobile even when housed (Cowen, 2017). The US Department of Education (ED) recognizes these circumstances, requiring districts to continue providing services for the entire school year even if a student experiencing homelessness becomes housed (NCHE, 2020).
The issue of different considerations of past homelessness has risen in prominence due to the Every Student Succeeds Act’s (ESSA) requirement that states and school districts calculate graduation rates for students experiencing homelessness, although it does not explicitly state how. ESSA mandates that states report to the ED four-year adjusted cohort graduation rates (ACGR) separately by homeless status (§1111(h)(1)(C)(ii)-(iii)). The ACGR tracks cohorts of ninth-grade students to determine whether the students receive a diploma or alternative diploma within four years. Many school districts also report ACGR graduation rates as part of state-mandated informational accountability policies; for example, the state requires the District to report a public-facing “school report card” for each school and the district as a whole, including other outcomes such as standardized test scores and financial transparency.
According to the NCHE (2020), comparisons of states’ graduation rates are potentially problematic because states use different homelessness measurements, specifically that some use a Last-Status measurement and others an Ever-Homeless measurement. A 2016 amendment to ESEA (81 FR 86076) briefly directed states and districts to count students who were homeless at any time during the cohort period as homeless when disaggregating graduation rates by housing status, essentially using the Ever-Homeless measurement. However, this was short-lived as Congress passed a resolution of disapproval in 2017, claiming federal overreach (82-FR-31690; Goldstein, 2021).
There are no direct penalties from the federal government for low academic performance among students experiencing homelessness within a district. However, measures of homelessness can affect funding because data on homelessness is used by states to make need-based funding decisions for McKinney-Vento grants, which ESSA reauthorized. McKinney-Vento grants are distributed to states, which then distribute subgrants to some school districts primarily based on need. Different measures of homelessness can affect districts’ priority for funding because no universal guidance exists on how states should define need. If states determine need based on the number of students who experience homelessness in a district, then the Ever-Homeless measurement will yield the largest number. Alternatively, states may prioritize school districts for funding based on the graduation rate differential between housed and homeless students, which can be maximized by using the Last-Status measurement. Only about one-third of school districts receive a McKinney-Vento grant, despite every district being required to provide services to students experiencing homelessness, such as transportation or additional tutoring (Department of Education, 2020).
Finally, another measurement issue can arise for researchers if they only have access to cross-sectional data without repeated observation or a record of potential changes to housing status. For example, consider an analyst who examines graduation rates for a sample of twelfth-grade students. In this case, students who leave the school before twelfth grade will not even be included in the data. In later analyses, we estimate achievement using this measurement, which we call 12th Grade Status. To the extent that there are differences in the likelihood that students depart districts between stably housed and those with an experience of homelessness, this analysis of a limited sample could lead to conclusions that would be different if they observed cohorts of students starting in ninth grade. Federal requirements related to high school graduation based on ninth-grade cohorts have led to better consistency among school districts, so this issue is less likely to affect measures reported by districts but can be a problem for researchers.
Data and Methods
To illustrate how different measurements can lead to distinct conclusions, we analyzed a sample of all roughly 21,300 students who entered ninth grade in the District from the 2007–2008 to 2013–2014 academic years and followed students for six years after enrollment. The District encompasses an entire urban county with five high schools, whereas surrounding counties are generally rural. The city has several emergency shelters for people experiencing homelessness and is often in contact with the District when children and youth enter shelters. In recent years, the District has received McKinney-Vento grants from the state.
The District records only a dichotomous measure of homelessness—that is, whether the student is experiencing homelessness or not during a given year. The District gathers data primarily using household surveys at the beginning of the year, although it also continually attempts to identify students, typically through teachers and staff referrals to the homeless liaison. The District also distributes flyers describing the rights of homeless students, with the primary right being the ability to stay at the school the student attended when they first became homeless and continued transportation to the school, even if the student no longer resides within the school’s attendance boundary.
Generally in our analysis period, the students who the District considers as homeless (in any of the measurements) are about equally likely to be male or female, but Black students are disproportionately likely to be classified as homeless. Students who are free and reduced-price-lunch eligible or have an individual education plan are also more likely to be classified as homeless, whereas students who were in the gifted and talented program were less likely to be considered homeless.
We consider the extent to which the measurements can result in different estimates of the links between homelessness and high school graduation or college going within six years of starting high school. We consider a student to have graduated if they earned a high school diploma or GED that was reported to the District. We consider a student to have enrolled in a postsecondary institution if they were enrolled for at least one semester after twelfth grade, using data from a National Student Clearinghouse match. 1 We separately estimated these outcomes, Y, for each student i as a linear function of homelessness, H, using a linear probability model:

Here, we used the three measurements previously mentioned to define H and estimated separate regressions for each measurement. We display estimates of the unconditional relationship (estimates without control variables) and the conditional relationship including controls for observed student ninth-grade characteristics in the X-vector: sex (female/other and male as the omitted category), race/ethnicity (Black/Asian/Hispanic/American Indian/Native Hawaiian/multiple/other and white as the omitted category), school attended, school year first enrolled in ninth grade, and zip code of the student’s residence; we also included indicators for whether the student in high school ever qualified for free/reduced-price lunch, had an individual education plan, was identified as an English language learner, or was identified as gifted/talented. 2 In estimates including control variables, these factors help us to produce estimates that can be better compared across settings with different student characteristics and to partially account for observed factors that might relate to both academic achievement and homelessness. We also estimated several sensitivity checks, including dropping free and reduced lunch qualification status as a control variable, excluding zip code and school fixed effects, and estimating results using logistic regression instead of a linear probability model. All of these estimates were similar in statistical and economic significance to the main estimates we present and are available upon request. We excluded students who transfer out of the district from our analysis in this section and considered students who dropped out as not graduating.
Our analysis is useful to understand how differences in measuring homelessness can result in distinct estimates of achievement among students who experienced homelessness, while conditioning on factors that districts can reasonably collect. Given the lack of plausibly exogenous variation in our setting, however, our results should not be interpreted as estimates of the causal effect of homelessness on outcomes. Instead, estimations with controls can be interpreted as the relationship between homelessness given the chosen measurement and the outcome (graduation or college enrollment) conditioned on a set of observable characteristics.
Dynamics of High School Homelessness
About 2.1% of students in our sample were identified as being homeless at some point in high school. This rate is similar to national estimates of 2.3% of high school students experiencing homelessness in a given year (NCES, 2017). In Figure 1, we display the dynamics of high school homelessness among the students in our data who experienced homelessness at some point during high school. Starting at the far left of the graph is students’ ninth-grade status: every student is considered either homeless (46%) or housed (54%) to start the year. From the start of ninth to the start of tenth, eleventh, and twelfth grades (moving from left to right on the graph), students can belong in one of four mutually exclusive categories: continued to the next grade and is housed, continued to the next grade and is homeless, dropped out, or transferred to another district. 3
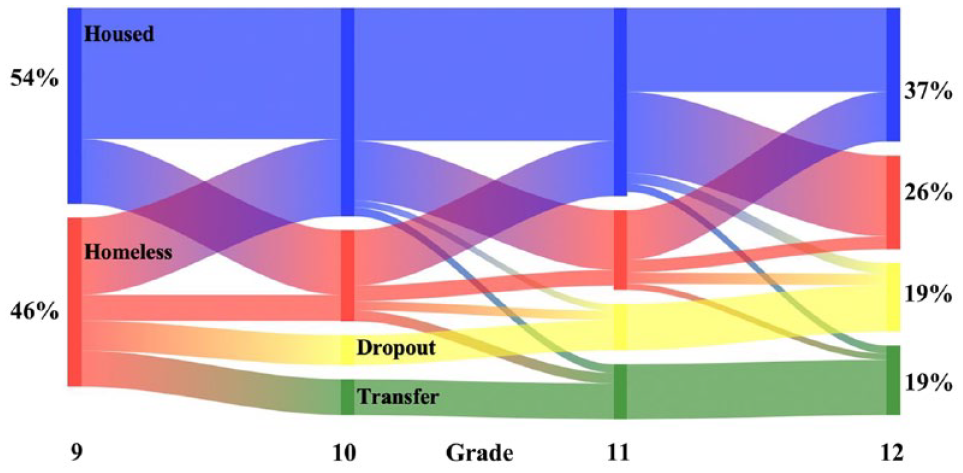
Dynamics of high school homelessness among students homeless in high school.
Roughly half of the students experiencing homelessness each year became housed the following year. Students experiencing homelessness but who did not become housed the next grade had about an equal likelihood of still experiencing homelessness the next year, dropping out of school, or transferring to another district. Among students who experienced homelessness in high school and stayed in school for four years, most (81%) were homeless for one year; 16% were homeless for 2 years, 3% were homeless for 3 years, and less than 1% of students were recorded as homeless all 4 years in high school. Among those with 2 years of observed homelessness in high school, 89% experienced it in consecutive years. About 38% of the students that experienced homelessness at some point in grades 9–11 dropped out or transferred before twelfth grade, as compared to about 17% of always-housed students. These trends are similar to Dhaliwal et al. (2021), who found 81% of K–12 students in Los Angeles experienced homelessness for three or fewer consecutive years. They also found 8% of students exited homelessness and then reentered in a later year.
These observed dynamics of homelessness demonstrate the fluctuation in housing circumstances students experience as they transition in and out of observed homelessness over time in high school. Students also dropped out or transferred at a higher rate while homeless than housed. Out of about 19% of students with an experience of high school homelessness and who dropped out, about 74% dropped out while experiencing homelessness. Resultingly, how districts measure and consider previous experiences of homelessness can change perceptions of academic achievement, something we explore further in the next section.
Comparing Measures of Homelessness
In Figure 2, we show the rates of homelessness for the District, using the three different measurements previously discussed. 4 Under the Ever-Homeless definition, 2.1% of the students in the District would be considered homeless. Using a Last-Status measure yields a homelessness rate of more than 40% lower, at 1.2%. Finally, the 12th Grade Homeless measure results in the lowest homelessness rate, at 0.8%. Clearly, measurement matters as different definitions result in quite dissimilar estimates of the rate of students experiencing homelessness.
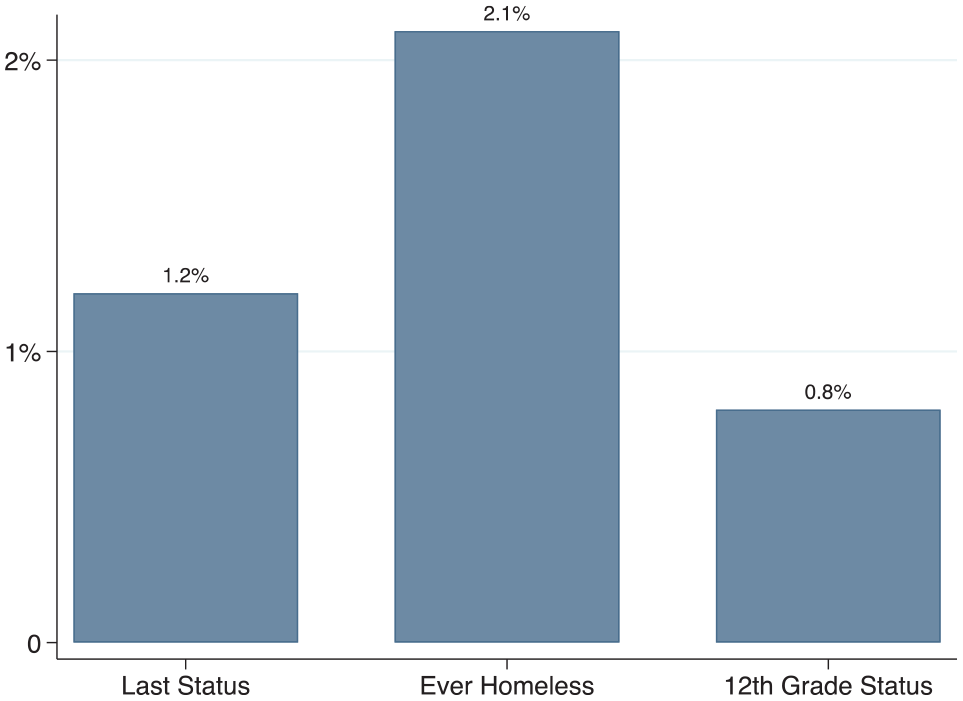
Share of students experiencing homelessness by measurement.
To explore the implications of these measures using commonly examined academic outcomes, we examine how the measures of homelessness may result in different estimates of graduation or college going. We display estimates of the unconditional relationship (estimates without control variables) between homelessness in high school and graduation in the topmost row of Figure 3, with bars showing 95% confidence intervals. Estimates of the gap’s magnitude differ greatly depending on the measure. Students considered homeless under the Last-Status measurement (triangle marker) had graduation rates 32 percentage points lower than their housed peers; Ever-Homeless students (circle marker) had graduation rates 17 percentage points lower, and 12th Grade Status students (square marker) had graduation rates 4 percentage points lower (this last estimate is not statistically different from zero). We display graduation estimates conditional on observed covariates in the second row of the figure. Students experiencing homelessness in high school still had lower calculated graduation rates than students that were housed, although the conditional gaps narrowed, ranging from 2–26 percentage points. The Last-Status measurement, therefore, suggests a larger graduation rate gap relative to the Ever-Homeless measurement, which is larger than the gap for 12th Grade Homelessness. 5
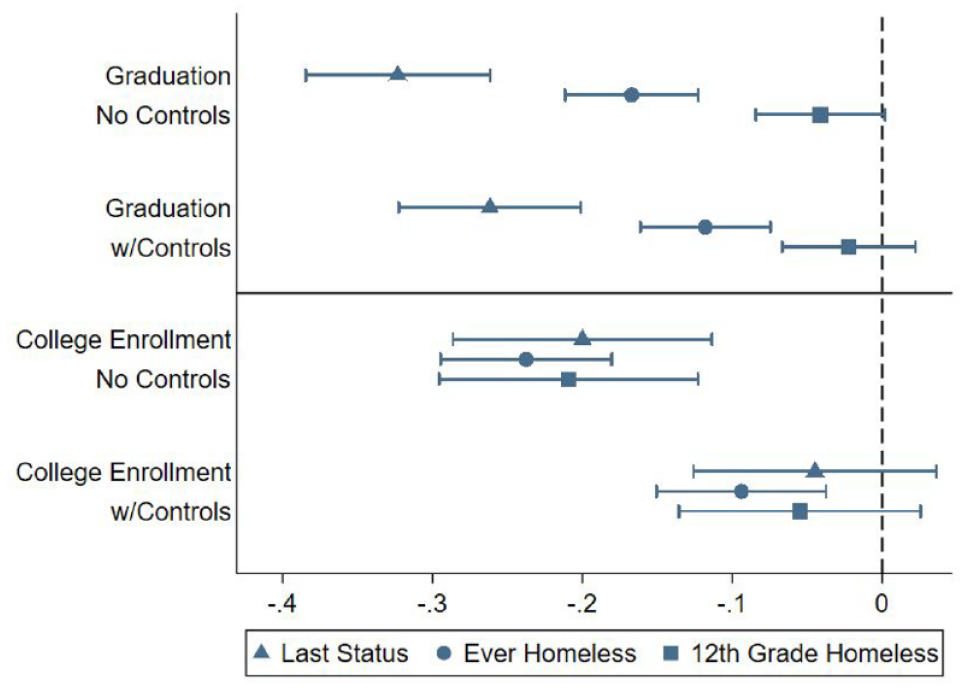
Estimates of differences in graduation and college enrollment by housing status.
In the bottom half of Figure 3, we present results from estimates of enrolling in college (inclusive of both 2- and 4-year colleges) within six years after entering high school. In these estimates, we only included students who graduated high school. Estimated parameters were similar across scenarios. In the estimates without any control variables in the third row, students who experienced homelessness in high school enrolled in college at a rate of about 20–24 percentage points lower than housed students. In estimates accounting for student characteristics (bottom row), the difference between college enrollment rates narrowed to a rate 5–9 percentage points lower than housed peers. In the Last-Status and 12th Grade Status scenarios, the 95% confidence interval of the difference included zero. Contrary to high school graduation, estimates of gaps vary little by measurement. 6
In Figure 4, we present results for differences by housing status in college enrollment separately for 2-year and 4-year colleges. Like college enrollment overall, there were only minor differences across measurements when splitting college enrollment by 2-year or 4-year college. We observe only a small difference in 2-year college enrollment rates between homeless and housed students that is not statistically different than zero in both conditional and unconditional estimates. In the bottom panel, we find that high school homelessness is related to a lower likelihood of enrolling in a 4-year college. When adding controls, the difference in enrollment rates narrowed to be effectively zero.
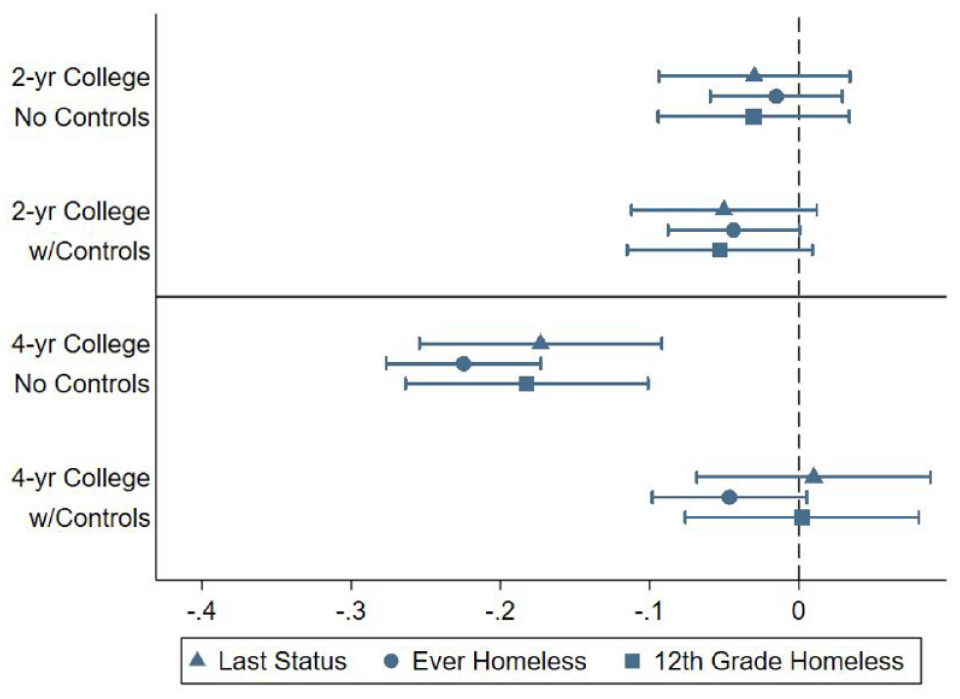
Estimates of differences in college enrollment by housing status by college type.
These college-going findings come with two caveats. First, by only including students graduating high school, the sample is biased toward students that graduated despite the challenge of homelessness. These students, however, still have barriers to college enrollment, as shown by the estimation without adjusting for their characteristics. Second, students who experienced homelessness in and graduate from high school face barriers to college enrollment, but services, such as through high school or college financial aid, may mitigate the disparity (GAO, 2016).
Discussion
We consider two common ways that school districts measure homelessness among high school students. The key distinction between these two measurements relates to how to consider students who experience homelessness but later become housed. In the Ever-Homeless measure, districts count students as homeless if they ever experienced homelessness during high school. In the Last-Status measurement, districts only count students as homeless if they experienced homelessness during their last observed year. These measurement differences are meaningful: in our setting, the Ever-Homeless measurement counts about twice as many students as homeless than the Last-Status measurement. Moreover, under the Last-Status definition, the graduation rate among students who experience homelessness in the District is 51%; under the Ever-Homeless definition, the graduation rate is 66%.
These differences also have implications for funding and accountability; using one measure could increase a district’s likelihood of funding relative to the other depending on which aspects of need a state prioritizes. A procedure for most generously counting the most students as homeless, as in the Ever-Homeless measure, can be important because students that experienced homelessness can continue to face other forms of material insufficiency and stressors after they become housed (Cutuli et al., 2013; Harvey, 2020). These households are particularly vulnerable to negative health or economic shocks. Therefore, Ever-Homeless may be the preferred measurement if the goal is to demonstrate a fuller picture of housing insecurity. This measurement may not, however, reflect the students most at risk for not graduating from high school. In our setting, Ever-Homeless students are less likely to graduate than their always-housed peers; however, students with past experiences of homelessness who become housed are more likely to graduate than peers who experienced homelessness in twelfth grade. These findings echo those of Cassidy (2020) and De Gregorio et al. (2022), who found that students who experience homelessness can rebound somewhat after becoming rehoused. Last-Status could be the preferred measurement if the goal of disaggregating by housing status is to emphasize differences in graduation potentially caused by homelessness since it is likely to lead to the largest homeless-housed graduation rate gap. Contrarily, 12th Grade Status may be the least capable to identify the negative outcomes related to homelessness and the extent of homelessness due to its inclusion of only students still enrolled in twelfth grade.
Having districts and states either use equivalent measurements or be transparent in their measurement is necessary for effective policy design and holding districts accountable. Districts face a variety of incentives in choosing which measurement to use. According to ESSA, all districts and states must report the graduation rate based on the ACGR disaggregated by housing status—that is, homeless or housed. If districts want to report the smallest calculated achievement gap between homeless and housed students, they will choose the Ever-Homeless definition. Different incentives may be inherent in federal McKinney-Vento grant funding that is provided to states to allocate to school districts and aid housing-insecure students (Miller, 2011). The amount of McKinney-Vento funding has almost doubled to about $115 million nationally in 2022 from $65 million in 2015, and only about a third of districts receive one of these grants (Department of Education, 2020). States have some discretion in how to distribute grants to school districts, but they must consider the need. However, the conceptualization of need can vary across states. For example, states might target grant funds to districts with the highest number of students who are counted as homeless, which districts can achieve by using the Ever-Homeless measurement. On the other hand, states might prioritize funding based on where students who experience homelessness have the lowest outcomes relative to housed students. In this case, a district using the Last-Status definition would report relatively lower homeless student graduation rates.
As it did in the past, ED should consider providing standardized guidance on how to disaggregate high school graduation rates by housing status. Shared measurement procedures better allow comparisons across districts about the numbers of students experiencing homelessness and differences in achievement by housing status. Comparable measures are also essential to understanding which interventions best help students overcome barriers to graduation resulting from homelessness and will facilitate funding decisions, such as McKinney-Vento grant awards, to be made based on common understanding of the homelessness problem in districts.
We also examine how the different measurements could lead to different estimates of the relationship between experiencing homelessness in high school and college enrollment. The different measurements led to different estimates of the graduation rate. However, we found few differences in overall college enrollment rates, conditional on high school graduation, though students with an experience of homelessness in high school are less likely to enroll in 4-year colleges, suggesting the importance of further investigation of which types of institutions students who experience homelessness have access.
Finally, scholars must be explicit in the measurement procedures used in studies to allow for comparisons across studies and to build the field’s understanding of how homelessness affects outcomes like high school graduation and student success. Recent research has begun to examine heterogeneity in experiences of homelessness and the need to be specific as to context, including doubling up versus living in an emergency shelter, timing, and duration (De Gregorio et al., 2022; Sullivan, 2022). As scholars’ knowledge of variation in homelessness grows, being explicit about how homelessness is defined and measured in studies becomes paramount. Future research can further explore how the temporal aspects—such as the duration—of homelessness relate to high school graduation and college enrollment as an important transition to adulthood. Additionally, a review of previous research comparing measurements of homelessness across studies can reveal whether differences in magnitudes between homelessness and academic achievement results from differences in measurement.
Lastly, we acknowledge the limitations of our study that may be areas for future research. First, we do not systematically and comprehensively know which measures states or districts use, so future work could examine whether measures differentially favor certain types of districts, such as by urbanicity, demographics, or socio-economic status. Second, administrative data cannot capture the full heterogeneity of experiences of homelessness or even identify every student experiencing homelessness. However, it still has material consequences as it is used to provide information to stakeholders and help states’ McKinney-Vento funding decisions. Third, almost 20% of students who experienced homelessness transferred from the district and thus left our data. Longitudinal data that spans districts and states would provide important insight into the experience of these students. Finally, future studies can examine differences in estimated achievement for repeated outcomes (e.g., on track to graduate, test scores) to analyze changes over time.
Footnotes
Appendix
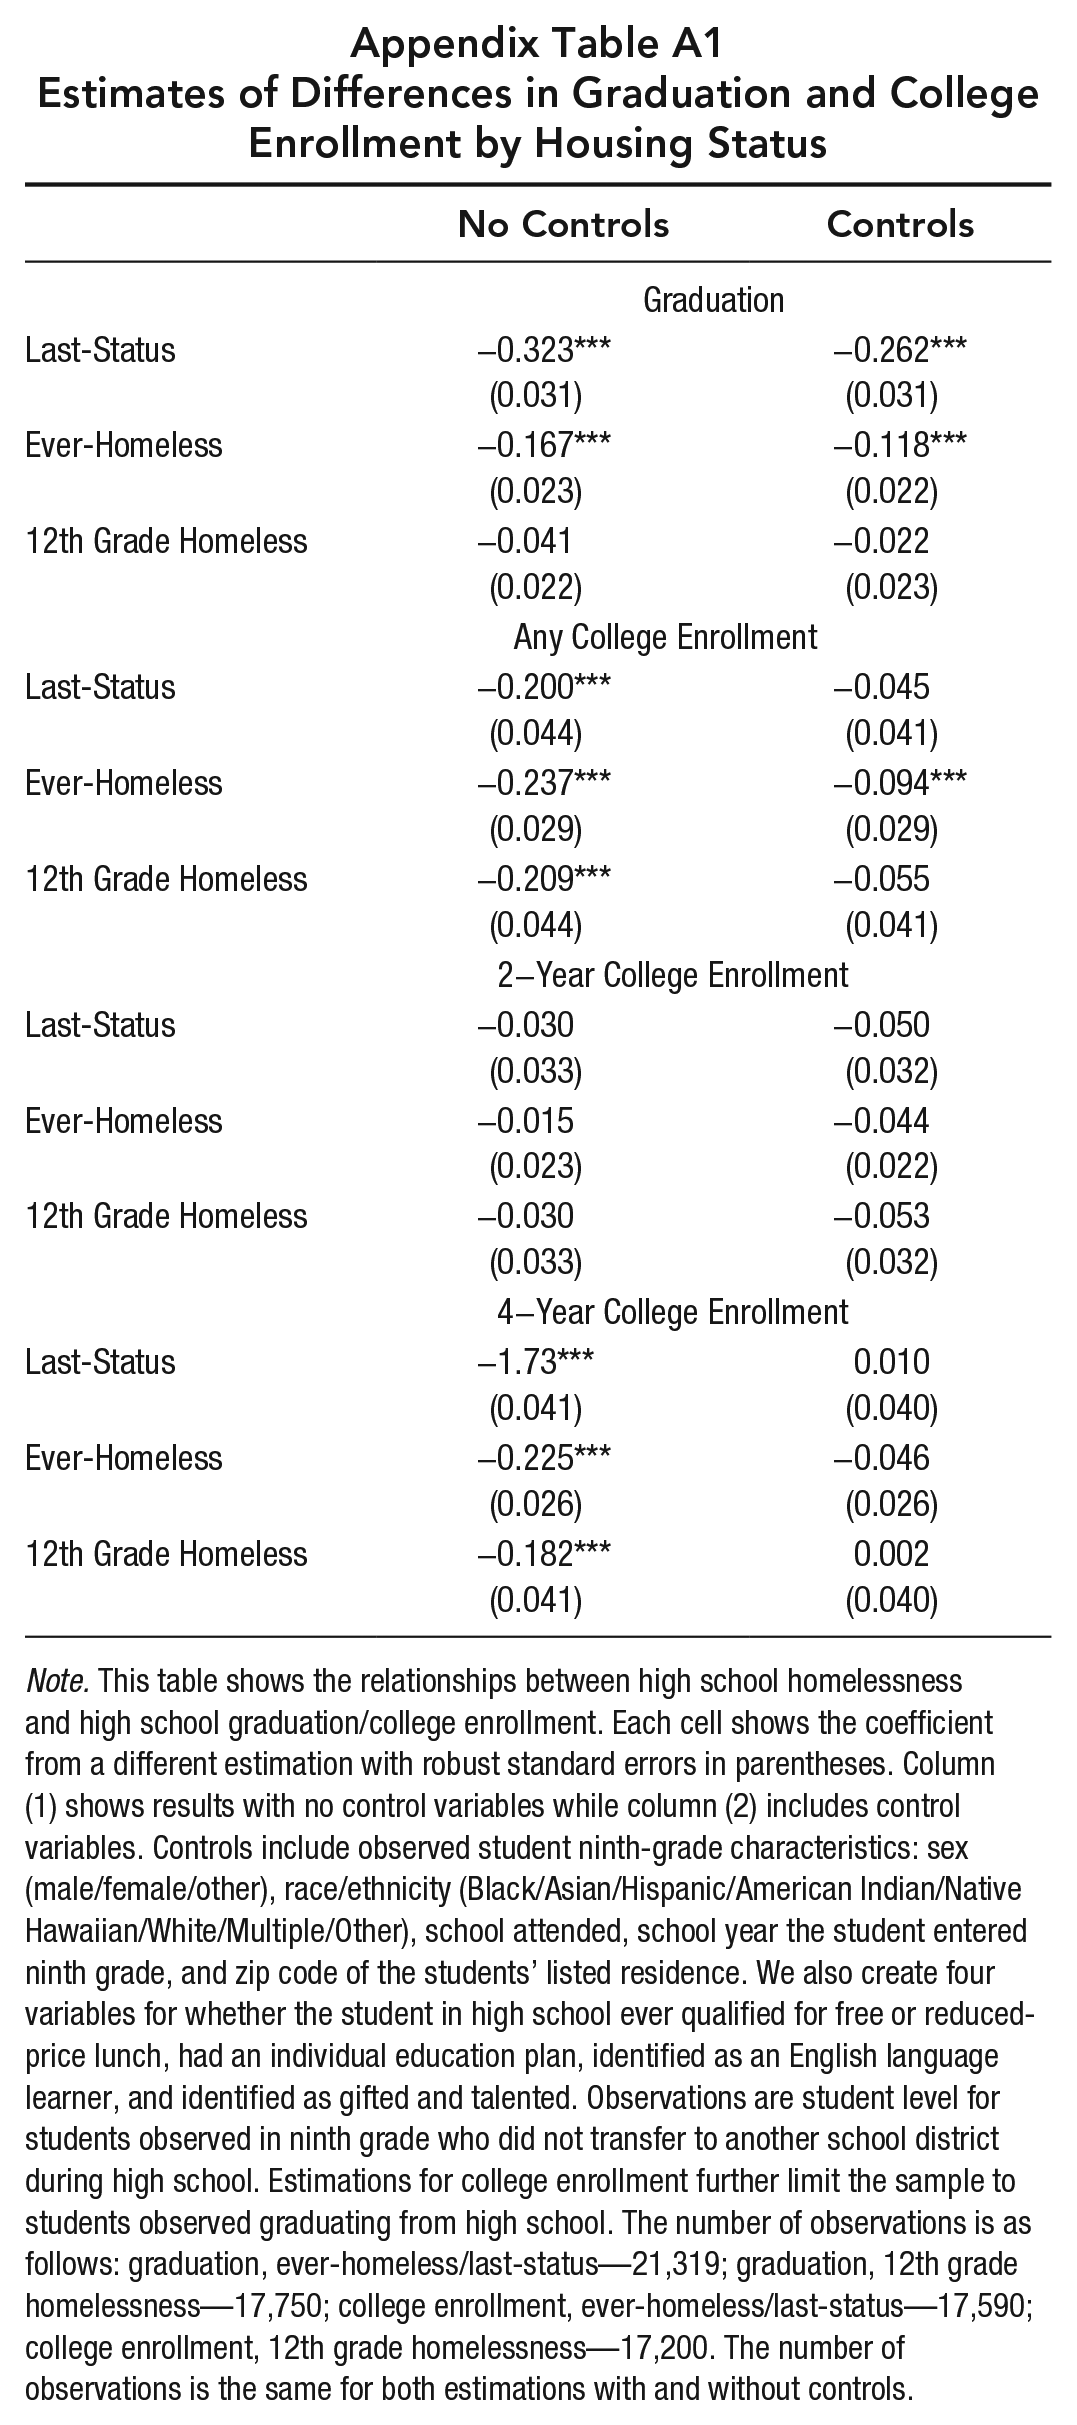
Estimates of Differences in Graduation and College Enrollment by Housing Status
| No Controls | Controls | |
|---|---|---|
| Graduation | ||
| Last-Status | −0.323*** |
−0.262*** |
| Ever-Homeless | −0.167*** |
−0.118*** |
| 12th Grade Homeless | −0.041 |
−0.022 |
| Any College Enrollment | ||
| Last-Status | −0.200*** |
−0.045 |
| Ever-Homeless | −0.237*** |
−0.094*** |
| 12th Grade Homeless | −0.209*** |
−0.055 |
| 2−Year College Enrollment | ||
| Last-Status | −0.030 |
−0.050 |
| Ever-Homeless | −0.015 |
−0.044 |
| 12th Grade Homeless | −0.030 |
−0.053 |
| 4−Year College Enrollment | ||
| Last-Status | −1.73*** |
0.010 |
| Ever-Homeless | −0.225*** |
−0.046 |
| 12th Grade Homeless | −0.182*** |
0.002 |
Note. This table shows the relationships between high school homelessness and high school graduation/college enrollment. Each cell shows the coefficient from a different estimation with robust standard errors in parentheses. Column (1) shows results with no control variables while column (2) includes control variables. Controls include observed student ninth-grade characteristics: sex (male/female/other), race/ethnicity (Black/Asian/Hispanic/American Indian/Native Hawaiian/White/Multiple/Other), school attended, school year the student entered ninth grade, and zip code of the students’ listed residence. We also create four variables for whether the student in high school ever qualified for free or reduced-price lunch, had an individual education plan, identified as an English language learner, and identified as gifted and talented. Observations are student level for students observed in ninth grade who did not transfer to another school district during high school. Estimations for college enrollment further limit the sample to students observed graduating from high school. The number of observations is as follows: graduation, ever-homeless/last-status—21,319; graduation, 12th grade homelessness—17,750; college enrollment, ever-homeless/last-status—17,590; college enrollment, 12th grade homelessness—17,200. The number of observations is the same for both estimations with and without controls.