
Abstract
We study guidance counselors by examining how they influence enrollment in Advanced Placement courses. We examine the proportion of students enrolled across different racial and ethnic groups and whether the student-counselor ratio is related to the size of these enrollments. We also consider whether schools with lower ratios have a smaller enrollment gap between White students and students of color. We examine these questions using restricted national data. Our findings show that ease of access to counselors is associated with higher proportions of enrollment for White students and sometimes also for Black students but infrequently for Latino and Asian students. Greater ease of access is also associated with a smaller enrollment gap between White and Black students.
School counselors help support students’ emotional development and provide guidance academically. One of their most notable responsibilities is guiding students as they prepare for college, such as through course selection (Corwin et al., 2004). Access to counselors in many schools, however, is limited. As discussed by Goodman-Scott et al. (2019), although the recommended student-to-guidance counselor ratio is 250:1, the actual ratio is often much higher. It is therefore important to consider more closely how counselors affect the schools in which they work and whether differences in student-counselor ratios shape student outcomes.
We study how counselors influence enrollment in Advanced Placement (AP) courses and if there are differences for students of color. In 2022 alone, 20,310 U.S. schools offered AP exams, and in 2023, over a million U.S. students completed over 4 million exams (College Board, 2023a, 2023b). Previous research has outlined reasons for the enrollment in these courses, including financial benefits (Mattern et al., 2013), to enhance college admissions applications (Attewell & Domina, 2008), and to increase students’ success in high school and college (Evans, 2019). We ask whether lower student-counselor ratios are linked to higher levels of AP enrollment. Also, we consider whether counselors are more likely to act as a democratizing force when they have lower caseloads and are associated with a smaller enrollment gap between White students and students of color or if instead, they reproduce existing inequalities (Bourdieu & Passeron, 1977).
Previous research has shown that students of color are less likely than White high school students to enroll in AP courses, and enrollments also appear lower among low-income students (Schneider, 2009; Xu et al., 2021). There have been efforts to increase the diversity of enrollment, such as through the College Board’s “All in” program (College Board, 2014). Although the College Board noted some success, disparities remain (College Board, 2023a). Price (2021) concluded that race is a stronger factor than income in predicting differences in access to AP coursework. One reason for this enrollment gap between students of color and White students may be differences in the curriculum offered across the schools that students of varying race and ethnicity attend. For instance, previous research has shown that there may be a lack of availability of AP courses among high-poverty schools, where students of color are more likely to be enrolled (U.S. GAO, 2018). Another explanation may lie in disparities among racial and ethnic groups in AP enrollment within the school. Previous research has shown that students of color are less likely than White students to enroll in AP courses in their schools even after considering prior academic performance (Corra et al., 2011; Owen, 2025). Thus, factors in schools also appear to play an important role in driving disparities in AP enrollments.
Some of these different patterns of enrollment in schools may be linked to the behavior of teachers and school staff. The College Board and others have directly called on teachers and counselors to broaden their efforts to increase the diversity of students who enroll in AP courses (College Board, 2007; Flores & Gomez, 2011). Counselors can affect the availability of AP courses and enrollment due to their influence on master course scheduling, school culture, recruitment, students’ academic schedules, and support of activities influencing college readiness (Flores & Gomez, 2011; Shi & Brown, 2020). Thus, these behaviors could aid in decreasing the enrollment gap between White students and students of color, particularly in environments in which students find it easy to access counselors.
Our study of the relationship between counselors and AP enrollments departs from previous literature by focusing on how counselors support college readiness through AP course-taking. Other studies that examine the role of counselors in the college choice literature have largely focused on college counselors as informational sources, measuring outcomes such as student-counselor contacts (Bryan et al., 2023). Previous research on college readiness has highlighted the importance of accessing advanced coursework in high school for students to have access to opportunities at the college level (Martinez & Ellis, 2023).
We use restricted national data from the Office of Civil Rights and the National Center for Education Statistics. We first rely on school-level data from the 2015–2016 school year to examine across different racial and ethnic groups the proportion of students enrolled in AP courses and whether ease of access to school counselors—represented by the student-counselor ratio—is related to the size of these enrollments. We then consider whether schools with lower student-counselor ratios are associated with a smaller enrollment gap. Our findings show that ease of access to counselors is generally linked to higher proportions of AP enrollment, particularly for White students and for Black students but less frequently for Latino students and not at all for Asian students. Greater ease of access is also associated with a smaller AP enrollment gap between White students and Black students. There are no similar findings for Latino or Asian students.
AP Programs and Barriers Toward Enrollment
As mentioned previously, students enroll in AP courses and are encouraged to enroll in AP courses for a handful of reasons. First, they are associated with an increased likelihood that students will enter college because AP courses are positively linked to increased high school attendance (Santoli, 2002) and obtaining higher standardized test scores (Warne et al., 2015; see also Conger et al., 2023). Second, they help families save money on college tuition (Mattern et al., 2013). Third, once students enter college with credits, they have more time to seek advanced coursework and finish their degrees more quickly (Evans, 2019).
In AP enrollments, racial disparities, however, continue to persist such that Black and Latino students in particular are underrepresented (Ricciardi & Winsler, 2021). Considering the potential benefits of the AP program, such disparity in participation exacerbates the existing achievement gap among these groups in comparison to White students (Schneider, 2009; Xu et al., 2021). For instance, students failing to take AP courses may graduate with lower GPAs and with a decreased class rank because schools often weight grades from AP courses more heavily (Ohrt et al., 2009). They also are less likely to develop college-level skills in high school and to have weaker college applications (Attewell & Domina, 2008; Kolluri, 2018).
This disparity in participation can be tied to a long-standing debate about whose interests are served in public schools. Some scholars argue that public schools better serve the interests of children from advantaged families than those from disadvantaged ones (Bourdieu & Passeron, 1977; Bowles & Gintis, 1976), whereas others argue that schools may reduce disparities between these groups (Downey et al., 2004). One reason that schools may better serve advantaged students is that more disadvantaged students often attend schools with fewer resources (U.S. GAO, 2018). For instance, recent efforts to reduce the disparity in AP enrollments have focused on increasing the number of schools in low-income and rural districts that offer AP courses. These schools, however, often lack the financial means to support additional hires and thus may only offer a small number of AP courses (Gagnon & Mattingly, 2016). Previous research shows that access to AP courses has increased the most at schools in middle- and upper-income districts (Conger et al., 2009). As access increases in a school, the disparity in enrollments also appears to grow larger, and schools appear to increasingly serve more advantaged groups. In their work, Xu et al. (2021) found that the enrollment gap between White and Black students grew in school districts that offered more AP courses. Similarly, Owen (2025), using individual-level data, found that as schools expand AP offerings, they increasingly serve White and Asian students. Owen concluded that additional AP courses in a school provide the strongest benefits to those students who were at the outset already strongly prepared academically—and that only they see increases in their probability of college enrollment, entry into a competitive college, and earning a bachelor’s degree.
The mechanisms underlying why schools support the interests of advantaged students have been considered by Bourdieu and other reproduction scholars. They argue that schools seek to reproduce the cultural capital of advantaged groups. For instance, individuals with similar social backgrounds often share social mores and norms, that is, habitus, that permeate their perspectives, and they may seek to advance those with similar viewpoints (Bourdieu & Passeron, 1977). As a result, in schools, teachers and other staff may act differently toward more and less advantaged children. Teachers may more positively recognize children with noncognitive characteristics, such as speech or dress, that ascribe a more elite status (Bourdieu, 1977). Advantaged students may gain greater access to beneficial experiences, such as engaging in more extracurricular activities and achieving more leadership positions, which benefit them during the college application process (Domina et al., 2023; Wu & Wang, 2025). Even when educational policies seek to push benefits previously offered to dominant groups into a nondominant space, they may only provide limited benefits (Cipollone & Stich, 2017).
On the other side of this debate, scholars argue, however, that schools help equalize differences between advantaged and disadvantaged students—playing a more democratic role. For instance, Downey et al. (2004) found that the gap in learning rates among students according to socioeconomic status and race in most cases is larger in the summer than during the school year (see also Kuhfeld et al., 2020). Thus, schools may shrink differences in learning opportunities between advantaged and disadvantaged groups that occur in out of school settings, leading to more similar learning rates when students are in the classroom (Raudenbush & Eschmann, 2015). Downey and Condron (2016) highlighted the importance of research demonstrating ways in which schools are compensatory and help to decrease inequalities.
A number of scholars have focused on understanding inequalities that may influence differences in AP enrollments across racial and ethnic groups. For instance, previous research has shown a positive relationship between the income of parents and student enrollment. Klopfenstein (2004) found in her study of Texas schools that having a low income appears to be the key factor driving the AP enrollment gap between White students and students of color. Disparities in AP enrollment in schools may also be explained in part by academic achievement in earlier grades that can occur because of environmental factors. Conger et al. (2009) found race and poverty gaps in a combined measure of AP/International Baccalaureate enrollment, but the gap was reduced for poor students and disappeared for Black and Latino students when compared to White students after accounting for students’ prior academic achievement (see also Evans, 2019). Other studies, however, have continued to find persistent racial and ethnic differences in AP enrollment even after considering prior academic performance (Owen, 2025; Ricciardi & Winsler, 2021).
Differences in support and awareness of courses among students may also act as barriers to AP enrollment in schools. Students of color report a lack of awareness, resistance from school personnel, and feelings of isolation and intimidation from peers as barriers to enrollment (Kolluri, 2020; Tyson, 2011; Yonezawa et al., 2002). Although students of color value academic success similarly to White students, other factors may influence their consideration of AP coursework (Tyson & Lewis, 2021). They may see AP courses as White-dominated spaces where the underrepresentation of students of color is seldom addressed (Kolluri, 2025). They may also feel disconnected from an AP curriculum, perceiving it as culturally irrelevant and detached from their lived experiences (Kolluri, 2020, 2025).
Previous research has shown that barriers to enrollment may be worse in certain school districts. Shores and colleagues (2020) found that the disparities that Black students face are magnified when they reside in districts with larger racial socioeconomic differences (see also Diamond & Lewis, 2022). They argued that these differences create a school culture that promotes unequal outcomes across areas such as discipline, retention, and access to advanced coursework, concluding that “disparities in outcomes like . . . access to advanced courses are strictly the result of decisions made by school personnel” (Shores et al., 2020, p. 2123). Although these scholars replicate some arguments made by reproduction scholars, they also suggest that teachers and counselors are important actors who can moderate these outcomes. Their expectations and attitudes toward students affect not only the distribution of academic resources but also students’ self-awareness or visions toward their future academic achievements (Peterson et al., 2016). Thus, these actors may be able to ensure more democratic access to advanced coursework in their schools.
School Counselors: Mitigating the Racial Gap in Advancement Placement Enrollment?
The role of guidance counselors varies from school to school, but their primary role is to provide academic guidance and to support students’ career, personal, and social/emotional development and well-being. One of their key academic roles is to aid students in course selection. Often considered as a “gatekeeper” for advanced course selection (Yonezawa et al., 2002), counselors can encourage AP enrollment in the school in several ways. Counselors can develop priorities and expectations about serving students that lead them to increase the information regarding AP courses that is given to students. These activities may help to create a college-going culture in the school that supports AP enrollments (Bryan et al., 2023). They can support changes to peer and teacher norms regarding enrollments, encouraging them to reach beyond those seen as top students (Flores & Gomez, 2011). Interpersonal interactions between counselors and students may also help build social capital, providing students with important resources, connections, and support for their personal and academic development (Bryan et al., 2011; Robinson & Roksa, 2016). These interactions can lead to higher college application rates and levels of college enrollment (Bryan et al., 2022). These relationships can also influence course selection, affecting enrollments in AP courses.
Are counselors’ caseloads, however, connected to their ability to engage effectively in these types of tasks and to support and direct students? And more specifically for this research, are lower student-counselor ratios linked to higher levels of enrollment in AP courses across racial and ethnic groups and potentially associated with a decrease in the AP enrollment gap? We address two possible responses to the latter question.
Lower Student-Counselor Ratios Increase AP Enrollments
Although there is limited empirical research examining the relationship between counselors’ caseloads and AP enrollments, related research suggests that lower student-counselor ratios will benefit students. For instance, this is evident when considering the value of interpersonal connections between counselors and students. Shi and Brown (2020) found that in schools where counselors spent more time individually with students addressing college readiness and their personal problems, students were more likely to enroll in AP courses. Other research has shown that individualized student mentoring by counselors who emphasize the importance of AP courses for college planning and high school performance can also act to increase enrollments (Ohrt et al., 2009).
Several studies have found a link between lower student-counselor ratios and increased contacts with counselors as well as other benefits for students. Bryan and colleagues (2023) recently found that students in schools with lower student-counselor ratios were more likely to contact counselors to discuss financial aid or college admissions. Woods and Domina (2014) found that students in schools with lower student-counselor ratios were more likely to talk with counselors, take the SAT, and enroll in college. Similar findings have also been reported in other studies (Bryan et al., 2022; Hurwitz & Howell, 2014). In addition, in one of the few empirical studies examining the relationship between counselors’ caseloads and AP enrollments, Xu et al. (2021), using the student-counselor ratio as an undiscussed control variable, showed that higher student-counselor ratios were linked to lower levels of AP enrollment. We note that these findings in the Xu et al. study were at the district level, whereas our study is at the school level, and this analysis of enrollments does not vary by racial and ethnic group.
Individualized connections with counselors may be particularly important for students of color. Previous research has shown that Black students are more likely than White students to contact counselors for college-related information, potentially facilitating their enrollment in AP coursework (Bryan et al., 2009). Black students also may view their contacts with counselors as more influential (Cholewa et al., 2016). Other research suggests that guidance counselors also may specifically act to develop relationships with students of color focused on increasing AP enrollments. For example, guidance counselors at one Southeastern high school organized summer counseling, group counseling, and individual counseling sessions for Black students to increase enrollment and achievement in AP Psychology (Davis et al., 2013). The study described how the students outperformed the national norm for Black students who took the AP Psychology exam. Similarly, using network data from a single California high school, Witenko and colleagues (2017) found that Latino students were more likely to receive support from their career counselors than White students.
Thus, teachers and school staff can support students of color, providing valuable social capital, and positively affect AP enrollments even when parents initially were not aware of the AP system (Taliaferro & DeCuir-Gunby, 2008). In this way, counselors may act as a democratizing force, seeking to provide increased access across racial and ethnic groups to AP coursework and potentially decrease the enrollment gap. Counselors may be better able to do this when they have lower caseloads. As Hurwitz and Howell (2014) noted, although underlying mechanisms through which counselors improve students’ outcomes are not entirely clear, lower student-counselor ratios, like decreased student-teacher staffing ratios, may allow for increased interpersonal contact with students.
Student-Counselor Ratios Do Not Influence AP Enrollments
Other previous research suggests that changing student-counselor ratios may have a limited influence on enrollments in AP courses, particularly for students of color. External factors discussed previously may influence enrollments in these courses, such as family income or earlier levels of academic achievement. Counselors in less well-off schools that often serve a larger number of students of color may also be limited in their ability to personally advise students because they are more likely to be directed to outside tasks, such as acting as substitutes (Corwin et al., 2004). Limited proficiency in English may also decrease the extent that students seek academic support, as shown in previous research on Spanish-dominant Latino students (Stanton-Salazar et al., 2001).
Previous research has also shown that school staff may have varying academic expectations for different racial and ethnic groups, with lower expectations for students of color potentially decreasing entry into AP programs compared to White students (McGrady & Reynolds, 2013; Nicholson-Crotty et al., 2016; Tenenbaum & Ruck, 2007). Although Black students may be more likely to contact counselors than White students, lower aspirations expressed by counselors may decrease the extent to which these students are motivated to pursue opportunities such as attending college or AP enrollment (Bryan et al., 2009). Tenenbaum & Ruck, 2007) found in their meta-analysis that teachers have more negative expectations for Black and Latino students than for White students and that they held more neutral and positive speech tones for White students. Francis et al. (2019) used an adapted audit study that had counselors evaluate transcripts that were identical except with variations in names that suggested different combinations of race and gender. They found that counselors were less likely to recommend AP calculus to Black female students with transcripts comparable to their peers. These differences may lead to a larger AP enrollment gap where the percentages of Black or Latino students in particular are less likely to represent their share of students in the school’s population.
Asian students, although more advantaged in the AP environment, may also not benefit from lower student-counselor ratios. Asian students are less likely to seek guidance from counselors (Atkinson et al., 1989). Additionally, due to the “model minority” stereotype, counselors may dedicate less attention and time to Asian students, and as a result, their educational needs may go unnoticed (Wing, 2007; Zhou & Lee, 2017).
Thus, these varying sets of academic expectations for different racial and ethnic groups held by counselors could lead to higher proportions of AP enrollment for some groups while doing little to budge lower levels for others. For instance, Solorzano and Ornelas (2002) characterized there being “schools within schools” with varying practices and discourse sustaining the underenrollment of Black and Latino students in AP courses in California schools. In one of the few studies that has also examined the link between student-counselor ratios and AP enrollments, Shi and Brown (2020) found, somewhat surprisingly, that larger caseloads were associated with higher enrollments in AP courses. In addition, we could find only one empirical test of the enrollment gap where scholars found that counselors did little to decrease disparity in enrollments between students of color and White students (Xu et al., 2021). We note that both sets of authors have not further considered the link between counselors’ caseloads and AP enrollments or the disparity in AP enrollments according to race and ethnicity in other research.
Hypotheses
In sum, previous research suggests that counselors support students and provide valuable social capital. Several empirical studies have demonstrated that students are more likely to talk with counselors in schools where counselors have smaller caseloads. Black students also appear more likely to contact counselors than White students, and previous research has shown that these contacts are associated with increased enrollments in AP coursework. Thus, we expect that there will be higher levels of AP enrollments for students in schools with lower student-counselor ratios across racial and ethnic groups. Previous research, however, also suggests that counselors may be most likely to aid already advantaged students. Even when contacts occur, a number of studies suggest that lower expectations may limit the potentially positive effects for students of color. Thus, although there may be higher enrollments in AP courses in schools with lower student-counselor ratios, we do not expect to see an associated decrease in the enrollment gap. As a result, we expect to find support for the first but not the second hypothesis:
Hypothesis 1: Lower student-counselor ratios are associated with higher levels of AP enrollment.
Hypothesis 2: Lower student-counselor ratios are associated with a decrease in the size of the enrollment gap between White students and students of color.
Data
We use school-level data from the 2015–2016 Civil Rights Data Collection (CRDC), which is a biennial survey of public schools administered by the Education Office for Civil Rights in the U.S. Department of Education. The CRDC provides information about AP enrollment and differentiates enrollment across different AP topics. It also provides information about the number of counselors present in each school. To access additional information about key school characteristics, we rely on data from the 2015–2016 Common Core of Data provided by the National Center for Education Statistics.
Our study focuses on high schools with students in Grades 9 through 12. 1 We focus on traditional high schools that report free and reduced-price lunch (FRL) status. This initial sample includes 8,145 schools. We restrict our sample to high schools that offer AP courses, similar to previous studies focusing on AP enrollment (Rodriguez & McGuire, 2019; Xu et al., 2021), and exclude the small proportion of schools that offer AP courses but do not have counselors (1%). This adjusted sample includes 6,200 schools. Note that these sample sizes were rounded to the nearest 5 as requested by the National Center for Education Statistics.
Variables
Dependent variables
Risk index
The risk index shows the proportion of students in each racial/ethnic group that are enrolled in AP classes, ranging between 0 and 1. We use this dependent variable when testing our first hypothesis. We created these measures for students enrolled in AP classes generally and by subject area: AP math, AP science, and other AP coursework.
In Table 1, we provide an overview of the values of this index across different racial/ethnic groups. Table 1 shows that the proportion of Asian students enrolled in AP coursework is the highest, followed by White, Latino, and Black students. When considering only STEM AP (math and science) courses, the proportion of White students enrolled more than doubles the proportion of Black or Latino students enrolled. This is also the case for Asian students compared to White students.
The Proportion of AP Enrollment According to Race and Ethnicity
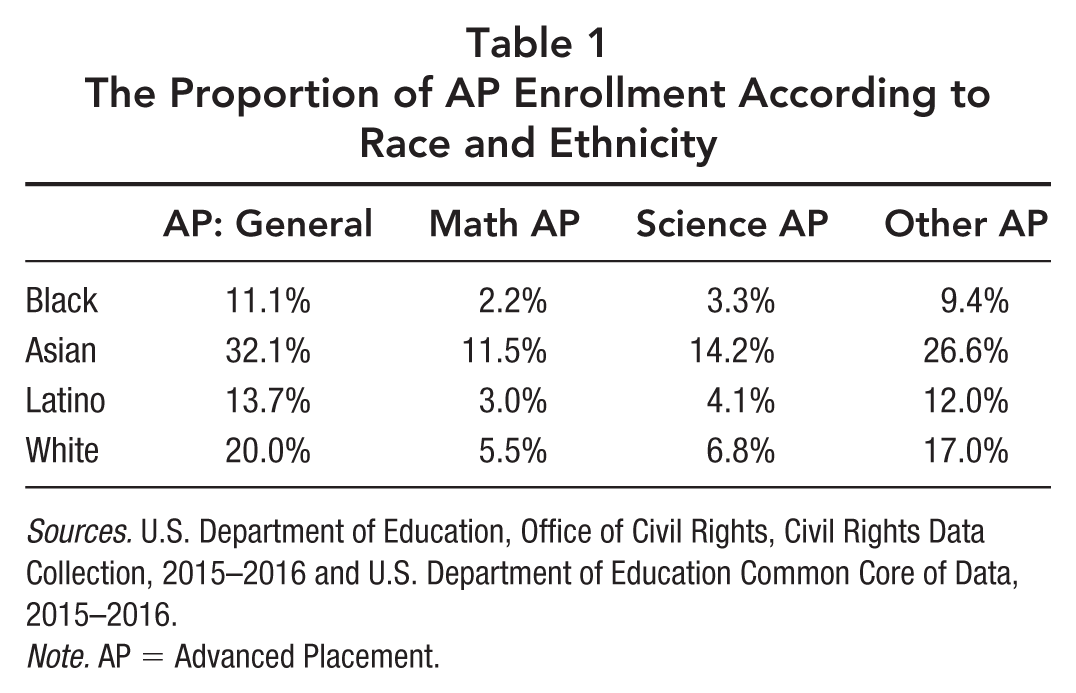
Sources. U.S. Department of Education, Office of Civil Rights, Civil Rights Data Collection, 2015–2016 and U.S. Department of Education Common Core of Data, 2015–2016.
Note. AP = Advanced Placement.
In order to assess the enrollment gap empirically to test our second hypothesis, we also rely on established metrics to create additional dependent variables that compare the risk of a target group with that of a reference group. Following recent research by Shores and colleagues (2020), we rely on the risk ratio and risk differences when measuring disparity.
Risk ratios
The risk ratio is one of the most commonly used measures when assessing disparity (Skiba et al., 2008) and is recommended by some states and in federal regulations regarding disabilities as a default measure (Bottiani et al., 2023; Department of Education, 2025
It is important to note that risk ratios sometimes fail to fully capture the extent of the disparities across groups; for instance, 2% of students of color versus 4% of White students enrolled in AP coursework creates a ratio of one half, just as a ratio of 20% of students of color and 40% of White students, although some may consider this latter difference a larger discrepancy (see Skiba et al., 2008). With a small number of students enrolled, the risk ratio may also be sensitive to small changes because proportions may change substantially with a few additional enrollments (Girvan et al., 2019). Recent research in education examining the varying strengths of different measures of disproportionality highlighted these weaknesses of the risk ratio and suggested the use of alternative measures (Bottiani et al., 2023). Thus, we also use a second measure of the enrollment gap to provide a more robust assessment of differences in enrollment.
Risk difference
The risk difference captures the difference between the proportion of students of color and the proportion of White students enrolled in AP courses. This variable ranges from −1 to 1. A value of 0 indicates in this case that these proportions are the same. As values increase and approach 1, students of color are enrolled at a greater rate than White students in AP coursework, and as values decrease and approach −1, White students are enrolled at a greater rate. This measure is similar to the risk ratio in that it reflects differences and not overall risk, where a difference between 1% and 11% may be viewed differently than one between 30% and 40%.
Independent variables
We measure counselors’ caseloads in two ways. First, we use the student-counselor variable. This variable shows the link between each additional student in a counselor’s workload and the AP enrollment rate, showing the marginal changes in counselors’ workloads. Second, a dummy variable addresses whether schools meet a value set as a staffing standard by the American School Counselor Association.
Student-counselor ratio
We create this variable by dividing the total number of students in each school by the FTE (full time effort) counselor variable for each school.
Student-counselor dummy
The student-counselor dummy variable takes on a value of 1 if teachers have caseloads exceeding 250 students. The base category is 250 or fewer students per counselor. This variable is coded in the same direction as the student-counselor ratio to provide consistency in the direction of the results reported in the tables.
Controls
We include several additional variables as controls in our models. For each racial/ethnic group, we created the percentage of students who are classified as receiving special education, have chronic absences, and are English language learners. We also include several other school-level controls. These include the number of students attending each school and the student-teacher ratio. We also include the percentages of Latino students, Black students, and Asian students. Two dichotomous variables also indicate the location of the school, where urban = 1 and suburb = 1 and town/rural is the base category. Two measures account for the wealth of the school: the percentage of students receiving FRL and the average teacher salary in the school. And finally, we also control for the number of AP courses in each school and whether students can self-select their enrollment into these classes.
In Table 2, we provide descriptive statistics for our independent variables; after accounting for missing values, the sample size is 6,125. 2 It shows that the average student-counselor ratio is 328 students, above the recommended total of 250. For the student-counselor dummy variable, we can also see that only 28% of schools receive a 0, indicating that the student-counselor ratio is 250 to 1 or lower. Previous research similarly identified about 25% of schools as meeting this threshold (Shi & Brown, 2020). Schools, on average, also appear to offer close to 11 AP courses. About half of the schools reside in urban or suburban areas, and 44% of students qualify for FRL.
Descriptive Characteristics of Schools (N = 6,125)
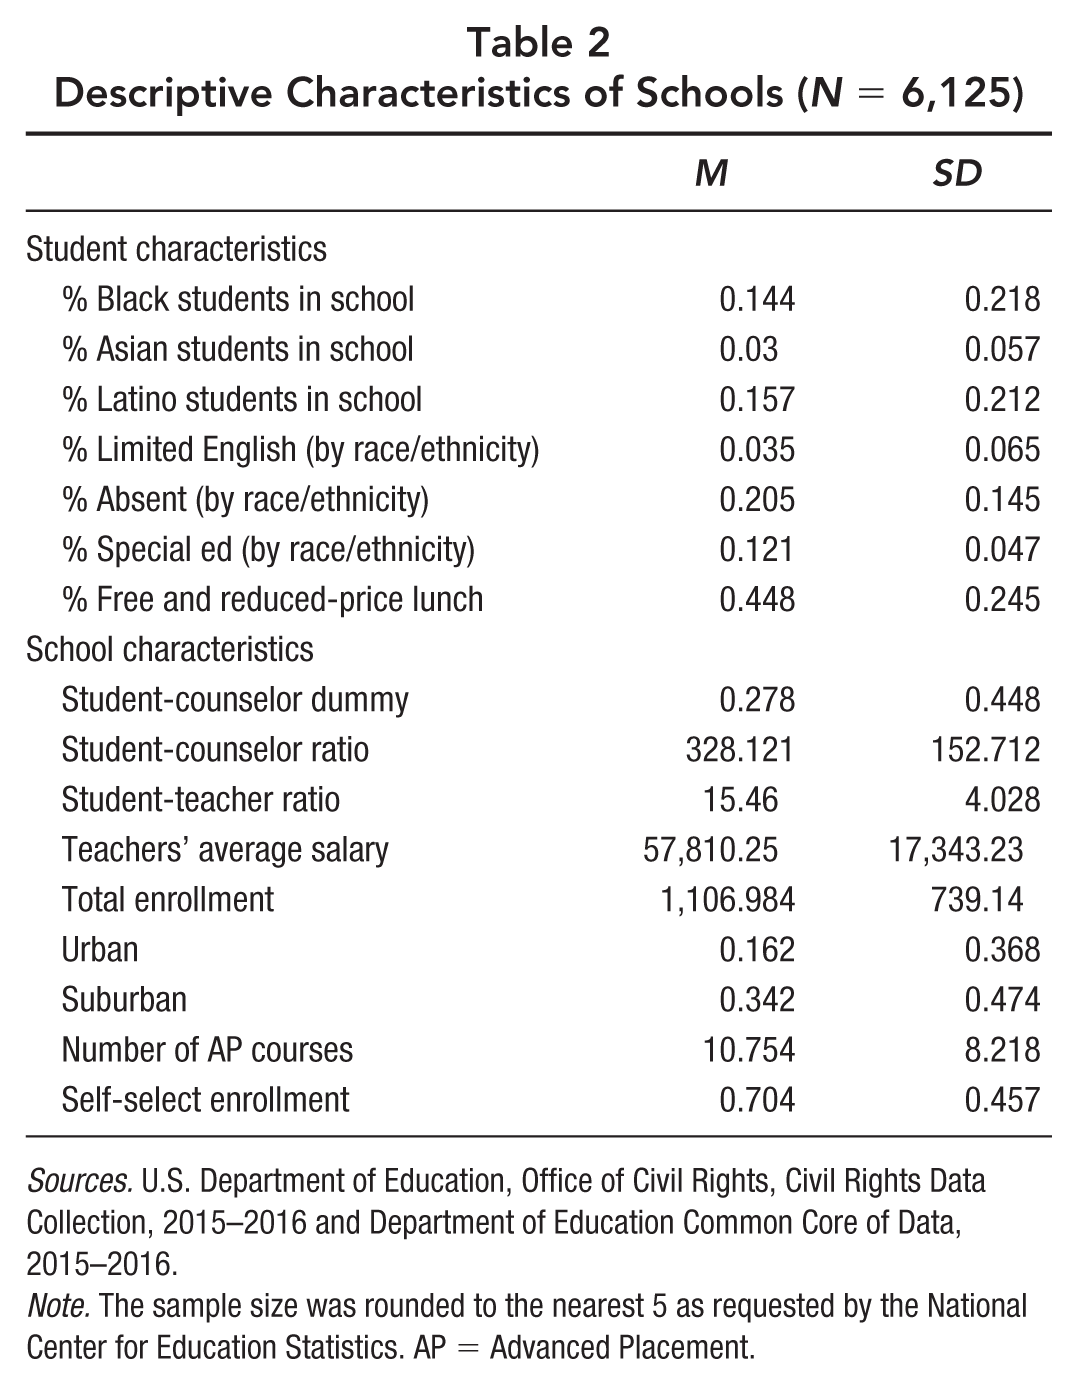
Sources. U.S. Department of Education, Office of Civil Rights, Civil Rights Data Collection, 2015–2016 and Department of Education Common Core of Data, 2015–2016.
Note. The sample size was rounded to the nearest 5 as requested by the National Center for Education Statistics. AP = Advanced Placement.
Method
We estimate each of our models using linear regression with state fixed effects. The risk index and the measure of risk differences are continuous variables that are bounded, implying the nonlinear effect of covariates. The predicted values might fall outside the unit interval because linear regression models do not reflect the boundedness of the dependent variables (Papke & Wooldridge, 2008; Xu et al., 2021). For boundaries between 0 and 1, scholars often employ logit transformation to ensure that the regression outcome lies between 0 and 1, but the transformation is unavailable when the observed values take either 0 or 1 (Papke & Wooldridge, 2008). We, however, choose to use linear regression to consistently compare the results from each model. Trade-offs between linear regression and fractional logit in practice might be negligible given that previous research has shown that linear regression predicts the outcome considerably well and skewness of estimation is not significant when the observed values do not include many zeros (Villadsen & Wulff, 2021). We use fixed effects at the state level to account for variation in state-level policies that may influence enrollments. 3 For instance, eight states require all high schools to offer AP courses, and 15 states require high schools to support some form of advanced study that may include AP coursework (Zinth, 2016). Xu et al. (2021) found that the degree of accountability at the state level and the presence of state mandates were associated with higher levels of AP enrollments.
Results
Are Better Student-Counselor Ratios Linked to Higher Levels of AP Enrollment?
We begin by examining the relationship between counselors’ caseloads and the proportion of students in each racial and ethnic group that are enrolled in AP courses, testing our first hypothesis. Our analyses exclude schools that reported 10 or fewer members of a racial/ethnic group. We first examine the proportion of students enrolled in any AP course and then examine enrollment by subject area. We estimate separate models for the two measures of counselors’ caseloads when examining enrollment in each type of AP course. The student-counselor ratio has been used more extensively in previous research (e.g., Woods & Domina, 2014; Xu et al., 2021) and provides our key measure. In the initial stage of analysis, we also report results from the student dummy variable to allow the reader to more easily assess the differences that occur as counselors’ caseloads either meet or exceed the recommended ratio of 250 or fewer students. We report the full results of the first set of models we estimate in Table 3. To report the remainder of our results more concisely, we summarize the results from our remaining models and present them in Table 4. Thus, in Table 4, we only show the results from our models for the two measures of counselors’ caseloads. All models reported include the same set of control variables shown in Table 3, and the complete results are available in the appendix available on the journal website.
Student-Counselor Ratio and Proportions for Overall AP Enrollment by Race and Ethnicity
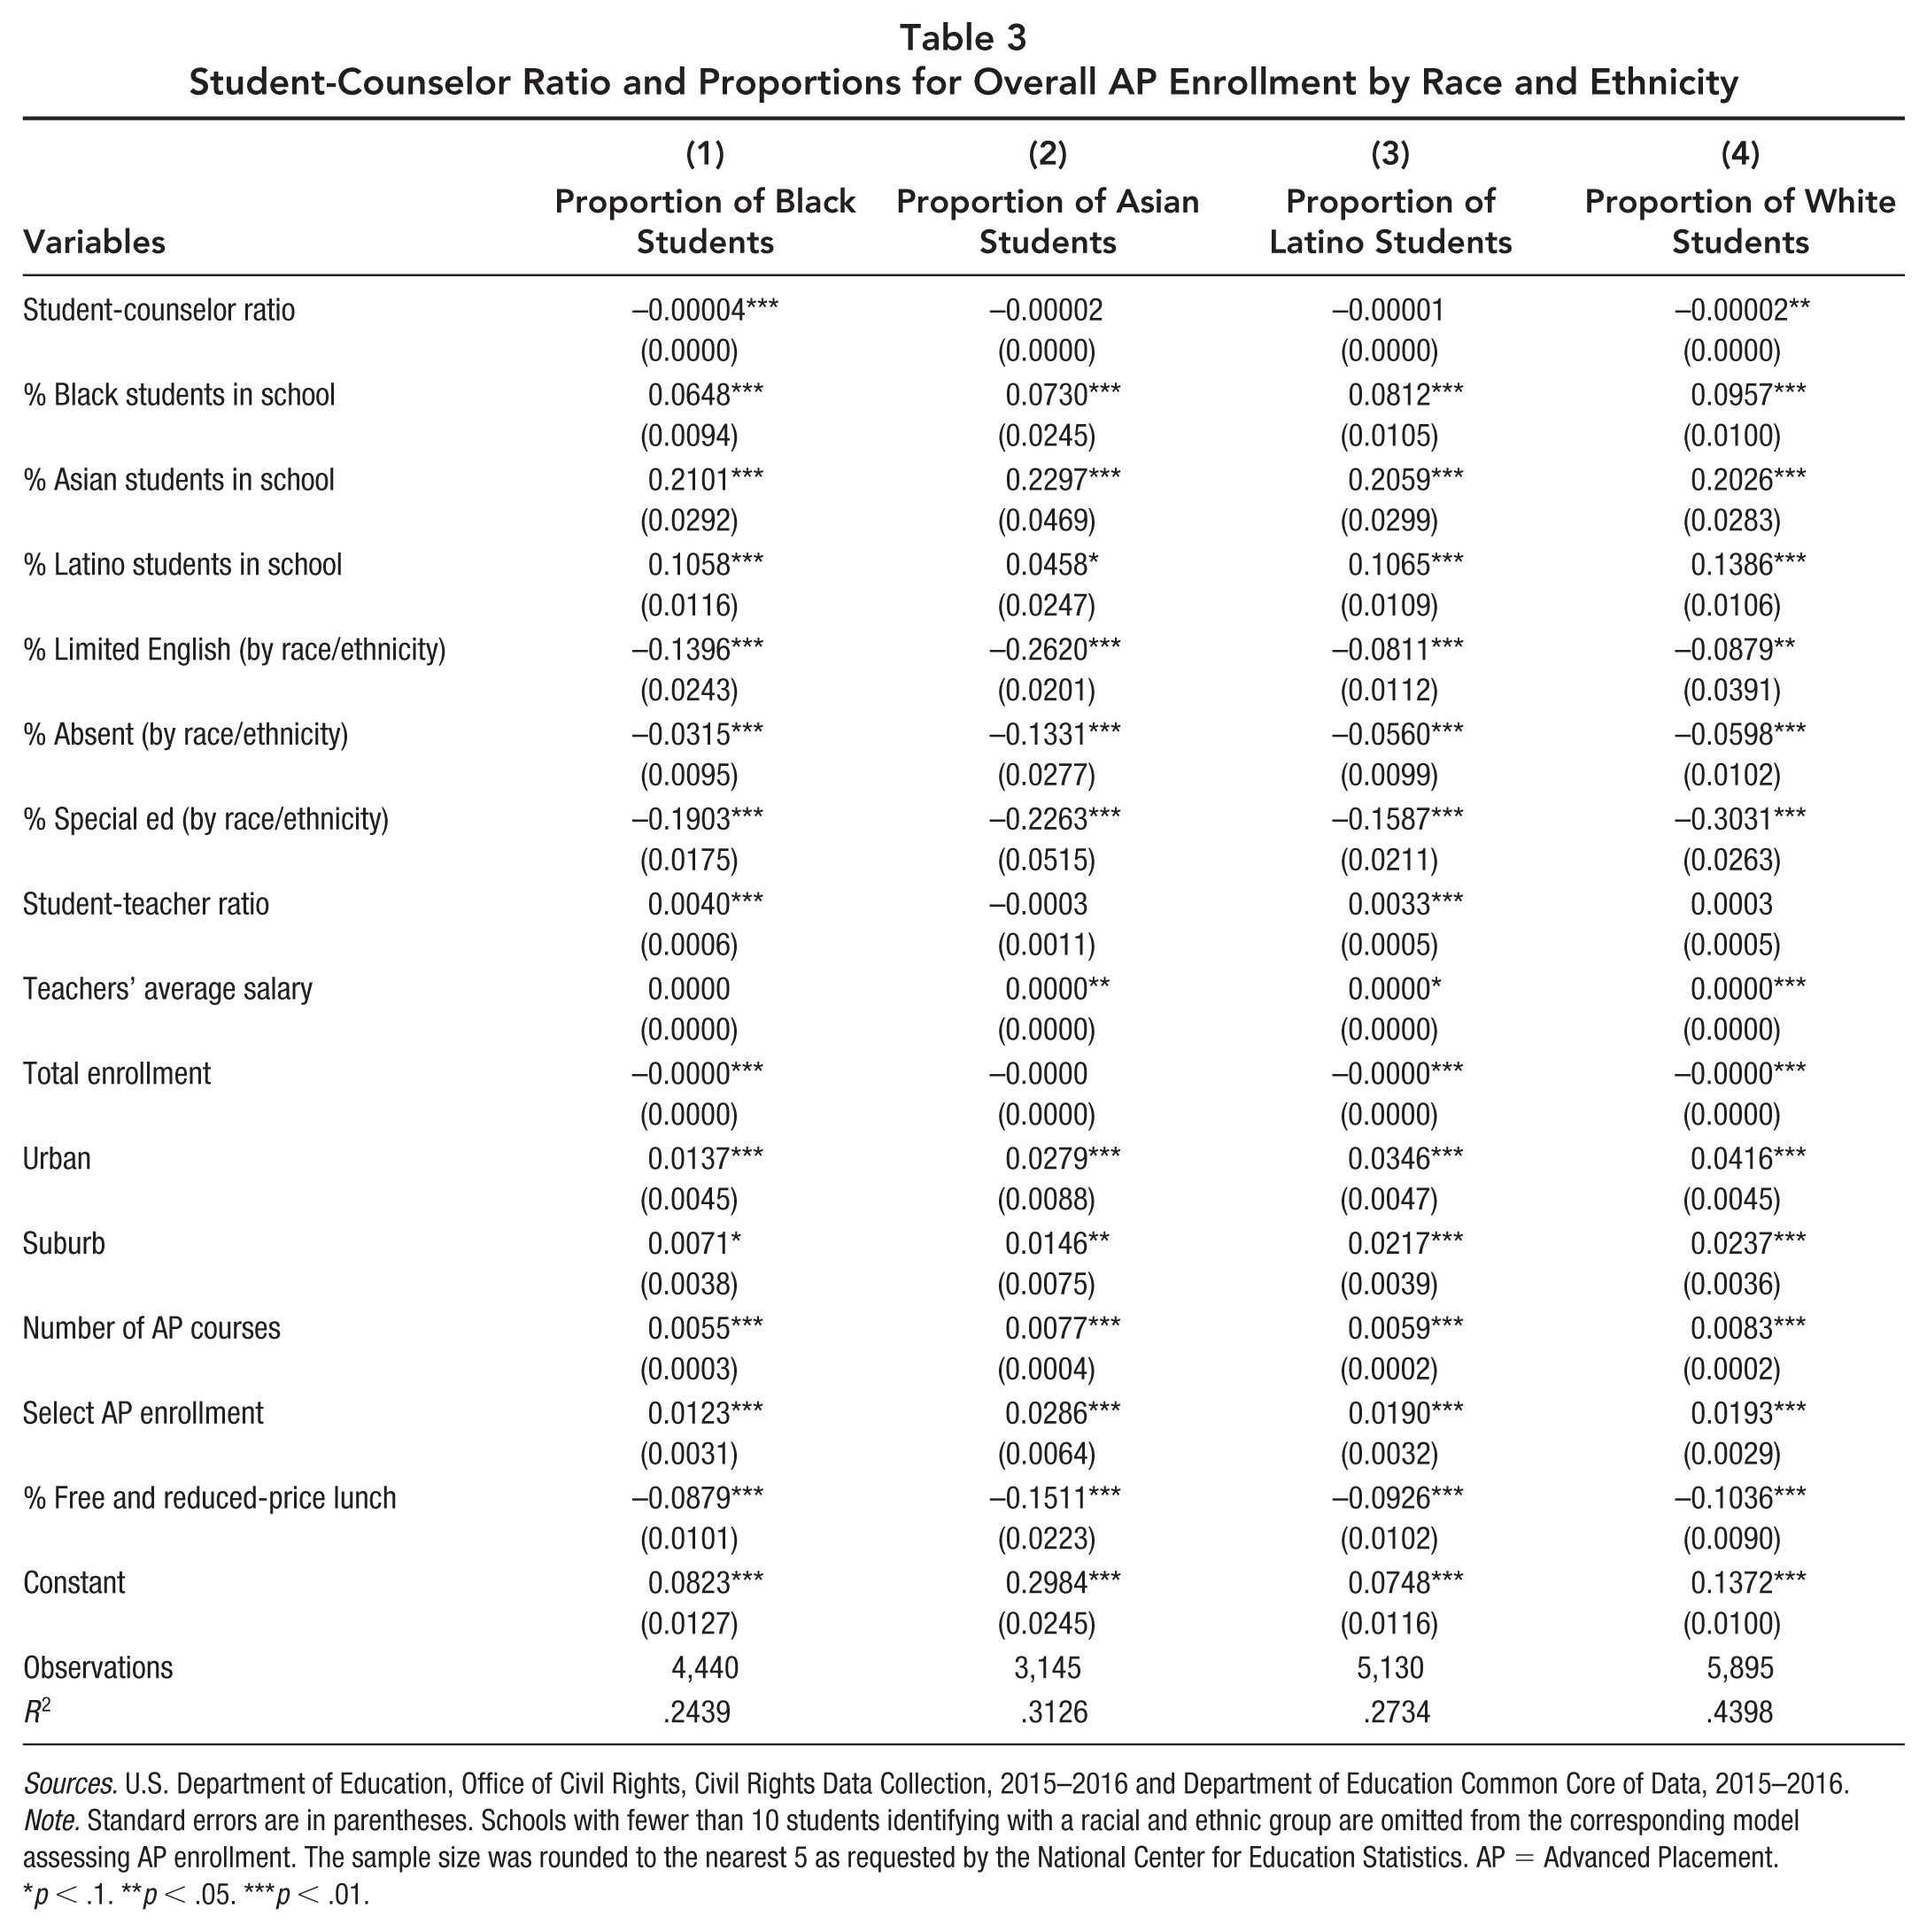
Sources. U.S. Department of Education, Office of Civil Rights, Civil Rights Data Collection, 2015–2016 and Department of Education Common Core of Data, 2015–2016.
Note. Standard errors are in parentheses. Schools with fewer than 10 students identifying with a racial and ethnic group are omitted from the corresponding model assessing AP enrollment. The sample size was rounded to the nearest 5 as requested by the National Center for Education Statistics. AP = Advanced Placement.
p < .1. **p < .05. ***p < .01.
Student-Counselor Caseload and Proportions of Students Enrolled in AP Courses by Student Race and Ethnicity
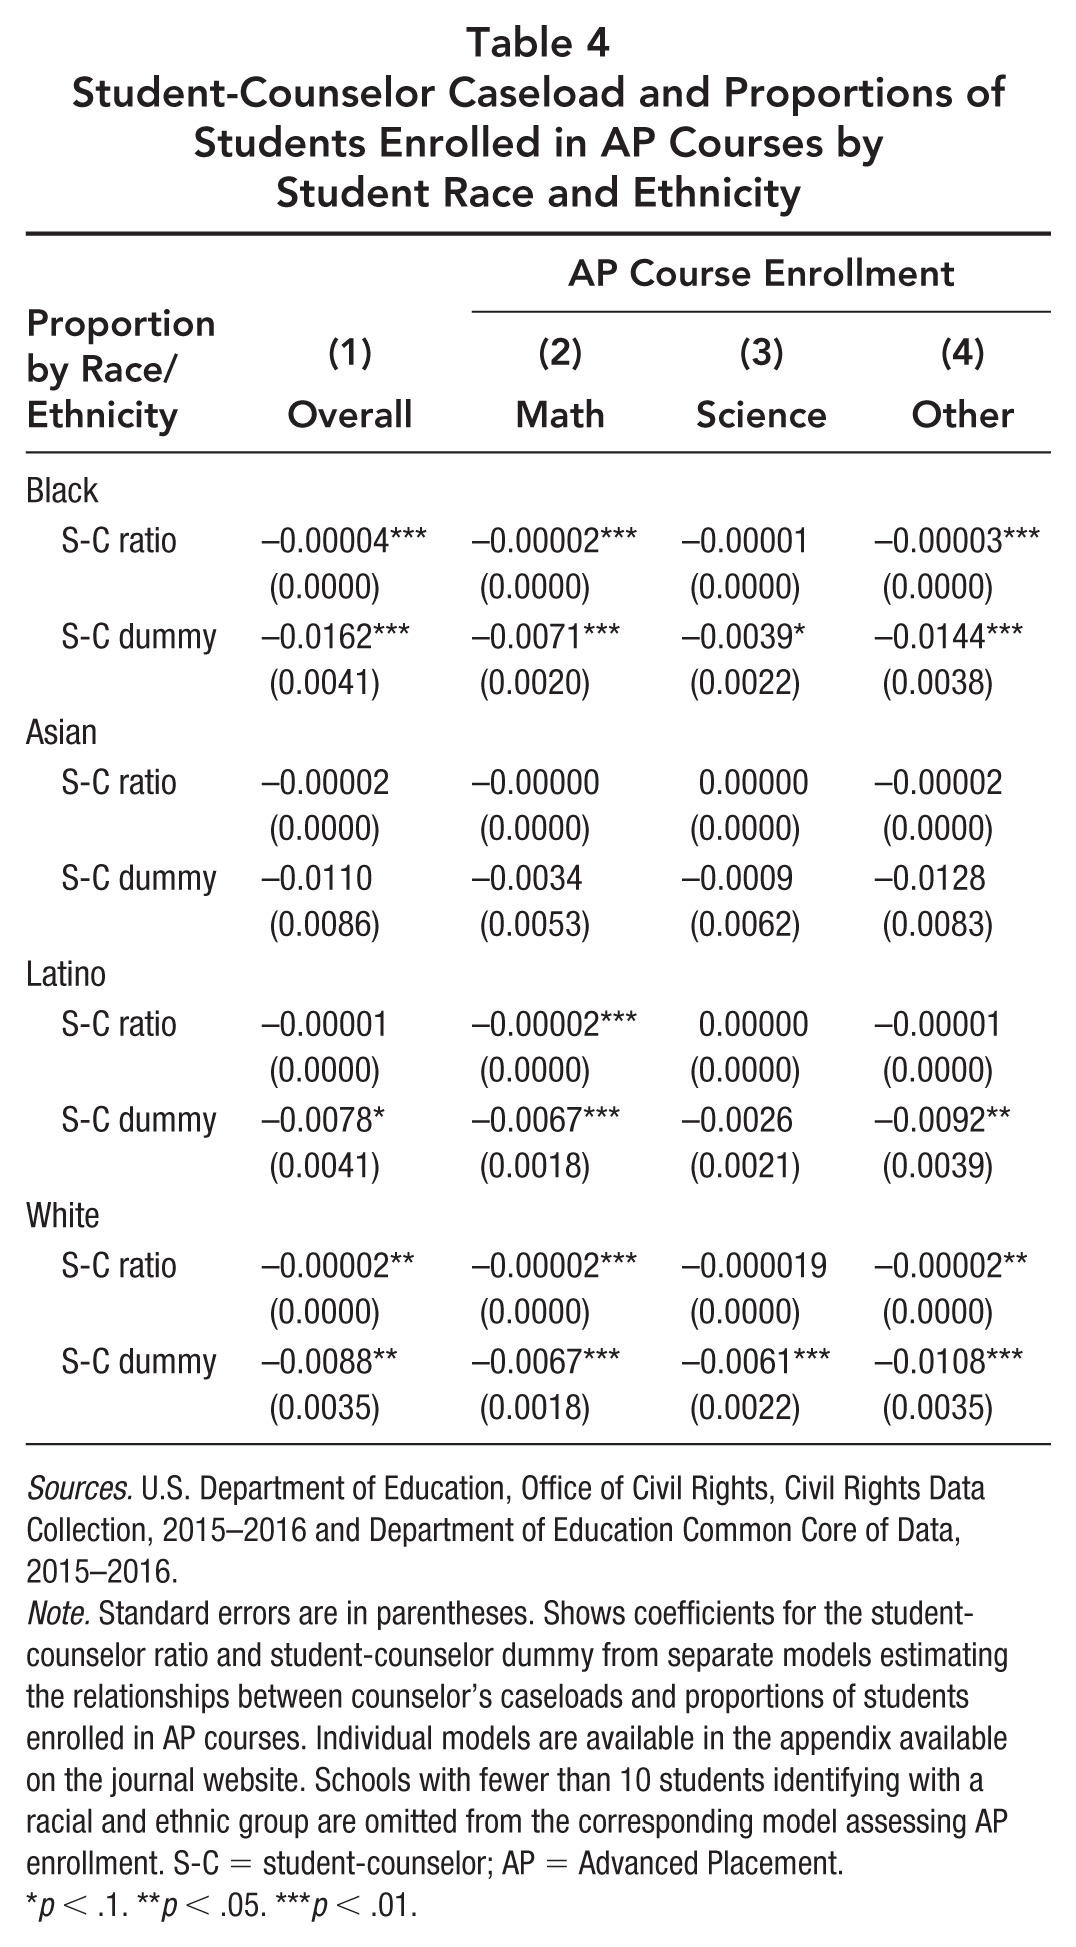
Sources. U.S. Department of Education, Office of Civil Rights, Civil Rights Data Collection, 2015–2016 and Department of Education Common Core of Data, 2015–2016.
Note. Standard errors are in parentheses. Shows coefficients for the student-counselor ratio and student-counselor dummy from separate models estimating the relationships between counselor’s caseloads and proportions of students enrolled in AP courses. Individual models are available in the appendix available on the journal website. Schools with fewer than 10 students identifying with a racial and ethnic group are omitted from the corresponding model assessing AP enrollment. S-C = student-counselor; AP = Advanced Placement.
p < .1. **p < .05. ***p < .01.
Table 3 shows that lower proportions of White and Black students appear to enroll in any AP course when they attend schools with higher student-counselor ratios. We showed previously in Table 1 that on average, about 11% of Black students and 20% of White students in a school enroll in AP courses. Column 1 of Table 3 shows that as access to guidance counselors becomes more difficult, the proportion of Black students in the school enrolled in AP courses is associated with a decrease, on average, of about 0.4 percentage points for each gain of 100 students in the counselor’s caseload. This change is equal to about two thirds of a standard deviation in this variable. For White students, the results are in a similar direction but somewhat smaller in magnitude. We see an associated decrease in enrollment of 0.2 percentage points for each gain of 100 students. The degree of access students have to guidance counselors, however, is not linked to changes in overall AP enrollment among Asian and Latino students. In addition, Table 3 shows that a higher percentage of students enrolled in special education, who are chronically absent, or participate in limited English programs are tied to lower enrollments across all racial and ethnic groups. Higher teacher salaries are linked to higher proportions of enrollment among Asian and White students, and schools in suburban and urban areas are linked to higher proportions of enrollment among all four groups. Smaller schools are associated for all of these groups—except for Asian students—with higher proportions of enrollment in AP courses.
When we turn to the relationship between the student-counselor dummy variable and enrollment in AP courses, there is a similar pattern of findings (see Table 4). When the guidance counselor caseload exceeds the 250 to 1 ratio, the proportion of Black students in the school enrolled in AP courses is associated with a decrease on average of about 1.6 percentage points, moving from 11% to 9%. White students are associated with a decrease of 0.9 percentage points, and Latino students see a decrease of a similar size, which we failed to see in the models with the student-counselor ratio. This latter result is, however, only marginally significant. The degree of access students have to guidance counselors again is not associated with changing proportions of AP enrollment among Asian students.
We next turn to investigate the relationship between student access to guidance counselors and enrollment in STEM (math and science) and non-STEM (other) courses, again presenting our results in Table 4. We first consider the relationship between the counselor’s caseloads and enrollment in math AP coursework. Column 2 in Table 4 shows that when gaining access to guidance counselors becomes more difficult, lower proportions of Black students, Latino students, and White students are linked to enrollments in math AP coursework—with the outcomes similar in size across these groups. The proportion of students enrolled is associated with a decrease, on average, of 0.2 percentage points for each gain of 100 students in the counselor’s caseload. Black and Latino students, however, enroll in smaller proportions in math AP courses than other students, with average enrollments of 2.2% and 3%, respectively (see Table 1). Thus, these changes represent larger proportional decreases for these groups closer to 1/10 for Black students and 1/15 for Latino students. When examining the student-counselor dummy variable, Black, Latino, and White students are associated with a decrease of 0.7 percentage points in math AP enrollments when attending schools with more than 250 students per counselor.
Column 3 in Table 4 presents the results for the proportion of students enrolled in science AP courses. There is no significant relationship between the student-counselor ratio and student enrollments in these courses. There are some limited results for the student-counselor dummy variable. White students are associated with a decrease in enrollments in science AP courses of 0.6 percentage points when attending schools where counselors advise more than 250 students. For Black students, there is also a marginally significant relationship in the same direction.
For non-STEM coursework, the results are similar to those that were observed for overall AP Enrollment: Among White and Black students, as access to guidance counselors becomes more difficult, the proportion of students enrolled is associated with a decrease of 0.2 and 0.3 percentage points, respectively, for each gain of 100 students in the student-counselor ratio (Table 4, Column 4). Turning to the student-counselor dummy variable, the results show that White students are associated with a decrease in enrollment of 1.1 percentage points and Black student are associated with a decrease of 1.4 percentage points when they are in schools where caseloads are higher than 250 students. The outcome for Latino students is also significant, where those students are associated with a decrease in enrollment of 0.9 percentage points.
In sum, across all models, improved access to counselors seems most consistently associated with higher proportions of AP enrollment among White students. Black students also had higher proportions of AP enrollment in two out of three of these subject areas and in overall enrollment when caseloads are lower. Latino students followed several steps behind, with them linked to benefits only in the case of AP math enrollment and overall enrollment. For Asian students, there was no evidence in any of our models of a relationship between student-counselor ratios and AP enrollment. Thus, we fail to find support for our first hypothesis across all racial and ethnic groups.
The Enrollment Gap: Disparities in Enrollment Between Students Of Color and White Students
We now turn to our second hypothesis and examine whether lower student-counselor ratios are associated with smaller enrollment gaps between students of color and White students. As mentioned previously, we rely on two measures of disparity as dependent variables. First, we use the risk ratio index, which—as described previously—relies on an index of proportions where the portion of students of color enrolled in AP courses is in the numerator and the proportion of White students enrolled is in the denominator. When values for the risk ratio index decrease, White students are enrolled in AP courses at increasingly higher proportions than students of color. Second, we use risk differences. This variable represents the difference between the proportion of students of color and the proportion of White students enrolled in AP courses, varying from −1 to 1. 4 As these values decrease and approach −1, White students are similarly enrolled in higher proportions in AP courses than students of color. The models include the same independent variables as included previously with one alteration. We instead include differences between students of color and White students for the following variables: students receiving special education, with chronic absences, and classified as English language learners. To report the results of our models more concisely, we present the results for only our key independent variable—the student-counselor ratio—in Table 5. We rely on this variable rather than the student-counselor dummy to stay more closely in line with previous research (Xu et al., 2021). We first rely on risk ratios as a measure of disparity in enrollment and then consider the risk difference models.
Disparity in Enrollment: The Student-Counselor Ratio and Risk Ratios for AP Course Enrollment by Student Race and Ethnicity
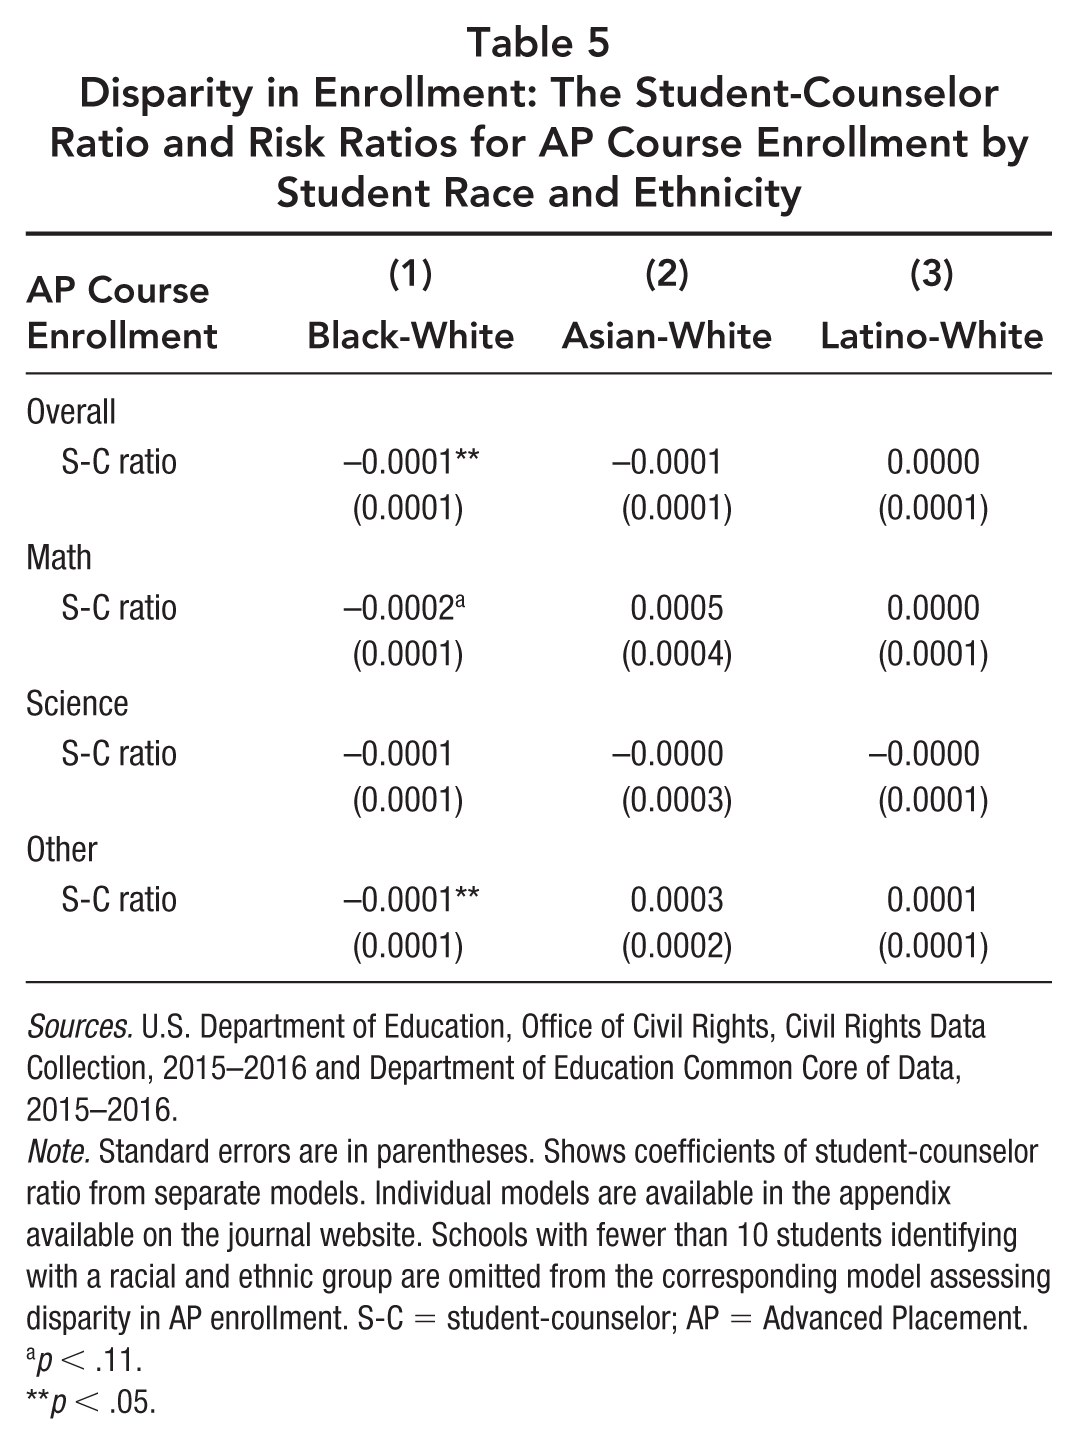
Sources. U.S. Department of Education, Office of Civil Rights, Civil Rights Data Collection, 2015–2016 and Department of Education Common Core of Data, 2015–2016.
Note. Standard errors are in parentheses. Shows coefficients of student-counselor ratio from separate models. Individual models are available in the appendix available on the journal website. Schools with fewer than 10 students identifying with a racial and ethnic group are omitted from the corresponding model assessing disparity in AP enrollment. S-C = student-counselor; AP = Advanced Placement.
p < .11.
p < .05.
We first consider the disparity between Black and White students. Column 1 of Table 5 shows that the disparity between Black and White students enrolled in AP courses overall and in other AP courses grows larger when counselors have larger caseloads. The risk ratio is associated with a significant decrease in both cases by 0.0001 for each additional student added to the counselors’ caseloads—indicating a larger enrollment gap. For example, if 10% of Black students are enrolled in other AP courses and 20% of White students are enrolled, then the risk ratio is 0.5. If 100 additional students are added to a counselor’s caseload, then the risk ratio decreases by 0.01—thus decreasing to 0.49 in this example, indicating that Black students are then less than half as likely as White students to enroll in these classes. There also exists a similar relationship in the case of math enrollment, but it exceeds the traditional bounds of significance (p < .11). There are no significant values for the disparity in enrollments between Black and White students when examining the risk difference models in Table 6. This may occur because the gains in the proportions of Black students enrolled in AP programs in schools with lower student-counselor ratios appear fairly similar to the gains for White students (see Table 4). In schools with a small population of Black/White students, the risk ratio may also be more sensitive to smaller changes in the number of students enrolled because proportions may change substantially with a few additional enrollments (Girvan et al., 2019). Overall, the risk ratio models provide some evidence that the AP enrollment gap between Black students and White students may lessen when they attend schools where counselors have smaller caseloads. These conclusions should be treated cautiously, however, given the lack of similar findings in the risk difference models.
Disparity in Enrollment: The Student-Counselor Ratio and Differences in AP Course Enrollment by Student Race and Ethnicity
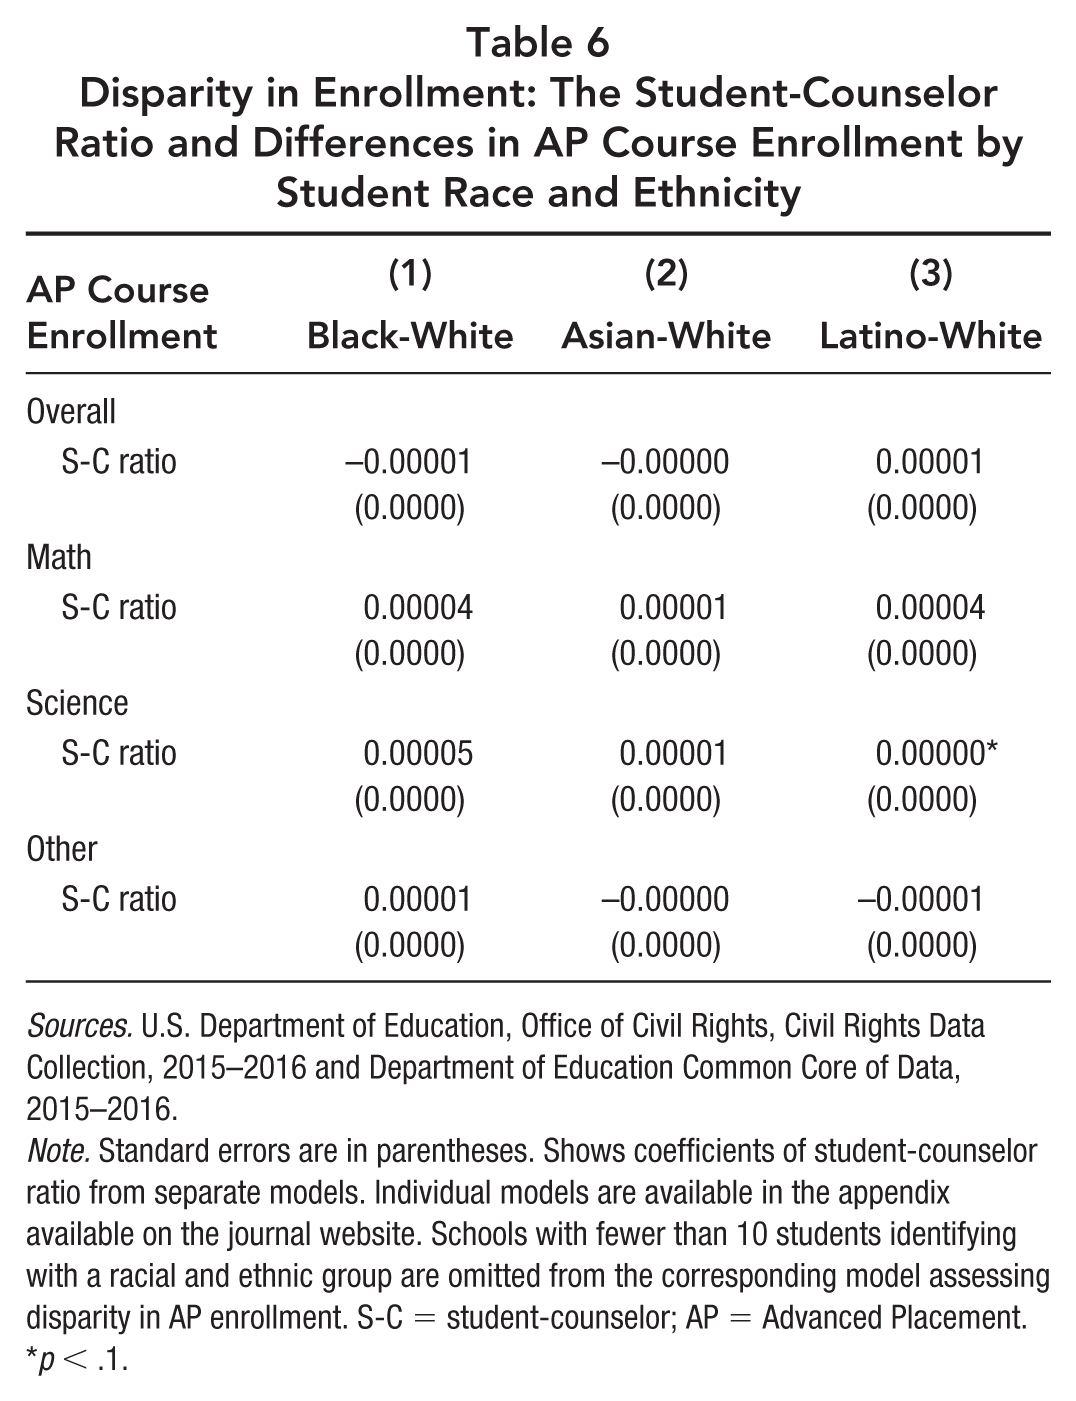
Sources. U.S. Department of Education, Office of Civil Rights, Civil Rights Data Collection, 2015–2016 and Department of Education Common Core of Data, 2015–2016.
Note. Standard errors are in parentheses. Shows coefficients of student-counselor ratio from separate models. Individual models are available in the appendix available on the journal website. Schools with fewer than 10 students identifying with a racial and ethnic group are omitted from the corresponding model assessing disparity in AP enrollment. S-C = student-counselor; AP = Advanced Placement.
p < .1.
For Asian and White students, there are no significant findings in the risk ratio or risk difference models. For the enrollment gap between Latino and White students, there are no significant findings in the risk ratio models. For the risk difference models, the coefficient for AP science is marginally significant and in the opposite direction. It suggests that as access to counselors becomes more difficult, the values of the risk difference variable increase—indicating that the proportion of Latino students enrolled is linked more closely to that of White students. This may occur because of lower AP enrollments among White students in schools where counselors have higher caseloads. Overall, we find tentative support for Hypothesis 2 only for the enrollment gap between Black and White students.
Discussion and Conclusion
Access to counselors by students varies across schools, with some schools meeting the recommended 250 to 1 student to counselor ratio and others far exceeding it. This study has examined whether greater ease of access to counselors influences student enrollment in AP courses across racial and ethnic groups. Previous research has found that school counselors play an important role in directing students toward key coursework and helping prepare them for college—thus, it is likely that in high schools with lower student-counselor ratios, higher proportions of students should enroll in AP courses. Our findings show that in these schools, counselors appear to direct some students toward AP coursework while overlooking or not being as effective in steering others. There is, however, some evidence in schools with lower student-counselor ratios of decreased disparities in AP enrollments between Black and White students. Thus, the findings in this article suggest that when counselors have lower caseloads, they may provide a weak democratizing force for ensuring broader access to AP courses.
Therefore, instead of falling directly in line with arguments made by Bourdieu and other reproduction scholars that schools singularly benefit advantaged students, this article has provided a more nuanced understanding of the connections between counselors and AP enrollments. Our study falls more closely in line with arguments made by Downey and Condron (2016), who argued that it would be more effective for researchers to not only consider schools as heightening inequalities, that is, exacerbatory, but also to view them as refractors of inequality, where schools may play a neutral role or act in a compensatory way.
Our study contributes to previous research on college readiness by examining the link between student-counselor ratios and AP enrollments. Much previous research on counselors and college choice focuses on counselors as sources of information (e.g., Bryan et al., 2023). Some previous work has connected counseling to college readiness, but this research has largely focused instead on factors such as counselors’ levels of preparation (Novakovic et al., 2021) or the goals of college readiness counseling (Gilfillan, 2018).
This study also contributes to previous research that has sought to understand the influence of the size of counselors’ caseloads on schools more generally. As discussed previously, researchers have examined the relationships between changing caseloads and students’ contacts with counselors or college enrollments (Bryan et al., 2023; Woods & Domina, 2014). A recent review of studies examining the student-counselor ratio and student outcomes identified 16 studies, but only three relied on national data, and none examined enrollments in AP courses (Kearney et al., 2021).
Our empirical results indicate that White students followed by Black students appear most likely to be directed by counselors to AP coursework when they are in schools where contact between counselors and students is likely greater. These results are largely apparent for both measures of counselors’ caseloads. The models reported in Tables 3 and 4 show that when access to counselors is greater, White students are linked to higher levels of AP enrollment in all four areas that we examine. Black students similarly are linked to higher levels of enrollment in these areas except for science. Perhaps most striking are the few differences in AP enrollments among Latino and Asian students seen in these models across schools with different levels of access to counselors. Latino students are only linked to higher levels of enrollment when they are in schools with higher student-counselor ratios in the areas of math and other coursework, suggesting that counselors may play a more limited role in steering Latino students toward AP courses. Enrollments for Asian students appear unrelated to differences in student-counselor ratios. These latter findings are evident when using either measure of counselors’ caseloads. Thus, as mentioned earlier, our findings provide only some support for our first hypothesis.
We note that these empirical results across these subject areas appear greatest for math, where all racial and ethnic groups have their lowest enrollments. As we mentioned previously, the average proportion of Black students in a school that enroll in math AP coursework is 2.2%. Our results indicate that when the student-counselor variable increases by 100 students, there is an associated decrease in this proportion of about 1/10. These results appear even more substantial when examining the dummy variable. When counselors advise more than 250 students, there is an associated decrease in average math AP enrollments of about one-third.
When turning to examine the AP enrollment gap, the results provide some evidence that counselors may help to reduce the gap between White and Black students when they have lower caseloads. When caseloads decrease, there is an associated decrease in the gap for overall AP enrollments and enrollments in other AP courses. These findings are unlike those discussed previously by Xu et al. (2021). This gap is associated with a decrease only when using the risk ratio as a measure of disparity, and this is not replicated with the risk difference variable. This may occur because of small changes in enrollments that are more easily identified by the risk ratio models. Given concerns about the risk ratio reported in recent research (Bottiani et al., 2023), these findings provide only tentative evidence of this relationship. We do not see similar results when examining the AP enrollment gap between White and Latino students or between White and Asian students. Thus, these findings fail to provide clear support for Hypothesis 2.
This pattern of results we observe for the enrollment gap may occur for several reasons. AP enrollments for Asian students appear unaffected by changes in counselors’ caseloads, but gains by White students do not decrease this discrepancy (Atkinson et al., 1989). For Latino students, this may occur because they may engage in interpersonal contacts with counselors less frequently than Black students. Researchers have shown that Black students, but not Latino students, are more likely than White students to contact counselors for college-related information and to view them as having the most influential impact on how they think about postsecondary education (Bryan et al., 2009; Cholewa et al., 2016). The effect of potential language barriers may also not fully be captured through the English as a second language variable. Latino immigrants with very limited English proficiency have been found to be less open to academic support (Stanton-Salazar et al., 2001). In addition, Latino students are more likely to attend high poverty schools than Black students, where counselors may be directed to outside tasks, making them more difficult to access (U.S. GAO, 2018).
Overall, our findings demonstrate that lower student-counselor ratios matter, but how much varies across racial and ethnic groups. They also indicate that counselors should further direct their energy toward increasing the enrollments of Latino and Black students in AP courses. The pattern of AP enrollments shown in this work is similar to that shown by Ricciardi and Winsler (2021), where Black and Latino students are most underrepresented. Although this article provides some evidence that counselors matter—Black and Latino students appear more likely to enroll in AP courses when they are in schools where counselors are likely easier to access—this only partially diminishes the Black-White enrollment gap, and there is no similar decrease in the gap between Latino and White students. These outcomes may occur because counselors sometimes have lower aspirations for these students of color, decreasing the likelihood even in schools with lower student-counselor ratios that higher percentages of Black and Latino students will pursue opportunities such as enrolling in AP coursework (Tenenbaum & Ruck, 2007). They also may be attending schools where counselors have less time for individualized contacts (Bryan et al., 2011).
The findings for Asian students also suggest a possible disconnection between counselors and these students. This may occur because Asian students are less likely to seek out counselors for advice (Atkinson et al., 1989) or because counselors view them as a model minority and their difficulties may become invisible (Lee, 1997; Wing, 2007). Although advantaged within the AP environment, this disconnection may make it difficult for Asian students to receive academic and developmental guidance.
We note that there are limitations to our research. We rely on school-level data and cannot capture useful information that could be provided at the individual level. Individualized data that included direct measures of counselor-student contacts related to AP courses would allow scholars to better determine the frequency and quality of these connections in school environments and how they vary across racial and ethnic groups. It could also include students’ perceptions of counselors’ aspirations and academic expectations.
There are some conclusions from our work that may be helpful to practitioners and policymakers. First, the link between the dichotomous variable reflecting the policy recommendation of 250 students and AP enrollments in our research in many cases is significant for students across three racial and ethnic groups. These potential benefits are a result of one task assigned to counselors that appears to be affected by the size of counselors’ caseloads. When aggregated with additional benefits, such as lower absenteeism, shown in other research (Kearney et al., 2021), these findings suggest that administrators should consider the value of decreasing counselors’ caseloads. Second, the pattern of increased AP enrollments in response to lower caseloads varies among students by race and ethnicity. In response, this article heightens the significance of previous calls for increased training on college readiness counseling to include skills and knowledge sensitizing counselors to the needs of students of color (Gilfillan, 2018). Augmenting counselors’ skills and knowledge in these areas may result in more fruitful relationships between counselors and students of color, leading to more beneficial outcomes for students in multiple areas, including enrollments in AP coursework.
Future research should continue to examine the role that counselors play in directing students toward AP courses. Studies could also investigate the extent to which enrollments in schools with lower student-counselor ratios translate into AP course completions and passing exam scores. The effectiveness of different measures of disparity should continue to be investigated and particularly so in the AP setting. Future research should also consider whether relationships between lower counselor caseloads and disparity in AP enrollments vary across schools as local contextual conditions, such as socioeconomic factors, change, building on previous research (Shores et al., 2020). Furthermore, scholars should also work to better understand the systematic biases that may be at play among school staff that may lead to varying patterns of enrollment. Increasing our understanding of these relationships can help shape future education policies that may cause the benefits provided by AP coursework to be shared more broadly across racial and ethnic groups.
Supplemental Material
sj-docx-1-edr-10.3102_0013189X261457602 – Supplemental material for Examining the Role of Counselors in Advanced Placement Course Enrollment
Supplemental material, sj-docx-1-edr-10.3102_0013189X261457602 for Examining the Role of Counselors in Advanced Placement Course Enrollment by Christine H. Roch, Kaylis T. Baxter and Jeongyoon Jane Yang in Educational Researcher
Footnotes
Notes
Authors
References
Supplementary Material
Please find the following supplemental material available below.
For Open Access articles published under a Creative Commons License, all supplemental material carries the same license as the article it is associated with.
For non-Open Access articles published, all supplemental material carries a non-exclusive license, and permission requests for re-use of supplemental material or any part of supplemental material shall be sent directly to the copyright owner as specified in the copyright notice associated with the article.