
Abstract
The purpose of this article is to synthesize the existing research on classwide social, emotional, and behavioral programs for kindergarten students. The researchers identified 26 studies in peer-reviewed journals and dissertation databases to review. Each study was examined and coded in terms of study characteristics, strength of evidence, and quality of evidence. The interventions represented in the studies were grouped into four categories: social–emotional learning, behavioral, coping skills, and other. The studies of behavioral interventions demonstrated the strongest effects on increasing prosocial behavior and decreasing antisocial behavior. These studies also included the highest quality of research. The social–emotional learning intervention studies consistently demonstrated weaker effects and lower quality research. The remaining categories included too few studies to draw meaningful conclusions. Implications for practice and future research regarding classwide kindergarten social, emotional, and behavioral interventions are discussed.
Kindergarten is most children’s first exposure to formalized schooling (McIntyre, Eckert, Fiese, DiGennaro Reed, & Wildenger, 2010; Robinson & Diamond, 2014), affecting their attitudes toward school (Ladd & Price, 1987; Wasik, Wasik, & Frank, 1993), as well introducing critical cognitive and behavioral skills. Unfortunately, many children struggle in kindergarten because they are underprepared to meet the social, emotional, and behavioral demands of the school context. For example, researchers who surveyed more than 3,300 teachers found that 46% reported that more than half of incoming kindergarteners lacked the social and emotional skills to succeed (Lin, Lawrence, & Gorrell, 2003). In another study, McIntyre, Eckert, Fiese, DiGennaro, and Wildenger (2007) found that more than half of the parents they surveyed were concerned about their child’s transition into kindergarten, identifying social behavior issues as the most prominent concern.
This deficit area is particularly serious, as Stormont, Beckner, Mitchell, and Richter (2005) demonstrated that teachers consistently view social skills as more important to success in kindergarten than academic skills. But teachers do not seem adequately prepared for this need. After surveying and interviewing kindergarten and first-grade teachers, Tillery, Varjas, Meyers, and Collins (2010) reported that these teachers had little formal preparation in classroom behavior management; most of their skills had been gained through trial and error learning. This finding is consistent with Oliver, Wehby, and Reschly’s (2011) finding that the most frequent requests teachers make for assistance are related to behavior management.
Both teachers and parents are justified in their concern for kindergarten students’ social-behavioral development. Fox, Dunlap, and Powell (2002) demonstrated that early school problems tend to persist and worsen with time. Moreover, poor performance in kindergarten predicts a variety of negative outcomes including school dropout (Hickman & Heinrich, 2011), delinquency (Masse, 1999), crime (Hawkins, 1995), and violence (Walker & Sprague, 1999). Considering these serious consequences of poor kindergarten outcomes, kindergarten teachers should be prepared to support incoming students quickly and effectively. Identifying effective intervention is particularly important in light of the mixed evidence for interventions for students in the early years of their education.
A classwide or universal intervention may help teachers efficiently address the social–behavioral needs of incoming kindergarten students. Classwide interventions are designed to expose every student in the class to the treatment irrespective of relative ability or need. In an introduction to a special issue on classwide interventions, Hawkins (2010) identified two major benefits of classwide interventions. They provide a first line of defense by addressing existing problems and preventing future problems. Also, they are an efficient way to address the problems of several students without developing individualized plans or expending resources that are not typically available. Oliver et al. (2011) determined that classwide interventions yield effect sizes between 0.71 and 0.80. Because there are several types of classwide interventions with a variety of different approaches, teachers may need guidance finding the most effective for producing positive social–behavioral outcomes needed for their students. Additionally, the extent to which classwide interventions are effective specifically in kindergarten needs to be explored.
The purpose of this review is to identify existing classwide (universal) social–behavioral interventions for kindergarten students and to assess their general and relative effectiveness. This review will evaluate the quality of evidence as well. Four specific research questions were developed to guide the review: (a) To what extent do classwide social–behavioral interventions produce positive outcomes for kindergarten students? (b) How effective are the intervention programs when compared? (c) What forms and quality of evidence support these interventions? (d) What should teachers consider when selecting a universal social and emotional behavior intervention?
Method
Study Identification
Studies were identified for this review using a three-step process (see Figure 1). First, an electronic search was completed in Academic Search Premier, Educational Resources Information Center, and PsychINFO, using the search terms kindergarten and social skills. From this search, articles consistent with the type of study sought (e.g., Monkeviciené, Mishara, & Dufour, 2006; Webster-Stratton, Reid, & Stoolmiller, 2008) were collected and imported into Zotero (zotero.org). The subject terms for these studies were analyzed to ensure that the final search terms captured the depth and breadth of the intended topic. From these terms, a final search string was developed which included the following: Kindergarten AND [(social*) OR (behavior*) OR (emotion*) OR (“mental health”) OR (interpersonal) OR (conflict) OR (delinquen*) OR (violen*) OR (affect*) OR (internaliz*) OR (externaliz*) OR (antisocial*)] AND [(program) OR (intervention) OR (instruction) OR (curricul*) OR (skill) OR (train*) OR (teach*)] AND [(universal) OR (classwide) OR (schoolwide) OR (whole class) OR (large group) OR (prevent*) OR (primary) OR (Tier 1) OR (“response to intervention”)].
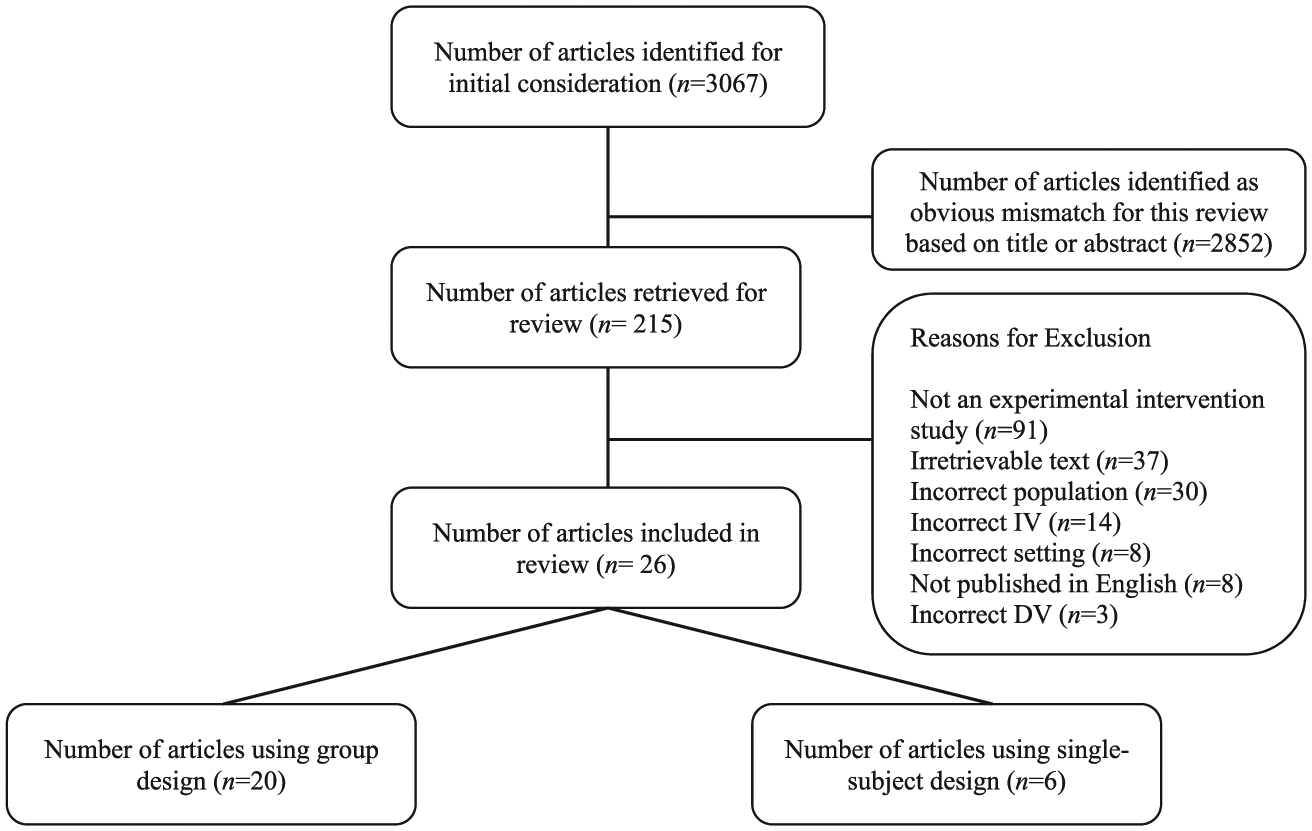
Schematic summary of the study identification process. IV = independent variable; DV = dependent variable.
Using this string to search Academic Search Premier, Educational Resources Information Center, and PsychINFO produced 3,060 references, which were imported into Zotero for review. Each article title and abstract was evaluated against the inclusion criteria to identify articles appropriate for this review. Studies that identified specific branded intervention packages (e.g., Zippy’s Friends, Stop and Think, and The Incredible Years) were noted, and 11 branded intervention packages were identified. An additional electronic search was conducted using the name of each program and kindergarten (e.g., “Zippy’s Friends” AND “kindergarten”). This search produced an additional seven articles that had not been identified by the previous search, resulting in a total of 3,067 articles that were considered for inclusion in this review.
Inclusion Criteria
The following criteria were used to determine eligibility for inclusion in this review. First, the article needed to report on the empirical evaluation of an intervention, including active manipulation of an independent variable and subsequent measurement of a dependent variable. Second, the study needed to employ an experimental design, including randomized controlled trials, quasi-experiments, and single-subject research designs (e.g., ABAB reversal/withdrawal and multiple baseline). Third, the study needed to address social, emotional, mental health, or behavioral outcomes. Studies with a primary dependent variable of academic outcomes were excluded (e.g., Volpe, Young, Piana, & Zaslofsky, 2012). These studies were excluded for two reasons. First, they would be of little use to kindergarten teachers who already engage in the most effective academic practices but continue to experience problems with social behavior. Second, they would not provide useful information about how kindergarten teachers can effectively manage behavior when no academic instruction is occurring (e.g., free play time).
The fourth inclusion criterion was the participant sample had to include children enrolled in kindergarten at the time the interventions were administered. Studies that included kindergarten students along with children in other grades were also included. Fifth, the intervention had to be conducted in the school setting; studies reporting on interventions administered primarily in clinics, hospitals, and residential treatment centers were excluded. Interventions that included components administered outside of the school (e.g., home, afterschool program, bus) were included, as long as the majority of the intervention (based on amount of time) occurred in the school. Finally, the intervention had to be a universal, Tier 1, or classwide intervention and thus accessible to all students in the class at approximately the same time. Interventions that included screening the whole class and then intervening only with students at risk or simply administering the intervention to small at-risk groups within the class were excluded (e.g., First Steps to Success). Studies in which researchers collected data on some subset of students in the class were included as long as all students received the intervention at approximately the same time.
Coding Procedures
The purpose of this review was to synthesize research findings across studies to identify interventions likely to be effective for improving social outcomes for kindergarten students. A coding protocol was developed to capture the relevant information from the 26 studies that were identified for review. Qualtrics online survey software (www.qualtrics.com) was used to automatically store coder responses that were later exported into an Excel spreadsheet for analysis. The protocol grouped study information into seven categories: (a) study identification information, (b) participant characteristics, (c) independent variable, (d) dependent variable, (e) research design, (f) quality of evidence, and (g) strength of evidence. These categories allowed the researchers to analyze the characteristics of each study in order to recommend conditions under which the studied outcomes might be achieved.
Study Identification Information
The study identification information included the names of the author(s), the year of publication, the type of publication (e.g., journal article, dissertation, thesis, report, etc.), the name of the journal and whether it was peer reviewed, the geographical location of the study, and the type of school setting in which the study took place (e.g., general education or special education, public school or private school). This information was intended to establish broad demographic characteristics of the studies’ settings and publication sources.
Participant Characteristics
Coders recorded the demographic characteristics of the participants, including age, grade, socioeconomic status (SES), gender, and race/ethnicity, in addition to number and selection criteria of participants. For group studies, the averages and ranges were recorded. For single-subject studies the characteristics were recorded per individual participant. These data provide a detailed understanding of the population from which any meaningful findings may be generalized.
Independent Variable
Within the scope of classwide social interventions, several different programs or approaches have been reported in the research literature. The relevant details recorded in this section included the name of the intervention (e.g., Zippy’s Friends), the length of the intervention from start to finish, the number of sessions, the duration of sessions, the identity of the interventionist (e.g., teacher, researcher, etc.), and the components of the intervention (e.g., reinforcement contingencies, parent training, etc.), along with any skills included as part of the intervention.
Dependent Variable
Although each of the studies included in this review addressed a social–behavioral program for kindergarten students, what the researchers measured varied across studies. To enable comparisons across studies, important features of the dependent variable were identified, including what was measured (e.g., skill acquisition, antisocial behavior), how the dependent variable was measured (e.g., direct observation, rating scales, self-report), which specific measurement tools were used (e.g., frequency count, Social Skills Improvement System), and how reliable and valid those measurement tools had been.
Design
Each study was categorized according to features of the research design so that comparisons across and within designs could be completed. Aspects included the type of study (single-subject or large N), the unit of analysis (individual or group), and the specific type of design (e.g., multiple baseline across participants, quasi-experimental).
Quality of Evidence
To determine the interpretability of each study and of the literature generally, the quality of the evidence was assessed using the Evaluative Method for Determining Evidence-Based Practices in Autism (Reichow, Doehring, Cicchetti, & Volkmar, 2011). The evaluative method was originally designed to assess interventions for young children with autism to determine which treatments could be considered evidence-based practices (EBPs). Following the example of the evidence-based medicine movement (e.g., Sackett & Rosenberg, 1996), Reichow et al. (2011) wanted to find a tool that would allow them to establish which practices in the field of autism intervention ought to be considered EBPs. However an examination of the existing tools led them to conclude that none of the tools was adequate. In response, Reichow (2011) created a grading scheme to evaluate the quality and quantity of evidence supporting various treatments. The scheme consists of three instruments: rubrics for scoring each study, guidelines for establishing the strength of studies, and criteria for determining which practices should be considered EBPs. For the purposes of this review, we used the rubrics and guidelines for establishing the strength of studies.
Reichow et al. (2011) created two parallel rubrics for scoring individual studies, one for large-N designs and one for single-subject designs. Where useful, they adopted existing methods for determining methodological quality and augmented them as necessary. For both single-subject and large-N studies, Reichow identified primary and secondary quality indicators. Primary indicators are those that are critical to the strength of the study (e.g., description of participants and independent variables), whereas secondary indicators are helpful but not essential elements (e.g., social validity and generalization measures). The specific items among the primary quality indicators were scored on a 3-point scale as high (H), acceptable (A), or unacceptable (U) quality. The secondary quality indicators were scored on a dichotomous yes or no scale, indicating their presence or absence. The evaluative method yields an overall grade for each study on a 3-point scale, with rankings of strong (S), adequate (A), or weak (W) quality. Studies were rated as strong if all primary quality indicators were ranked as high and at least three or four secondary quality indicators were present for single-subject and group studies, respectively. They were considered adequate if four or more primary indicators were scored as high, none was scored as unacceptable, and at least two secondary indicators were in place for both single-subject and group studies. Studies were weak if fewer than four primary indicators were scored as less than high or fewer than two secondary indicators were involved. As recommended by Reichow (2011), separate scoring sheets were created for single-subject studies and large-N studies.
The evaluative method was selected for this review because it is a tool that yields valid and reliable scores for identifying the quality of experimental research (Cicchetti, 2011). It uses parallel sets of criteria across group design and single-subject studies, providing a straightforward way to compare the quality of the two design types. Although it was designed for evaluating the quality of studies addressing individuals with autism spectrum disorder, the majority of the specific quality indicators are defined broadly enough that they can be applied to other populations. The exceptions include participant characteristics related to disability status and social validity indicators related to comparing individuals with disabilities to those without disabilities. These indicators could be marked as not relevant and they would not be considered in the final analysis of study quality.
Reichow, Volkmar, and Cicchetti (2008) conducted a field trial to evaluate the reliability and validity of the evaluative method. They randomly coded 18 studies from a pool of 124 studies. Two raters then coded each study independently. Using observed agreement and kappa, the interrater reliability ranged from .60 to 1.00, suggesting good interrater reliability. Reichow et al. (2008) also evaluated the content validity, face validity, and concurrent validity of the evaluative method by comparing the operational definitions used in the evaluative method to existing standards and comparing the scores from novice raters to those of expert raters. The evaluative method demonstrated good to excellent (.60–1.00) validity across all evaluations (Reichow et al., 2008). Finally, Reichow et al. (2011) used the evaluative method to compile a number of treatment reviews on topics from communication skills to problem behavior that demonstrate how the evaluative method can be used to evaluate EPBs. For a complete description of the evaluative method, including evaluations of reliability, validity, and accuracy, see Reichow et al. (2011).
Single-subject scoring
The scoring for single-subject studies was based on primary quality indicators, including (a) participant characteristics, (b) independent variable, (c) dependent variable, (d) baseline condition, (e) visual analysis, and (f) experimental control. Secondary indicators included (a) interobserver agreement, (b) kappa scores, (c) blind raters, (d) fidelity, (e) generalization or maintenance, and (f) social validity.
Large-N scoring
The scoring for the large-N studies considered primary indicators, which included (a) participant characteristics, (b) independent variable, (c) dependent variable, (d) comparison condition, (e) link between research question and data analysis, and (f) statistical analysis. Secondary indicators recorded (a) random assignment, (b) interobserver agreement, (c) blind raters, (d) fidelity, (e) attrition, (f) generalization or maintenance, (g) effect size, and (h) social validity.
Strength of Evidence
Both single-subject and group design studies were included in this review, yet the methods for assessing the size and significance of an effect have been different across the two research approaches. At present, no method has been established for comparing effect sizes of single-subject and group design research. Consequently, the quantitative analyses are presented separately in this review; each is consistent with the accepted methods of analysis for that approach.
Single-subject design studies
Consistent with commonly accepted practices in single-subject research, visual analysis was used as to assess whether or not a meaningful change in the behavior occurred and the extent to which the change was the effect of the intervention (Cooper, Heron, & Heward, 2007). Results were analyzed in terms of the number of effects demonstrated in the graphic representation of the data. An effect was defined as a noticeable change in level, trend, data variability, overlap, and consistency, or some combination of the five, in a therapeutic direction at or near the introduction or removal of the independent variable (Kratochwill & Levin, 2014).
A supplemental quantitative analysis was conducted to estimate the effect size in each study. The researchers used Tau-U, an effect size metric that controls for trend in baseline, has good statistical power, and is appropriate for small data sets (Parker, Vannest, Davis, & Sauber, 2011). For this analysis, data were extracted from the primary source graphs using GraphClick (Neuchatel, 2008), demonstrated to yield valid inferences for data extraction (Boyle, Samaha, Rodewald, & Hoffmann, 2013). The data were entered into the online Tau-U calculator at singlecaseresearch.org. Each baseline phase was compared with the adjacent treatment phases for that data set. For example, in an ABAB design graph, A1 was compared with B1 and A2 was compared with B2. In a multiple baseline across participants graph, each baseline phase was compared with the treatment phase immediately following. Comparisons were controlled for baseline trend and aggregated across contrasts to yield a weighted average Tau-U score for each relevant dependent variable. Although the guidelines for interpreting Tau-U scores are not well developed, examining scores on the same dependent variable across studies may provide a useful supplementary comparison for assessing relative magnitude of effect. The first author, then a doctoral student in special education, initially conducted both the visual analyses and the Tau-U calculations. Subsequently, these results were submitted to the other two coders (also doctoral students in special education) for review, and any disagreements regarding the visual analysis for determining the number of demonstrations of an effect were resolved by discussion until a consensus was achieved.
Group design studies
To evaluate the strength of outcomes among group design studies, two metrics were considered: the statistical significance and p value, and the effect size. Measures of statistical significance were extracted from the studies during the coding process. Measures of effect size were calculated based on posttest treatment–comparison group scores. Effect sizes were calculated using the effect size calculator available on the Campbell Collaboration website (www.campbellcollaboration.org), which is based on recommendations from Lipsey and Wilson (2000). Also consistent with Lipsey and Wilson’s (2000) suggestions, the researchers controlled for preexisting differences between control and treatment groups by subtracting pretest effect sizes from posttest effect sizes for all quasi-experiments.
To facilitate comparisons across group design and single-subject studies, effects were described as small, medium, or large based on existing guidelines for interpreting Cohen’s d and Tau-U estimates. Cohen (2013) reluctantly suggested interpreting a d effect of 0.20 to 0.49 as small, 0.50 to 0.79 as medium, and 0.80 or greater as large, though he does not recommend universally applying these benchmarks. In the absence of recommendations from Parker et al. (2011), Rakap (2015) recommend interpreting Tau-U effect size estimates of less than 0.65 as small, 0.66 to 0.92 as medium, and greater than 0.92 as large.
Interrater Reliability
Three raters were selected from a group of doctoral students in special education. All raters had completed a semester-long course on writing systematic reviews and completed at least one systematic review prior to participating in this review. Additionally, raters completed course work on visual analysis of graphs representing single-subject design. After training on how to use the protocols, each rater completed a practice protocol prior to coding studies for this review. Additionally, 35% (n = 9) of the studies were selected via an Excel random number function and double coded to assess interrater reliability. One of the three raters conducted the visual analysis and computed the Tau-U scores for all single-subject studies. The results of these analyses were submitted to the other two raters for comment, and any disagreements were resolved by a discussion until consensus was achieved.
Nine studies (35%) were double coded to determine an interobserver agreement index. Mean interobserver agreement on the characteristics components of the protocol (i.e., participants, independent variable, dependent variable, and design) was 95% (range 87% to 97%). The interrater agreement for the quality of evidence components of the protocol was calculated separately to ensure that high agreement on other components of the protocol did not obscure low levels of agreement on the quality indicators. On the quality of evidence components, mean agreement was 94% (range 89% to 100%).
Results
Study Features
Just over one third (n = 9) of the 26 studies had been published as dissertations, which undergo different processes for approval than studies published in peer-reviewed journals. For five of the interventions (i.e., Strong Start, Stop and Think, First Friends, and Duck Duck Tootle), the only studies that met criteria for inclusion were dissertations. Additionally, three of the four studies that evaluated the Second Step intervention were dissertations.
The majority of the studies included in this review used large-N group research designs (n = 20), and of those studies 30% (n = 6) used a true experimental design, whereas the remaining 70% (n = 14) used a quasi-experimental design. For all group design studies, the individual was the unit of analysis, though most often individuals were assigned to treatment or control conditions by class rather than individually. Six studies in this review used single-subject research designs. In four of these studies, researchers assessed the Good Behavior Game, and in one study Shelton-Quinn (2009) assessed the effect of Duck, Duck, Tootle, and in another, Conklin (2010) assessed the effect of classwide function-related intervention (CW-FIT). In all of these studies except Shelton-Quinn (2009), the group was the unit of analysis, and in every case, the group consisted of a classroom of kindergarten students.
The general features of each study were coded to identify the setting, sample, and demographic characteristics in order to represent the conditions under which researchers implemented these interventions (see Table 1). The conditions resulting in success should be considered when kindergarten teachers are deciding if an intervention is appropriate for their context, including the racial/ethnic and SES of students as well as the available time and resources for intervention.
General study characteristics of classwide kindergarten social-behavioral studies
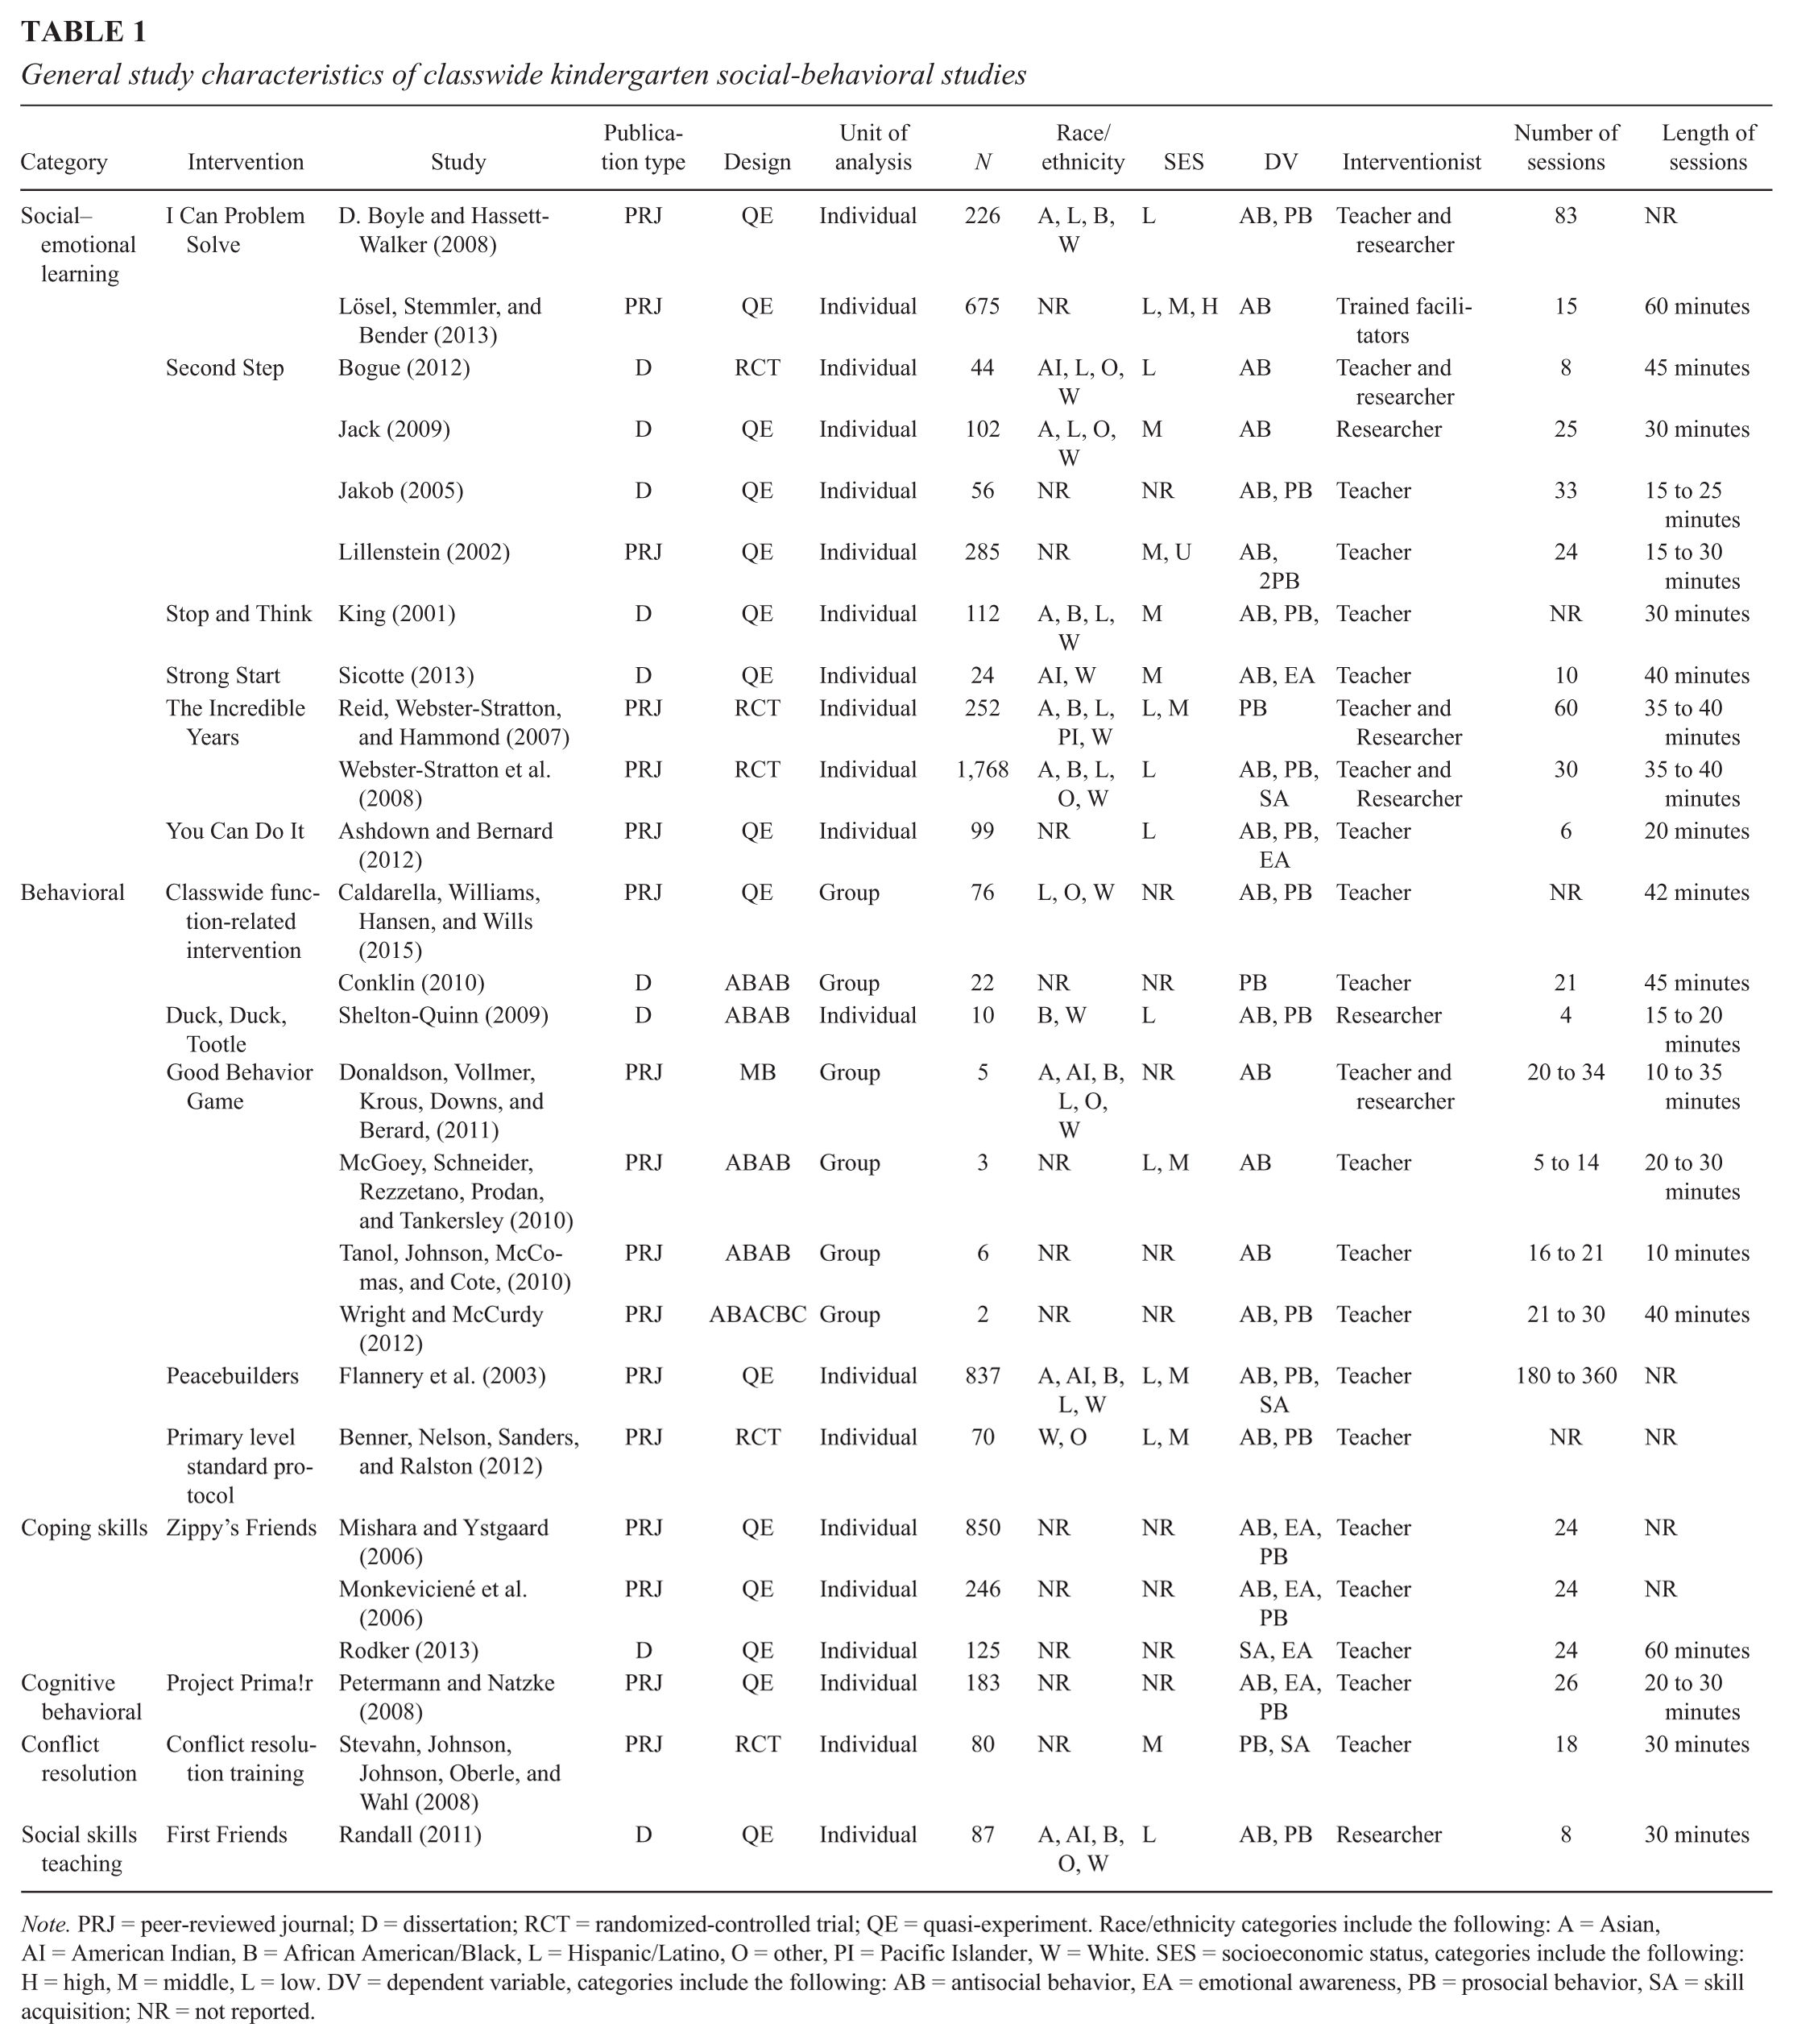
Note. PRJ = peer-reviewed journal; D = dissertation; RCT = randomized-controlled trial; QE = quasi-experiment. Race/ethnicity categories include the following: A = Asian, AI = American Indian, B = African American/Black, L = Hispanic/Latino, O = other, PI = Pacific Islander, W = White. SES = socioeconomic status, categories include the following: H = high, M = middle, L = low. DV = dependent variable, categories include the following: AB = antisocial behavior, EA = emotional awareness, PB = prosocial behavior, SA = skill acquisition; NR = not reported.
Participant Characteristics
All together the studies in this review included 6,245 participants, 51% of whom were male. In almost half (n = 12) of the studies, researchers did not report the race or ethnicity of the participants. European American children were included in all of the studies in which researchers reported the race/ethnicity of participants. Black/African American and Hispanic/Latino children were included in 69% of studies, Asians in 62%, and American Indians in 38%. In 16 (64%) of the studies, researchers reported the SES of the participants. In 11 (44%) of the studies, participants in low SES circumstances were included, and in nine studies (36%), participants in middle SES circumstances were included; participants in high SES families were included in only one study (4%).
In seven studies, the researchers included participants that were not in kindergarten and the kindergarten data could not be extracted from the complete data set (Benner et al., 2012; D. Boyle & Hassett-Walker, 2008; Caldarella et al., 2015; Flannery et al., 2003; Monkeviciené et al., 2006; Petermann & Natzke, 2008; Webster-Stratton et al., 2008). In these cases, the data set that included the kindergarten students was analyzed.
Independent Variables
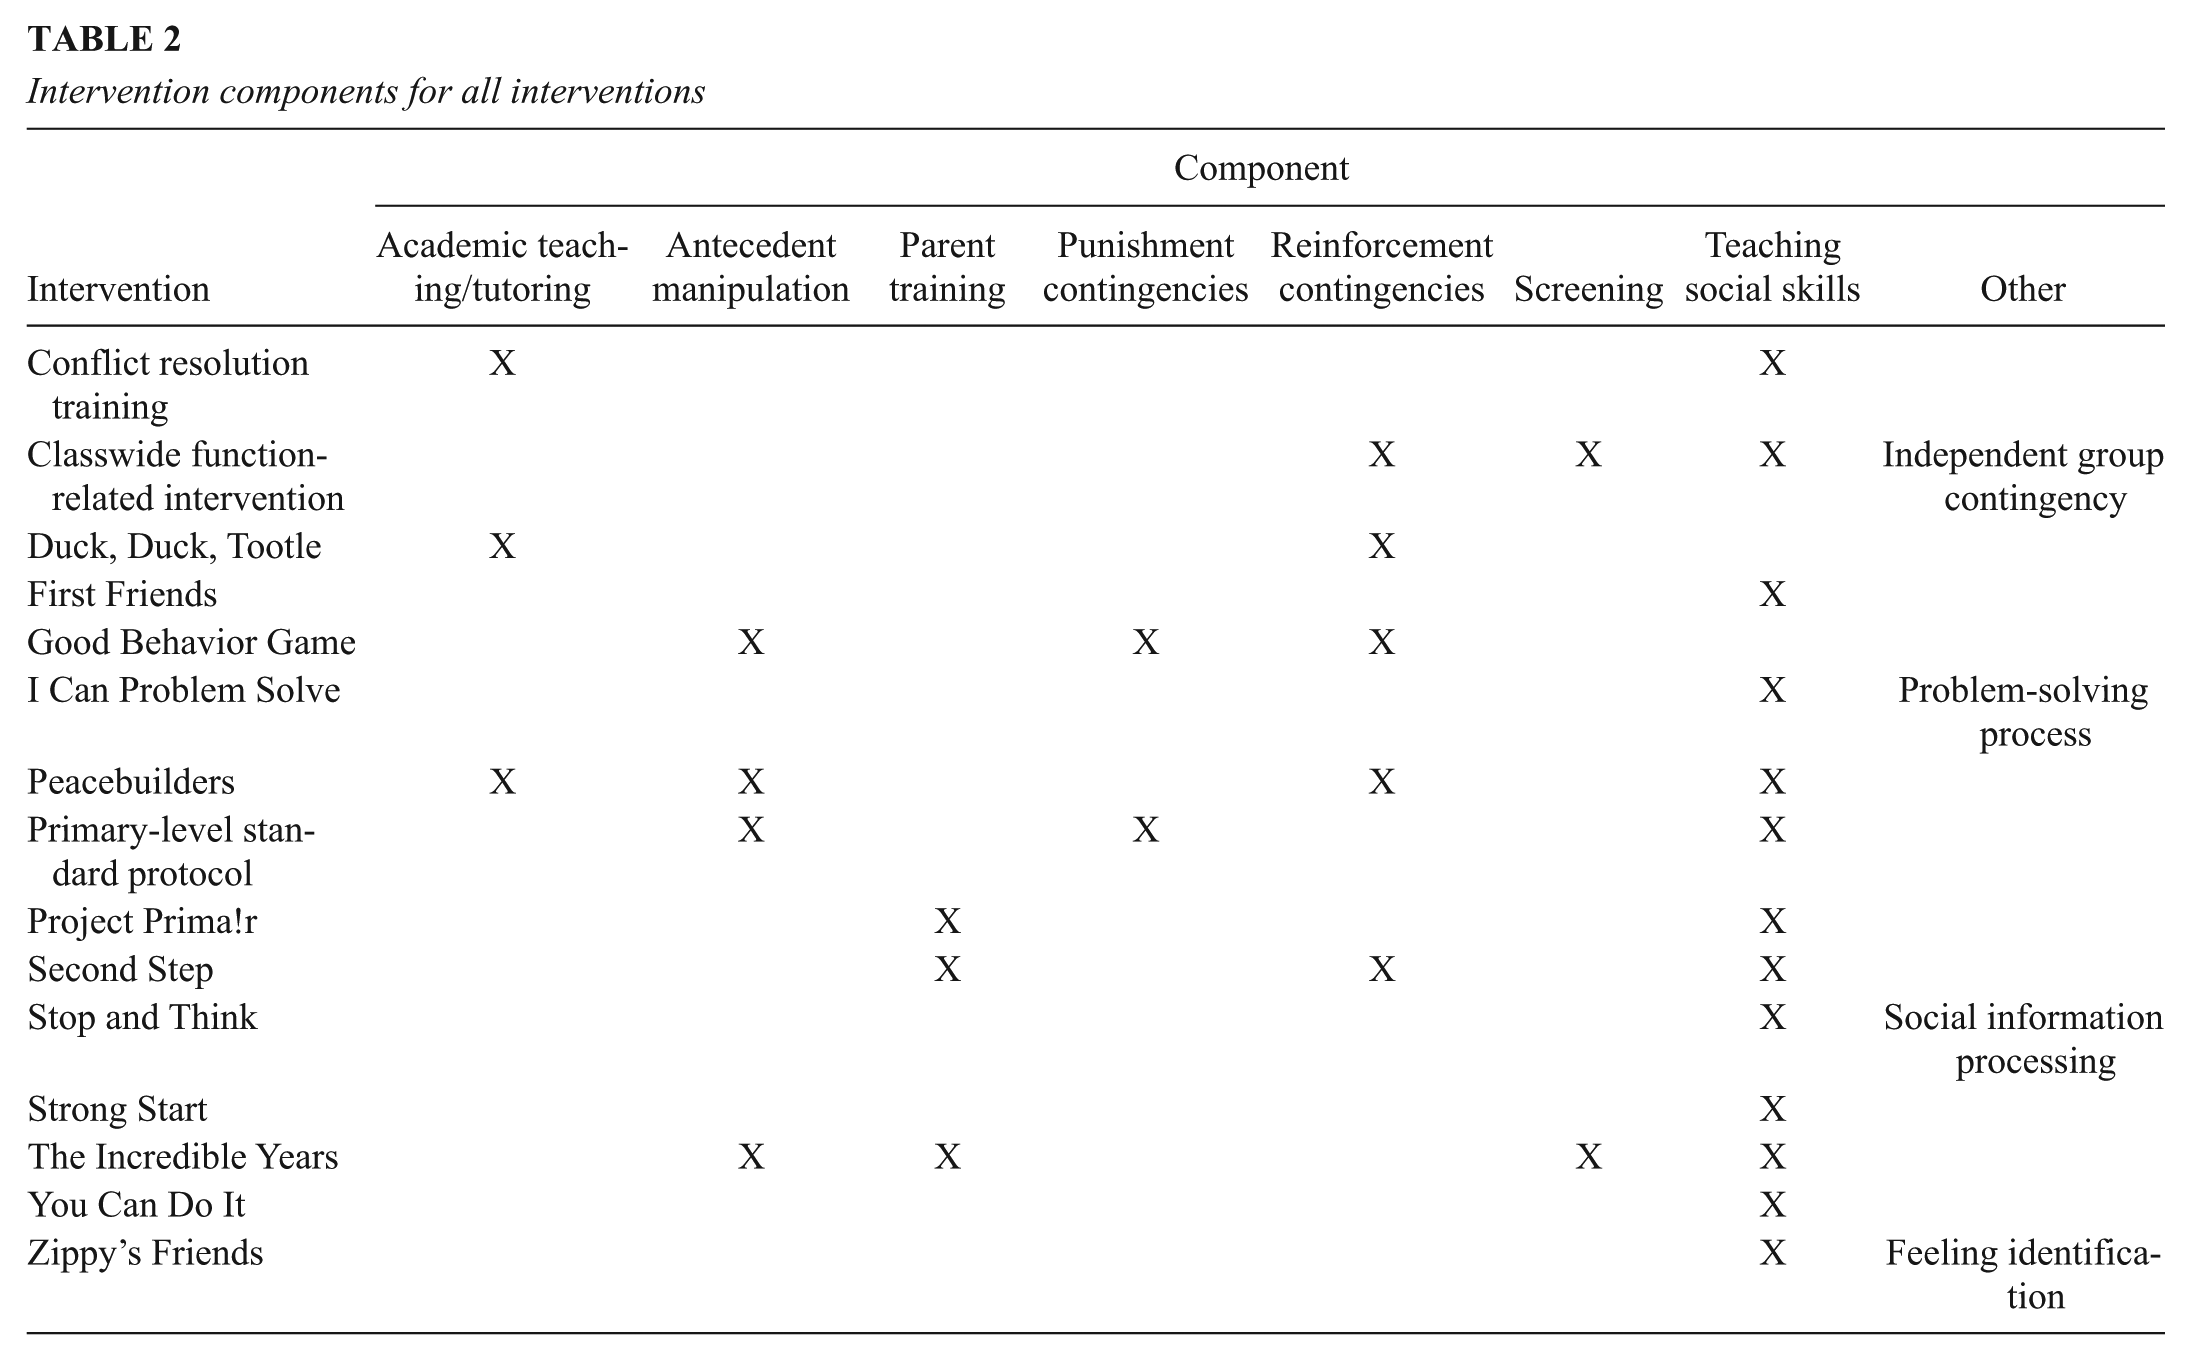
The inclusion criteria for this review limited studies to those addressing social, emotional, or behavioral outcomes for kindergarten students using a classwide intervention implemented in a school setting. The 15 different intervention programs found were grouped into four major categories: social–emotional learning (SEL), behavioral approaches, coping skills, and other. A summary of intervention components is provided in Table 2. The components identified in Table 2 demonstrate that there is some overlap between the four categories of intervention. However, the causal explanation for the effect of the various interventions (e.g., contingency management vs. social competency), described hereafter, warranted placing interventions with similar components into different intervention categories.
Intervention components for all interventions
Social–emotional learning
SEL interventions are based on the premise that mastering certain social and emotional competencies leads to certain positive student outcomes including improved relationships, emotional regulation, goal achievement, and responsible decision making (CASEL, n.d.-b). These SEL competencies include self-management, self-awareness, responsible decision making, relationship skills, and social awareness (CASEL, n.d.-a). In 11 studies (42%), researchers addressed SEL using six (40%) of the interventions: I Can Problem Solve, Second Step, Stop and Think, Strong Start, The Incredible Years, and You Can Do It). All of these interventions were also identified as social–emotional curricula by the Collaborative for Academic, Social, and Emotional Learning (see casel.org; Ashdown & Bernard, 2012; Bogue, 2012; D. Boyle & Hassett-Walker, 2008; Jack, 2009; Jakob, 2005; King, 2001; Lillenstein, 2002; Lösel et al., 2013; Reid et al., 2007; Sicotte, 2013; Webster-Stratton et al., 2008).
A teacher served as the primary interventionist in 5 of these 11 studies (Ashdown & Bernard, 2012; Jakob, 2005; King, 2001; Lillenstein, 2002; Sicotte, 2013), whereas a teacher and researcher served together as the interventionists in four others (Bogue, 2012; D. Boyle & Hassett-Walker, 2008; Reid et al., 2007; Webster-Stratton et al., 2008). A researcher or another person not typically present in a school (e.g., trained facilitator) served as the interventionist in two studies (Jack, 2009; Lösel et al., 2013). The number of sessions ranged from 6 to 83 (M = 29), and the length of sessions ranged from 15 to 60 minutes (M = 36 minutes).
Behavioral approaches
The category with behavioral components included interventions focused on basic principles of behavior management: reinforcing, punishing, prompting, and manipulating antecedent stimuli. Researchers focused on a behavioral approach in nine studies (Benner et al., 2012; Caldarella et al., 2015; Conklin, 2010; Donaldson et al., 2011; Flannery et al., 2003; McGoey et al., 2010; Shelton-Quinn, 2009; Tanol et al., 2010; Wright & McCurdy, 2012) using five different interventions (CW-FIT, Duck Duck Tootle, Good Behavior Game, Peacebuilders, and Primary-Level Standard Protocol).
In seven of the nine studies, a teacher served as the primary interventionist (Benner et al., 2012; Caldarella et al., 2015; Conklin, 2010; Flannery et al., 2003; McGoey et al., 2010; Tanol et al., 2010; Wright & McCurdy, 2012). The teacher and researcher worked together to deliver the intervention in one study (Donaldson et al., 2011), and the researcher was the primary interventionist in another (Shelton-Quinn, 2009). The number of intervention sessions reported among these studies ranged from 4 to 360. The mean number of sessions was 21, with Flannery et al. (2003) removed because their 360 sessions totaled far more than any other study. Benner et al. (2012) did not report the number of sessions because the intervention occurred on a per-opportunity basis. Caldarella et al. (2015) also did not report the number of sessions. Across the nine studies, the session length ranged from 10 to 45 minutes (M = 29.6 minutes per session).
Coping skills
The only intervention represented in this category was Zippy’s Friends, which is available through the Partnership for Children (2015; http://www.partnershipforchildren.org.uk/). The basis for teaching coping skills is that all children encounter challenges, and the extent to which children can successfully navigate those challenges will considerably influence their mental health and social success. With Zippy’s Friends, teachers use cartoon characters to teach lessons, which they present following eight principles: (a) children choose their own solutions, (b) positive skills are reinforced, (c) repetition and continuity are essential to learning, (d) abilities are developed in different settings, (e) children participate, (f) children help each other, (g) children evaluate their own success, and (h) teachers are open to listening to children (“Principles of Development,” 2015). In the three studies that focused on Zippy’s Friends (Mishara & Ystgaard, 2006; Monkeviciené et al., 2006; Rodker, 2013), a teacher was the primary interventionist, and 24 treatment sessions were held. Only Rodker reported the time per session (60 minutes).
Other
The “other” category included three interventions that did not share strong conceptual links to the SEL, behavioral approaches, or coping categories. These interventions are not conceptually linked to each other.
Project Prima!r. Petermann and Natzke (2008) examined the effect of Project Prima!r, which was implemented in Luxembourg under the direction of the Secretary of Education in conjunction with the German University of Bremen. The information available describing Project Prima!r is mostly in other languages (e.g., French). The intervention, based on cognitive behavioral principles, consisted of training teachers in classroom management, crisis management, and social skills teaching in their classroom (Petermann & Natzke, 2008). Teachers were the primary interventionists in this study, which included 26 sessions of 20 to 30 minutes per session.
Conflict resolution training. Stevahn et al. (2000) focused on integrating conflict resolution into lessons on friendship. The training consisted of helping participants identify conflicts and employ a six-step interrogative negotiation process based on Johnson and Johnson’s (1996) The Peacemakers Program. Negotiation skills are embedded in a variety of activities such as reading books, watching models, and rehearsing the trained behaviors. Teachers implemented the intervention, which consisted of 18 sessions, each lasting 30 minutes.
First Friends. First Friends is an unpublished social skills program. Randall (2011) provided limited information about the program, including its theoretical orientation. The procedures for teaching social skills begin with a group activity that orients the participants to the topic for that lesson (e.g., empathy). This group session is followed by any number of activities, such as reading a book, drawing a picture, having a discussion, and so on, which are meant to improve participants’ understanding of topic for that day. The instructor reiterates the point of the lesson during the concluding session. Researchers implemented this intervention, which consisted of eight 30-minute sessions.
Dependent Variables
The purpose of this review was to assess the effect of a variety of interventions on the social, emotional, and behavioral performance of kindergarten students. The relevant dependent variables were grouped into four major categories: antisocial behavior, prosocial behavior, skill acquisition, and emotional awareness. Antisocial behavior included any measure of undesirable behavior, including direct observation of well-defined behaviors like being off task or physical aggression, as well as questionnaires focused on respondents’ perceptions of children in areas such as impulsivity and bullying. Prosocial behavior was any measure of desirable behavior. Like antisocial behavior, the prosocial variable was measured using a combination of direct observation and questionnaires. Skill acquisition was any measure of the occurrence of specific skills taught as part of an intervention. One way researchers measured this variable was to present children with social scenarios and identify the extent to which responses were consistent with newly taught skills. Another measurement consisted of observing children in either analog or authentic social situations and recording whether they engaged in the behaviors that had been taught. Emotional awareness was any measure of a participant’s ability to identify the internal status of self or others. To measure this variable, children were most often asked to identify a particular emotional state portrayed in a vignette or presented in a questionnaire.
Antisocial behavior was the most commonly reported dependent variable: 22 of the 26 studies (85%) reporting some measure of antisocial behavior. The average Tau-U effect size estimate for antisocial behavior was medium (Tau-U = 0.91), and the average Cohen’s d effect size estimate was small (d = 0.38). Prosocial behavior was the next most commonly reported variable, included in 16 (62%) of the studies. Prosocial behavior showed a large average Tau-U effect size estimate (Tau-U = 0.98) and a medium average Cohen’s d effect size estimate (d = 0.72). Stevahn et al. (2000) was a clear outlier (d = 8.65) among studies evaluating prosocial outcomes; when this study was removed from the analysis, the average effect size dropped to a small (d = 0.29). Skill acquisition was measured in five studies (19%), with a large average Cohen’s d effect size estimate (d = 0.84). As with prosocial behavior, Stevahn et al. (2000) was an outlier (d = 3.50), and eliminating the results of this study from the analysis dropped the effect size dramatically (d = 0.32). Emotional awareness was measured in three studies (12%). The average Cohen’s d effect size estimate for this variable was an extremely small negative (d = −0.08).
Quality of Evidence
The quality of evidence was assessed using Reichow et al.’s (2011) evaluative method, which enables comparisons across single-subject and group design studies. The purpose of this analysis was to determine the degree of confidence that one might have in the findings reported by the various researchers. Each study was evaluated on primary and secondary quality indicators for an overall designation of strong, adequate, or weak evidence. These ratings are presented in Tables 3 and 4.
Quality indicators for single-subject studies
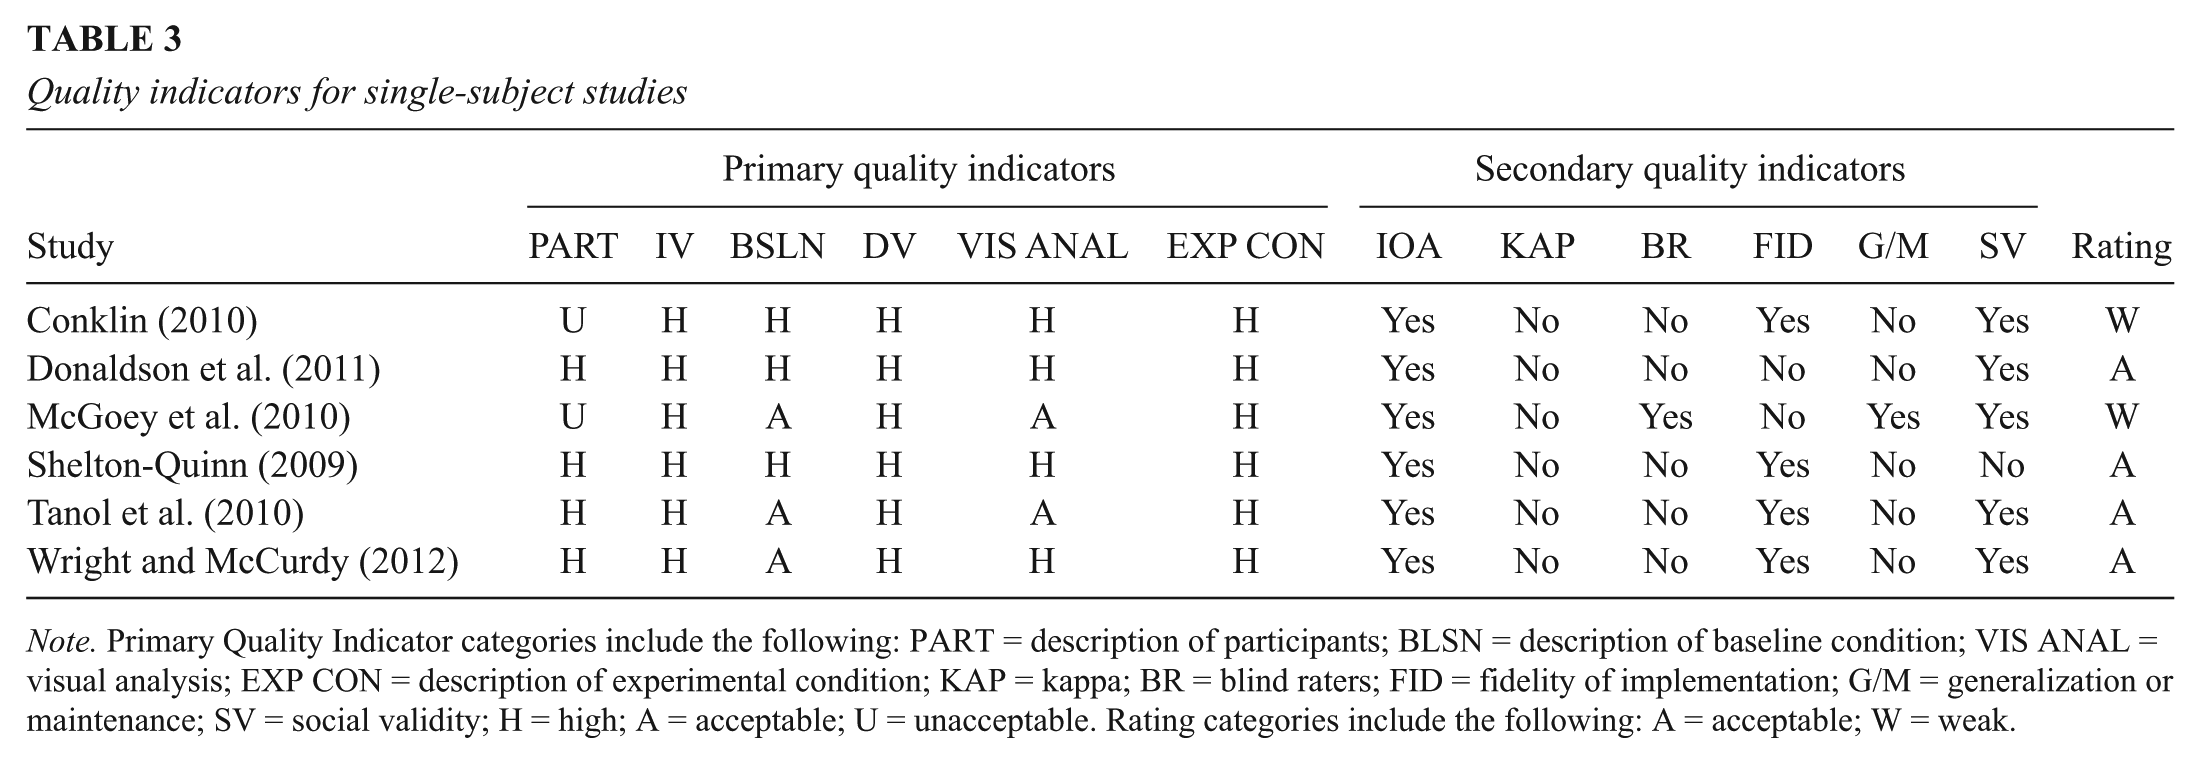
Note. Primary Quality Indicator categories include the following: PART = description of participants; BLSN = description of baseline condition; VIS ANAL = visual analysis; EXP CON = description of experimental condition; KAP = kappa; BR = blind raters; FID = fidelity of implementation; G/M = generalization or maintenance; SV = social validity; H = high; A = acceptable; U = unacceptable. Rating categories include the following: A = acceptable; W = weak.
Quality indicators for group design studies
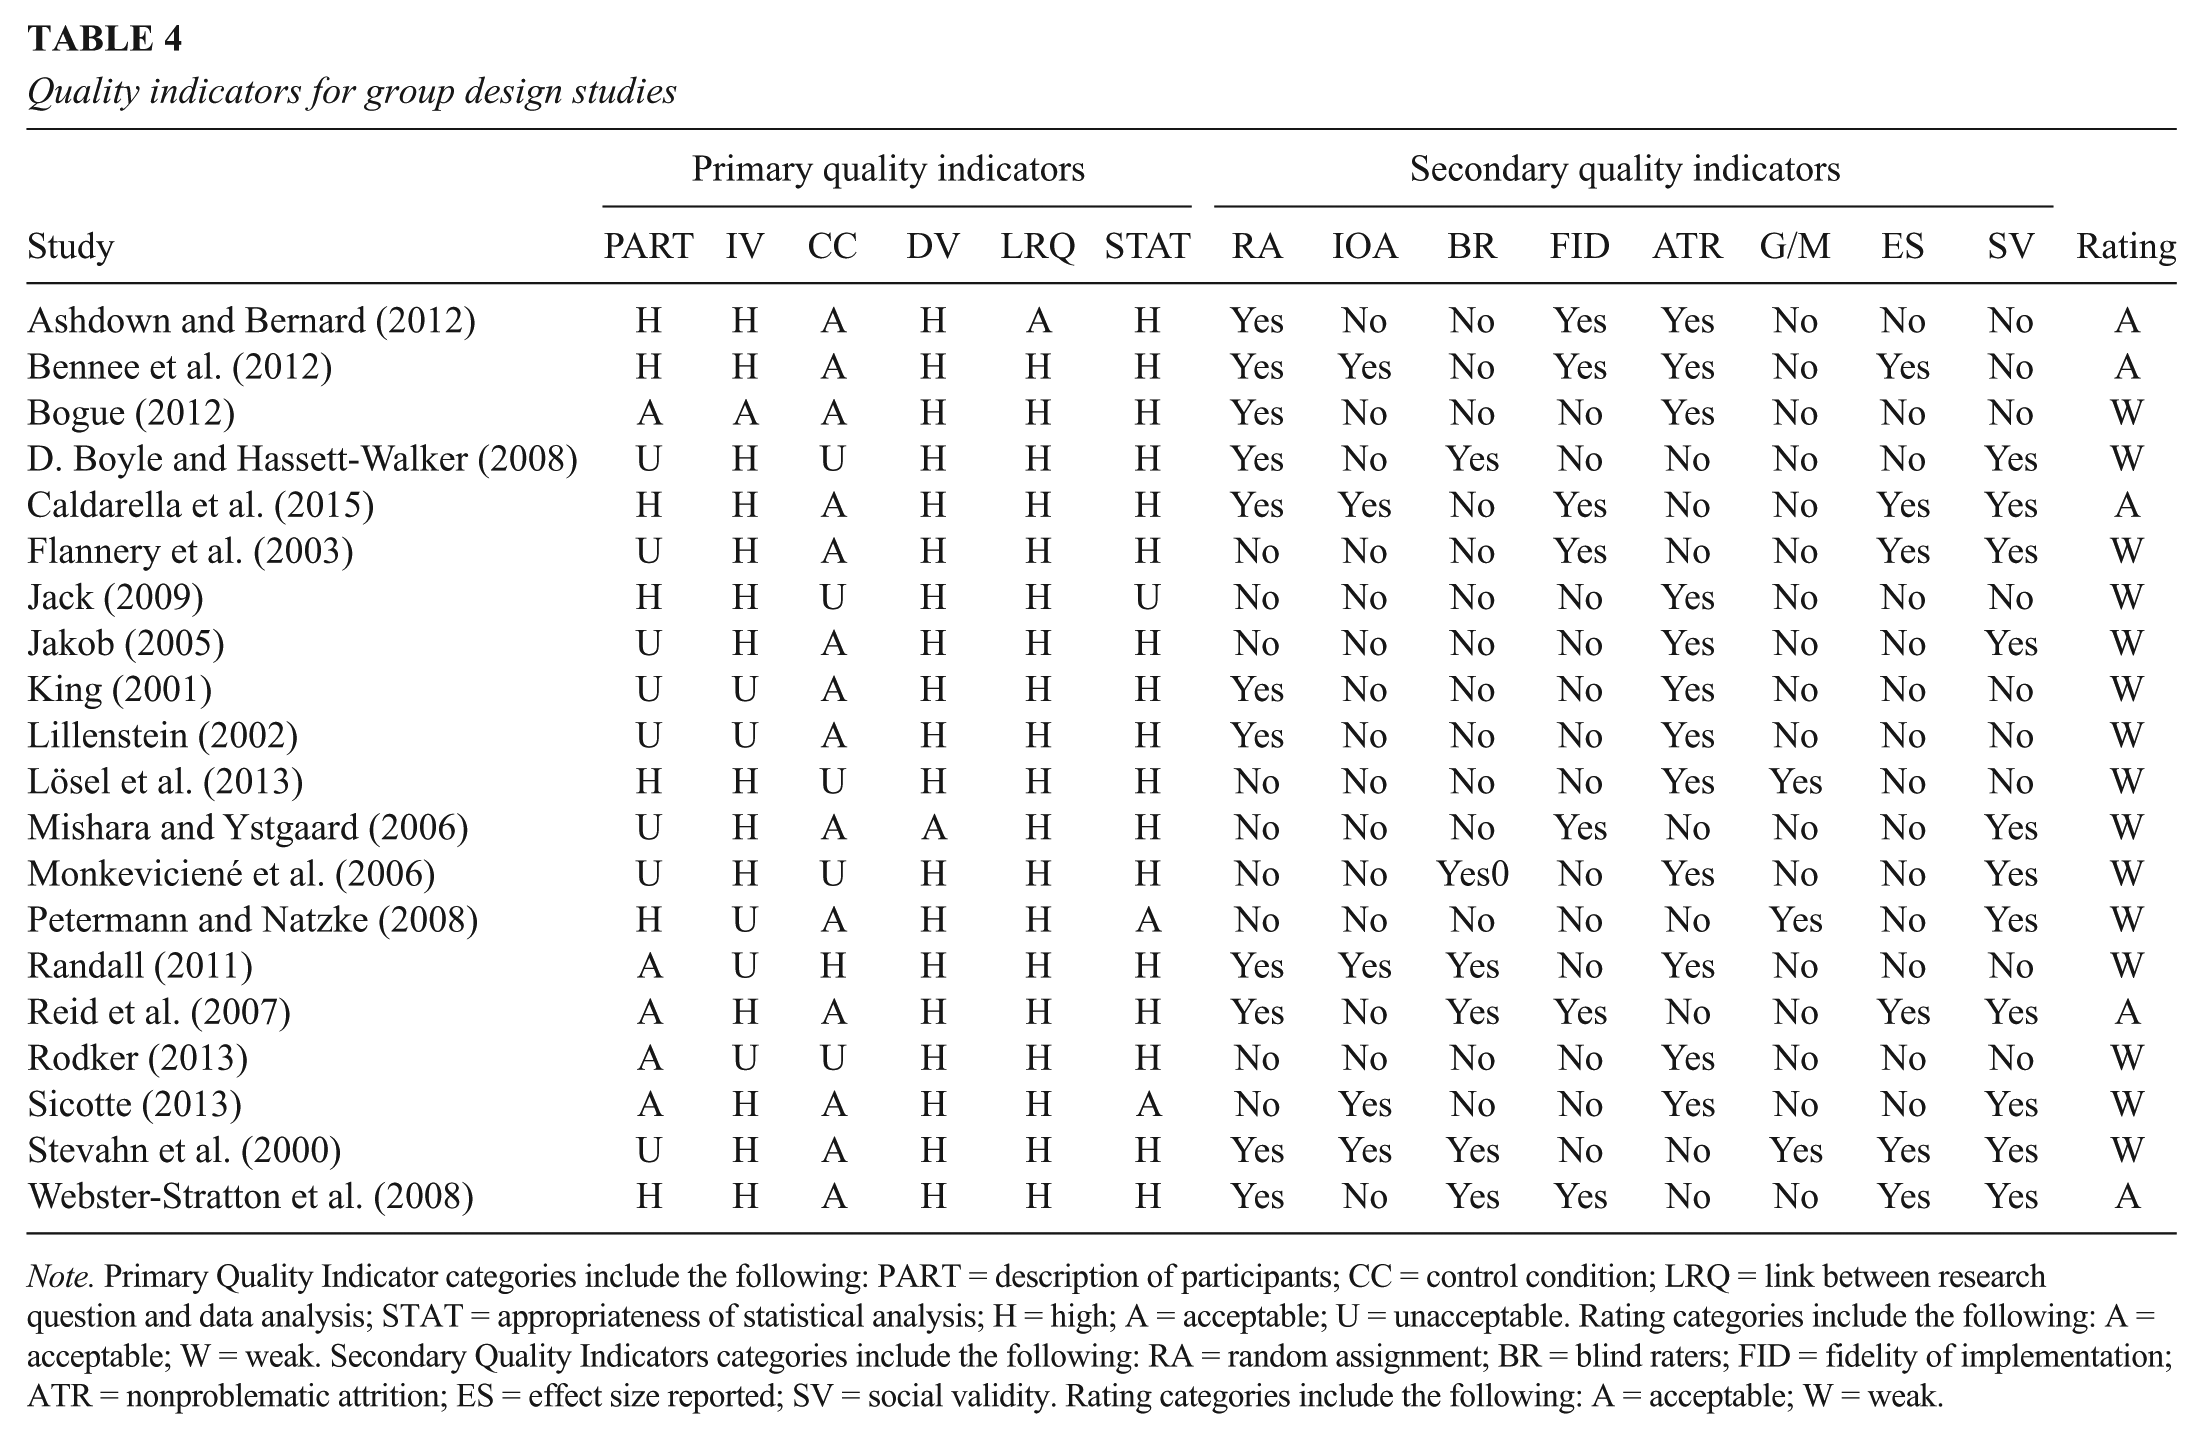
Note. Primary Quality Indicator categories include the following: PART = description of participants; CC = control condition; LRQ = link between research question and data analysis; STAT = appropriateness of statistical analysis; H = high; A = acceptable; U = unacceptable. Rating categories include the following: A = acceptable; W = weak. Secondary Quality Indicators categories include the following: RA = random assignment; BR = blind raters; FID = fidelity of implementation; ATR = nonproblematic attrition; ES = effect size reported; SV = social validity. Rating categories include the following: A = acceptable; W = weak.
Overall, the quality of evidence was low: None of the studies was rated strong, nine were rated adequate, and 17 were rated weak. Single-subject studies were stronger than group design studies, with 67% (n = 4) of single-subject studies rated adequate, and 25% (n = 5) of group studies rated adequate. The most common shortcoming among group studies for primary quality indicators was inadequate description of participants, with eight (40%) of the studies receiving an unacceptable rating. For single-subject studies, the most common shortcoming for primary quality indicators involved baseline conditions, rated adequate in only three (50%) of the studies.
For secondary quality indicators among group design studies, the most common shortcomings were the absence of generalization or maintenance data (n = 17, 85%), failure to report interobserver agreement (n = 15, 75%), and failure to report estimates of effect size (n = 14, 70%). The most common shortcomings for secondary quality indicators in single-subject studies were failure to report kappa scores for interobserver agreement (n = 6, 100%), absence of maintenance or generalization phases (n = 5, 83%), and lack of blinded raters (n = 5, 83%).
Strength of Evidence
An estimate of effect size was calculated for each of the relevant dependent variables in studies included in this review. A Tau-U calculation was performed for single-subject studies, and Cohen’s d was calculated for group studies, with the exception of Caldarella et al. (2015) who reported a Tau-U score within a group study. A summary of these calculations for each relevant dependent variable is presented in Tables 5 and 6. To simplify comparisons across dependent variables, all effect size data are presented as absolute values so that higher numbers equal greater effects, with the exception of counter-therapeutic effects, for which negative numbers have been retained. Additional discussion of the results of these calculations is presented below, organized by the quality of evidence and type of intervention.
Effect size estimation for single-subject studies
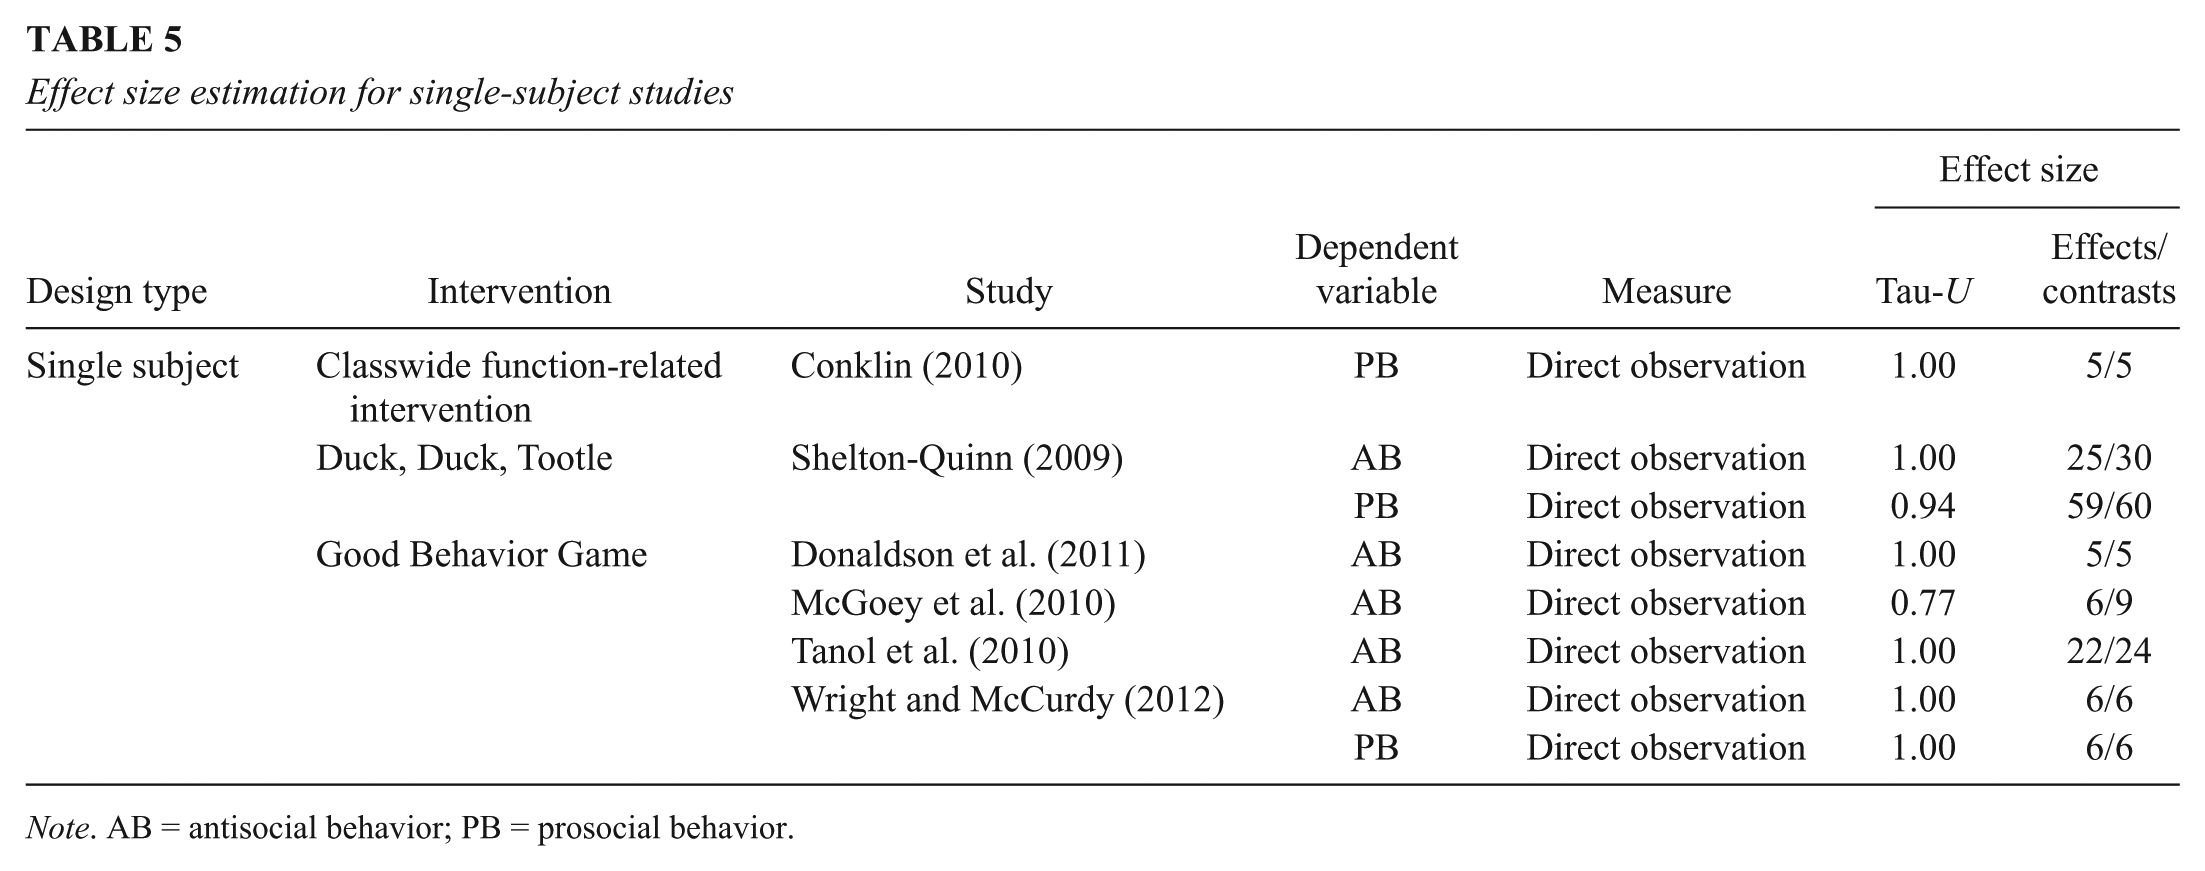
Note. AB = antisocial behavior; PB = prosocial behavior.
Effect size estimations for group design studies
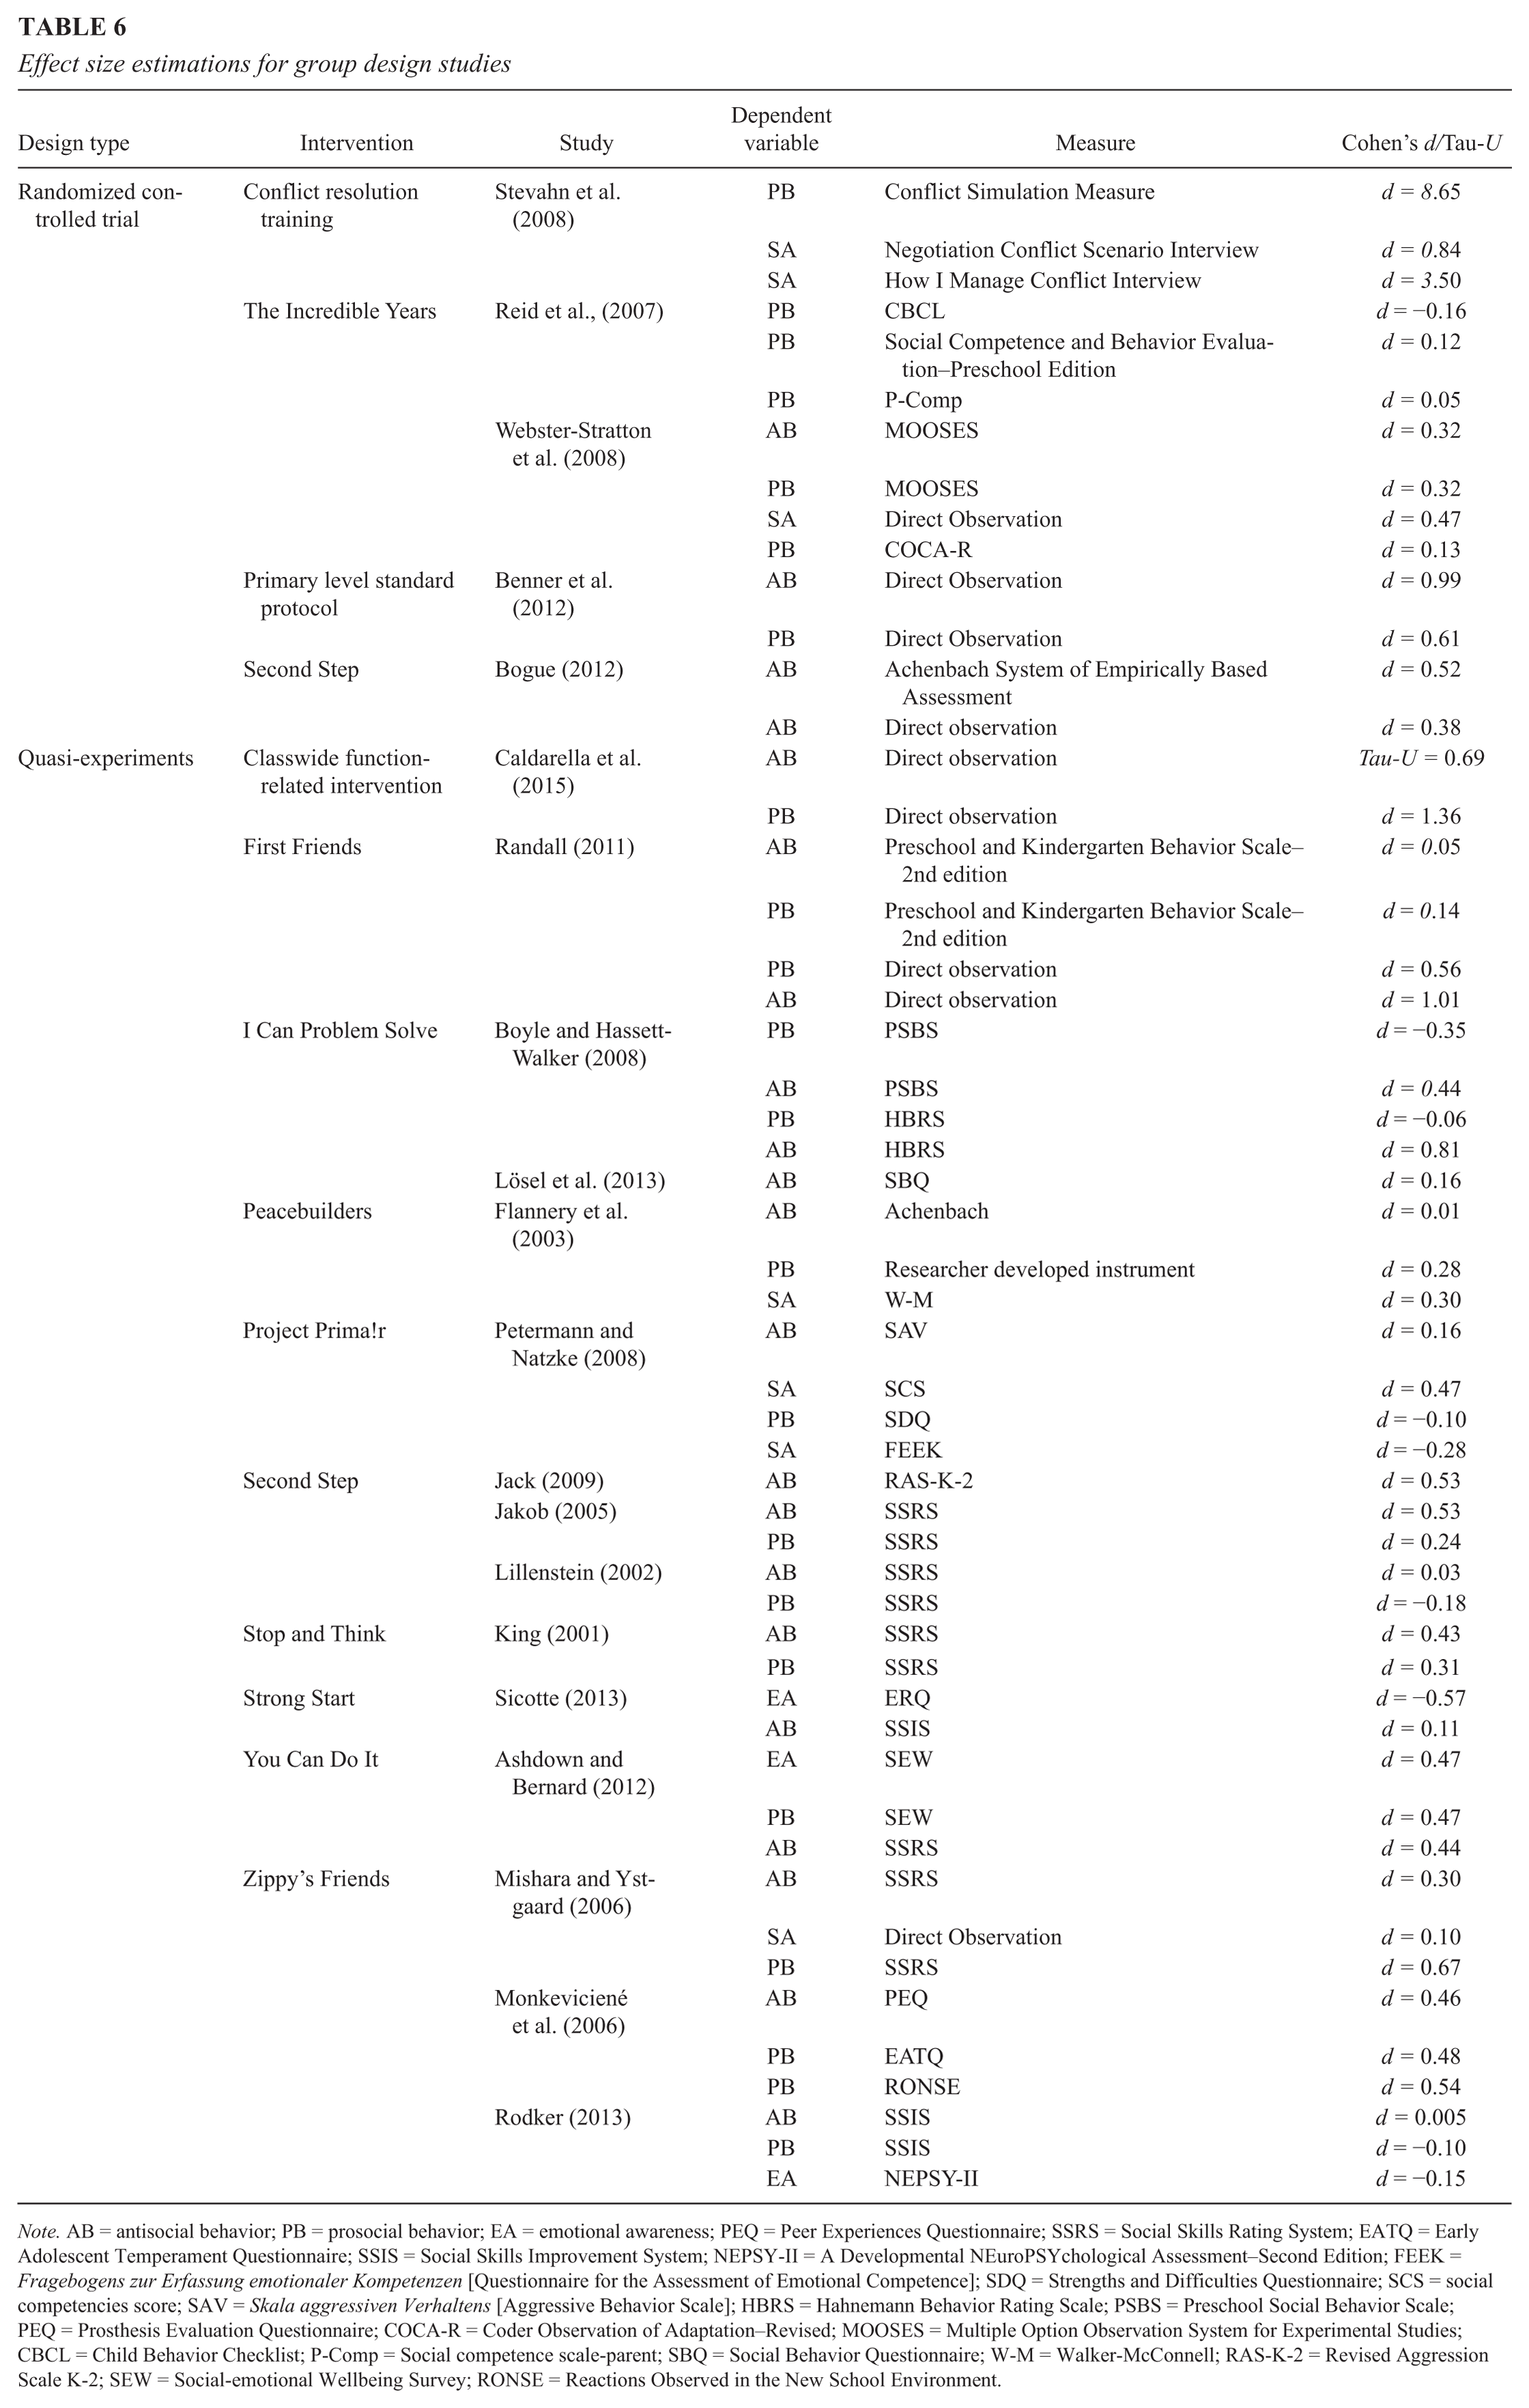
Note. AB = antisocial behavior; PB = prosocial behavior; EA = emotional awareness; PEQ = Peer Experiences Questionnaire; SSRS = Social Skills Rating System; EATQ = Early Adolescent Temperament Questionnaire; SSIS = Social Skills Improvement System; NEPSY-II = A Developmental NEuroPSYchological Assessment–Second Edition; FEEK = Fragebogens zur Erfassung emotionaler Kompetenzen [Questionnaire for the Assessment of Emotional Competence]; SDQ = Strengths and Difficulties Questionnaire; SCS = social competencies score; SAV = Skala aggressiven Verhaltens [Aggressive Behavior Scale]; HBRS = Hahnemann Behavior Rating Scale; PSBS = Preschool Social Behavior Scale; PEQ = Prosthesis Evaluation Questionnaire; COCA-R = Coder Observation of Adaptation–Revised; MOOSES = Multiple Option Observation System for Experimental Studies; CBCL = Child Behavior Checklist; P-Comp = Social competence scale-parent; SBQ = Social Behavior Questionnaire; W-M = Walker-McConnell; RAS-K-2 = Revised Aggression Scale K-2; SEW = Social-emotional Wellbeing Survey; RONSE = Reactions Observed in the New School Environment.
Adequate Quality
In nine studies (35%), researchers demonstrated sufficient methodological rigor to receive an adequate rating using the evaluative method (Ashdown & Bernard, 2012; Benner et al., 2012; Caldarella et al., 2015; Donaldson et al., 2011; Reid et al., 2007; Shelton-Quinn, 2009; Tanol et al., 2010; Webster-Stratton et al., 2008; Wright & McCurdy, 2012). These studies were in either the SEL or behavioral approaches category.
Three studies that received an adequate quality rating involved an SEL intervention (Ashdown & Bernard, 2012; Reid et al., 2007; Webster-Stratton et al., 2008). Overall, these studies resulted in small to medium effects on measures of antisocial behavior, prosocial behavior, skill acquisition, and emotional awareness. On measures of antisocial behavior, Webster-Stratton et al. (2008) produced a small effect (d = 0.32) using the Incredible Years intervention, and Ashdown and Bernard produced a medium effect (d = 0.44) using the You Can Do It curriculum. On measures of prosocial behavior, only Ashdown and Bernard (2012), using the You Can Do It curriculum, produced noteworthy outcomes (d = 0.44). In contrast, Reid et al. (2007), using the Incredible Years, produced no meaningful effect sizes (d = −0.16, 0.12, and 0.05) on three different measures of prosocial behavior, whereas Webster-Stratton et al. (2008) produced a small effect size and a noninterpretable effect (d = 0.32, 0.13) on two different measures of prosocial behavior. In addition, Webster-Stratton et al. (2008) produced medium effects on skill acquisition using The Incredible Years, and Ashdown and Bernard (2012) produced medium effects on measures of emotional awareness (d = 0.47) using the You Can Do It curriculum.
In six of the studies with adequate quality, researchers evaluated a behavioral approach to intervention (Benner et al., 2012; Caldarella et al., 2015; Donaldson et al., 2011; Shelton-Quinn, 2009; Tanol et al., 2010; Wright & McCurdy, 2012). Small to large positive effects were found on antisocial behavior regardless of the intervention (Tau-U values ranging from 0.69 to 1.00). These interventions also produced strong effects on the development of prosocial behaviors. Wright and McCurdy (2012) measured the effect of the Good Behavior Game on prosocial behavior, and they found a large positive effect (Tau-U = 1.00). Caldarella et al. (2015) measured the effect of CW-FIT on prosocial behavior and which produced a large positive effect (d = 1.36). Similarly, Shelton-Quinn produced a large effect on prosocial behavior (Tau-U = 0.94) using Duck, Duck, Tootle, and Benner et al. (2012) produced a medium effect (d = 0.61) on prosocial behavior using the Primary Level Standard Protocol.
Weak Quality
Based on the evaluative method, 17 studies (65%) were rated weak in quality of evidence. These studies showed mixed effects on antisocial and prosocial behavior, in contrast to the strong effects on these behaviors found in studies with adequate quality ratings. In eight of these studies, researchers used SEL interventions (Bogue, 2012; D. Boyle & Hassett-Walker, 2008; Jack, 2009; Jakob, 2005; King, 2001; Lillenstein, 2002; Lösel et al., 2013; Sicotte, 2013), producing effects ranging from d = 0.03 to d = 0.81 on measures of antisocial behavior. On measures of prosocial behavior, these studies showed effects ranging from small negative to small positive (range: d = −0.35 to d = 0.31).
In three of the studies rated as weak, researchers used behavioral interventions. McGoey et al. (2010) produced a medium effect on antisocial behavior (Tau-U = 0.77), whereas Flannery et al. (2003) produced no effect (d = 0.01). Conklin (2010) produced a large effect on prosocial behavior, whereas Flannery et al. (2003) produced small effects on prosocial behavior (d = 0.28) and skill acquisition (d = 0.30). The three studies with a coping skills approach all used the Zippy’s Friends intervention (Mishara & Ystgaard, 2006; Monkeviciené et al., 2006; Rodker, 2013). On measures of all antisocial and prosocial dependent variables, research showed inconsistent effects, ranging from no effect to medium effects (range d = −0.15 to d = 0.67).
In the three remaining studies (Petermann & Natzke, 2008; Randall, 2011; Stevahn et al., 2000), researchers found a variety of effects on antisocial behavior, prosocial behavior, and skill acquisition ranging from small negative effects to very large positive effects (d = −0.28 to d = 8.65). Stevahn et al. (2000) produced inordinately large effect sizes on prosocial behavior (d = 8.65) and skill acquisition (d = 3.50). These dependent measures were very specific to the training that the participants received, and all were administered in analogue scenarios. It is unclear from these findings how participants would have performed under naturally occurring conditions.
Moderator Analysis
We conducted a moderator analysis for all large-N studies (n = 20) including the following variables: duration of treatment, length of sessions, percent female, number of participants, interventionist, type of study (i.e., peer-reviewed journal or dissertation), unit of analysis, and kindergarten alone versus kindergarten plus other grades. Out of those variables, the only one to reach statistical significance was duration of treatment. The random effects weighted correlation between duration of treatment and the Cohen’s d was −0.26, p = .03, which indicates that studies with treatments of longer duration tended to have lower effect size values. It is difficult to interpret this finding given in light of the possibility that longer duration of treatment may be related to severity of problem behavior. Given the small number of single-subject design studies (n = 6), we elected to conduct a moderator analysis of duration of treatment alone because it was the only significant finding from the large-N moderator analysis. The results indicated no significant difference among single-subject studies.
Discussion
The purpose of this review was to identify and evaluate the evidence for universal (classwide) kindergarten social–behavioral interventions and to identify which interventions or practices might be most useful to kindergarten teachers. In 11 studies, researchers used SEL interventions, and they consistently produced lower quality studies and smaller effects than those using behavioral interventions. Of these 11 studies, only Ashdown and Bernard (2012), Reid et al. (2007), and Webster-Stratton et al. (2008) were rated as having adequate quality evidence (27%). These researchers produced small to medium effects on antisocial behavior, no effects to small effects on prosocial behavior, and small effects on emotional awareness and skill acquisition. None of the adequate quality SEL interventions produced medium or large effect sizes. Only the You Can Do It curriculum (Ashdown & Bernard, 2012) produced meaningful outcomes on antisocial behavior, prosocial behvaior, and emotional awareness. Based on the available research, this is a promising program that needs additional study. Overall, the SEL interventions lack the evidence needed to recommend their use as classwide kindergarten interventions.
In contrast, the behavioral intervention category produced the highest quality evidence and the largest effects on antisocial and prosocial outcomes. Five studies showed large effects for decreasing antisocial behavior (Benner et al., 2012; Donaldson et al., 2011; Shelton-Quinn, 2009; Tanol et al., 2010; Wright & McCurdy, 2012). Three of them also increased prosocial behavior with medium to large effects (Benner et al., 2012; Shelton-Quinn, 2009; Wright & McCurdy, 2012). These strong outcomes support a recommendation that kindergarten teachers consider employing a behavioral approach for decreasing antisocial behavior and increasing prosocial behavior among their students. When addressing emotional awareness or skill acquisition, teachers should carefully consider the context in which the intervention will be used, given the limited number of studies and generally poor outcomes.
Recommendations for Research
First and foremost, higher quality research is needed to increase confidence in the available classwide social–emotional behavior programs for kindergarten children. Researchers may benefit from reviewing the evaluative method or other quality indicator scoring systems to ensure that their research designs incorporate as many components of high-quality studies as possible.
Second, more research is needed on increasing prosocial behavior among kindergarten students. Decreasing antisocial behavior is important, of course, but preparing students for the increasingly diverse and socially complex environments they will encounter throughout elementary school and in middle school will likely require more than simply suppressing antisocial behavior. Teachers need satisfactory evidence supporting proactive approaches that will help children develop their positive social–behavioral skills. Finally, as randomized, clinical trials are widely accepted as the gold standard for research rigor, such studies must be conducted on the Good Behavior Game in kindergarten settings.
Limitations
This review has some limitations that must be considered when interpreting the results. The greatest of these limitations was the quality of the evidence. Only nine studies achieved an acceptable designation, and none received a strong commendation. Only one study received high-quality ratings on all of the primary quality indicators (Shelton-Quinn, 2009), and no study received perfect ratings across all categories. Additionally, in spite of the broad net that was cast to identify studies, some may have been overlooked. The authors also recognize that due to the diversity of interventions and categories of approaches, limited data were available representing each category, with smaller proportions representing each intervention. Thus, caution should be used when applying the findings of this review beyond the scope of the setting and participants described in the studies.
A second limitation is related to the use of visual analysis for determining the effect of an intervention. Brossart, Parker, Olson, and Mahadevan (2006) described an ongoing debate about the reliability and trustworthiness of visual analysis. They point out that there are some studies indicating only weak to moderate interrater reliability among raters when visually analyzing graphical data. Additional concerns are related to the issue of autocorrelation among data points in a single-subject graph (e.g., Busk & Marascuilo, 1988; Huitema, 1985). In light of these concerns, it is important to have a clear understanding of the strengths and weakness of using visual analysis to interpret single-subject data when evaluating the conclusions of this review.
Other limitations include the following: The fact that so few studies used blind raters, which could lead to bias in favor of an anticipated outcome of the intervention; the inclusion of studies that did not allow for the disaggregation of the kindergarten data represents a limitation in terms of the applicability of the findings to kindergarten classes; and additional research on these topics should be considered for integration when applying the findings to a broader population or setting.
Conclusions
Kindergarten teachers are responsible for introducing their students to formal education. Kindergarten is a critical time in preparing students for their entire K–12 educational experience. A critical aspect of helping kindergarten students succeed is preparing them for the increasing social demands of the school setting. The purpose of this review was to identify practices that may help kindergarten teachers in this effort. The results indicate that a behavioral approach may be the most useful for decreasing antisocial behavior, and some evidence supports a behavioral approach for increasing prosocial behavior as well.
Footnotes
Notes
Authors
CHRISTIAN V. SABEY is currently an assistant professor in the Department of Counseling Psychology and Special Education at Brigham Young University, 340Q MCKB, Provo, UT 84602, USA; email:
CADE T. CHARLTON received his MBA from the Huntsman School of Business and is currently pursuing a doctoral degree through the Disability Disciplines program at Utah State University. He is a visiting instructor with Brigham Young University, 340Q MCKB, Provo, UT 84602, USA; email:
DANIEL PYLE is currently an assistant professor of teacher education at Weber State University, Ogden, UT 84408, USA; email:
BENJAMIN LIGNUGARIS-KRAFT is currently a professor in the Department of Special Education and Rehabilitation at Utah State University, Logan, UT 84322, USA; email:
SCOTT W. ROSS is the director of the Office of Learning Supports (OLS), 1580 Logan St., Suite 550, Denver, CO 80203, USA; email: