
Abstract
Classroom observation research plays an important role in policy, practice, and scholarship for students with disabilities. When interpreting results of observation studies, it is important to consider the validity evidence provided by researchers and how that speaks to the intended use of those results. In this literature synthesis, we used Kane’s argument-based approach to validity to describe evidence of validity for uses of observation instruments in classroom observation research regarding teachers of students with disabilities. We identified 102 studies from 1975 to 2020 that met inclusion criteria. Results indicated many studies did not report validity evidence to support their use of the observation instruments. Over time, reporting levels for much of the evidence has remained relatively constant, but we noted a consistent decrease in number of observations conducted per teacher and a consistent and large increase in reporting of teacher participant characteristics. We provide implications of this for research and practice and suggestions for improving classroom observation research.
By documenting teaching practice, classroom observational research fills an important function in educational systems (e.g., Cohen & Goldhaber, 2016): It provides insights into the practices teachers enact and how skilled they are in enacting these practices, thereby indicating in what areas they may need support to improve. This research also indicates conditions under which students are more likely to experience effective instruction, thereby informing, for example, policies guiding student placement decisions.
Observational research is especially important for students with disabilities. The Individuals with Disabilities Education Act (2004) guarantees students with disabilities access to a free, appropriate education, which must provide “more than de minimis” benefit; it must support them in making meaningful progress toward individualized goals, while also providing access to general education curricula (Yell & Bateman, 2019). Due to the learning and/or behavioral challenges students with disabilities experience, teachers are legally and ethically responsible to consistently use effective, efficient instructional practices (e.g., modeling, feedback) with a high degree of skill (Brownell et al., 2010). Classroom observation research plays an essential role in special education policy, leadership, and research, by providing insight into the ways the teacher workforce is meeting this responsibility, and the circumstances and settings in which they are more or less likely to fulfill this responsibility well.
High-quality classroom observational research depends on high-quality observation systems (Bell et al., 2012). Observation systems typically include an observation instrument, a rubric or rating form to help observers focus on particular aspects of instruction (e.g., classroom management, questioning) that are of empirical or theoretical importance for promoting positive student outcomes (Liu et al., 2019). Some observation systems are intended to yield descriptive data about the nature of teachers’ practice (e.g., the number of times they provided corrective feedback), and others yield a quality rating, indicating the strength of teachers’ practice overall.
Items in observation instruments guide the dimension of teaching practice researchers observe (Bell et al., 2012). Some instruments focus on instruction for specific content areas (e.g., Reading in Special Education), and others are content-generic, focusing on aspects of instruction that are meant to be universal across all content areas (e.g., Classroom Assessment Scoring System). Furthermore, some tools have a narrow focus, and others are more holistic. For example, some instruments count the number of opportunities for students to respond, focusing narrowly on one type of teacher–student interaction, whereas more evaluative tools include ratings of broader aspects of instruction (e.g., classroom management). Both types of instruments can be used in observation systems. However, observation systems include more than the items; procedures embedded in observation systems are used to enhance the validity of data collected using an observation instrument. These include training and reliability procedures and conducting a sufficient number and duration of observations (Liu et al., 2019).
Understanding the observation systems used to evaluate instruction for students with disabilities can provide insight into the quality of inferences drawn from observational research. Thus, the purpose of this systematic review is to examine the validity evidence provided for researchers’ use of observation systems in naturalistic observations of teachers of students with disabilities from 1975 to 2020. We acknowledge that this is a significant window of time, during which there have been important changes in both conceptions of effective special education practice (Brownell et al., 2010) and measurement theory (e.g., American Educational Research Association, American Psychological Association, National Council on Measurement in Education, Joint Committee on Standards for Educational, & Psychological Testing, 2013; Kane, 2010); thus, we attend to changes in the use of observation systems over time.
Conceptual Framework: An Argument-Based Approach to Validity
Drawing on Kane’s (2010) argument-based approach to validity, in this study, we examine ways in which observational studies of teachers’ instruction for students with disabilities have provided evidence that could be used to support their uses of observation systems. The Standards for Educational and Psychological Testing, put forth by the American Educational Research Association (2013) and other professional organizations, define validity as the extent to which “evidence and theory support the interpretations of test scores for proposed uses of tests” (p. 11). From an argument-based approach to validity, the intended interpretations of a measure imply particular inferences, or assumptions, users make when they draw conclusions and make decisions based on someone’s performance on a measure (Kane, 2010). By empirically demonstrating the accuracy of the inferences on which interpretations and uses are based, one can provide evidentiary support for those interpretations and uses of the measure (Kane, 2010).
Using an argument-based approach to validity, Bell et al. (2012) articulate key inferences on which classroom observation systems are based. First, scoring inferences refer to the assumption that a given behavior during instruction accurately and consistently translates, without bias, to a score on the observation system. Scoring inferences presume observers are not systematically biased in the scores they assign to particular teachers (e.g., men vs. women), in particular contexts (e.g., settings with which they are more/less familiar), or for particular aspects of the observation instrument (e.g., items on which they are less proficient). Observation systems can be designed to enhance evidence for scoring inferences by ensuring observers hold relevant knowledge, randomly assigning observers, masking observers to conditions that might activate biases, and conducting calibration to monitor and address observer drift. Researchers can evaluate scoring inferences after scores are assigned, by examining reliability across observers and testing whether scores systematically vary (e.g., by observer, teacher, context features). Note that reliability is a precondition for claims of validity; an observation system cannot validly measure a construct unless it can reliably produce consistent scores.
Second, generalization inferences support extending interpretations of the observed score to “a claim about expected performance over a larger universe of observations” (Kane, 2006, p. 24). There are two assumptions that fall under the generalization inference. The first is that “the sample of teaching observed is representative of all the instances of teaching to which one wants to generalize” (Bell et al., 2012, p. 67); this presumes the observation score is not capturing noise peculiar to the observed lesson but represents a typical range of instruction. The second inference is that the participant sample is representative of the population to which the user intends to generalize the results. Observation systems can be designed to support generalization inferences by observing a sample of a teacher’s instruction that is representative of the population of instruction about which researchers are generalizing (e.g., spreading observations over a relevant time period), ensuring an adequate number and length of observations, and observing a representative sample of teachers who can plausibly generalize to the population of teachers about whom researchers draw conclusions. After observation, one can also evaluate generalization inferences by examining the extent to which aspects of sampling (e.g., time of day or year) contribute to within-teacher variability in scores; the larger the contribution of these factors to scores, the more observations are required to support generalization inferences.
Third, extrapolation inferences refer to the assumption that scores on the measure are related to a broader construct, in the case of Bell et al.’s (2012) scholarship, teaching quality. Observation systems can be designed to strengthen the argument for extrapolation inferences by clearly defining the dimensions of instruction they evaluate and by providing empirical support for those dimensions (e.g., citing prior research or theory, providing definitions of dimensions observed). Extrapolation inferences can also be supported by evidence indicating observation scores are (a) related to other measures of similar dimensions of teaching quality and/or outcomes of teaching, but (b) unrelated to measures of unrelated constructs.
Finally, implication inferences refer to the assumption that uses of the measure as intended lead to expected outcomes (Bell et al., 2012). Implication inferences can be evaluated by examining whether using the scores as intended produces expected outcomes. For example, researchers may use the results of an observation study to decide what aspects of instruction they should prioritize for a future PD; if this decision leads to desirable outcomes (e.g., a PD that improves teacher practice and student outcomes), that would support the implication inference.
Kane (2006) laid out two stages of instrument validation. In the first stage, Development, developers identify their goal(s) for creating the instrument and collect evidence related to the interpretive argument, the framework for interpreting scores. In this stage, developers generally adopt a confirmationist bias, because they are attempting to support their interpretations and improve the instrument. The second stage is the Appraisal stage, in which researchers take a “more neutral or even critical stance” (p. 26). In the Appraisal stage, the instrument is assumed to be finished, and the interpretive argument is examined critically. Kane makes clear that validation is not a process that can be completed in one study; rather, it requires a series of studies providing different information related to validity. To appraise an instrument for a particular interpretation, the appraiser would gather the available research data related to the instrument and evaluate whether the data are sufficient to support their intended interpretation or use of the instrument.
Adopting Kane’s (2010) approach to validity and Bell et al.’s (2012) application of this approach to observation systems, we posit that, when using observation systems, researchers should provide evidence to support scoring, generalization, and/or extrapolation inferences, so other scholars have the opportunity to appraise the instrument’s appropriateness for their purposes. In this review, we evaluate the extent to which observation studies of teachers of students with disabilities provide evidence to support scoring, generalization, and extrapolation inferences. We do not evaluate the extent to which they provide evidence to support implications inferences; because we focus on uses of observation systems in research, evaluating the implications inference would require us to determine the impact of each study (e.g., policy changes made as a result of a study’s results), which is beyond the scope of the present review.
Previous Syntheses of Classroom Observational Research in Special Education
Researchers have conducted several prior syntheses to examine trends in classroom observational research. Most extant syntheses have examined specific populations (e.g., students with emotional/behavioral disorders; Vaughn et al., 2002) and content areas (e.g., reading; McKenna et al., 2015). Furthermore, most prior syntheses focused on results of included studies, not methods. For example, they examined whether studies’ results showed teachers using evidence-based practices (McKenna et al., 2015; E. A. Swanson, 2008; Vaughn et al., 2002; Walker & Stevens, 2017). These syntheses are useful for understanding the extent of the research-to-practice gap.
Taking a different perspective, other reviews focused on aspects of observation systems used in classroom observational studies. Park et al. (2019) described instruments used in observations of special education reading instruction, focusing on how instruments’ content aligned with principles of effective reading instruction for students with disabilities. They concluded a few instruments captured general instructional practices, but not specific effective reading practices for students with disabilities, indicating evidence for the extrapolation inference may not be present, at least for reading instruction. E. A. Swanson (2008) synthesized observation studies of reading instruction and found more than half reported conducting observer training, but the same number did not report how they calculated interobserver reliability, providing mixed evidence to support scoring inferences. Salvia and Meisel (1980) examined methods used in observation studies published in four journals in the prior 2 years to determine the extent to which observer bias may have influenced studies’ results; they examined three aspects of study design: (a) whether the study’s purposes were masked 1 for observers, (b) interrater reliability, and (c) observer training. They found about half the studies in their corpus had high potential for bias, indicating studies provided weak evidence to support scoring inferences.
These reviews provide important insight into the quality of observation systems, but none comprehensively examined the evidence of validity provided in researchers’ descriptions of observation systems; for example, Park et al. (2019) examined the content of observation instruments, not the systems used to promote valid ratings. Furthermore, researchers defined their corpus in ways that limited their relevance for improving the quality of special education classroom observation research writ large. Salvia and Meisel’s (1980) review is limited by its age and focus on only one aspect of observational quality. Although they are more recent, the other two reviews (Park et al., 2019; E. A. Swanson, 2008) are limited by a narrow focus on observations in reading. Though some teaching practices are content specific, (a) many are effective across content areas, (b) methods used to evaluate practice are seldom content specific, and (c) special education research often evaluates instruction across content areas because special educators often provide instruction across content areas (Jones & Brownell, 2014). Thus, a broader review likely has stronger relevance for informing future observation research.
The Current Study
To date, no reviews have comprehensively examined how observation studies of teachers of students with disabilities provide evidence that could be used to support validity inferences. Synthesizing validity evidence of observational systems is important for improving the quality of classroom observational research, thereby improving the capacity of this kind of research to inform research, practice, and policy aimed at improving the quality of instruction. Thus, we take a comprehensive approach, looking across the history of codified special education practice. Of note, the past 45 years have seen important changes in measurement theory (e.g., American Educational Research Association, 2013; Kane, 2010), as well as changes in how scholars conceptualize strong instruction for students with disabilities (Brownell et al., 2010), and where students with disabilities are served (e.g., Williamson et al., 2019). These changes likely require adjustments to the validity evidence needed to support inferences; as such, we attended to changes in validity evidence reported over this time frame.
Our goal in conducting this systematic review was to understand the extent to which observation studies provide compelling evidence to support common inferences related to observation research and how reporting of that evidence has shifted from 1975 to 2020, such that scholars reading these studies could appraise whether the validity evidence would support their intended uses. The following research questions guided our analysis:
Method
Search and Inclusion Procedures
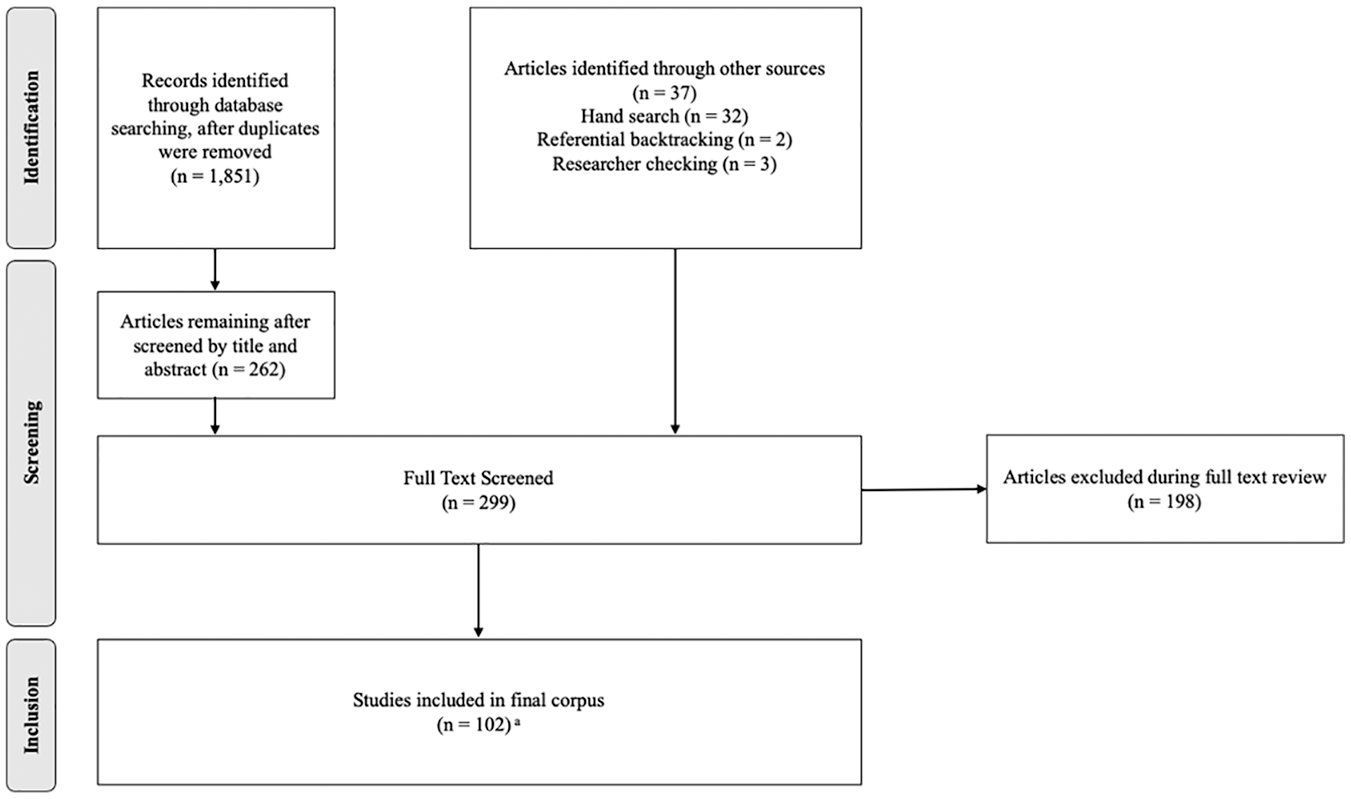
To locate relevant articles, we aligned search strategies with guidance for systematic reviews (Alexander, 2020). Figure 1 illustrates our search, following the Preferred Reporting Items for Systematic Reviews and Meta-Analyses (PRISMA; Moher et al., 2009) guidelines for identification, screening, eligibility, and inclusion processes in a systematic review.
Study selection process.
Inclusion Criteria
We sought published, peer-reviewed studies from 1975 to 2020, seeking observational research that targeted in-service teachers in K–12 settings serving students with disabilities. We included studies that met the following criteria: (a) published between 1975 and 2020; (b) peer-reviewed research; (c) focused on in-service teachers of students with disabilities; (d) methods employed systematic classroom observations, with observation foci determined a priori; (e) focused on teachers’ classroom activities; and (f) observations were conducted in natural school settings; and (g) observation results were reported separately from other data.
Time period: 1975 to 2020
Using policy to demarcate the bounds of our search, we began with articles published in 1975, the earliest year in which a major law codified special education. The U.S. Congress passed PL 94-143, the Education for All Handicapped Children Act, in 1975, which required schools to provide equal access to education for students with disabilities. In subsequent years, such policies were increasingly enacted internationally (e.g., in 1983 Finland’s Parliament passed the New Comprehensive Schools Act; in 1986 China adopted the Compulsory Education Law of the People’s Republic of China). We used 1975 as the start for our search because PL 94-142 is the earliest known national legislation for special education.
Peer-reviewed research
Aligned with our focus on evidence for validity arguments within published research, we included only peer-reviewed, published research in our final corpus, excluding dissertations, working papers, and other gray literature.
Teachers of students with disabilities
Because our purpose was to identify evidence supporting validity arguments in observations of teachers’ classroom practice when serving students with disabilities, we included articles focused on teachers’ behaviors in classrooms serving students with disabilities. We defined a teacher as an in-service teacher in any K–12 setting (e.g., general education, self-contained, juvenile justice); though studies of preservice teachers may include systematic observations, we decided the extrapolation inference related to teaching quality in preservice settings would likely be conceptually distinct from inferences related to in-service teachers. Some studies focused on observing students, and only examined teachers’ instruction incidentally (most notably, the Code for Instructional Structure and Student Academic Response; e.g., Rotholz et al., 1989); because of their central focus on students rather than teachers, we determined these studies did not directly address our research aim. We also excluded articles in which teaching students with disabilities was not an explicit focus of the observation, such as studies in which students with disabilities were present in classes, but research questions and data analysis did not explicitly address instruction for students with disabilities. For example, Gage et al. (2018) conducted observations of teachers’ implementation of evidence-based classroom management practices, but analysis and results were not disaggregated by student population. Though students with disabilities were likely included in these classes, there was not an explicit examination of the practices provided to this population of students, so this study was excluded from analysis.
Systematic classroom observations
To be included, studies had to use observation systems in which coding schemes were determined a priori. We excluded studies in which researchers analyzed field notes inductively. For example, we excluded a study by Moin et al. (2009) in which data collection consisted of free narrative paragraphs in an observation journal. Though inductive approaches provide important information about classroom practice, the concept of validity is less relevant than other methodological criteria (e.g., trustworthiness, credibility) for inductive data collection and analytic methods (Trainor & Graue, 2014).
Observations focused on classroom activities
We only included articles that focused on teachers’ classroom activities. We excluded articles that employed observations of teachers outside of instruction, such as those that looked at teacher time use more generally. For example, Sargent (1981) collected descriptive observational data regarding teachers’ time use; their data collection focused on time spent providing consultation, training, staffing for Individualized Education Program meetings, and record keeping. Because observed behaviors extended beyond the classroom, we excluded this study. Bounding our corpus in this way allowed us to focus on observation systems used to understand instruction, which are distinct from those employed to understand how teachers collaborate and consult, roles with unique measurement challenges (Jones et al., 2019).
Observations in naturally occurring settings
We only included studies that focused on natural classroom settings, excluding studies that used observation systems to assess the effects of interventions or professional development. For example, Kennedy et al. (2017) assessed effects of professional development on teachers’ vocabulary instruction in inclusive science classes. We excluded these studies because their purpose was to assess how practice changed through intervention (a different use) and would depend on different validity arguments.
Observation results presented separately
Finally, we only included studies that reported using systematic observations in the Method section and presented findings from these data in the results. Some studies used an observation system to support an overall understanding of participants but did not report observation results distinct from qualitative teacher profiles (e.g., Kelman & Branco, 2004); we excluded these studies. In other studies, observations were conducted to confirm results of other measures, but observation results were not reported. For example, Hang and Rabren (2009) used observations to confirm teachers’ assertions, but did not report observation results; we also excluded these types of studies.
Electronic Search
We screened titles and abstracts in the following electronic databases: PsychINFO and a combined database that included ERIC, Academic Search Complete, Education Full Text, Education Index Retrospective, Education Research Complete, Psychology and Behavioral Sciences Collection, and SPORTDiscus. We used the search terms observ*, “special education,” teacher or teachers or “special education teachers,” NOT pre-k or “pre-kindergarten” or preschool or “early childhood.” The database search resulted in 1,851 potential articles.
Two researchers reviewed each title and abstract, discussing decisions regarding inclusion for full-text review. Before working independently, they reached 100% agreement on 20% of articles. They then separately reviewed titles and abstracts of remaining identified articles in each database and determined whether they met initial inclusion criteria; following this, we met to discuss questionable articles. At this stage, we erred on the side of including false positives; for example, if an abstract mentioned using observation systems but did not specify whether participants were preservice or in-service teachers, we retained it for full text review. Through the electronic search, we identified 262 articles potentially relevant to our purpose.
Additional Search Efforts
Consistent with recommendations for systematic reviews (Alexander, 2020), we used three further strategies to identify relevant studies. Each strategy was enacted by pairs of researchers; after one team member conducted each search, a second member reviewed questionable articles. First, we hand searched the six journals that published the highest numbers of included articles from the database search: Exceptional Children, Teacher Education and Special Education, Learning Disability Quarterly, Remedial and Special Education, American Annals of the Deaf, and Journal of Special Education. This yielded 32 additional articles for full-text review. Next, using referential backtracking, we reviewed references from prior syntheses of observation studies (McKenna et al., 2015; Park et al., 2019; E. A. Swanson, 2008; Vaughn et al., 2002; Walker & Stevens, 2017), identifying two articles. Finally, we compiled a list of all authors involved in the research in our corpus. Based on this list, we reviewed three researchers’ publication records (i.e., Brownell, Johnson, Vaughn) to identify any additional research that warranted our attention. We identified three articles at this stage for full-text review.
Full-Text Review
After completing the search and screening processes, we reviewed the full texts of all identified articles (n = 299) to assess eligibility with regard to our inclusion criteria. As we screened the full text of each article, we refined our inclusion criteria to clarify the conceptual boundaries of our corpus and to ensure included studies meaningfully contributed to our research purpose (final inclusion criteria are described above). Consistent with other reviews, this process was iterative (Alexander, 2020); as such, after finalizing our inclusion criteria, we returned to articles that had previously been considered to determine whether they met our more stringent criteria. In the process of full-text screening, we excluded 198 studies, resulting in a final corpus of 100 articles. Two articles (Ivarie et al., 1984; Thompson et al., 1984) each described two studies; for this reason, across the 100 articles, 102 studies were analyzed.
Data Analysis
Analysis occurred across several phases: code development, code application, and data synthesis. Analysis was informed by previous observation syntheses’ coding structures, the literature on observation methods in educational settings (e.g., Jones & Brownell, 2014; Liu et al., 2019), and the framework proposed by Bell et al. (2012).
Development of Codes
Drawing on sources noted above, we developed codes and definitions to examine the extent to which researchers provided information that would allow readers to appraise evidence supporting scoring, generalization, and extrapolation inferences for their intended uses. Development of coding definitions was iterative (Alexander, 2020). After establishing a preliminary set of codes, we independently coded a subset of articles and met to compare codes and examine disagreements; this helped clarify definitions, provide examples, and establish decision rules. In some cases, information was not clearly defined in an article but was available from other sources (e.g., previous articles). We elected not to consult resources outside articles in our corpus because (a) we did not have access to all outside sources (e.g., protocols), and we wanted to standardize coding; and (b) unclear reporting has implications for practical use of study results. However, we did include codes noting if authors referred to other sources.
Scoring inference
To evaluate evidence to support the scoring inference, we designed codes to address how researchers attended to accuracy, consistency, and bias in the scoring process. We coded for variables related to observer training, the use of ongoing monitoring and recalibration of observers’ scoring, interobserver agreement (IOA), and measures taken to examine results for potential bias (e.g., whether observers were masked to condition, whether researchers evaluated sources of bias in scores; see Table 1 for the full list of codes).
Scoring inference codes and definitions
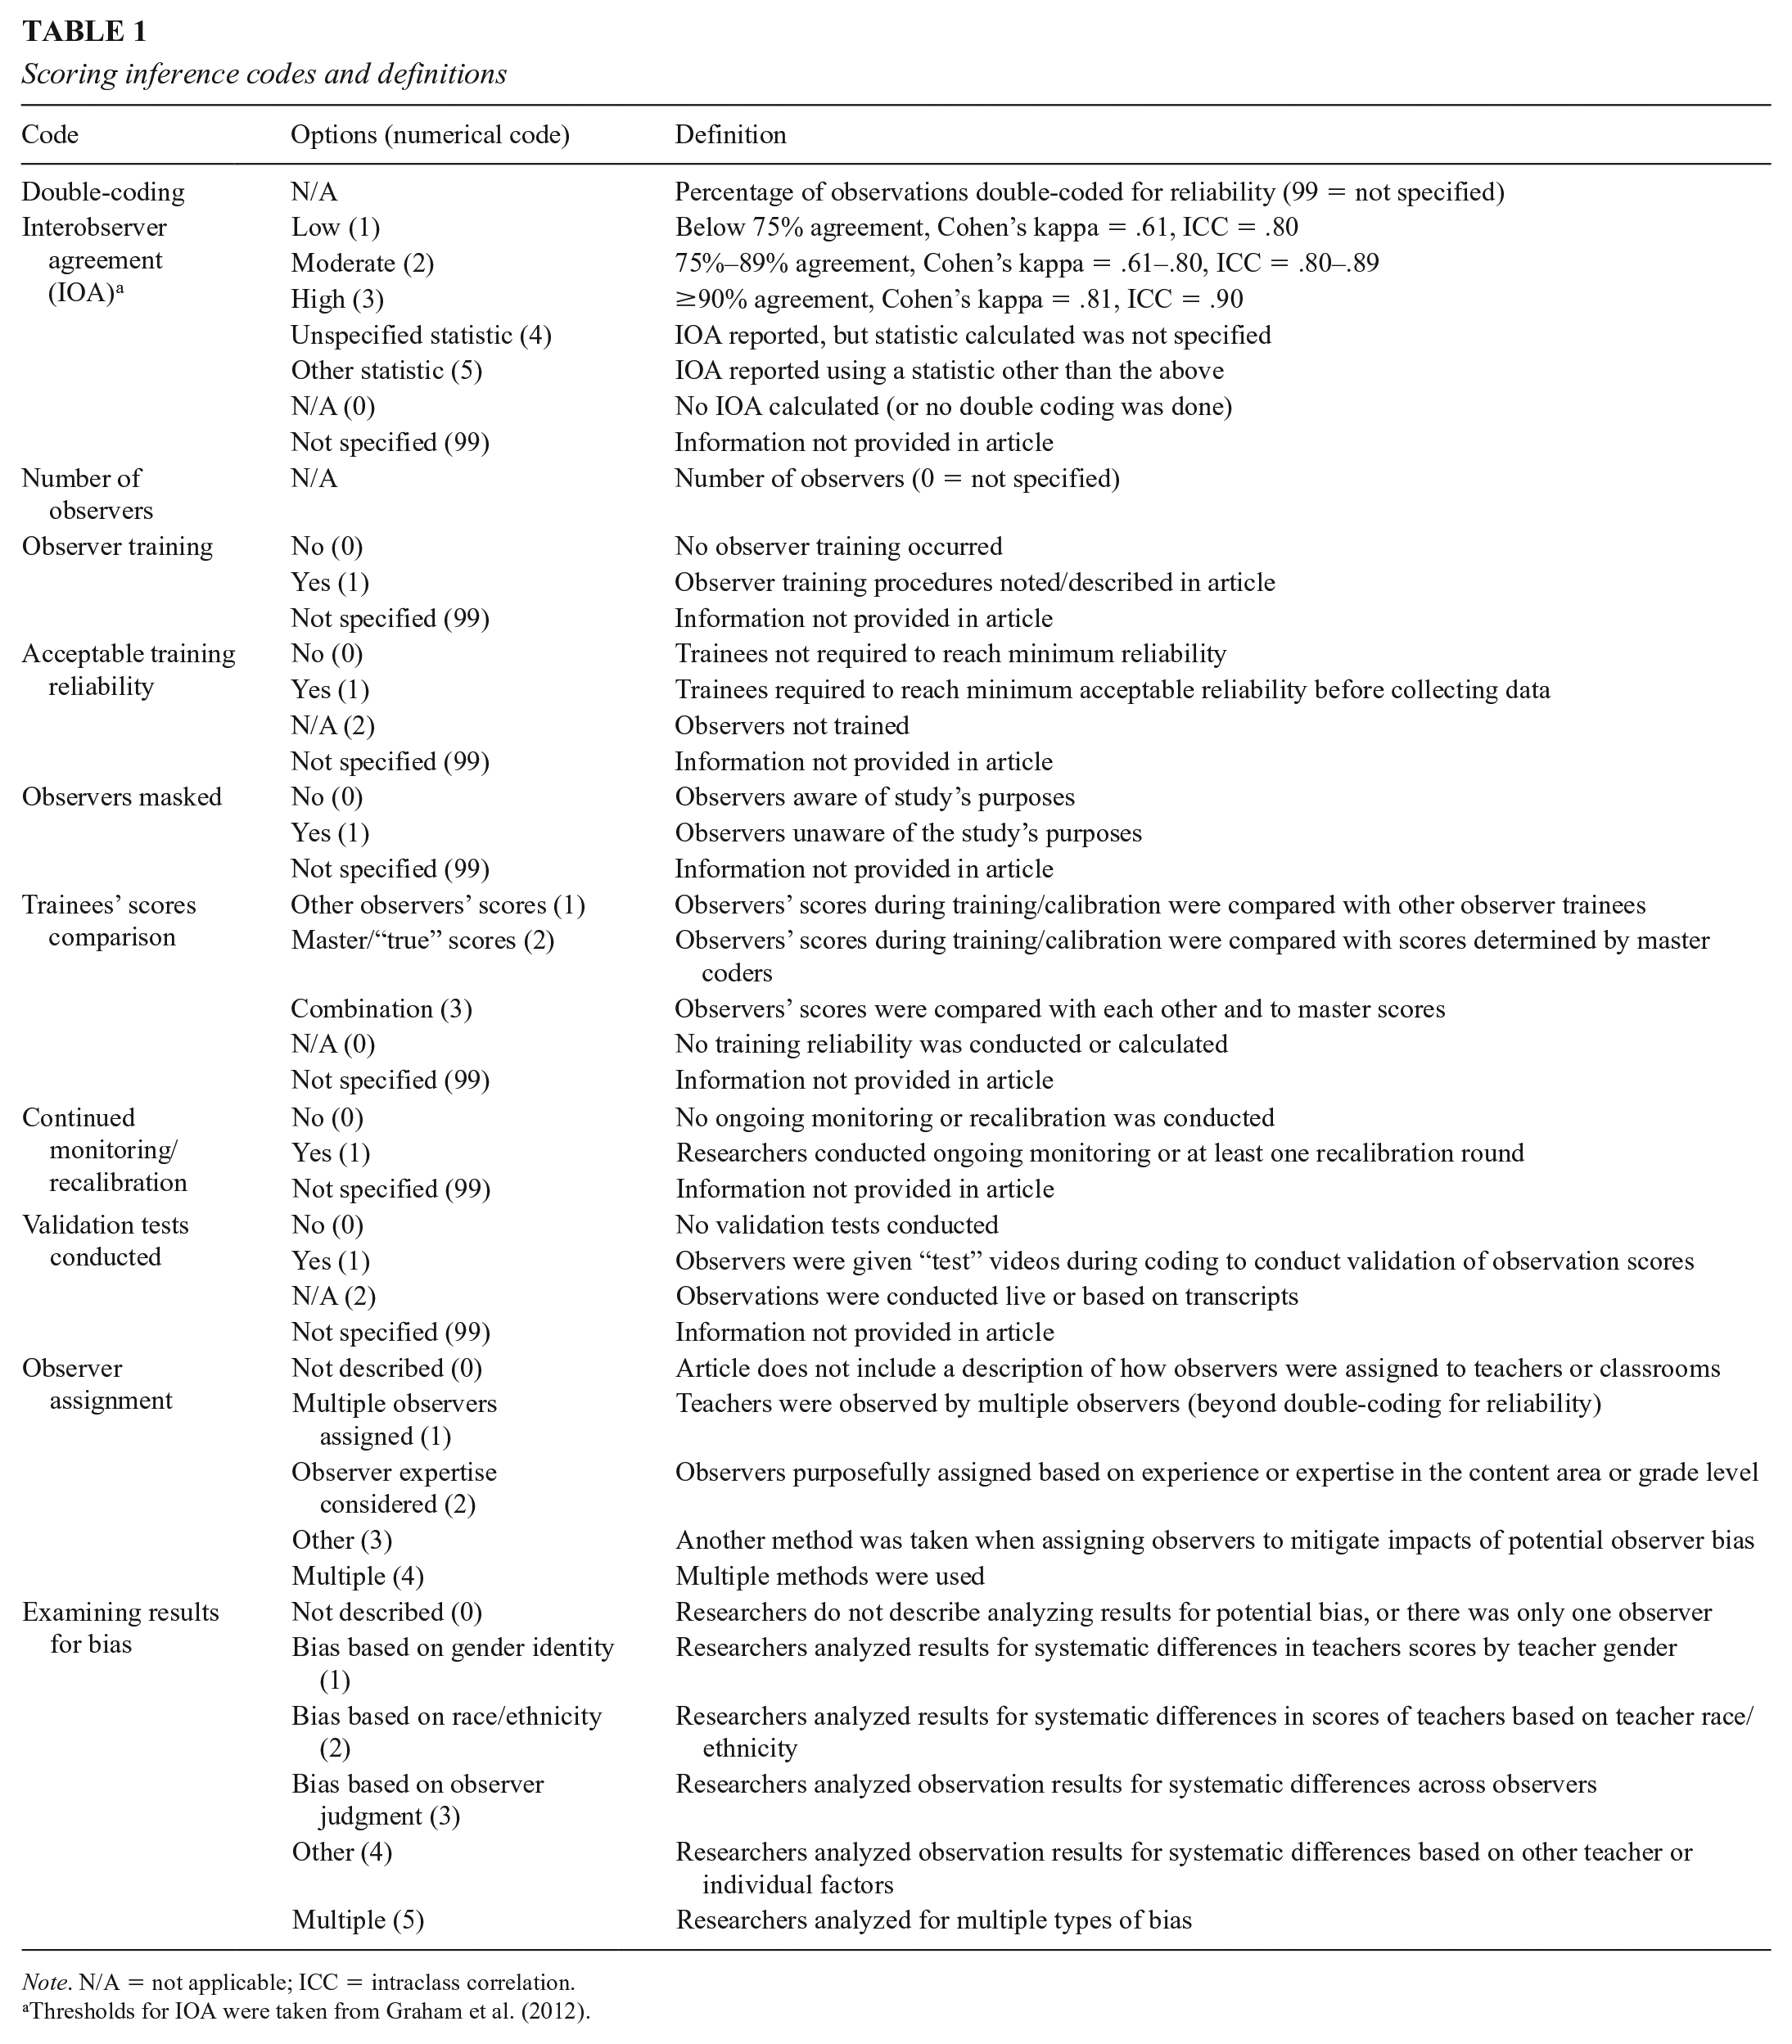
Note. N/A = not applicable; ICC = intraclass correlation.
Thresholds for IOA were taken from Graham et al. (2012).
Generalization inference
We examined evidence to support generalization inferences using codes about how researchers sampled observations from the population of instruction and accounted for potential “noise” in the data associated with sampling of observations. In this category, we coded for information regarding the number and length of observations; how observations were scheduled; whether results were examined for systematic differences related to contextual factors; and characteristics of the participant sample (see Table 2).
Generalization inference codes and definitions
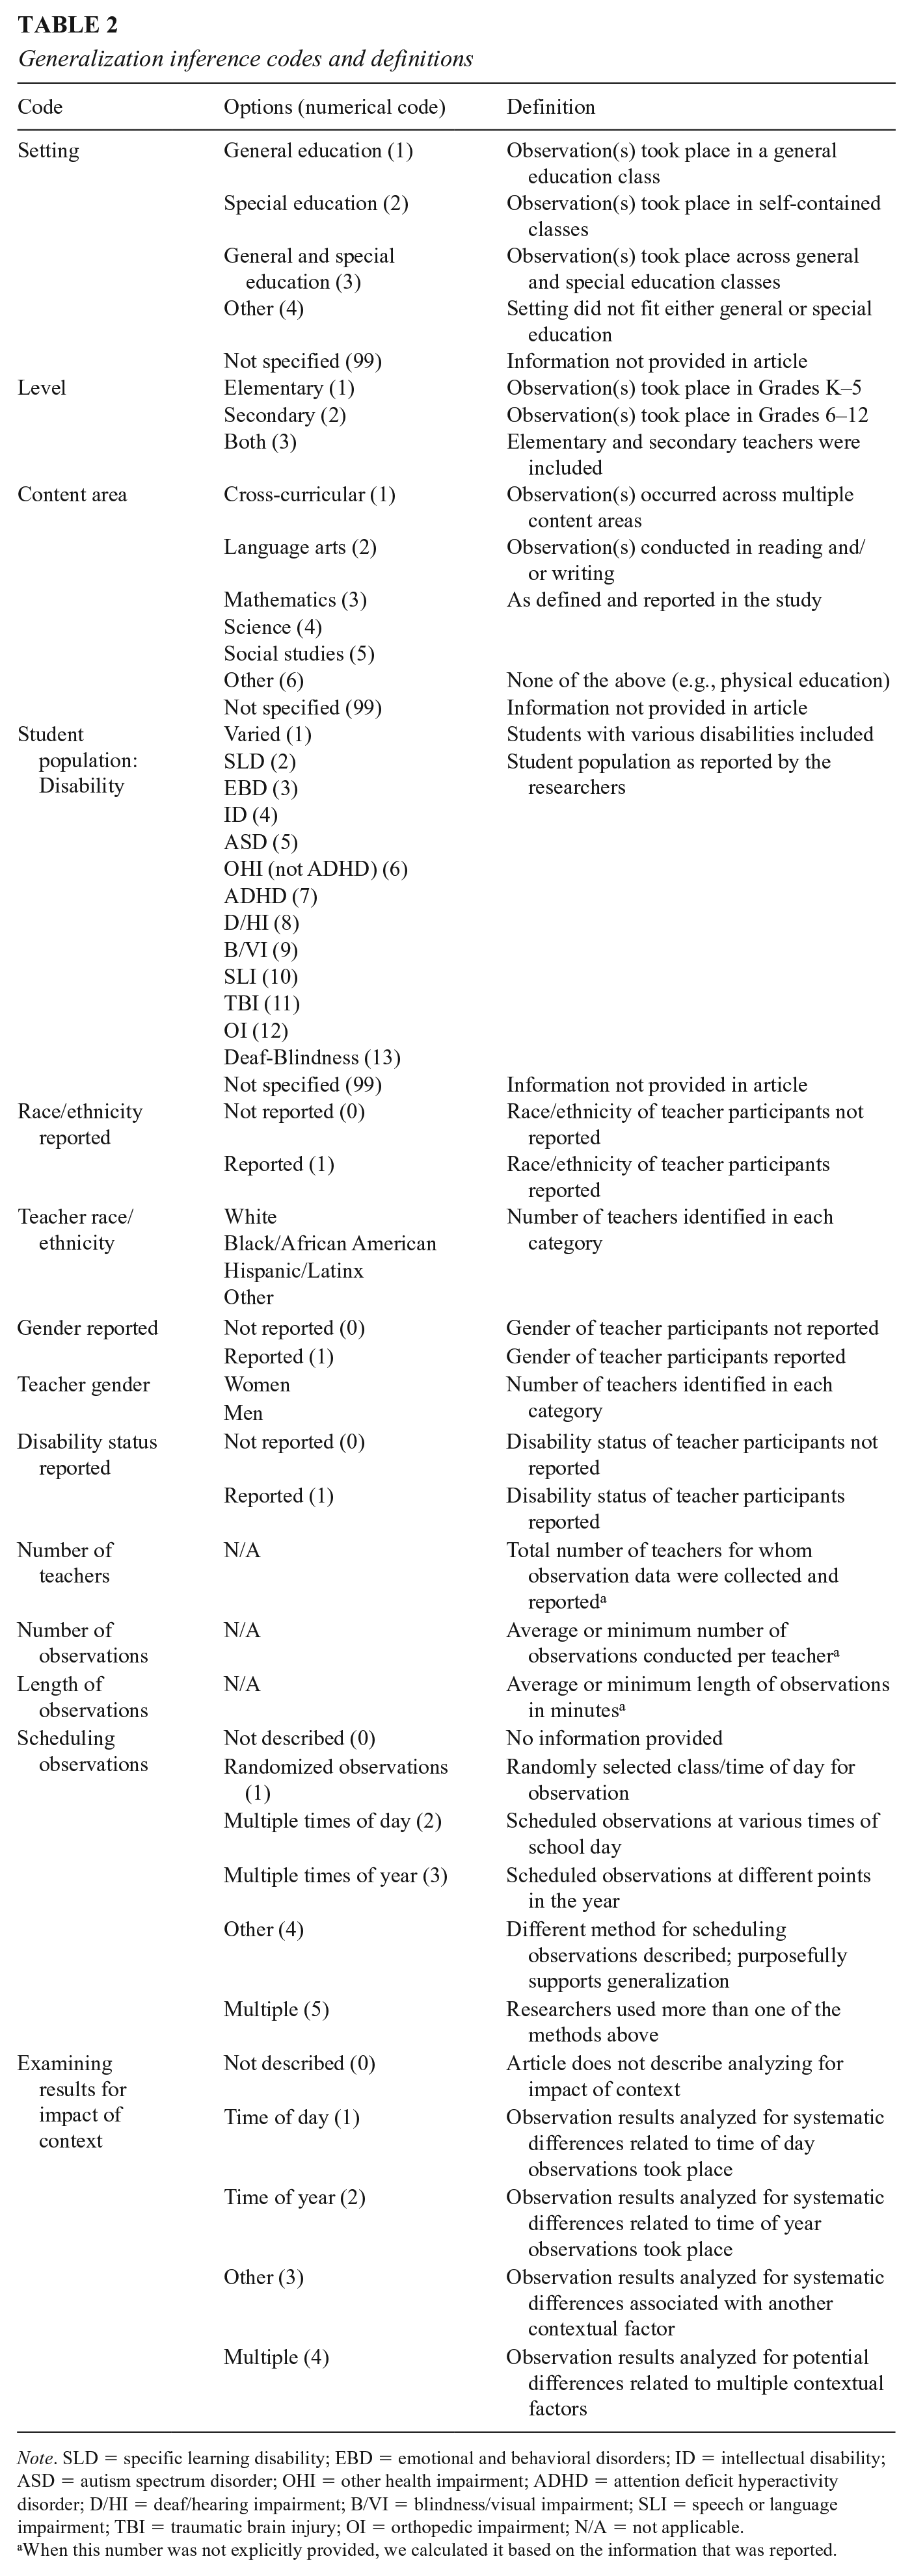
Note. SLD = specific learning disability; EBD = emotional and behavioral disorders; ID = intellectual disability; ASD = autism spectrum disorder; OHI = other health impairment; ADHD = attention deficit hyperactivity disorder; D/HI = deaf/hearing impairment; B/VI = blindness/visual impairment; SLI = speech or language impairment; TBI = traumatic brain injury; OI = orthopedic impairment; N/A = not applicable.
When this number was not explicitly provided, we calculated it based on the information that was reported.
Extrapolation inference
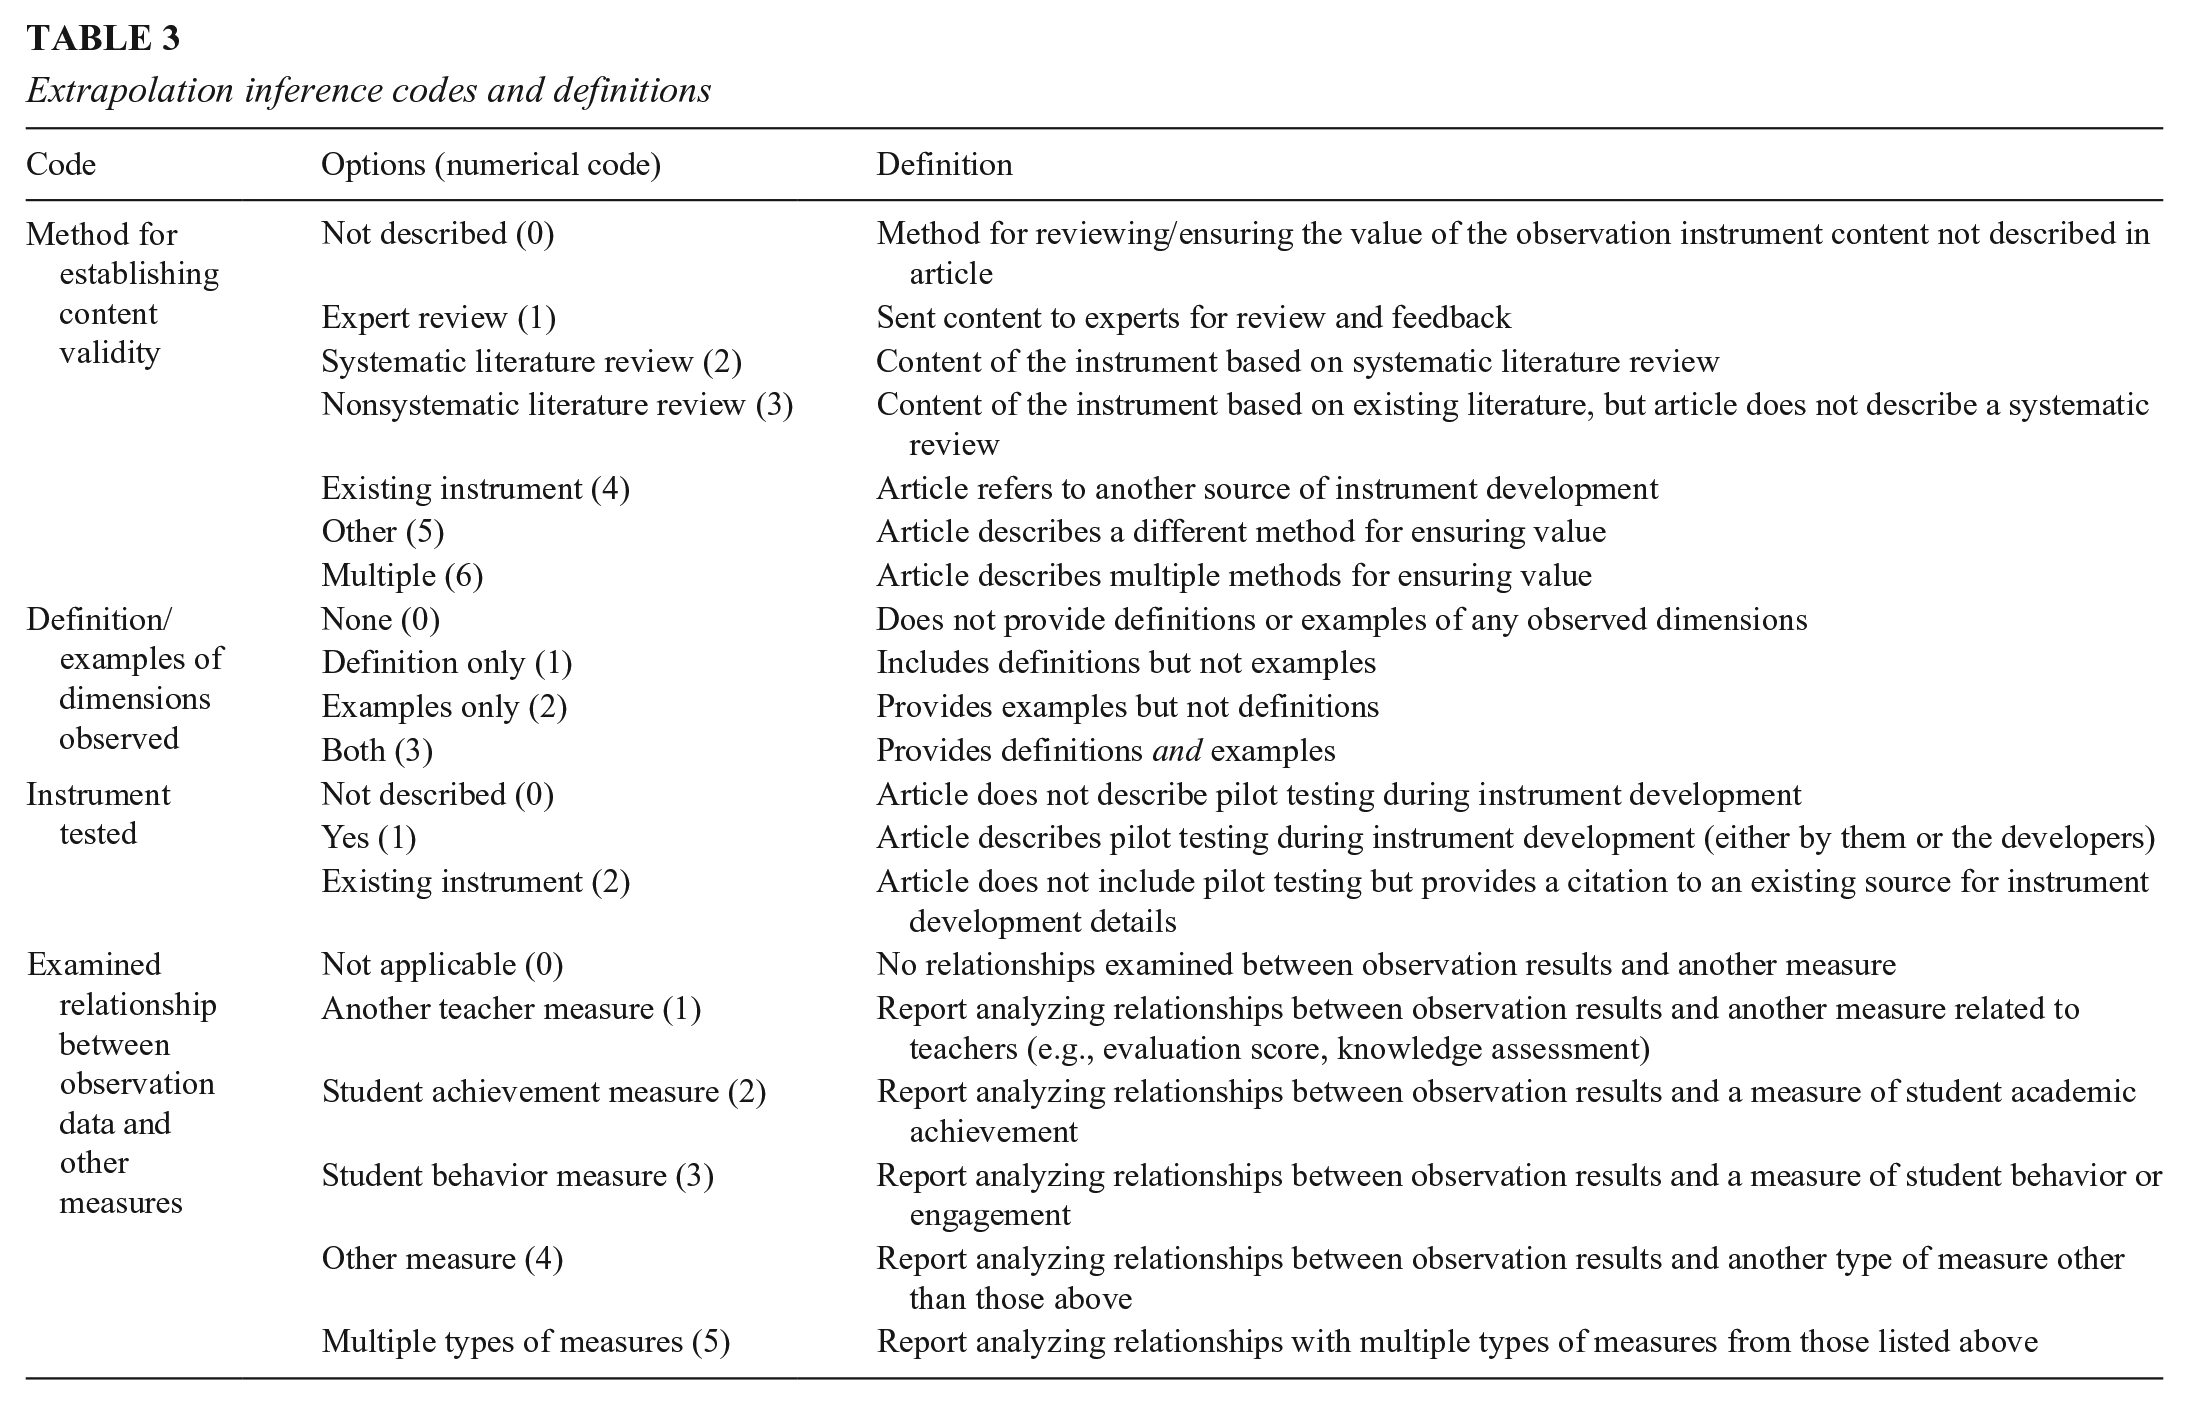
The extrapolation inference refers to the assumption that scores on the measure are related to the broader construct of teaching quality (Bell et al., 2012). Although studies in our corpus focused on different dimensions of instruction, they all chose to focus on dimensions they posited were relevant to understanding teaching quality. In some studies, they were making judgments about teaching quality (e.g., quality of classroom management practice), while in others, they were describing behaviors that signaled something specific about teaching quality (e.g., use of different grouping structures, praise statements, or—in contrast—negative regard); however, even when researchers only described behaviors, there is an underlying assumption in observational research that these behaviors are an important part of understanding teaching quality in classrooms serving students with disabilities. Thus, we considered evidence to support the extrapolation inference broadly, examining whether articles provided information that would allow an appraiser to connect the instrument content to an understanding of teaching quality. Coding evidence to support extrapolation inferences involved both deductive and inductive coding. Deductively, we coded for (a) the method researchers used to establish content validity (e.g., expert review, literature review); (b) whether researchers provided definitions and examples of observed variables; (c) whether researchers tested the instrument during planning and development; and (d) whether and how researchers examined relationships between observation data and other measures theoretically related to teaching quality, such as teacher knowledge, student achievement, and student behavior (see Table 3).
Extrapolation inference codes and definitions
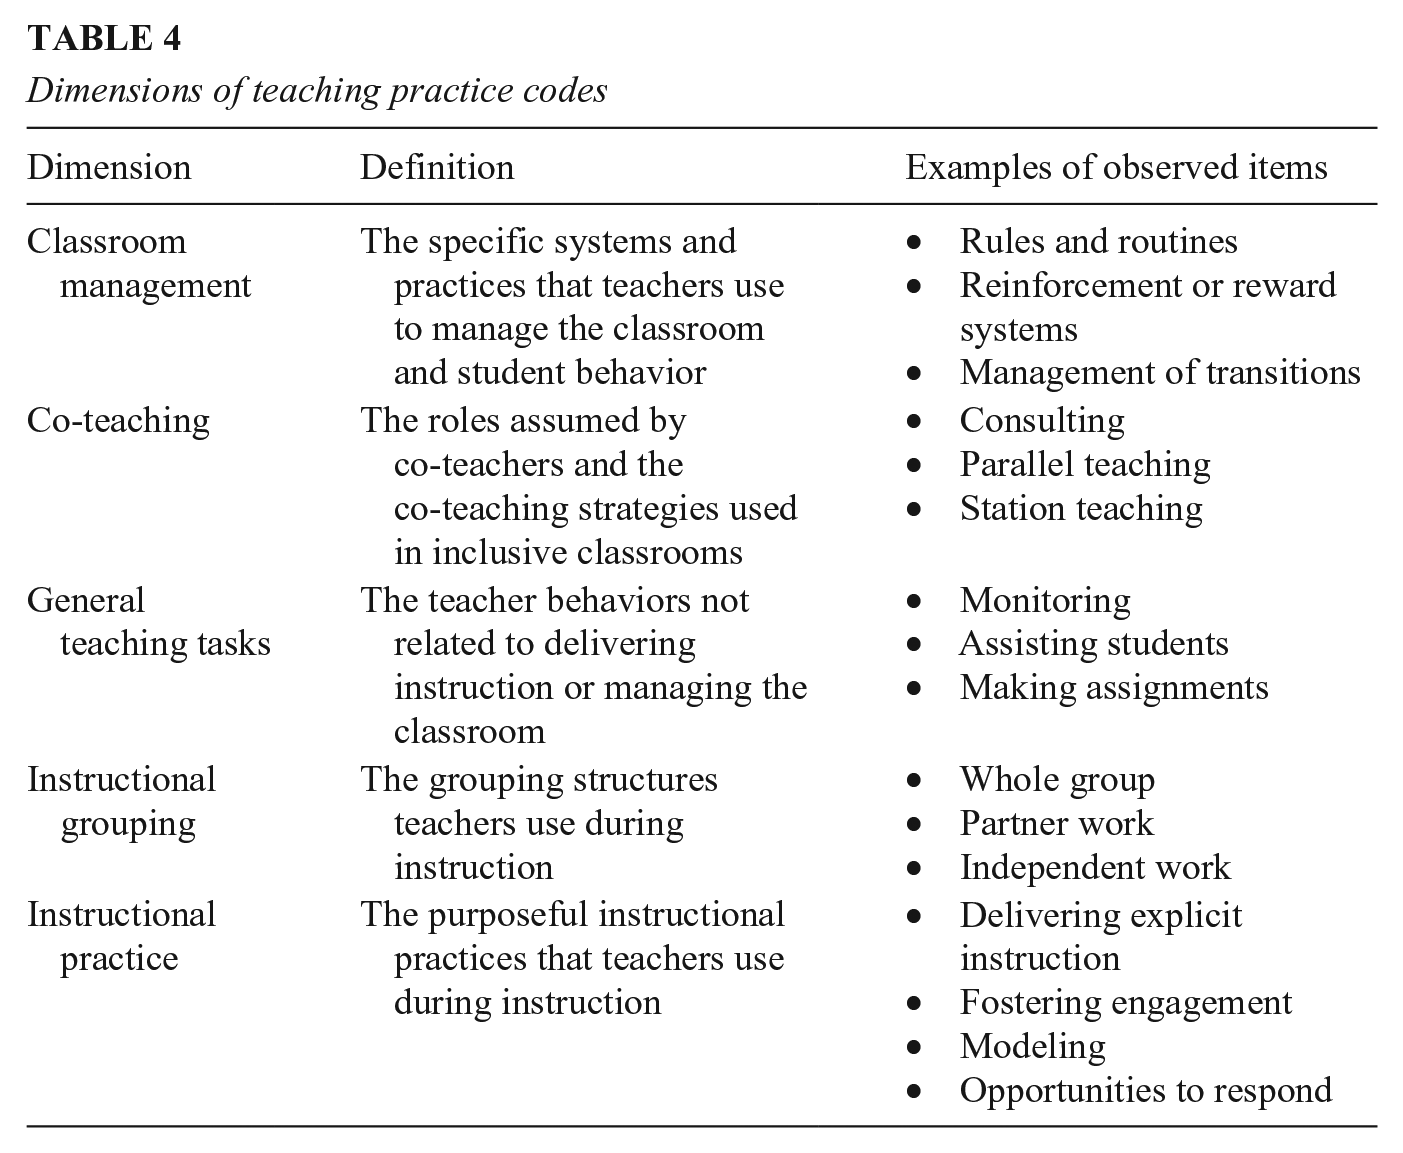
Inductively, we coded the dimensions of teaching practice for which researchers observed. Our intention was to determine dimensions of teaching practice observed; we anticipated these may have changed over time, as conceptions of teaching practice for teaching students with disabilities have changed over time (Brownell et al., 2010). To develop codes for these dimensions, we (a) independently reviewed studies’ purposes, research questions, methods, and results; (b) constructed analytic memos documenting categories and subcategories examined; and (c) met to determine final codes. In this process, we noted considerable variability in how researchers named and defined dimensions of teaching. We collapsed codes into broader categories for the most prominent dimensions of teaching quality researchers examined. Of note, some studies reported observation results as one composite score including multiple dimensions without decomposing results (e.g., Bishop et al., 2010; Nougaret et al., 2005); because we found considerable variability in how these composites were defined, we could not accurately determine the dimension of teaching practice observed, so in our final coding, we coded these as Other. Also in the Other category, some teaching behaviors were so idiosyncratic (e.g., facial expression, teacher positioned to view students) that creating individual categories would have resulted in categories that were meaningless given the breadth of our review. Table 4 defines the final dimension codes.
Dimensions of teaching practice codes
Application of Codes
In the next phase, pairs of researchers coded all articles using the final coding protocol, with teams of two coding each study. During coding, we met biweekly to discuss disagreements and work toward consensus. We calculated Cohen’s kappa (a measure of coding reliability for nominal data that accounts for agreement due to chance) for each code. Kappa values ranged from .386 to 1.00. The average kappa value across all codes was .706, indicating substantial agreement (Landis & Koch, 1977). All kappa values were statistically significant. We used consensus codes to examine patterns and synthesize information in the final stage of analysis.
Synthesis
After coding, we used descriptive analysis to provide a broad perspective on the research questions. We compiled, organized, and examined the data by inference (Research Question 1). Finally, we examined data descriptively by decade between 1980 and 2019 (we excluded the 1970s and the year 2020 from this part of the analysis because they were only partial decades) to assess how reporting of validity evidence for observational systems in special education has changed over time (Research Question 2). Given changes in measurement theory (e.g., Kane, 2010), we expected to find a trend toward more persuasive evidentiary support for all three inferences over time.
Results
We identified 100 articles containing 102 studies, spanning the years 1975 to 2020. Most studies were conducted in the United States of America (n = 84), but we identified studies from 13 countries. Across studies, researchers completed >306 observations of >2,369 teachers using >35 different observation instruments. The most commonly used instruments were as follows: CCS (n = 7; McIntosh et al., 1993), Recognizing Effective Special Education Teachers (RESET; n = 6; E. S. Johnson et al., 2018), Flanders Interaction Analysis system (n = 4; originally developed by Stuck & Wyne, 1971), Brophy–Good Dyadic Interactions System (n = 4; originally developed by Brophy & Good, 1970), Classroom Observation Keyed for Effectiveness Research (COKER; n = 3; K. M. Algozzine et al., 1986), and Reading in Special Education (n = 3; Brownell et al., 2009). Most (n = 80) reported descriptive rather than evaluative data, meaning they intended to capture features of what was happening in classroom(s) (e.g., number of times teachers provided feedback) without explicitly evaluating the quality of instruction.
In the following sections, we first present findings regarding the evidence researchers provided to support scoring, generalization, and extrapolation inferences for their uses of observation systems. We then discuss patterns in validity evidence over time. Supplemental Tables S1, S2, and S3 (available in the online version of this article) contain our full coding results related to these three inferences.
Evidence Related to Validity Inferences
Scoring Inference
Many studies in our corpus failed to provide strong evidence to support accuracy, consistency, and lack of bias in the instruments used or how observers interpreted instruments.
Accuracy
In 76 studies, researchers reported observers received training before collecting data; 24 did not report on observer training. The remaining two studies’ descriptions of their process indicated they did not provide training (Jordan et al., 1997; McKenzie, 2009). In 52 studies, researchers specified trainers had to reach at least moderate acceptable reliability (i.e., at least 75% agreement, .61 Cohen’s kappa, or .80 ICC). Forty-six studies reported what observers’ scores were compared with during training; of those, 16 studies (36%) compared trainees’ scores with other observer trainees, 29 (63%) compared trainees’ scores with “master” scores, and one used a combination.
Consistency
Twelve studies either used only one observer (n = 5) or did not calculate IOA (n = 7). Of the remaining 90 studies, in 34 (38%), researchers did not indicate whether any observations were double-coded. The percentage of observations double-coded in the other studies ranged from 0% to 100% (median = 25%). Of the 59 studies that calculated and reported IOA, 16 (27%) either did not specify the statistic they used or used a statistic other than the ones referenced in Graham et al. (2012), a reference document providing guidelines for interrater reliability for observations. Seven (12%) studies reported low agreement, 23 (40%) reported moderate agreement, and 13 (22%) reported high agreement (see Table 1 for thresholds and Graham et al., 2012, for explanations of the included statistics). Researchers reported conducting recalibration or ongoing monitoring of IOA during data collection in 17 studies. Of 18 studies that used video, none reported conducting validation tests in which researchers embedded “test” videos among actual videos to assess observer reliability.
Lack of bias
Thirty-six studies did not report the number of observers used, and five studies only used one observer, meaning there was no way to statistically test for potential bias. The mean number of observers per study was 6, and the mode was 2 (n = 16). Only seven studies reported the study’s purposes and/or research questions were masked to observers, a strategy that could reduce observer bias. In 77 studies, authors did not report using a purposeful process of assigning observers to reduce the potential for observer bias to impact results. Of the 25 studies that did report such steps, 16 (64%) ensured each teacher was observed by more than one observer for each observation. One study (Cipriano et al., 2018) described randomly assigning video segments to observers. H. L. Swanson (1984) ensured no observer was at the same school more than once and assigned two observers to each observation. Lawson and Cruz (2018) assigned two observers to each video and randomized which video each pair of observers coded. In most studies involving RESET (e.g., Crawford et al., 2019; E. S. Johnson et al., 2021) researchers ensured each video segment was rated by more than one rater and randomized the order of the segments raters watched. Of the 31 studies that spanned elementary and secondary schools and the 49 studies that included multiple content areas, none reported assigning observers to particular grades or content areas based on observer expertise, a potential threat to bias because observers could rate teachers systematically differently in contexts in which they held expertise.
Authors of eight studies described examining results for evidence of bias. Chow and Kasari (1999) described conducting preliminary analysis for differences in observation results related to teacher gender or the school at which the observation occurred. Examining bias related to experience in special education, the purpose of Lawson and Cruz’s (2018) study was to examine differences in observation scores between observers with and without special education experience. E. S. Johnson and Semmelroth (2015) examined the factors that contributed to variance in observation scores; one of those factors was the rater. Five studies using RESET (Crawford et al., 2020; E. S. Johnson et al., 2021; E. S. Johnson, Moylan, et al., 2019; E. S. Johnson, Zheng, et al., 2019; E. S. Johnson, Zheng, et al., 2020a) examined the relative severity of each individual rater and calculated fair scores compensating for differences in rater severity. No studies reported exploring their results for systematic differences related to teacher race or ethnicity.
Conclusions about evidence to support scoring inference
The number of studies reporting evidence to support scoring inferences was low. A relative strength was the 58% of articles that reported results of IOA calculations, though many of those articles did not specify the statistic used. No one article reported all types of evidence coded in this section. Brady (1989) and Swank et al. (1989) reported most of the information; the only codes from this section they did not report on were whether the study’s purpose was masked to observers, how observers were assigned to classes, and whether researchers analyzed results for potential bias. Studies using RESET also reported most of this information.
Generalization Inference
Most studies did not describe strong evidence to support the generalization inference. Thirty-eight studies took place in inclusive general education classes, 43 in self-contained special education classes, and 15 across both types of classes. One study (Rich, 1979) conducted observations in a summer workshop for students with mild emotional disturbance. Five studies did not report the setting.
Thirty-five studies were conducted in elementary settings, 24 in secondary schools, and 31 across elementary and secondary settings. Twelve did not report grade level(s) observed.
Forty-nine studies examined multiple content areas. Of the 34 studies in a single content area, 23 (68%) observed English language arts; 16 (70%) of these focused on reading instruction. Social studies was the next most commonly observed content area, representing four (12%) of the content-specific studies. Physical education classes were the setting for three studies, and two studies each took place in math and science classes. Eighteen studies did not report a focal content area.
Sixty-nine studies reported the disability category of students in observed classes. Of those, 39 (57%) were conducted with teachers of students with varied disabilities. In disability-specific studies, 10 focused on classes for students with learning disabilities and eight for students with emotional and behavioral disorders. Classes of students with intellectual disabilities were the focus of four studies; another four studies related to students who were Deaf or hard of hearing. One study each focused on classes containing students with autism spectrum disorder (Kodak et al., 2018), visual impairments (Wolffe et al., 2002), acquired Deafblindness (Haakma et al., 2016), and varied physical disabilities (e.g., muscular dystrophy; Brulle et al., 1983). In 33 studies, researchers did not report the disability category of students.
For the 100 studies that reported the number of teacher participants (two did not), the mean was 26, with a range of 1 to 117 and a median of 17. Many studies did not report demographic information about participants. Just over half (n = 56) reported participants’ gender. Across those studies, 85% of teachers were women (15% were men). Only 26 studies reported the race or ethnicity of the participants. In those studies, 84% were White, 6% were Black/African American, and 7% were Latinx. Only one study (Serwatka et al., 1986) reported disability status of teacher participants; they observed three pairs of teachers, each with one who was Deaf.
Sixteen studies did not report the number of observations. Of those that did, the mean number of observations per teacher was 3.9 (SD = 3.0), with a mode of 3 (n = 27). Twenty-two studies did not provide enough information for us to calculate average length of observations. In the 80 studies that did report it, the mean observation length was 49.2 minutes, though it varied widely (SD = 63.3; the mode was 20 minutes (n = 11).
Seventy-four studies did not describe purposefully scheduling observations to capture variability in teachers’ instruction (e.g., ensuring all observations did not occur at the same time of day). Of the 28 studies that did report this, 3 (11%) randomized the time of day/block they observed, 2 (7%) scheduled observations across multiple times of day, and 17 (61%) scheduled observations at different times of year. Note that we coded studies in the latter category only when authors indicated they spaced observations out purposefully to capture a wider range of instruction; if they only reported the length of time over which observations took place, we did not consider that purposeful scheduling to support generalization.
Many studies (e.g., Englert & Thomas, 1982) reported asking teachers to identify a lesson that represented typical instruction. Because of the likelihood teachers would select a lesson representing better than average instruction, knowing they were being observed, we did not consider this strong evidence for the generalization inference unless researchers took measures to verify the chosen lesson was indeed typical. In one study, for example, (Haakma et al., 2016) researchers recorded and viewed multiple lessons, then selected one that represented typical instruction to code and analyze. Five studies used multiple methods of purposeful scheduling. Derevensky and Leckerman (1997), Hillen et al. (1992), and Larrivee (1982) scheduled observations at multiple times of the day and week. Larrivee (1982) also sampled across “activity type” (p. 3), although they did not define it. Wang et al. (2015) and Cipriano et al. (2018) randomized observation times and conducted observations at different points in the year.
Only seven studies reported analyzing for the potential impact of contextual factors on their results. Four of those (Brady & Taylor, 1989; Ciullo et al., 2016; E. S. Johnson, Zheng, et al., 2019; E. S. Johnson, Zheng, et al., 2020a) compared results of observations conducted at different times of the school year. Two studies (E. S. Johnson & Semmelroth, 2015; Stanovich & Jordan, 1998) reported analyzing whether the lesson observed seemed to impact the results. Prior to conducting a full analysis of the observational data, Chow and Kasari (1999) reported checking for systematic differences in results across times of the school year and across schools. When they found no such differences, they collapsed the data and reported results for the full sample.
Conclusions about evidence to support generalization inferences
Most studies reported the number of observations conducted. However, most did not report evidence that they sampled observations in ways that would provide generalizable conclusions about the population of instruction for which they were drawing conclusions. McIntosh et al. (1993) and the series of studies on RESET were particularly strong examples, as they reported on most of this evidence.
Extrapolation Inference
We found most studies did not provide strong evidence for the extrapolation inference.
Dimensions observed
Dimensions examined varied greatly across studies, including instructional practices, classroom management, general teaching tasks, grouping structures, co-teaching, and other dimensions. Categorizing dimensions proved quite difficult, due to the array of terms researchers used to refer to them and lack of specificity about what they meant by those terms. Note, this lack of clarity is itself a limitation to many studies’ support for the extrapolation inference, as clarity regarding the constructs to which one is trying to extrapolate is a necessary precondition for providing evidence to support the extrapolation inference.
Instructional practices
Instructional practice was examined in 89 studies. Researchers conceptualized this dimension in varied ways, focusing on characteristics (e.g., explicitness) or broader practices (e.g., modeling). For example, Klingner et al. (2010) reported how often teachers used reading comprehension strategies such as predicting, paraphrasing, and meta-cognition. Within the instructional practice dimension, we identified a major subset of observation instruments (n = 74; 83%) focused at least partially on discrete teacher behaviors directed toward students, specifically teachers’ verbal behaviors. For example, researchers noted whether feedback was positive or negative and the frequency of different kinds of feedback (e.g., Haakma et al., 2016). Researchers also evaluated various aspects of questioning, such as whether questions were open-ended (e.g., Klingner et al., 2010), academic versus nonacademic (e.g., Brady, 1989), or directed toward the whole class or individual students (e.g., Scott et al., 2011).
Classroom management
The 25 studies coded in this dimension included observations that address the systems and practice teachers used to manage the classroom and student behavior. Some focused on specific practices, such as positive reinforcement (B. Algozzine et al., 1988), scanning the classroom (Englert & Thomas, 1982), and redirecting off-task behavior (Levy & Vaughn, 2002). Others measured time spent managing behavior (e.g., King-Sears et al., 2014) or the quality of teachers’ classroom management overall (e.g., Bishop et al., 2010).
General teaching tasks
The 37 studies coded as general teaching tasks observed teachers’ classroom behaviors other than delivering instruction or managing behaviors. For example, researchers tracked how often teachers modified instruction (e.g., K. M. Algozzine et al., 1986) or provided individual support (e.g., Baker & Zigmond, 1990). Many studies documented monitoring, such as circulation during independent or group work (e.g., Ciullo et al., 2016) or assisting students (e.g., Mitchell et al., 2012).
Grouping structure
In 26 studies, researchers tracked grouping structure, primarily by recording the amount of time teachers spent working with different sized groups (e.g., Larrivee, 1982). Typical options included whole group, small group, individual, and no one.
Co-teaching
Eight studies focused on co-teaching, examining interaction patterns between co-teachers, grouping structures (e.g., the six co-teaching models; Friend, 2015), and teacher roles (e.g., teaching, monitoring). Other researchers simply recorded the presence or frequency of co-teaching (e.g., Magiera & Zigmond, 2005).
Other
In 53 studies, researchers observed dimensions of practice that did not fit in the above categories. Some captured teacher characteristics, such as “the ability to work with individuals as well as groups,” “proper listening skills” (B. Algozzine et al., 1988, p. 262), or whether teachers were impartial (e.g., Fletcher et al., 1999). Several collected data on when teachers were absent from the classroom (e.g., Ivarie et al., 1984) and teachers’ physical behavior, such as whether they could see all students (e.g., Englert & Thomas, 1982).
Strength of instrument content
Forty-nine studies did not include any definitions or examples of the dimensions observed. Twenty-two provided definitions only, four provided examples only, and 27 reported both definitions and examples. There are two important caveats to this. One is that we were generous in our coding of this variable, counting even articles that only provided definitions/examples for a subset of the items in the instrument. For example, some researchers (e.g., Rieth et al., 1987) only provided such information about one of many variables. The other caveat is that a definition or example had to be provided in the article itself, given our decision not to examine documents outside of our corpus. Therefore, if researchers only referred to another document (e.g., E. S. Johnson et al., 2021) and did not include any definitions or examples in the article, we coded it as not providing them.
In 32 studies, authors did not describe evidence collected during instrument development to support dimensions of instruction evaluated. Nine studies described conducting systematic literature reviews or soliciting expert reviews. Twenty studies referenced existing literature to support their instrument but did not explicitly describe a systematic review. Six studies described other methods for establishing appropriateness. For example, Webster and Johnson (1987) described a theoretical model on which they built their codebook, and Magiera and Zigmond (2005) and Seo et al. (2008) described basing their instrument’s content on previous studies. In 28 studies, researchers did not describe evidence of appropriateness of content but did provide a citation to previously published work describing the instrument.
Evidence of dimensions’ relationship with teaching quality
One study compared observation scores with other measures for the primary purpose of validating their interpretation of scores as a measure of teaching quality. E. S. Johnson, Crawford, Zheng, et al. (2020) compared rank order of teachers based on scores on the RESET and on an instrument based on Danielson’s Framework for Teaching. In 28 studies researchers compared observation results with results of other measures, examining correlations between scores and other constructs related to teaching quality, such as student behavior or achievement. Eight of the 28 (29%) compared observation results with another measure of teacher knowledge or behavior. For example, Nougaret et al. (2005) compared observation results with a teacher self-assessment. In eight studies, researchers compared observations with measures of student achievement. For example, Korinek (1987) reported correlations between teacher behaviors and correct oral responses from students. Kent et al. (2018) analyzed data using a two-level model to predict student learning by the amount of time teachers spent using specific instructional practices.
In nine studies, researchers compared teacher behaviors with measures of student behavior, most commonly student engagement/on-task behavior. For example, McKenna et al. (2015) reported correlations between teacher behaviors (e.g., praise, opportunities to respond) and student engagement. Englert and Thomas (1982) defined teacher effectiveness in classroom management by calculating the “mean percentage of total students who were on-task during seatwork activities” (p. 5). They then compared behaviors (e.g., interactions with students, teacher positioning) of the teachers rated as most and least effective, as determined by the student engagement measure. Researchers in three studies examined relationships between multiple measures. Stanovich and Jordan (1998) reported correlations between results from observation scores, a teacher attitude scale, and a principal rating scale. Brownell et al. (2009) compared student reading growth with teachers’ use of specific instructional practices and compared those practices with a measure of teacher knowledge about reading instruction. Finally, David and Kuyini (2012) conducted regression analysis examining the relationship of teacher factors (e.g., gender, age, experience), teacher attitudes about inclusion, self-efficacy, and an observation score representing facets of teacher instruction (not specifically defined).
Conclusions about evidence to support extrapolation inferences
Instructional practice was the most common dimension observed, although it is notable that most of those focused on a very specific type of instructional practice–teachers’ verbal behaviors, such as questioning and feedback statements. Slightly more than half of the studies presented definitions or examples for the variables observed within the published article, although some of these only reported them for a portion of the observed variables. About one quarter of included studies compared results from another measure with the observation results, though the methods of comparison were varied and often descriptive in nature, making it difficult to draw conclusions across them.
Changes in Validity Evidence Over Time
The evidence researchers reported to support validity arguments has changed in important ways over time, in some cases becoming stronger and in others becoming weaker. The number of studies per decade varied, with most studies (60%) occurring in the 1980s or the 2010s. There was a dip in studies in the 1990s and 2000s, representing 31% of the total studies, split fairly evenly across the two decades. In the following sections, we report how studies’ descriptions of the evidence for scoring, generalization, and extrapolation inferences have changed over time. Because we analyzed by decade, we did not include studies published before 1980 or after 2019 in the following analysis.
Scoring
Accuracy
The percentage of studies reporting observer training and requiring a minimum level of reliability in training has remained consistently high over time. The percentage of studies using the “gold standard,” comparing trainee observers’ scores with a master coder’s scores has increased greatly over time, with the notable exception of the 14 studies published between 2000 and 2009, in which none did so. However, from 2010 to 2019, 15 out of 34 studies (44%) employed master scores during training.
Consistency
The percentage of observations that were double-coded in each study was higher in the past two decades (43% and 43%, respectively) when compared with those published in the 1980s and 1990s (20% and 23%, respectively). The percentage of studies in which researchers reported whether they conducted recalibration activities during data collection has stayed consistently low over time.
Lack of bias
The average number of observers per study slightly decreased over time until the 2010s; studies published between 1980 and 1989 reported the highest number, with a mean of 6.8 (SD = 5.0). The percentage of studies reporting that the purpose of the study was masked to the observers has stayed consistently low across time, as has the percentage reporting purposeful assigning of observers and the percentage describing analysis of potential bias.
Generalization
The setting in which observations occurred shifted over time toward more inclusive settings, which would be expected, given the rise in inclusion in recent decades (Williamson et al., 2019). The only decade in which observations in self-contained settings outnumbered those in general education settings was the 1980s, in which 14 studies out of 27 (52%) were set in self-contained settings only. In the 1990s and 2000s, about one third of the studies were conducted solely in self-contained classrooms; in the 2010s, it was about one fourth. The rest were split between general education only and a mix of general and special education classes. Observations in secondary classrooms represented the smallest percentage of studies in each decade, except in the 1980s, when secondary and elementary each represented eight studies (30%). Six of the studies from the 1980s (22%) did not report the grade level, as opposed to only one or two studies in each subsequent decade. Observations in each decade were almost exclusively done across content areas or in English language arts. The few studies (n = 11) that took place in other content areas (i.e., math, science, social studies, physical education) were almost all conducted since 2000, with the exception of social studies; three of those were conducted by the same research group in the 1980s (i.e., Brady, 1989; Brady & Taylor, 1989; Swank et al., 1989).
As expected given advances in technology, all video observations were published after 2000. In every decade, most studies were conducted in classrooms with students identified with varied disabilities. All studies that reported teachers’ race or ethnicity have been published since 1990, and the percentage that reports this information has approximately doubled each decade since, with 15 out of 34 studies (44%) reporting it between 2010 and 2019. Teachers’ gender has been reported in studies in every decade, with the percentage reporting increasing every decade; 25 out of 34 studies since 2010 (74%) reported teachers’ gender.
Interestingly, the average number of observations conducted per teacher has decreased over time, with a mean of 6.1 (SD = 4.8) in the 1980s and a mean of 2.8 (SD = 1.4) in studies in the 2010s. The average length of observations has been more variable, but the mean length has been lower in the two decades since 2000 than in the prior two decades. The percentage of studies reporting purposeful scheduling of observations has remained consistently low over time, as has the percentage reporting analyzing the results for potential impact of context.
Extrapolation
Most studies in our corpus did not compare results of the observations to any other measure. However, one change over time is that six out of the eight observations that compared observation results with a measure of student behavior were published in the 2010s.
Discussion
Overall, we found many studies did not report strong evidence that could be used to support inferences associated with validity of observation instruments. We also noted some small but significant changes over time regarding the information that has been reported in observation research of teachers for students with disabilities.
Critique and Directions for Future Research
We first critique the extent to which extant studies have provided evidence to support scoring, generalization, and extrapolation inferences, providing specific recommendations for how researchers could better support these inferences in future research. We then provide general recommendations for how studies could, overall, enhance the validity of their uses of observation systems in future classroom observation research.
Validity Inferences
Scoring inference
Most studies included in our corpus provided minimal evidence to support the scoring inference, but we found relative strengths in the widespread use of rater training and reliability, both of which are intended to provide evidence of the accuracy of raters’ assessments of teaching practice. Given the historical emphasis in special education on identifying discrete, low inference teacher behaviors (e.g., feedback), this emphasis on accuracy is not surprising, as observers must be skilled in precisely identifying and classifying behaviors. Training and reliability are a common way of ensuring observers have a clear understanding of the discrete differences between behaviors and then communicating that to readers.
However, our findings suggest room for growth. In more than half of the included studies, researchers failed to report using any strategies to enhance consistency (e.g., double scoring observations) and minimize bias (e.g., randomly assigning observers, masking observers to condition). This is concerning because claims that comprise the scoring inference are interdependent; accurate scores depend on consistent and unbiased ratings. It is difficult to claim scores appropriately reflect observed teaching practice without attending to the consistency of observers’ assessments and the inherent bias that observers—humans with their own beliefs, experiences, and knowledge—carry into observations (Bell et al., 2019). Omission of strategies to address consistency and bias may result in data that do not account for the extent to which observers’ cognitive work is the foundation of this research (Bell et al., 2019). Strategies such as recalibration (to help correct for observer drift) support observers after initial training, providing them practice and feedback to maintain accuracy and minimize error over the course of a study (Pianta & Hamre, 2016). This type of support is especially important for studies in which observations are conducted over longer periods of time or multiple observers are deployed.
There are several potential explanations for these findings. First, strategies to promote consistency may have been subsumed into researchers’ conception of training, or perhaps these strategies were embedded in studies’ designs but not reported in the articles. This issue could be ameliorated through online Supplemental materials, which provide more room for researchers to share technical details. In the future, journal editors could require that authors report information regarding strategies used to train and support raters, thus making this reporting a standard part of the peer review process. Second, it is also possible efforts to enhance the scoring inference were unsuccessful, undermining confidence in findings, and thus researchers chose not to include them. This could be addressed through open science practices (Cook et al., 2018), which place the onus on researchers to fully report and then make sense of their findings in light of these data. A third plausible explanation is that researchers have historically used claims of accuracy (based on training, reliability) as a proxy for more comprehensive evidence to support the scoring inference. In other words, this may be a result of insufficient researcher knowledge. We recommend scholars look to some of the stronger studies in our corpus as exemplars of how to design an observation system to support both accuracy and consistency (e.g., Lawson & Cruz, 2018; Swank et al., 1989; Wexler et al., 2018). For example, Wexler et al. (2018) depict how they trained and supported observers, providing evidence that all scores were attuned to the same standard of measurement. Yet, even in these exemplar studies, researchers did not report using strategies to reduce bias, a significant problem when we consider how observer choices—shaped by knowledge and beliefs—introduce error into data collection (Pianta & Hamre, 2016).
Generalization inference
The generalization inference assumes the instruction observed is representative of the population of instruction about which researchers are drawing inferences. We found many studies did not include information about the contexts and participants in their studies, precluding support for the generalization inference.
From the studies that do report this information, we identified many underrepresented participant groups. We only found one observation study focused on teachers of students with autism spectrum disorder and none for attention deficit hyperactivity disorder. Intervention researchers have identified specific teaching strategies for these populations (e.g., DuPaul et al., 2011; Wong et al., 2015), but extant research provides almost no indication of the prevalence of those strategies in typical school settings (outside of intervention research). Research on secondary teachers is also limited. This is consistent with previous analyses of special education research, which have identified limited research in secondary settings (e.g., McKenna et al., 2015). Though few observation studies focused on co-teaching, they show an opposite trend; there is little observation research on co-teaching in elementary schools. Research is also lacking in content areas other than English language arts. Some instructional practices are recommended across content areas, but there are also specific practices identified as evidence based for students with disabilities in specific contents (e.g., Gersten et al., 2009; Scruggs et al., 2010); extant research provides scant information about the instructional practice occurring in those content areas for students with disabilities.
One encouraging finding was that researchers are reporting demographic information about teacher participants more frequently as time goes on, which is important in observation research, given that there is some evidence men and teachers from minoritized racial/ethnic groups may systematically receive lower assessments of effectiveness than women and White teachers (e.g., Drake et al., 2019). However, despite increased reporting of demographics, we found researchers have not analyzed their results for these potential biases.
Finally, we found many researchers did not describe scheduling observations to strengthen the generalization of their results to teachers’ typical practice. As with the scoring inference, it may be that researchers schedule observations carefully and simply do not report this. However, without this information, it is difficult for readers to be certain the results truly represent a teacher’s typical practice. Studies have found, for example, teachers’ interactions with students can vary based on the time of day or the type of instructional activity (e.g., Curby et al., 2011). Therefore, if researchers schedule all observations in a short period of time or at the same time of day, they may capture noise associated with the context, limiting their capacity to draw valid inferences about typical practice. Even researchers who did carefully schedule observations to consider context did not consistently analyze their results for potential effects of context.
Extrapolation inference
When we examined evidence to support the extrapolation inference, the most striking finding was the frequent lack of complete definitions and examples of the observed dimensions of teachers’ practice. In many studies, it was difficult even to ascertain what was being observed. This may be a result of page limitations in publishing, but it is a substantial problem. Even seemingly straight-forward variables, such as teacher questioning, could be interpreted differently by researchers. Vague definitions and examples are particularly problematic, however, when researchers are examining broader dimensions of teaching, such as classroom management, which can be interpreted in widely different ways. Without a clear conception of how researchers defined variables of interest, it is difficult to evaluate the extent to which those variables may be related to teaching quality.
Relatedly, many researchers did not report taking steps to verify the appropriateness of the content of their observation instruments. This was largely true even in cases where the researchers developed the instrument for the study or when they adapted an existing instrument. In the latter case, researchers may have assumed because the instrument developers conducted content verifications, they did not need to conduct their own, but to provide evidence for extrapolation, verification of at least the adapted content would be important.
Most studies did not compare observation results with other measures, and only one did so to provide evidence of validity; others examined relationships with other measures to answer a substantive research question (e.g., relationship between knowledge and practice; Brownell et al., 2009). However, when combined with lack of detail about content, researchers often provided only weak evidence to support the inference that observed variables relate to teaching quality.
General Critique and Directions
These findings also highlight the need for research examining evidence for implications inferences, which was outside the scope of this review. Taking a cue from research examining replication (Therrien et al., 2016), conducting progeny reviews that focus on the most prominently used observation systems in our corpus could help to understand how results of observation research are taken up. This is consistent with advice from researchers in educational measurement to focus attention on established instruments (e.g., Pianta, 2012).
One concern is the sheer number of different observation systems used in special education research, which makes it difficult to draw conclusions across studies. One reason for this variety could be that there are few instruments which have been well-validated for use with special educators; because few extant studies provided strong evidence to support validity inferences, researchers may be hesitant to adopt the systems previously used.
One group of studies and related articles presents a stark contrast to the general pattern, and, for this reason, is worth exploring in more detail. In recent years, E. S. Johnson, Crawford, and colleagues have worked to develop the RESET observation system. Their development process is illustrative of a sequence of studies that provide valuable evidence other researchers can use to appraise the validity of RESET for their own purposes. A full description of their development process is beyond the scope of this article; however, a detailed description of the range of validation work the researchers have conducted, aligned with Kane’s (2013) interpretive use argument approach, is summarized in Johnson, Crawford, Moylan, et al. (2020). Here we provide an overview of the evidence provided in their published articles to demonstrate how providing evidence related to validity might support readers in making appropriate appraisals of classroom observational research.
RESET is an observation system consisting of 21 rubrics, each one aligned to a type of evidence-based practice (e.g., explicit instruction, E. S. Johnson, Zheng, et al., 2019; reading comprehension, E. S. Johnson, Moylan, et al., 2019). The researchers used the evidence-centered design framework to guide their development process (see E. S. Johnson et al., 2018). The content of each rubric was developed by conducting systematic literature reviews related to the central practice, consulting experts for feedback, and watching videos of special educators teaching; the research team is explicit about this process across articles and observation rubrics underneath the broader umbrella of RESET. To examine how the rubrics perform in naturalistic classroom settings, the researchers have conducted a series of studies employing many-facet Rasch measurement, which allows them to investigate the difficulty of each item on the rubric as well as the ways in which various components relate to raters’ scores (e.g., rater severity, rater experience). In one study (E. S. Johnson, Crawford, Zheng, et al., 2020), as mentioned above, they compared teachers’ scores on the RESET with their scores on the Framework for Teaching instrument, an observation instrument that is commonly-used in schools but researchers have found may not adequately support principles of effective special education instruction (see Jones & Brownell, 2014; Morris-Mathews et al., 2020).
The studies conducted thus far presenting the validity evidence for the RESET are rigorous; the evidence provided in the published articles is rich and would provide a wealth of information researchers can use to appraise whether the RESET is appropriate for their intended use(s). For example, researchers would be able to determine at what levels of reliability raters use the rubrics (e.g., E. S. Johnson, Zheng, et al., 2020a), information that can support the scoring inference. Furthermore, the published studies provide a wealth of information regarding factors that contribute to scores on the RESET (e.g., E. S. Johnson, Zheng, et al., 2020b), which can be used to support the generalization inference. Additionally, in support of the extrapolation inference, researchers could identify with which populations of participants the RESET has (and has not) been used and whether time of year of the observations creates systematic differences in scores (e.g., E. S. Johnson, Zheng, et al., 2019). The developers’ intended use of the RESET system is to provide instructional feedback to teachers (E. S. Johnson, Crawford, Moylan, et al., 2020); if a researcher were considering using the RESET for that or another purpose, published studies from this line of research provide a strong foundation for that researcher’s appraisal of the instrument’s validity.
Others in the field of special education are undertaking this work as well; a more recent observation system, initially developed for use with preservice teachers, is undergoing a similar development process. Pua et al. (2021) focused their attention on building a strong validity argument for use of the Preservice Observation Instrument for Special Education with preservice teachers. In subsequent studies, they have built further evidence that supports its use with K–12 special educators (Jones et al., 2021). Examining the ways the RESET and Preservice Observation Instrument for Special Education developers build a validity argument, disseminate their findings, and how other stakeholders such as policy makers, district personnel, and school leaders make sense of and take up findings could be an important contribution for future research.
Limitations
As with any research study, there are limitations to ours, which point to potential future research studies that might support or add to our findings. First, we only included observations in naturalistic settings (i.e., not intervention studies); our results may have been different if we had included other types of studies as well. Additionally, we did not examine the results of the included studies or the claims the authors made with regard to those findings. These claims have important implications for validity, depending on whether the researchers’ methods (e.g., instrument chosen, participant sample, observation schedule) support the claims they make. We also did not examine the authors’ stated purposes of the studies, which is another important consideration in the argument approach to validity (i.e., whether the chosen instrument and methods support the stated purpose). We found the purposes were so varied across the 102 studies that an analysis of them across out entire corpus would perhaps not have been meaningful. Additionally, researchers’ claims sometimes did not align with their stated purpose in the beginning of the article, adding complexity to this analysis. An important area for future research would be to analyze stated purposes and claims of a subset of these studies and the alignment of those purposes and claims with the observation systems used. Additionally, we judged as outside the bounds of our study the ways in which the included studies have been taken up by later researchers or policy makers, which are important aspects of the implication inference. This again would be an important area for future research.
Conclusions
Our findings demonstrate the importance of including specific details related to methods taken in observational research. Because findings from observational research are often used as catalysts for intervention studies and as justifications for policy decisions (e.g., increased use of inclusive settings), it is essential that those who wish to take up observational findings be able to appraise the relevance and validity of those findings for their intended purposes. Without information regarding, for example, included participants, dimensions observed, methods for training observers and scheduling observations, and analysis for potential impacts of bias and context, such evaluation is hindered. Improvements in technology and increased expectations for transparency in research methods combined with the availability of online Supplemental materials in publication should lead to improved reporting in future observational studies.
Supplemental Material
sj-docx-1-rer-10.3102_00346543211042419 – Supplemental material for Observation Studies in Special Education: A Synthesis of Validity Evidence for Observation Systems
Supplemental material, sj-docx-1-rer-10.3102_00346543211042419 for Observation Studies in Special Education: A Synthesis of Validity Evidence for Observation Systems by Wendy J. Rodgers, Hannah Morris-Mathews, John Elwood Romig and Elizabeth Bettini in Review of Educational Research
Footnotes
Notes
Authors
WENDY J. RODGERS is an assistant professor of special education at Virginia Commonwealth University, Box 842020, 1015 West Main Street, Richmond, VA, USA; email:
HANNAH MORRIS-MATHEWS is an assistant professor at the University of Florida, 2 1713L Norman Hall, PO Box 117050, Gainesville, FL, USA; email:
JOHN ELWOOD ROMIG is an assistant professor at the University of Texas at Arlington, 701 South Nedderman Drive, Arlington, TX, USA; email:
ELIZABETH BETTINI is an assistant professor in the Special Education Program at Boston University’s Wheelock College of Education and Human Development, 2 Silber Way, Boston, MA, USA; email:
References
Supplementary Material
Please find the following supplemental material available below.
For Open Access articles published under a Creative Commons License, all supplemental material carries the same license as the article it is associated with.
For non-Open Access articles published, all supplemental material carries a non-exclusive license, and permission requests for re-use of supplemental material or any part of supplemental material shall be sent directly to the copyright owner as specified in the copyright notice associated with the article.