
Abstract
A national scholarship program provided by the Bill & Melinda Gates Foundation is designed to improve access to and success in higher education for low-income high-achieving minority students by providing them with full tuition scholarships and non-monetary support. We use a regression discontinuity approach to investigate whether the receipt of the scholarship changes the use of time and participation in different activities among college students during their freshmen and junior years. We find that receiving a Gates scholarship reduces hours worked per week, as well as influencing high participation in volunteering activities and cultural events. The sub-group analyses reveal racial/ethnic differences in the allocation of time to and the levels of participation in various activities in response to the Gates scholarship.
H
Education policies are often designed to change the relative tradeoffs among students’ alternative uses of time. For instance, the provision of student financial aid acts as an income increase to students by reducing financial constraints. Such an income shock may allow students to reduce or avoid working while in college, thereby freeing up time to allocate to other academic and nonacademic activities. Increasingly, institutional, governmental, and privately provided financial aid programs are, at least partially, designed to provide students with sufficient financial support so that they can concentrate on academics (e.g., Georgia’s HOPE scholarship program) and presumably reduce self-help including loans (e.g., Princeton’s “Aspire” and Michigan’s M-PACT loan elimination programs) and/or the work component for students (Henry & Rubenstein, 2002; Tilghman, 2007).
One national scholarship designed to reduce the financial constraints of students is the Gates Millennium Scholars program (henceforth GMS). Established by the Bill & Melinda Gates Foundation in 1999, the stated goal of this program is to establish a cadre of future leaders by improving access to and success in higher education for low-income, high-achieving minority students in the United States by providing them with scholarships and nonpecuniary support. As noted by Melinda Gates when announcing the program’s establishment, “If we can ease the financial strains many students encounter, hopefully they can focus their full efforts on academic pursuits” (“Bill and Melinda Gates Announce,” 1999).
To determine whether the GMS program is successful in achieving this goal, we assess whether GMS participation materially changes the work, academic, and nonacademic choices of recipients while enrolled in college for each of the minority groups covered by the scholarship (e.g., African Americans, Asian Americans, Native Americans, and Latinos/as). Specifically, we focus on the extent to which GMS program participation affects students’ allocation of time among competing uses including studying, working, and various types of other extracurricular activities, and we employ regression discontinuity techniques to estimate these effects. Given the selection mechanism used to choose the Gates scholars, we believe this technique is optimal for making inferences about the effects of the GMS on students’ time allocation choices.
This article is organized as follows: In the next section, we discuss the literature related to how students allocate their time while enrolled in college and then discuss the theoretical foundation of our research. To establish the context, we provide details about the GMS program, followed by a presentation of the estimation strategies used, a presentation of the empirical results, and a discussion of the results. In the final section, we discuss the limitations and implications of the study and provide some concluding thoughts.
The Role of Student Time Allocation in College
Allocation of time while enrolled in college is crucial to the academic and nonacademic development of students. As noted by Kuh and associates (2005), “What students do during college counts more in terms of desired outcomes than who they are or even where they go to college” (p. 8). Kuh cited as evidence “the voluminous research on college student development” (in particular, reviews of the research by Astin, 1993; Pace, 1980; Pascarella & Terenzini, 1991, 2005) that indicates that “the time and energy students devote to educationally purposeful activities is the single best predictor of their learning and personal development” (p. 8). How much time students are willing or able to devote to their academic activities is, however, also related to the activities that compete for their time. Therefore, our discussion of the literature is organized around the main ways students allocate their time while enrolled in college, namely, studying, working, and being involved in extracurricular activities. We are especially attentive to the connections between each form of time allocation and postsecondary outcomes such as grades and completion. These relationships underscore the importance of this analysis in understanding the overall degree attainment process and offer insight into opportunities for policymakers to directly and indirectly affect attainment through programs such as the GMS.
Time Allocated to Studying
The relationship between studying and academic performance has been examined by a number of researchers (Terenzini, Springer, Pascarella, & Nora, 1995) and the amount of time that students spend studying is often used as a proxy for the degree of engagement, effort, or commitment students allocate to academics.
Where grades are the outcome, the findings are mixed: Some evidence suggests that the amount of time spent studying is not directly related to individual course grades (Schuman, Walsh, Olson, & Etheridge, 1985) or one’s overall grade point average (GPA; Mouw & Khanna, 1993; Nonis & Hudson, 2006; Plant, Ericsson, Hill, & Asberg, 2005), whereas others find a positive relationship (George, Dixon, Stansal, Gelb, & Pheri, 2008; Lahmers & Zulauf, 2000; Michaels & Miethe, 1989; Stinebrickner & Stinebrickner, 2004, 2008; Young et al., 2003). Analyses of data from Berea College address several methodological and data limitations of other studies by using longitudinal samples, adjusting for participants’ biased estimates of time spent studying, controlling for selection problems by adding instrumental variables, and examining both daily and weekly study time. The authors conclude that studying has a positive influence on 1st-year student grades; specifically, they estimate that a 1-hour increase per day in time spent studying is associated with the same increase in first semester GPA as a 5.2-point increase in ACT Composite score (Stinebrickner & Stinebrickner, 2008). However, the relationship may be nonlinear and the effects may decline as study time increases (Stinebrickner & Stinebrickner, 2004).
Typical of the research on undergraduate study time are single-institution designs (Lahmers & Zulauf, 2000; Lammers, Onwuegbuzie, & Slate, 2001; Plant et al., 2005; Rau & Durand, 2000; Schuman et al., 1985; Stinebrickner & Stinebrickner, 2004) with small sample sizes (Beer & Beer, 1992; Michaels & Miethe, 1989; Plant et al., 2005). However, variation across institutions likely explains differences in results about the effects of student time allocation (Michaels & Miethe, 1989). For example, Kuh (1999) reported that although full-time undergraduates commit less time to class and studying today than they did in the 1980s, students at small liberal arts colleges spend disproportionately more time on these academic activities than their peers at other types of institutions. Individual student characteristics and behaviors likely mediate the relationship between studying and academic achievement as well. Incoming academic ability, represented by students’ ACT Composite scores (Lahmers & Zulauf, 2000; Nonis & Hudson, 2006) or high school class rank (Michaels & Miethe, 1989), mediates the results of studying on college GPA, as those with higher prior achievement appear to benefit more from time spent studying. Michaels and Miethe (1989) found that increased levels of study time while in college are associated with higher GPAs for freshman and sophomore students, although no significant differences are observed in the relationship between weekly study time and junior or senior year GPA.
Time Allocated to Employment-Related Activities
Full-time undergraduate students today spend more time working in paid employment than they did in the past (Riggert, Boyle, Petrosko, Ash, & Rude-Parkins, 2006; Stern & Nakata, 1991). According to the 2003–2004 National Postsecondary Student Aid Survey (NPSAS), more than two thirds of students at 4-year institutions are employed in on- or off-campus jobs while enrolled, with 23% working full-time and 47% working part-time. The main reasons often cited for working are the need for spending money, to finance basic living expenses, and to assist in paying their tuition (Dundes & Marx, 2006). Students also report that working offers a chance to identify future career options, enhance their interpersonal and time management skills, create networking opportunities, and connect to the society (Cheng & Alcantara, 2007).
Whether committing to paid employment comes at a cost to academics is not clear (Pascarella & Terenzini, 1991; Riggert et al., 2006). Some evidence suggests that working students do not cut back on their study time and instead reduce time dedicated to sleeping, socializing, or leisure activities (Cheng & Alcantara, 2007; Fjortoft, 1995; Miller, Danner, & Staten, 2008). Yet, Lammers et al. (2001) found a negative relationship between time spent working and time spent studying as well as a positive relationship between good study skills and time spent studying. Miller et al. (2008) reported that binge drinking and lower academic performance are associated with working 20 hours per week or more but not with working fewer than 20 hours per week. Other researchers, however, do not find a significant relationship between the amount of time that students are employed and their academic performance (Dolton, Marcenaro, & Navarro, 2003; Ehrenberg & Sherman, 1987; Furr & Elling, 2000; Leppel, 2002; Nonis & Hudson, 2006; Rau & Durand, 2000; Svanum & Bigatti, 2006).
With regard to student learning, Pascarella, Edison, Nora, Hagedorn, and Terenzini (1998) found little evidence that on- or off-campus employment detrimentally affects students’ learning or cognitive development, even when the amount of time spent working exceeds 20 hours per week. Nor do these authors find differences in the influence of working on cognitive development based on student age, gender, ethnicity, pre-college cognitive ability, or socioeconomic status. Similarly, Lundberg (2004) found that whereas students who are employed more than 20 hours per week off-campus spend less time engaged with faculty and their peers in academic activities, no differences in their learning are observed. However, time spent working may inhibit the development of critical thinking skills, preference for higher order cognitive tasks, and internal locus of attribution for academic success among first-generation students (Pascarella et al., 2004).
However, as the number of hours worked per week increases, students face restrictions on their academic study such as the inability to carry a full credit load, limited class choices, and reduced access to academic libraries, as well as less time to spend studying (Horn, 1998; Lammers et al., 2001). Horn’s (1998) analyses of the 1996 NPSAS data suggest that students who work at least 15 hours per week perceive that their academic performance is negatively affected by their employment. Also, Stinebrickner and Stinebrickner (2003) reported that working during the first semester has a negative influence on one’s GPA, albeit at a small college in Kentucky. After controlling for study skills, hours spent studying per week, age, gender, and social class, Lammers et al. (2001) found a small but significant and negative relationship between hours spent working per week and GPA for a sample of 366 undergraduate Education students.
Beyond its effect on grades, learning, or persistence, working while in college may also influence students’ career opportunities. Adjusting for student self-selection by employing several different instrumental variable techniques, Light (2001) estimated that a male student who accumulates the equivalence of 2 years of work experience while completing 16 years of schooling will earn at least 10% more in his first job after college than a peer who does not work while in high school or college. Using the same National Longitudinal Survey of Youth 1979 (NLSY79) data collected by U.S. Bureau of Labor Statistics as Light, Hotz, Xu, Tienda, and Ahituv (2002) employed econometric techniques to control for selection bias and observed higher post-college earnings associated with college employment for all race/ethnic groups.
In combination, the relationship between hours worked and college success appears to be more complex relative to the case of hours spent studying. The mixed findings concerning the effects of student employment are due in part to sample differences, as many of the studies focus on a single institution. Differences in the level of aggregation of work-related variables (e.g., distinctions between on- and off-campus jobs, distinctions between types of work) as well as differences in statistical techniques and model specification may also contribute to variations in the results (Riggert et al., 2006). The limited evidence appears to suggest that students who are employed off-campus or spend more than 20 hours per week working have lower chances of degree completion, whereas those who limit their employment to on-campus jobs and work fewer hours have an enhanced probability of persistence (Pascarella & Terenzini, 1991, 2005).
Allocating Time to Other Activities
In addition to academics and employment, college students spend their time engaged in a wide variety of extracurricular and co-curricular activities, including participation in community service opportunities, student clubs, and intercollegiate athletics. Despite limited evidence, co-curricular and extracurricular activities appear to promote both academic and nonacademic outcomes. Community service and service learning increase classroom learning and course grades (Markus, Howard, & King, 1993) and are associated with longer term influences on students’ values, attitudes, and educational outcomes such as graduate school attendance and degree attainment (Astin, Sax, & Avalos, 1999). Co-curricular involvement, including participation in campuswide and departmental activities, student clubs, and leadership positions, is associated with self-reported gains in cognitive skills, communication skills, interpersonal interactions, critical thinking, and self-confidence (Gellin, 2003; Huang & Chang, 2004). Lohfink and Paulsen (2005) found that participation in student clubs has a significant positive effect on 1st- to 2nd-year persistence for continuing, but not first-generation students.
Contrary to general club activities, researchers have found little to no significant relationship between Greek membership and critical thinking, and a negative influence on students’ openness to diversity (Pascarella & Terenzini, 2005). In contrast, other studies reported that involvement in Greek life activities has several positive outcomes, including higher levels of academic effort and increased retention rates (Moore, Lovell, McGann, & Wyrick, 1998; Tripp, 1997). With regard to intercollegiate athletics, several studies found no effect on grades associated with athletic participation, even after controlling for many confounding variables (Aries, McCarthy, Salovev, & Banaji, 2004; Hood, Craig, & Ferguson, 1992). Participation in intercollegiate athletics does, however, appear to positively influence persistence and is related to gains in interpersonal skills and self-confidence (Pascarella & Terenzini, 2005; Schulman & Bowen, 2001).
Research and Policy Implications of the Literature
The review of the research on the relationship between student time use and a range of educational outcomes provides insights into how students’ time devoted to studying, working, and other extracurricular and co-curricular activities directly and indirectly affects their academic and nonacademic success. Although there is ample attention to how students’ time allocation choices affect educational outcomes, there is a dearth of evidence about antecedents of time allocation, for instance, whether and how aid policies and programs such as the GMS affect students’ time use during college. This study fills this gap in the literature by examining the process by which financial aid, in particular the GMS scholarship, influences students’ allocation of time to studying, working, and other extracurricular activities while in college. A better understanding of this relationship will be especially informative for policymakers interested in promoting college student success. If the GMS improves college outcomes by giving students additional time to focus on academic and extracurricular activities, then there may be opportunities to intervene with similar programs, thus structuring students’ experiences to maximize their chances of engaging more fully in the learning process and ultimately completing their degrees.
The Theoretical Framework
We use the human capital-based theory of time allocation proposed by Becker (1965) as a conceptual framework for our study. Developed by Becker (1993) and Schultz (1961), human capital theory applies microeconomic concepts and models to the study of the choices and behavior of individuals (or households) and establishes the conceptual relationship between schooling, individual productivity, and returns in the labor market (Becker, 1965; Cohn & Geske, 1990; Mincer, 1958). Becker’s theory of time allocation can be viewed as the application of the microeconomic model of household choice, where households are both consumers and producers of goods and services and attempt to maximize their utility function, which comprises the consumption and production of these commodities (DesJardins & Toutkoushian, 2005; Paulsen, 2001). Novel in his approach is the explicit inclusion of time as a factor when making schooling decisions. Particularly important is the opportunity cost of time (e.g., earnings that a student forgoes while enrolled), which is often the largest indirect individual cost of attendance.
Students allocate their time and effort among several competing activities such as studying, work, and leisure, subject to time and effort constraints (Levin & Tsang, 1987). Ben-Porath (1967) and Becker (1967) suggested that if a college student undertakes both leisure and work in the given period, schooling activities will substitute only for work hours (as the foregone-earnings approach predicts) and that the efficiency of schooling activities decreases as hours of work increase.
In the presence of liquidity (or borrowing) constraints, however, individuals face difficulty in financing a college education and instead are likely to allocate part of their time to working in order to reduce this constraint. Parental transfers of income and resources to their children, as well as financial aid such as the GMS scholarship, can also substantially affect student time allocation decisions, such as reducing work during college and allocating more time to studying and extracurricular activities. If students are able to spend more time engaged in nonemployment activities over the entire span of their college career, as the GMS scholarship permits, our review of the literature suggests that this will positively affect the students’ academic outcomes, such as grades, retention, and completion.
The theoretical framework discussed above is the basis for our hypothesis that the GMS scholarship influences students’ allocation of time to studying, working, and other extracurricular activities and that GMS scholars are more engaged in studying and extracurricular activities and work fewer hours than nonscholars. The next section provides details about the GMS program and whether it affects the way students allocate their time to various activities while in college.
The Empirical Approach
The Gates Millennium Scholars Program
The GMS program is a $1 billion, 20-year-long project designed to promote academic excellence by providing higher education opportunities for low-income, high-achieving minority students. To be accepted, high school students who apply for the program must meet a number of eligibility criteria. Cognitive assessment measures are used to judge the academic potential of applicants (e.g., the academic rigor of their high school course work, and they must have 3.33 or higher high school GPA), and noncognitive measures are also used in the selection process. With regard to the noncognitive selection component, students must answer a series of questions developed to measure an applicant’s noncognitive abilities. 1 The answer to each of these questions is scored by trained raters and a total noncognitive test score is assigned to each applicant. Thresholds on these noncognitive tests are established that vary by racial/ethnic group and by matriculating cohort 2 and are used as another program selection mechanism. Table 1A (see the appendix) provides detailed descriptive information about both the cognitive and noncognitive tests for the entire sample and the sample around the cutoff point. In keeping with the goal of the program to fund needy students, applicants must also demonstrate financial need by documenting that they are Pell Grant 3 eligible. Finally, only U.S. citizens/legal residents are eligible for the program.
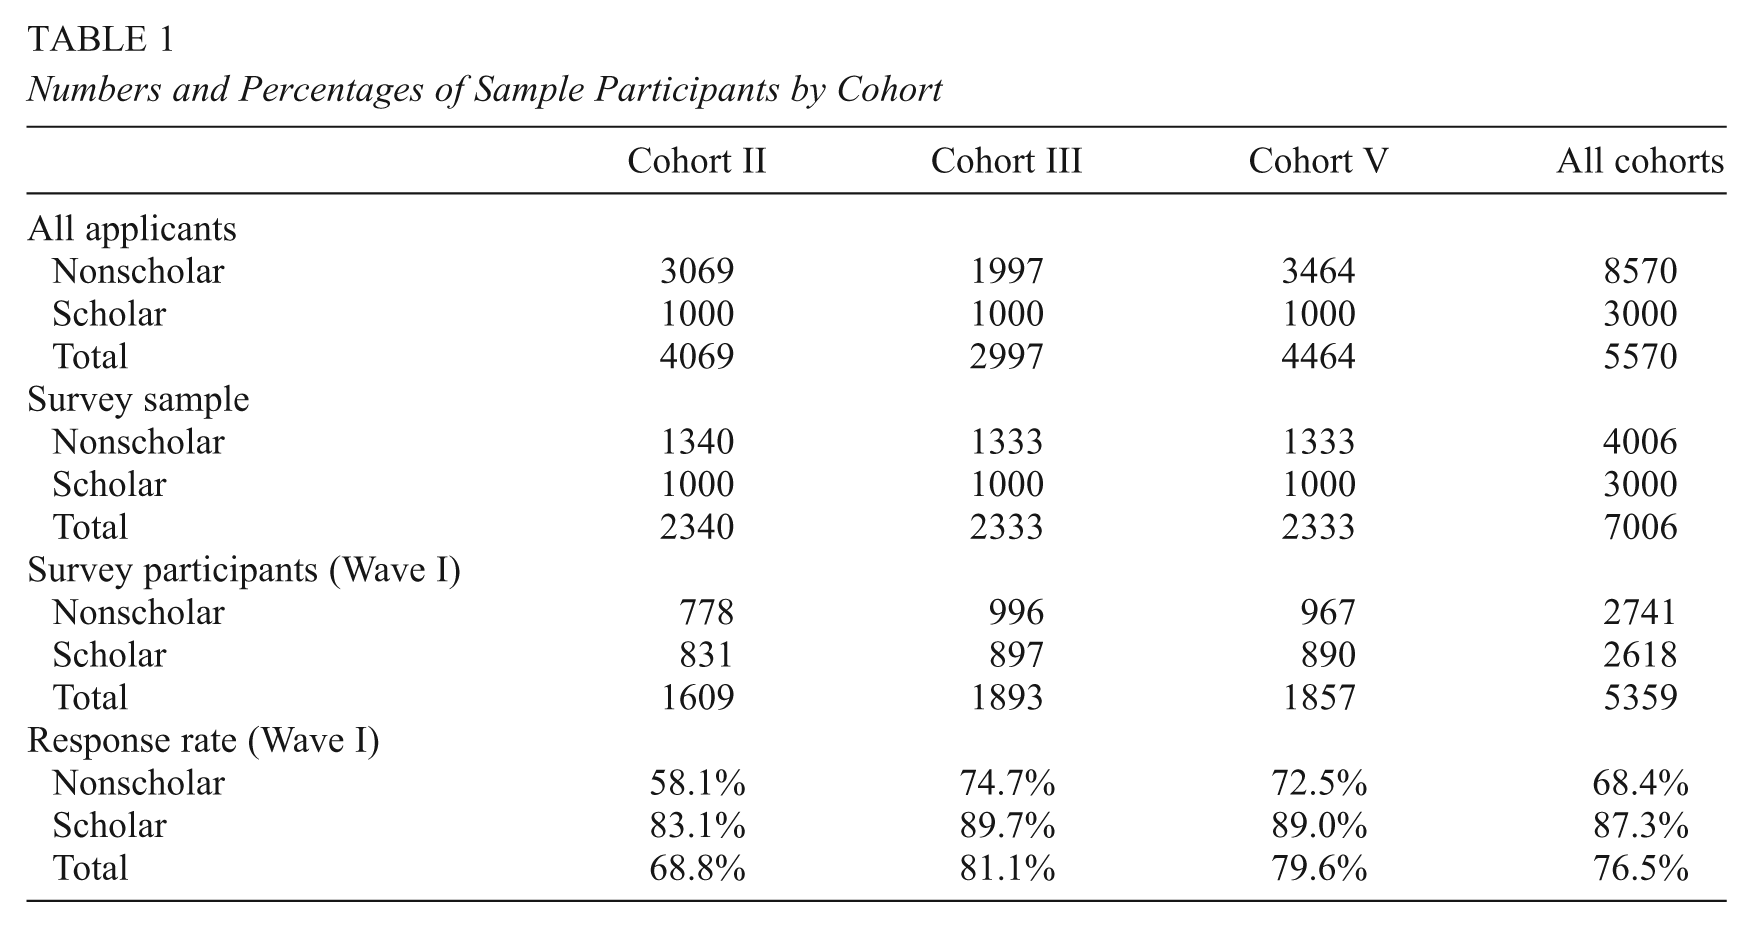
Of the 3,000 to 4,500 students who apply for the program in a given year, about 1,000 of them are eventually selected for the program. Table 1 provides information about the number of applicants, students surveyed, and participants for each of three entering cohorts used as the sample for this study. These three cohorts include individuals entering college in fall 2001 (known as Cohort II), fall 2002 (Cohort III), and fall 2004 (Cohort V). Noteworthy is that the vast majority of students are disqualified because their noncognitive test is lower than the established threshold (cut score) for acceptance.
Numbers and Percentages of Sample Participants by Cohort
The scholarship is a “last dollar” award, meaning that it covers the unmet need remaining after the Pell and any other scholarships or grants are awarded to the student. The scholarship is portable to any institution of higher education in the United States and can be used to pay tuition and fees, books, and living expenses. The average award to freshmen is about $8,000 and the upper division student average (juniors and seniors) is about $10,000 to $11,000. Average awards differ by institution type, with students attending public institutions receiving about $8,000 and private college attendees receiving slightly more than $11,000 in support. As undergraduates, students are eligible for the scholarship for up to 5 years and can apply for graduate school support if they study engineering, mathematics, science, education, or library science. 4
In the spring of their freshman year, all GMS recipients and a random sample of nonrecipients are surveyed by the National Opinion Research Center (NORC) at the University of Chicago. In this Wave I or “baseline” survey, students are asked questions about their backgrounds, enrollment status, academic and community engagement, college finances and work, self-concept and attitudes, and future plans. The overall response rate was 69% in Cohort II, 81% in Cohort III, and 80% in Cohort V. The response rates were higher for GMS recipients in all cohorts (83% vs. 58% in Cohort II, 90% vs. 75% in Cohort III, and 89% vs. 73% in Cohort V). These students are also resurveyed in the late spring of their junior year, constituting the first follow-up or Wave II of the survey.
The sample used in the analyses described below was constructed by matching data from a number of sources including the baseline and follow-up surveys, a file containing the noncognitive scores of applicants, and a data set containing the reasons that students were eligible or not. Based on our understanding of the GMS program and the selection mechanisms used, the following section outlines our empirical approach using a regression discontinuity design.
The Estimation Strategy: Regression Discontinuity
Thistlewaite and Campbell (1960) used the regression discontinuity (RD) technique to study the effects of the National Merit Scholarship program on career choice. Subsequently, the method has been used to examine the effects of compensatory education programs (Trochim, 1984), school district and housing prices (Black, 1999), the effect of class size on student achievement (Angrist & Lavy, 1999), the effect of school funding on pupil performance (Guryan, 2000), financial aid effects on student enrollment behavior (Kane, 2003; Van der Klaauw, 2002), how teacher training affects student achievement (Jacob & Lefgren, 2002), the incentive effects of social assistance programs (Lemieux & Milligan, 2004), and the relationship between failing a high school exit exam and high school graduation and/or subsequent postsecondary education outcomes (Martorell, 2004).
The RD design (see Cook & Campbell, 1979) is one where participants are assigned to the treatment (e.g., GMS participation) and control groups (e.g., GMS nonparticipants) based on a score on some prespecified criterion (or criteria), such as the noncognitive test score described above. 5 Given the selection mechanism, we expect that students just above and below the cut point are distributed in an approximately random fashion. If true, then the observed and unobserved characteristics of students around the cut point are very similar, akin to a randomized experiment. Under these circumstances, an evaluation of the effect of the program at or near this point may have causal implications. The analytic strategy is to use curve fitting techniques to estimate the average effect for students who received the scholarship (i.e., the “treated”) and those who did not, or more accurately the “counterfactual,” which is the expected outcome if GMS participants did not receive the treatment (see Holland, 1986; Rubin, 1978; or Shadish, Cook, & Campbell, 2002, for an explanation of counterfactual analysis). The causal effect, known as the Local Average Treatment Effect (LATE), is the difference between these two means. We use standard regression techniques to estimate this effect.
Using the RD approach, we believe it makes sense to analyze a number of important correlates of college completion. Formally, suppose that the mean value of an outcome variable (y) depends on whether or not a treatment is received, as represented by an indicator variable (D). Thus,

where α measures the effect of the treatment (D) on the E(y) and ε is a zero mean random error. In a “sharp” RD design, there is a variable, x, such that D = 1 if x ≥ x̃, where the value x̃ is the threshold or cut point, and D equals zero otherwise. Taking expectations of both sides of (1) with respect to x yields
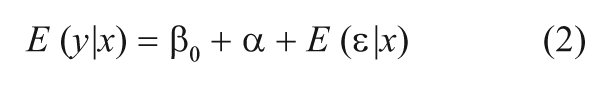
when x ≥ x̃ and
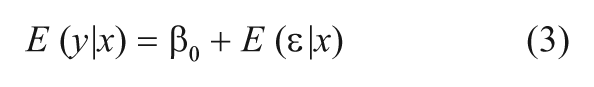
when x < x̃.
Under a sharp design, using a parametric approach assumes that E (ε|x) is some function of x (usually a polynomial of some known order, r) and estimates

with E(ε|v) = 0. The selection of scholars for the GMS program, however, has a “fuzzy” rather than a sharp design because not all students with scores above the cut point receive scholarships because they do not meet other eligibility criteria (i.e., Pell eligibility, high school GPA requirement, and in rare cases, some do not complete the application). The sharp and fuzzy RD designs differ in that in the sharp design, assignment to the treatment is solely determined by a single index variable (e.g., noncognitive test score), whereas fuzzy design assignment to the treatment may also depend on additional factors (i.e., Pell eligibility, high school GPA requirement). In the sharp RD design, the probability of treatment jumps from 0 to 1 at the threshold point, whereas the fuzzy RD design allows for a smaller jump (by less than 1) in the probability of assignment to the treatment at the eligibility threshold (Lee & Lemieux, 2009).
In a fuzzy design, the discontinuity at the cut point is in the probability of receiving the treatment. In this situation, D ≠ I(x ≥ x̃), so (4) no longer yields consistent estimates of the treatment effect. However, since I(x ≥ x̃) is positively correlated with D, instrumental variable estimation of

using I(x ≥ x̃) as an instrument yields a consistent estimate of α. The fuzzy RD design uses the noncognitive index test score that partly determines the selection of scholars for the GMS program as an instrumental variable for the receipt of the GMS scholarship. An instrumental variable approach is used to overcome omitted variable problems in estimating causal relationships. A valid instrumental variable is highly correlated with the treatment (or endogenous explanatory) variables but has no association with the outcome variable. An instrumental variable approach can be estimated using two-stage least squares regression (2SLS). Therefore, fuzzy RD leads naturally to a simple 2SLS estimation strategy (Angrist & Pischke, 2009). In the first stage, the instrumental variable, as well as any covariates thought to be related to treatment, are regressed on the endogenous treatment variable (e.g., the receipt of the GMS scholarship). In the second stage, the dependent variable is regressed on fitted values from the first stage regression model in addition to any covariates thought to be related to the outcome (Schneider, Carnoy, Kilpatrick, Schmidt, & Shavelson, 2008). Several researchers have employed this instrumental variable approach when a cutoff score is available (e.g., Hahn, Todd, & Klaauw, 2001; Lee & Lemieux, 2009), and Cook (2008), a pioneer in the use of quasi-experimental methods such as RD, noted that “the cutoff value (of an index score) functions as an instrumental variable and engenders unbiased causal conclusions” (p. 651).
Using (5), we estimate the effect of the GMS on the amount of time spent per week in different activities including working, studying, extracurricular activities, and relaxing as well as on the number of credits that students enrolled for in each term/semester. These events are estimated at the end of the freshman and junior years of college, and for each of the race/ethnic groups affected by the program. Below, we report our findings.
Findings
Summary Statistics
We first explored the differences between Gates scholars and nonscholars in terms of the noncognitive test score. The average noncognitive test score is 73.1 for the pooled sample. The average noncognitive test score for Gates scholars, however, is 8.5 points higher than for nonscholars (77.7 vs. 69.2, p < .001). For the pooled sample of three entering cohorts, the average amount of time students spend studying is 22.6 hours per week. Gates scholars spend 2.1 more hours per week studying than nonscholars (23.6 vs. 21.5, p < .001). The average amount of time students spend pursuing extracurricular activities is 6.7 hours per week, with Gates scholars averaging 0.5 more hours per week engaged in extracurricular activities than nonscholars (p = .007). The average time students spend relaxing is 16.8 hours per week, with no statistically significant difference between Gates scholars and nonscholars. There are also differences in the hours per week spent studying, 6 hours per week engaged in extracurricular activities, 7 and hours per week spent relaxing 8 by racial/ethnic group.
To further investigate how students spend their time on extracurricular activities, we examined students’ participation in six different types of activities/events: (a) community service or volunteer activity, (b) cultural events sponsored by groups reflecting one’s own cultural heritage, (c) tutoring sessions, (d) events sponsored by a fraternity or sorority, (e) residence hall activities, and (f) religious activities. Survey participants were asked about how frequently they participated in each of these activities in both their freshman and junior years. Gates scholars participate more frequently in community services or volunteering, cultural group events, tutoring sessions, residence hall activities, and religious activities in both their freshman and junior years. 9 In the regression analysis reported below, we group the categorical responses to these questions into two categories, the first containing the “often/very often” responses (which we refer to as high participation) and the second we label not, which contains the “never/seldom/sometimes” responses.
Sample means for the predictor variables used in the regression are presented in Table 2. Column 1 of Table 2 presents sample means for the full sample across all cohorts. The average total SAT score for the sample is 1117, 10 and there are statistically significant differences (p < .05) in these scores by race/ethnic group, with Asian Americans having the highest average at 1200 and Native Americans the lowest average at 1054. Most GMS applicants graduated from a public high school (95%) and are female (71%). The average number of years of high school math among applicants is 3.86 and the average number of years of high school science is 3.66.
Sample Means and Means Above and Below the Cut Points for Demographic and High School Background Variables
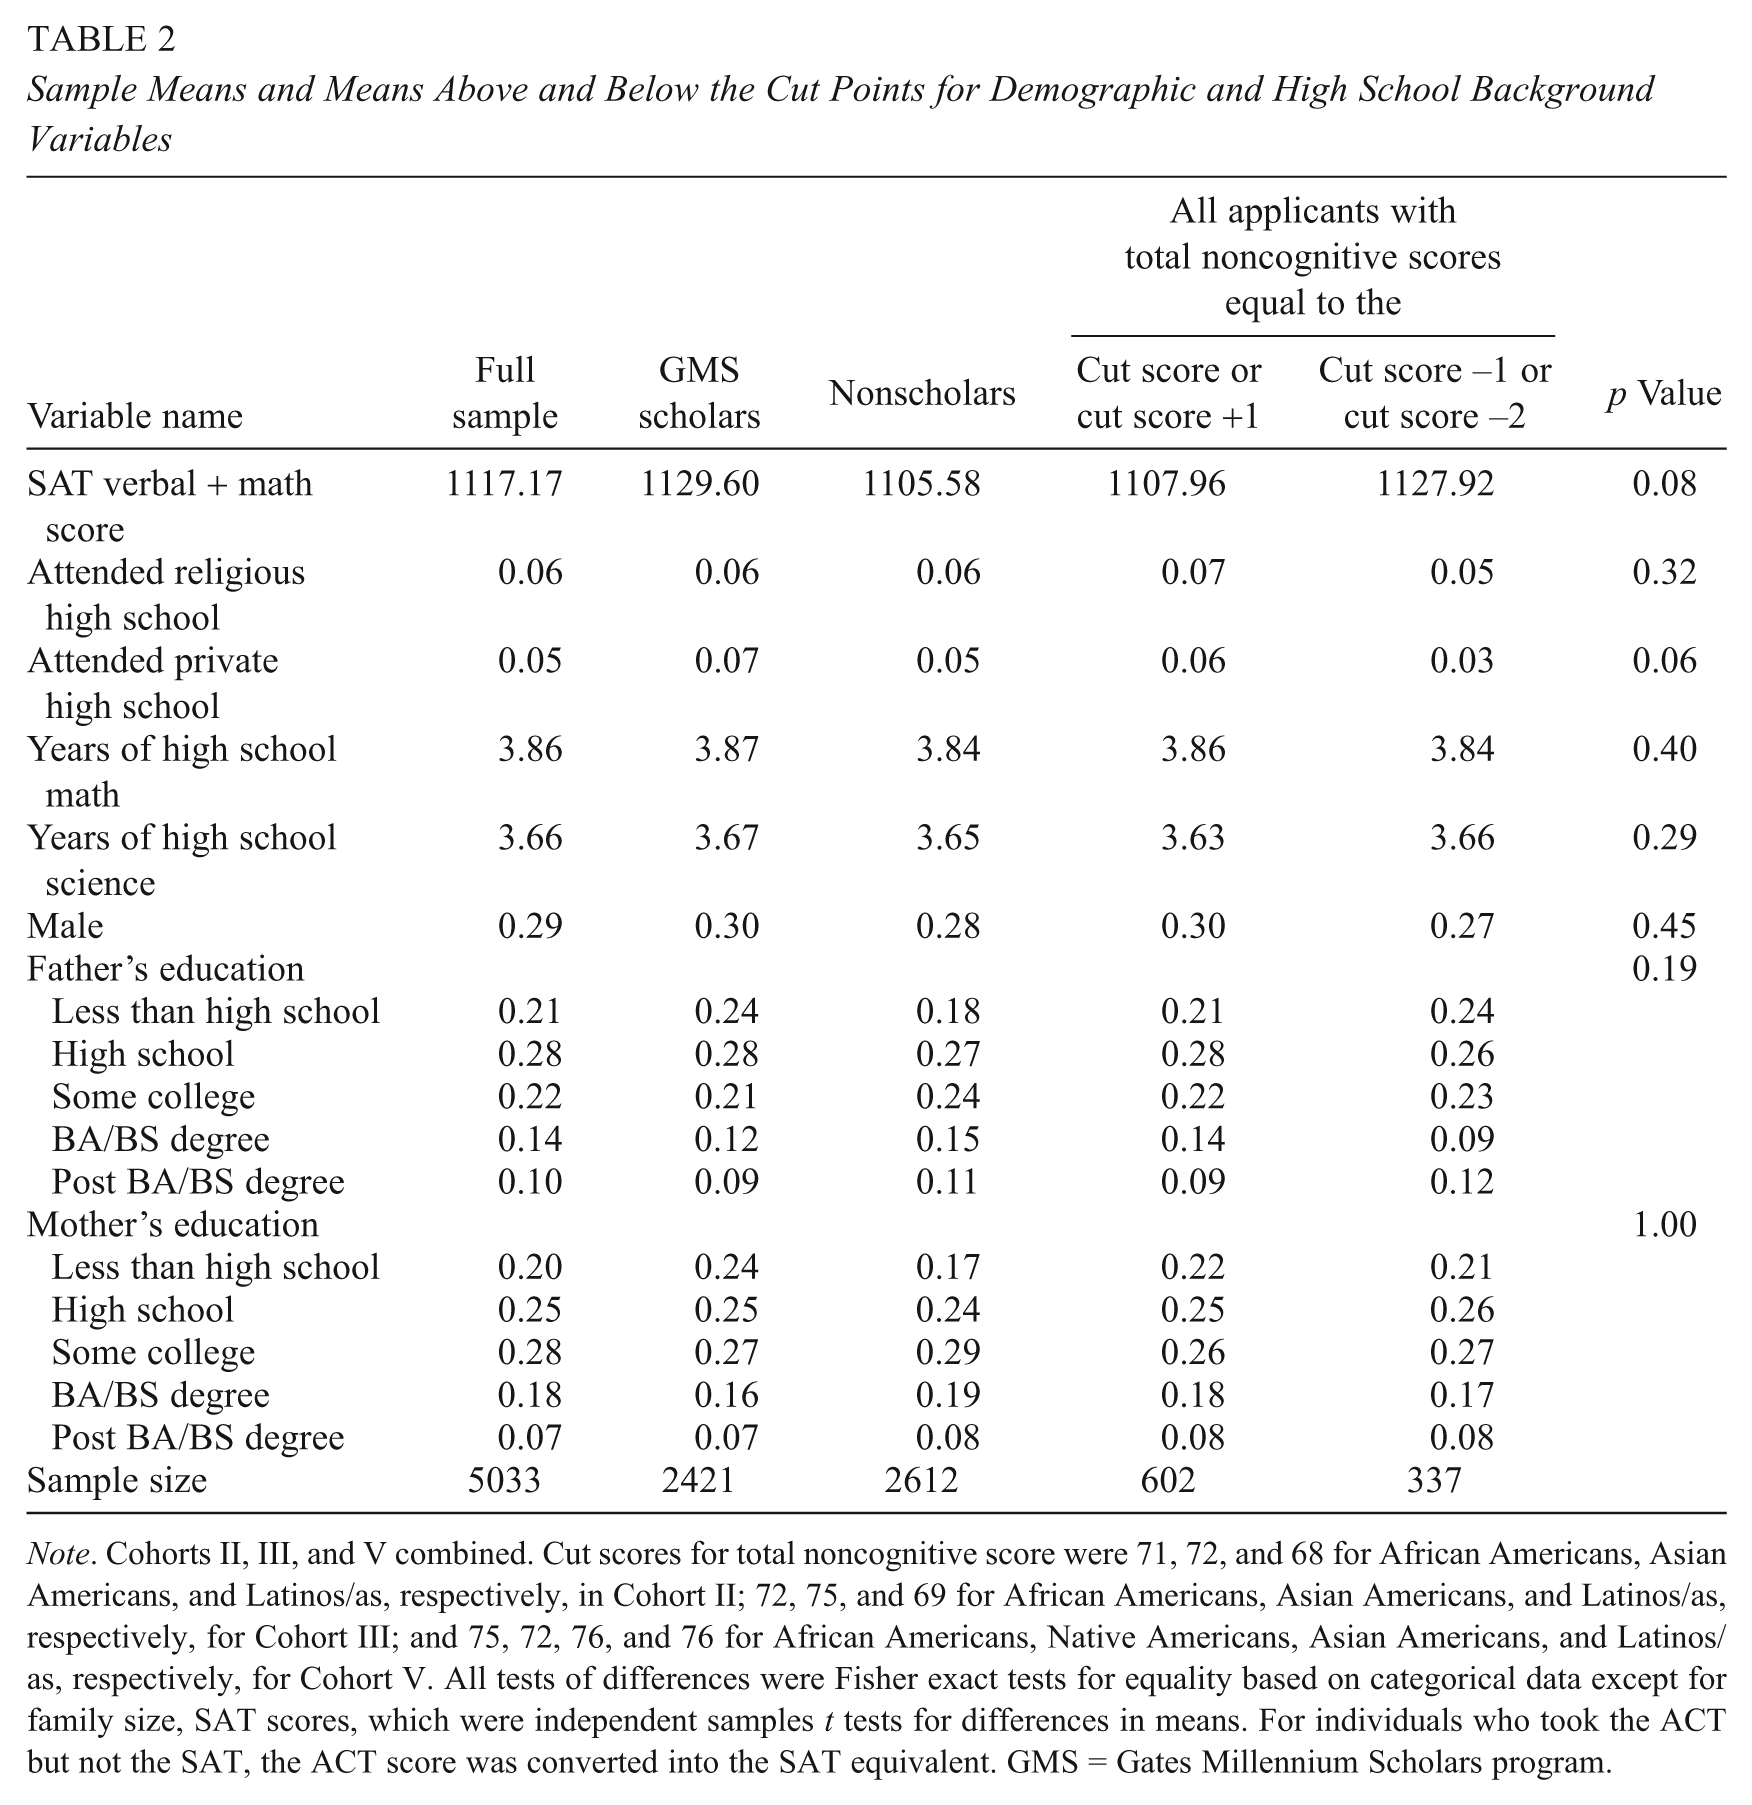
Note. Cohorts II, III, and V combined. Cut scores for total noncognitive score were 71, 72, and 68 for African Americans, Asian Americans, and Latinos/as, respectively, in Cohort II; 72, 75, and 69 for African Americans, Asian Americans, and Latinos/as, respectively, for Cohort III; and 75, 72, 76, and 76 for African Americans, Native Americans, Asian Americans, and Latinos/as, respectively, for Cohort V. All tests of differences were Fisher exact tests for equality based on categorical data except for family size, SAT scores, which were independent samples t tests for differences in means. For individuals who took the ACT but not the SAT, the ACT score was converted into the SAT equivalent. GMS = Gates Millennium Scholars program.
Table 2 also presents sample means broken down by whether or not the applicant received a scholarship. Gates scholars have significantly higher average total SAT scores than nonscholars. Gates scholars have .043 more years of high school math than nonscholars (p < .001) and have more years of high school science than nonscholars (.02), although the difference is not statistically significant (p = .086).
One assumption necessary for the RD approach to provide consistent estimates of the LATE at the cut point is that individuals are randomly distributed around the cut point. To check this assumption, Table 2 compares sample means for the predictor variables for individuals who lie within two points of the cutoff score. Column 6 of Table 2 presents the p values associated with these tests, and we find no evidence of significant differences (at the 5% level) between the scholars and nonscholars on these variables within the two point range.
Of concern, however, is that there may be nonrandom differences in recipients and nonrecipients around the cut point that are related to the outcome of interest. To check this, we regressed several of the outcome variables on the predictor variables (excluding the noncognitive score). Using the results from these regressions, we then computed average predicted values for the outcome variables for each noncognitive score. Little or no difference between the average predicted values for those around the cut point would provide additional evidence of randomization. We observe no large discontinuous changes in predicted values at the cut point, adding further support to our assumption of random assignment near the selection threshold. 11 Finally, it is important that response rates are similar between GMS recipients and nonrecipients around the cut point. As shown in DesJardins and McCall (2010), although there are significant differences in response rates between GMS recipients and nonrecipients, there are generally no statistically significant differences around the cut point. 12
Regression Discontinuity Results
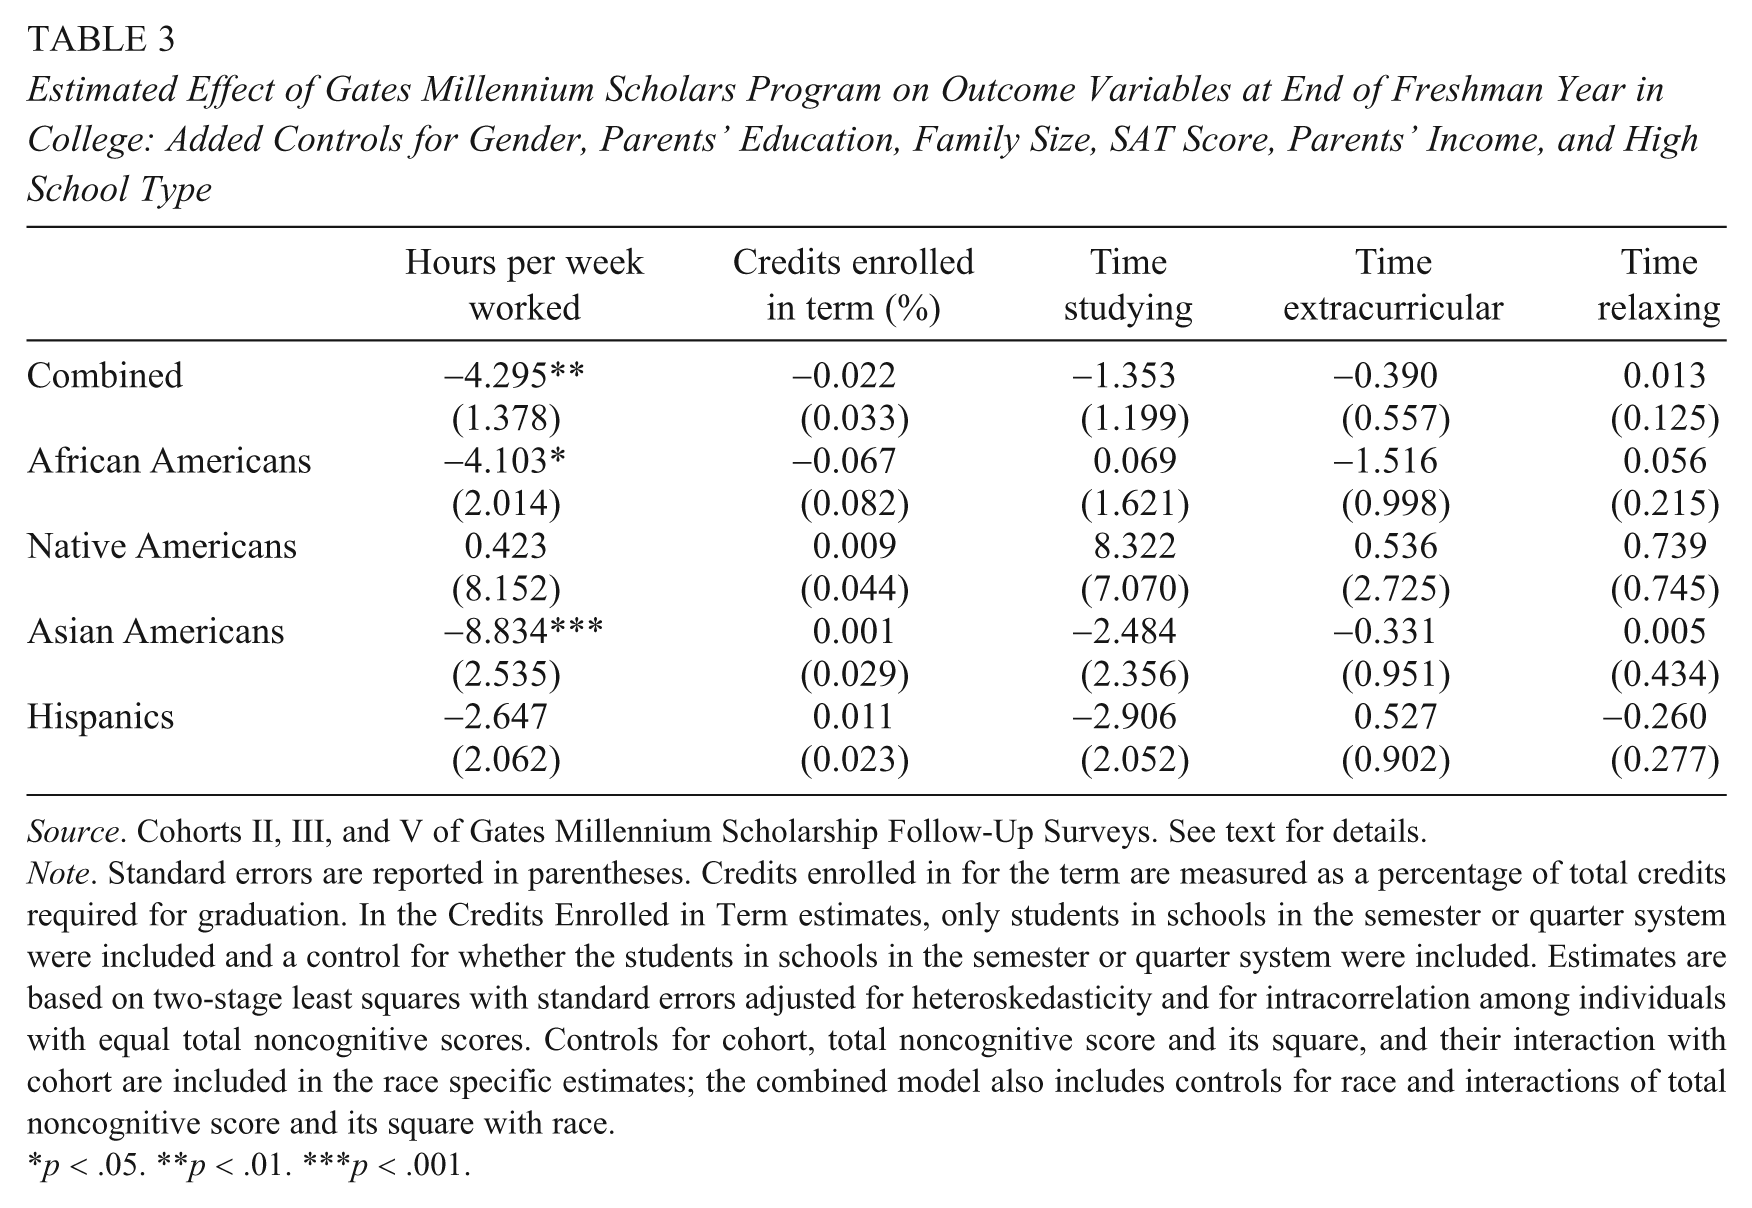
In Table 3, we report the RD estimates for the outcomes related to the amount of time spent per week in different activities and for the number of credits taken (operationalized as the fraction of total credits required for graduation) during the freshman year. 13 In these estimations as well as those reported below, we combine all the cohorts but allow for cohort fixed effects, interactions of the noncognitive score variable and its higher orders with the cohort dummies, and interactions of the cohort dummies with the race dummies and race–noncognitive score interactions. This would be equivalent, when no other controls are included in the model, to estimating separate models by cohort/race group but restricting the estimated effect of the scholarship to be the same across these groups. In the results reported in the tables, we adjust for the noncognitive score using a quadratic function. 14 Overall, the point estimate indicates that GMS recipients work 4.3 fewer hours per week during the freshman year of college (p < .01) than their nonrecipient counterparts.
Estimated Effect of Gates Millennium Scholars Program on Outcome Variables at End of Freshman Year in College: Added Controls for Gender, Parents’ Education, Family Size, SAT Score, Parents’ Income, and High School Type
Source. Cohorts II, III, and V of Gates Millennium Scholarship Follow-Up Surveys. See text for details.
Note. Standard errors are reported in parentheses. Credits enrolled in for the term are measured as a percentage of total credits required for graduation. In the Credits Enrolled in Term estimates, only students in schools in the semester or quarter system were included and a control for whether the students in schools in the semester or quarter system were included. Estimates are based on two-stage least squares with standard errors adjusted for heteroskedasticity and for intracorrelation among individuals with equal total noncognitive scores. Controls for cohort, total noncognitive score and its square, and their interaction with cohort are included in the race specific estimates; the combined model also includes controls for race and interactions of total noncognitive score and its square with race.
p < .05. **p < .01. ***p < .001.
When disaggregated by racial/ethnic group, receiving a Gates scholarship is significantly and negatively associated with hours worked for African Americans (by 4.1 hours, p < .05) and Asian Americans (by 8.8 hours, p < .001) during their freshman year of college. For the outcomes related to time spent on studying, in extracurricular activities, and on relaxing and to the number of credits a student takes, however, we did not find any significant GMS effect.
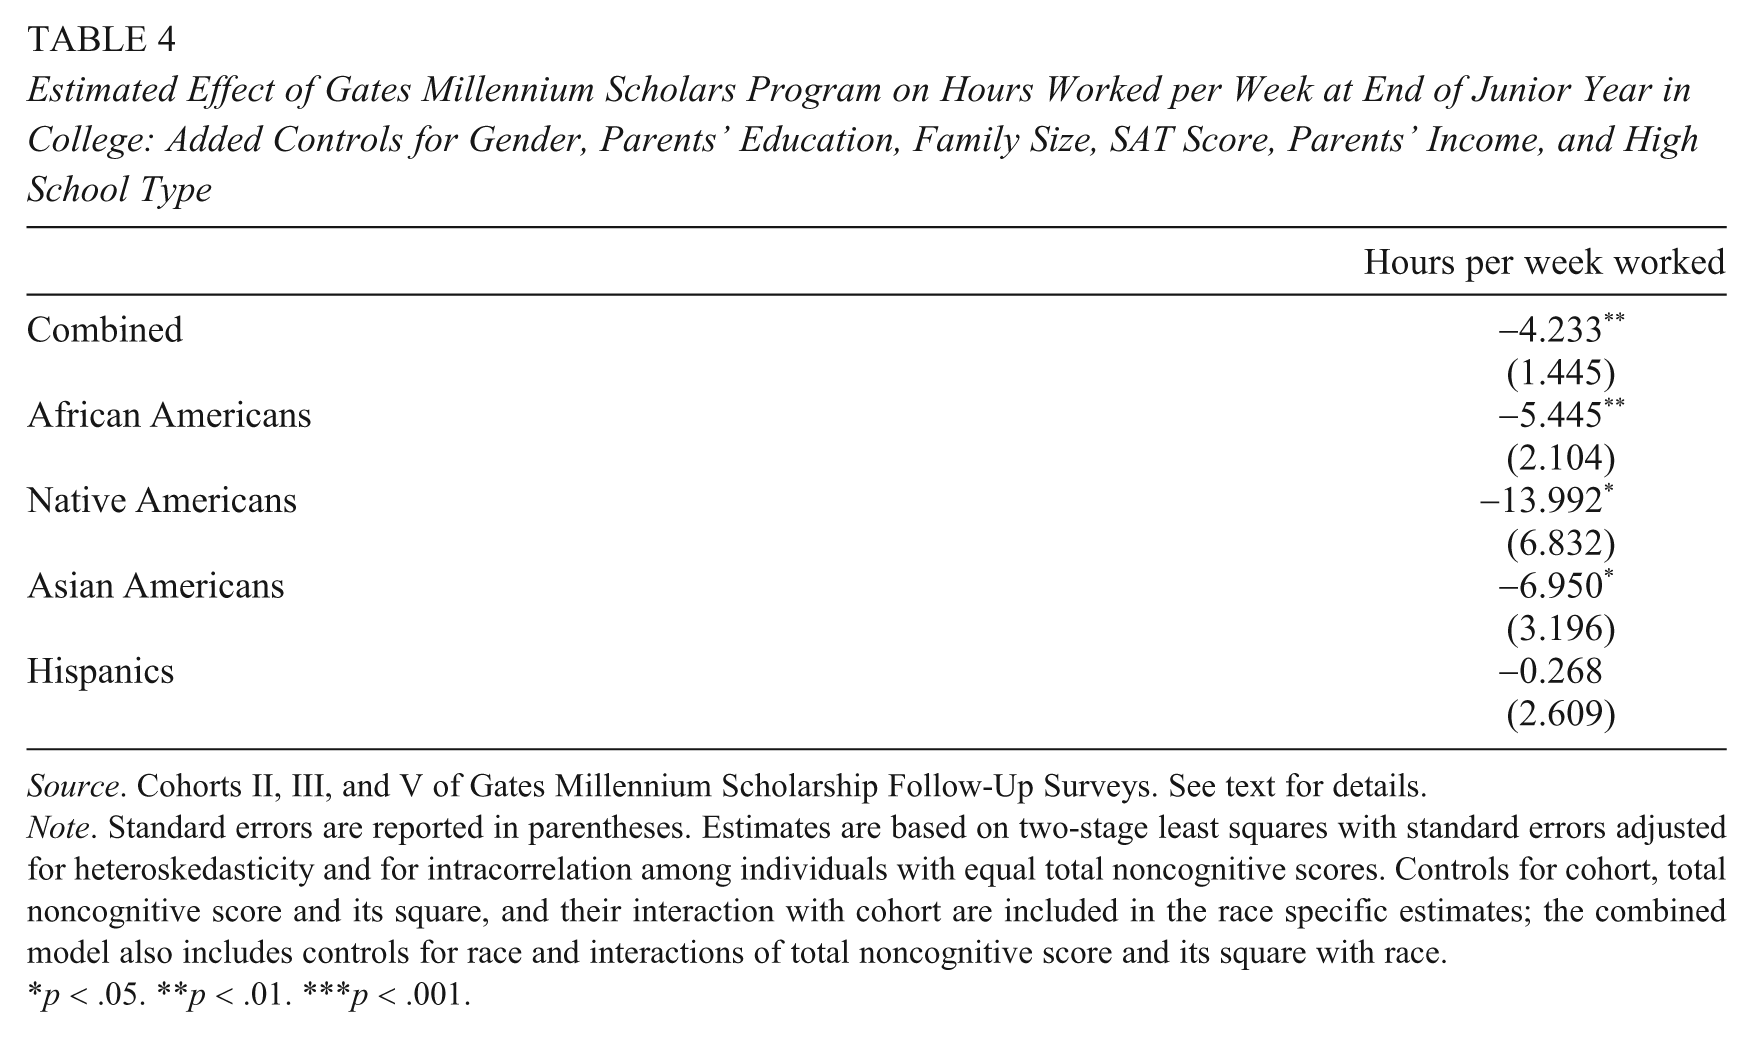
In Table 4, we report estimates of the effect of a Gates scholarship on hours of work for individuals during their junior year. For the combined sample, receiving a Gates scholarship lowers hours worked per week by 4.23, holding other variables constant, and the estimate is significant at the 1% level. When disaggregated by race/ethnicity, scholarship receipt reduces hours worked for African Americans by 5 hours, Native Americans by 14 hours, and Asian Americans by 7 hours (all ps < .05).
Estimated Effect of Gates Millennium Scholars Program on Hours Worked per Week at End of Junior Year in College: Added Controls for Gender, Parents’ Education, Family Size, SAT Score, Parents’ Income, and High School Type
Source. Cohorts II, III, and V of Gates Millennium Scholarship Follow-Up Surveys. See text for details.
Note. Standard errors are reported in parentheses. Estimates are based on two-stage least squares with standard errors adjusted for heteroskedasticity and for intracorrelation among individuals with equal total noncognitive scores. Controls for cohort, total noncognitive score and its square, and their interaction with cohort are included in the race specific estimates; the combined model also includes controls for race and interactions of total noncognitive score and its square with race.
p < .05. **p < .01. ***p < .001.
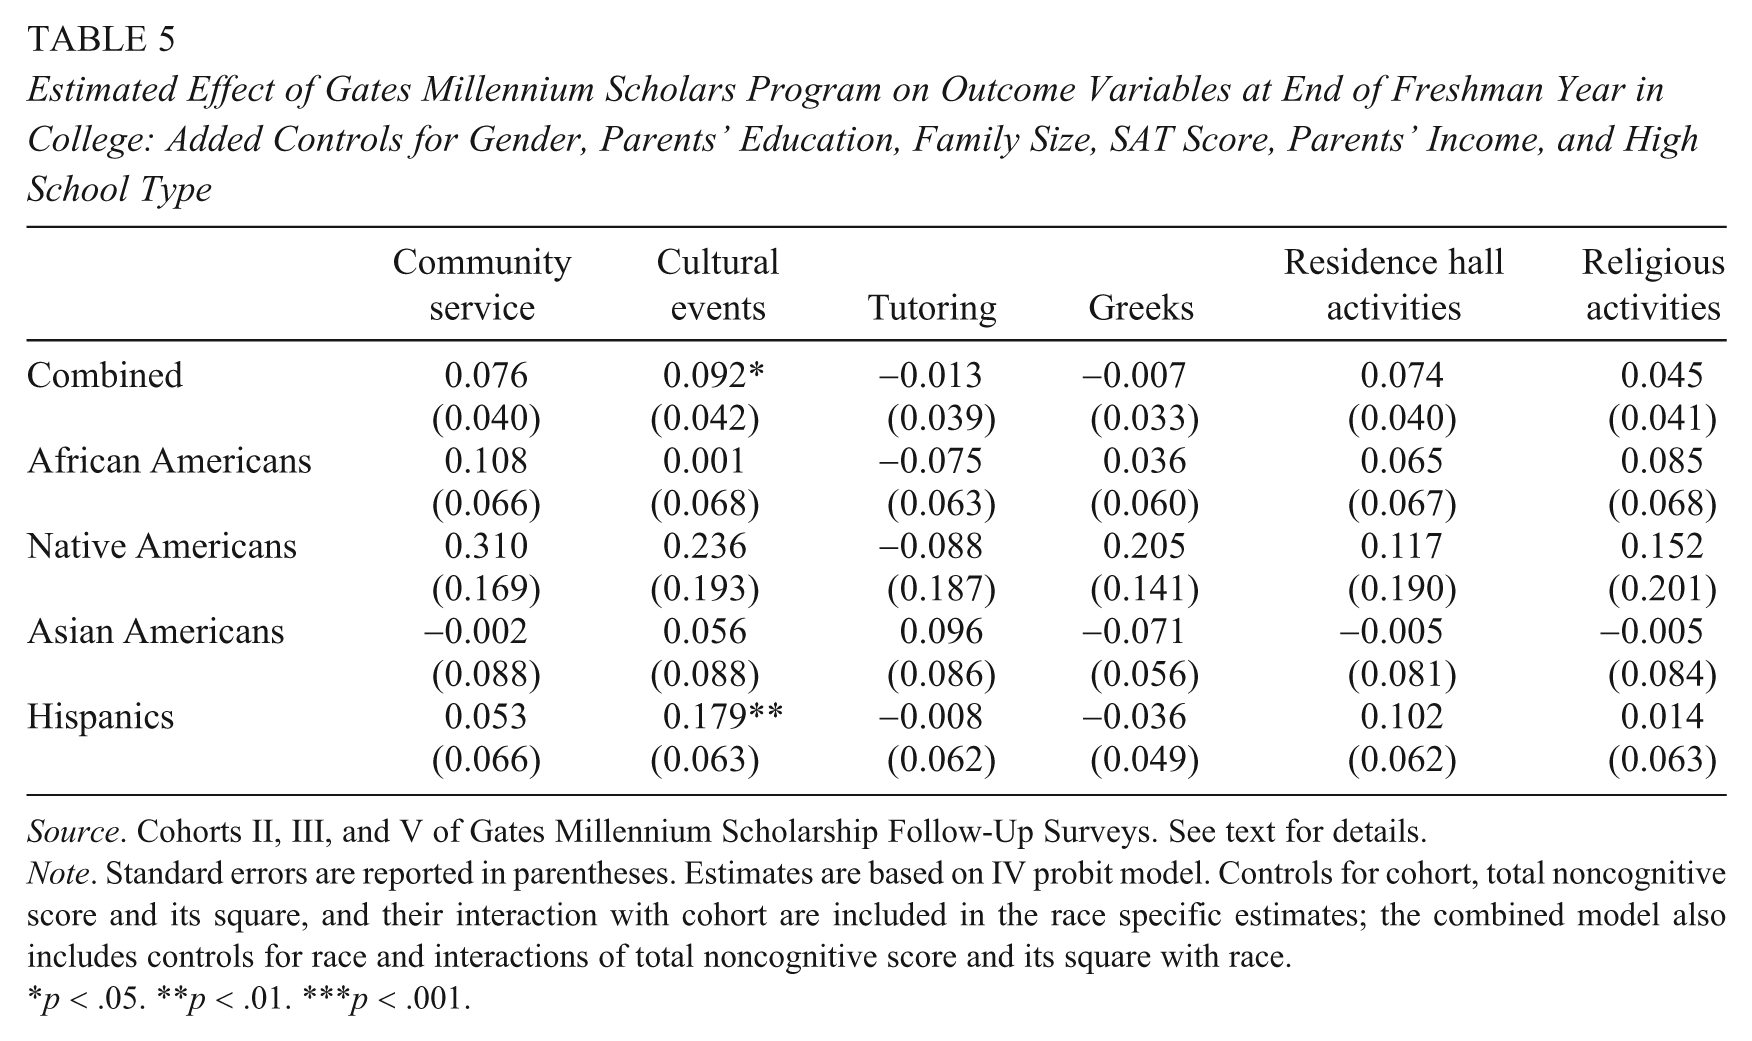
The estimated effects of receiving a Gates scholarship on high participation in extracurricular activities during the freshman year are reported in Table 5. Overall, receiving a Gates scholarship increases the probability that students will report that they often or very often participate in community or volunteer activities. Receiving a Gates scholarship increases the probability of high participation in community or volunteer activities by .076 when holding other variables constant (p = .06).
Estimated Effect of Gates Millennium Scholars Program on Outcome Variables at End of Freshman Year in College: Added Controls for Gender, Parents’ Education, Family Size, SAT Score, Parents’ Income, and High School Type
Source. Cohorts II, III, and V of Gates Millennium Scholarship Follow-Up Surveys. See text for details.
Note. Standard errors are reported in parentheses. Estimates are based on IV probit model. Controls for cohort, total noncognitive score and its square, and their interaction with cohort are included in the race specific estimates; the combined model also includes controls for race and interactions of total noncognitive score and its square with race.
p < .05. **p < .01. ***p < .001.
The results presented in Table 5 also indicate that for all groups receiving a Gates scholarship, the probability of high participation in cultural events related to their own heritage increases during the freshman year of college (by .092; p < .05). There is no evidence that receipt of a Gates scholarship has statistically significant effects on the probability of high participation in tutoring sessions, resident hall activities, events sponsored by a fraternity or sorority, or religious or spiritual activities.
Estimates for racial/ethnic subgroups indicate that receiving a Gates scholarship increases the probability of high participation in community or volunteer activities for African Americans and Native Americans (but the estimates are significant only at the 10% level). Receiving a Gates scholarship increases the probability of high participation in cultural activities for Latinos/as by .18 (p < .01).
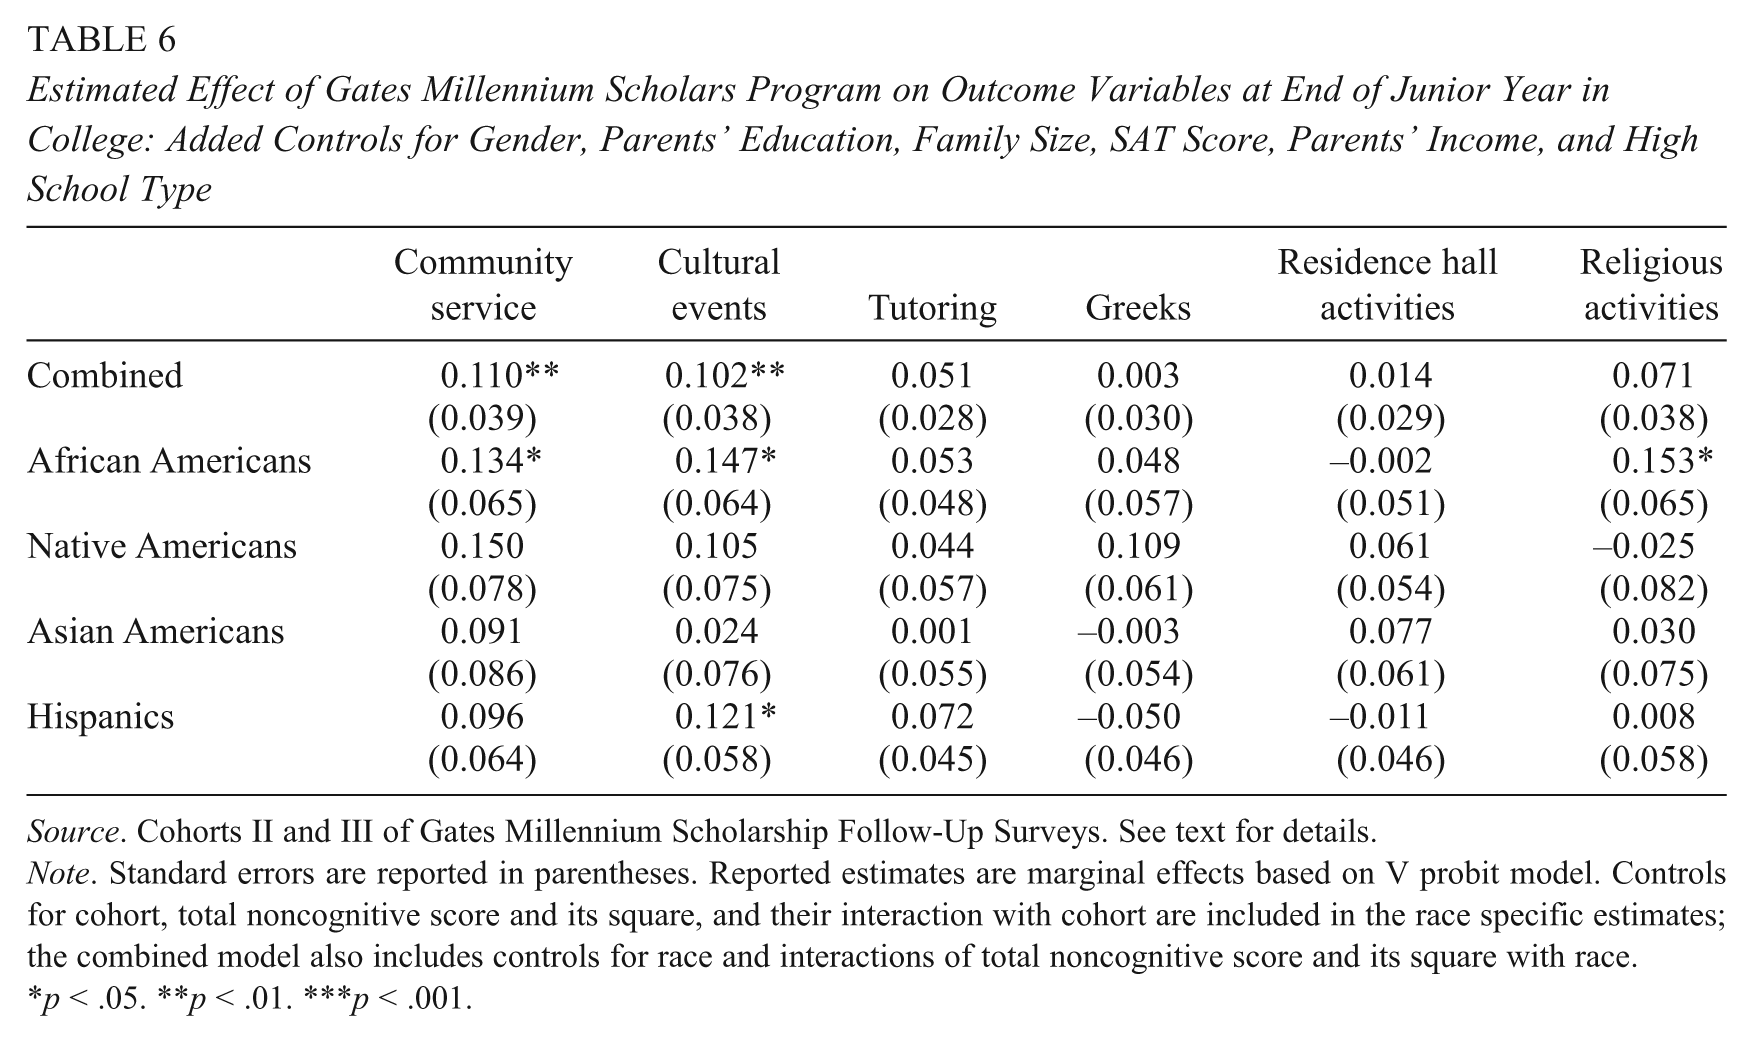
For the pooled sample, receiving a Gates scholarship during the junior year increases the probability of high participation in community or volunteer activities (see Table 6) by .11 (p < .01). Receiving a Gates scholarship is also associated with increases in the probability of high participation in cultural events related to their own heritage for juniors by .102 (p < .01).
Estimated Effect of Gates Millennium Scholars Program on Outcome Variables at End of Junior Year in College: Added Controls for Gender, Parents’ Education, Family Size, SAT Score, Parents’ Income, and High School Type
Source. Cohorts II and III of Gates Millennium Scholarship Follow-Up Surveys. See text for details.
Note. Standard errors are reported in parentheses. Reported estimates are marginal effects based on V probit model. Controls for cohort, total noncognitive score and its square, and their interaction with cohort are included in the race specific estimates; the combined model also includes controls for race and interactions of total noncognitive score and its square with race.
p < .05. **p < .01. ***p < .001.
The Gates scholarship is associated with increases in the probability of high participation in tutoring sessions for juniors by .051 (p = .07), even though no such effect was found for freshmen. We also find evidence that receiving a Gates scholarship increases the probability of high participation in religious or spiritual activities for juniors (by .071), but this relationship is quite weak (p = .063).
Disaggregating by racial/ethnic group, we find that receiving a Gates scholarship increases the probability of high participation in tutoring by .072 to .082 for Latinos/as only (p < .05). Also, the receipt of a Gates scholarship is associated with increases in the probability of high participation in community services/volunteer activities for Latinos/as (by .096), although the estimated effects are significant only at the 10% significance level.
Heterogeneous Treatment Effects
We also tested for heterogeneous treatment effects by estimating separate models by gender, whether or not either parent went to college, and whether the college that the student attends is public or private. 15 To conserve space, we did not provide these results (they are available on request). For the most part, there are no statistically significant differences in the effect of the Gates scholarship for these subgroups. We did find, however, that GMS receipt has a larger negative effect on hours worked in the freshman year for students with at least one parent who attended college than for individuals whose parents had no college experience (p < .001). Our results also reveal that receiving a Gates scholarship has a significantly larger effect on the probability of high participation in tutoring activities for students attending private colleges than for students attending public colleges, but only during the freshman year (p = .05). 16 When control variables are added in the model, however, the effect is no longer statistically significant.
Limitations
This study has a number of limitations. First, the research examines the effect of receiving financial aid on time allocation behavior only for low-income, high-achieving minority students who make up a very small proportion of all undergraduate students in institutions in the United States. Thus, the scholarship effects estimated may not fully account for the patterns of time use and activities engaged in by the general population of college students. Second, because the GMS is a last dollar award covering the unmet need remaining after any other scholarships or grants are awarded, each Gates scholar has different levels of unmet need and may therefore receive a different scholarship amount (i.e., a differential “dose”). However, we believe the RD framework, the controls added to the regressions, and the heterogeneous treatment checks conducted mitigate any bias that might be induced by lack of information on the size of the scholarship.
Discussion and Conclusions
We explored the effect of receiving a Gates Millennium Scholarship on time use and participation in various activities among low-income high-achieving minority students. We believe our results support the existing literature suggesting that low-income minority students are generally very responsive to financial aid in their college-related decisions, such as enrollment and persistence (e.g., Heller, 1997; Paulsen & St. John, 2002; Perna & Titus, 2004). However, our findings concerning time allocation behavior provide new information with regard to the effect of financial aid on low-income minority students’ time use and participation in various activities, which are closely related to their ultimate success in college.
Although we find that receiving a Gates scholarship significantly reduces hours of work, we find no significant effects of receiving a Gates scholarship on hours spent studying, relaxing, or in extracurricular activities, as well as on the number of credits a student takes. The significant effect of the GMS scholarship on students’ working hours while in college suggests that the scholarship may alleviate borrowing constraints faced by these low-income, high-ability minority students and thus reduces the need for working to finance their college expenses. Therefore, the GMS scholarship appears to enhance these students’ opportunities to participate in various nonemployment-related activities.
Furthermore, the differences in the effect of the GMS scholarship on student time use and participation in different activities imply a heterogeneous effect of the scholarship based on one’s racial/ethnic group. Estimates by racial/ethnic group suggest that receiving the scholarship significantly lowers hours worked by African Americans and Asian Americans in both the freshman and junior years. The significant effect of the GMS scholarship among these groups suggests that African Americans and Asian Americans are more likely to substitute grant money for work incomes than other race/ethnic groups.
Considering the negative influence of working more than 20 hours on academic performance and persistence in college (Ehrenberg & Sherman, 1987; Lammers et al., 2001; Leppel, 2002; Stinebrickner & Stinebrickner, 2003), it is possible that these Gates scholars who reduced hours of work may experience a greater level of academic engagement that positively affects their college persistence and degree attainment. However, the linkage between allocating less time to working to academic performance and persistence was not explored in this article, but additional research into the associations between financial aid, changes in students’ time allocation, and important educational outcomes seems warranted.
In contrast with its significant effect on work hours, the findings that the GMS scholarship did not have a significant effect on time allocated to other activities suggest that reduction in working hours does not automatically correspond to an increase in the quantity of time spent studying and course-taking as well as on leisure and extracurricular activities. This observed student behavior concerning time use suggests that financial aid such as the GMS scholarship may have behavioral effects on how students manage their time strategically rather than inducing measurable quantitative changes in time allocation. Stated differently, receiving the GMS may qualitatively affect students’ use of time and participation in different activities in a way that enriches their academic and nonacademic experiences in college. A change in how students deal with time management induced by the GMS scholarship is, in part, addressed in this study by investigating the extent to which students participate in six different activities. Among these activities, we found evidence that GMS receipt increases participation in community services/volunteer activities and cultural events in both the freshman and junior years. Although no direct comparisons can be made, the findings suggest that the GMS scholarship may incentivize the recipients to be highly engaged in community services or volunteer activities as well as cultural events, with their enhanced availability of time enabled by a reduction in the time spent working. The hypothesized incentive effects of the GMS are weakly supported by the results, indicating that African American students, who are more likely to experience reduced hours of work, exhibit higher participation in community services and volunteering than other racial/ethnic groups during their junior years.
Although the GMS scholarship did not significantly lower the hours worked by Latino/a students, these students report significantly higher levels of participation in cultural events relative to other racial/ethnic groups. Thus, the GMS appears to promote positive cultural/ethnic identity for Latino/a students, who are generally highly underrepresented in higher education institutions. The evidence that the GMS scholarship influences high participation in volunteering and cultural events indicates that the scholarship may nurture nonacademic outcomes in college, such as promoting good citizenship, cultural identity, and diversity among low-income minority students, all specific goals of the GMS program and worthy goals more generally.
We hope that our efforts encourage others to investigate the role of financial support and how it may affect students’ time allocation behavior over the academic career so that we can provide better information to decision makers responsible for instituting policies that will help improve student educational outcomes. One interesting avenue for further research is to determine whether this observed substitution affects the types of jobs that individuals choose to pursue once they leave college. It is unfortunate that we will have to wait until future waves of the survey have been completed to explore this line of inquiry.
Footnotes
Appendix
Average Subscores of Cognitive and Noncognitive Tests (n = 6999)
| Subscore | Subscores as a fraction of total score | Subscore | Subscores as a fraction of total score | ||||||
|---|---|---|---|---|---|---|---|---|---|
| Subscore | All | Total score at or above cut point | Total score below cut point | t test of difference | Total score at or 1 below cut point | Total score = cut point | Total score = cut point −1 | t test of difference | |
| 1 | Positive self-concept | 6.92 | 0.096 | 0.096 | −2.03 | 6.91 | 0.095 | 0.095 | −0.10 |
| 2 | Realistic self-appraisal | 6.74 | 0.094 | 0.092 | 5.65 | 6.75 | 0.093 | 0.093 | 0.05 |
| 3 | Understand and navigate social system | 6.39 | 0.090 | 0.085 | 19.41 | 6.42 | 0.089 | 0.089 | −0.20 |
| 4 | Prefer long-range goals over short-term needs | 6.75 | 0.094 | 0.092 | 6.37 | 6.76 | 0.092 | 0.094 | 1.80 |
| 5 | Strong support person | 5.57 | 0.075 | 0.083 | −39.76 | 5.61 | 0.079 | 0.077 | −3.30 |
| 6 | Leadership | 6.62 | 0.093 | 0.090 | 12.10 | 6.69 | 0.092 | 0.092 | 0.63 |
| 7 | Community service/involvement | 6.42 | 0.090 | 0.087 | 8.17 | 6.40 | 0.088 | 0.089 | −0.21 |
| 8 | Ability to acquire knowledge in nontraditional ways | 6.50 | 0.090 | 0.089 | 7.11 | 6.48 | 0.089 | 0.089 | 1.14 |
| 9 | Rigor of course work | 7.06 | 0.097 | 0.101 | −14.69 | 7.15 | 0.099 | 0.099 | −0.36 |
| 10 | Math/science/language courses | 6.97 | 0.096 | 0.099 | −9.62 | 7.05 | 0.097 | 0.098 | 0.48 |
| 11 | Scholarly essay score | 6.26 | 0.087 | 0.085 | 6.82 | 6.27 | 0.087 | 0.086 | −0.82 |
| 13 | Overall F test for mean differences | p = .000 | p = .080 | ||||||
| 14 | Total noncognitive component: Subscores (1)–(8) | 51.92 | 0.721 | 0.715 | 10.99 | 52.01 | 0.718 | 0.717 | 0.28 |
| 15 | Total cognitive component: Subscores (9)–(11) | 20.29 | 0.279 | 0.285 | — | 20.47 | 0.282 | 0.283 | — |
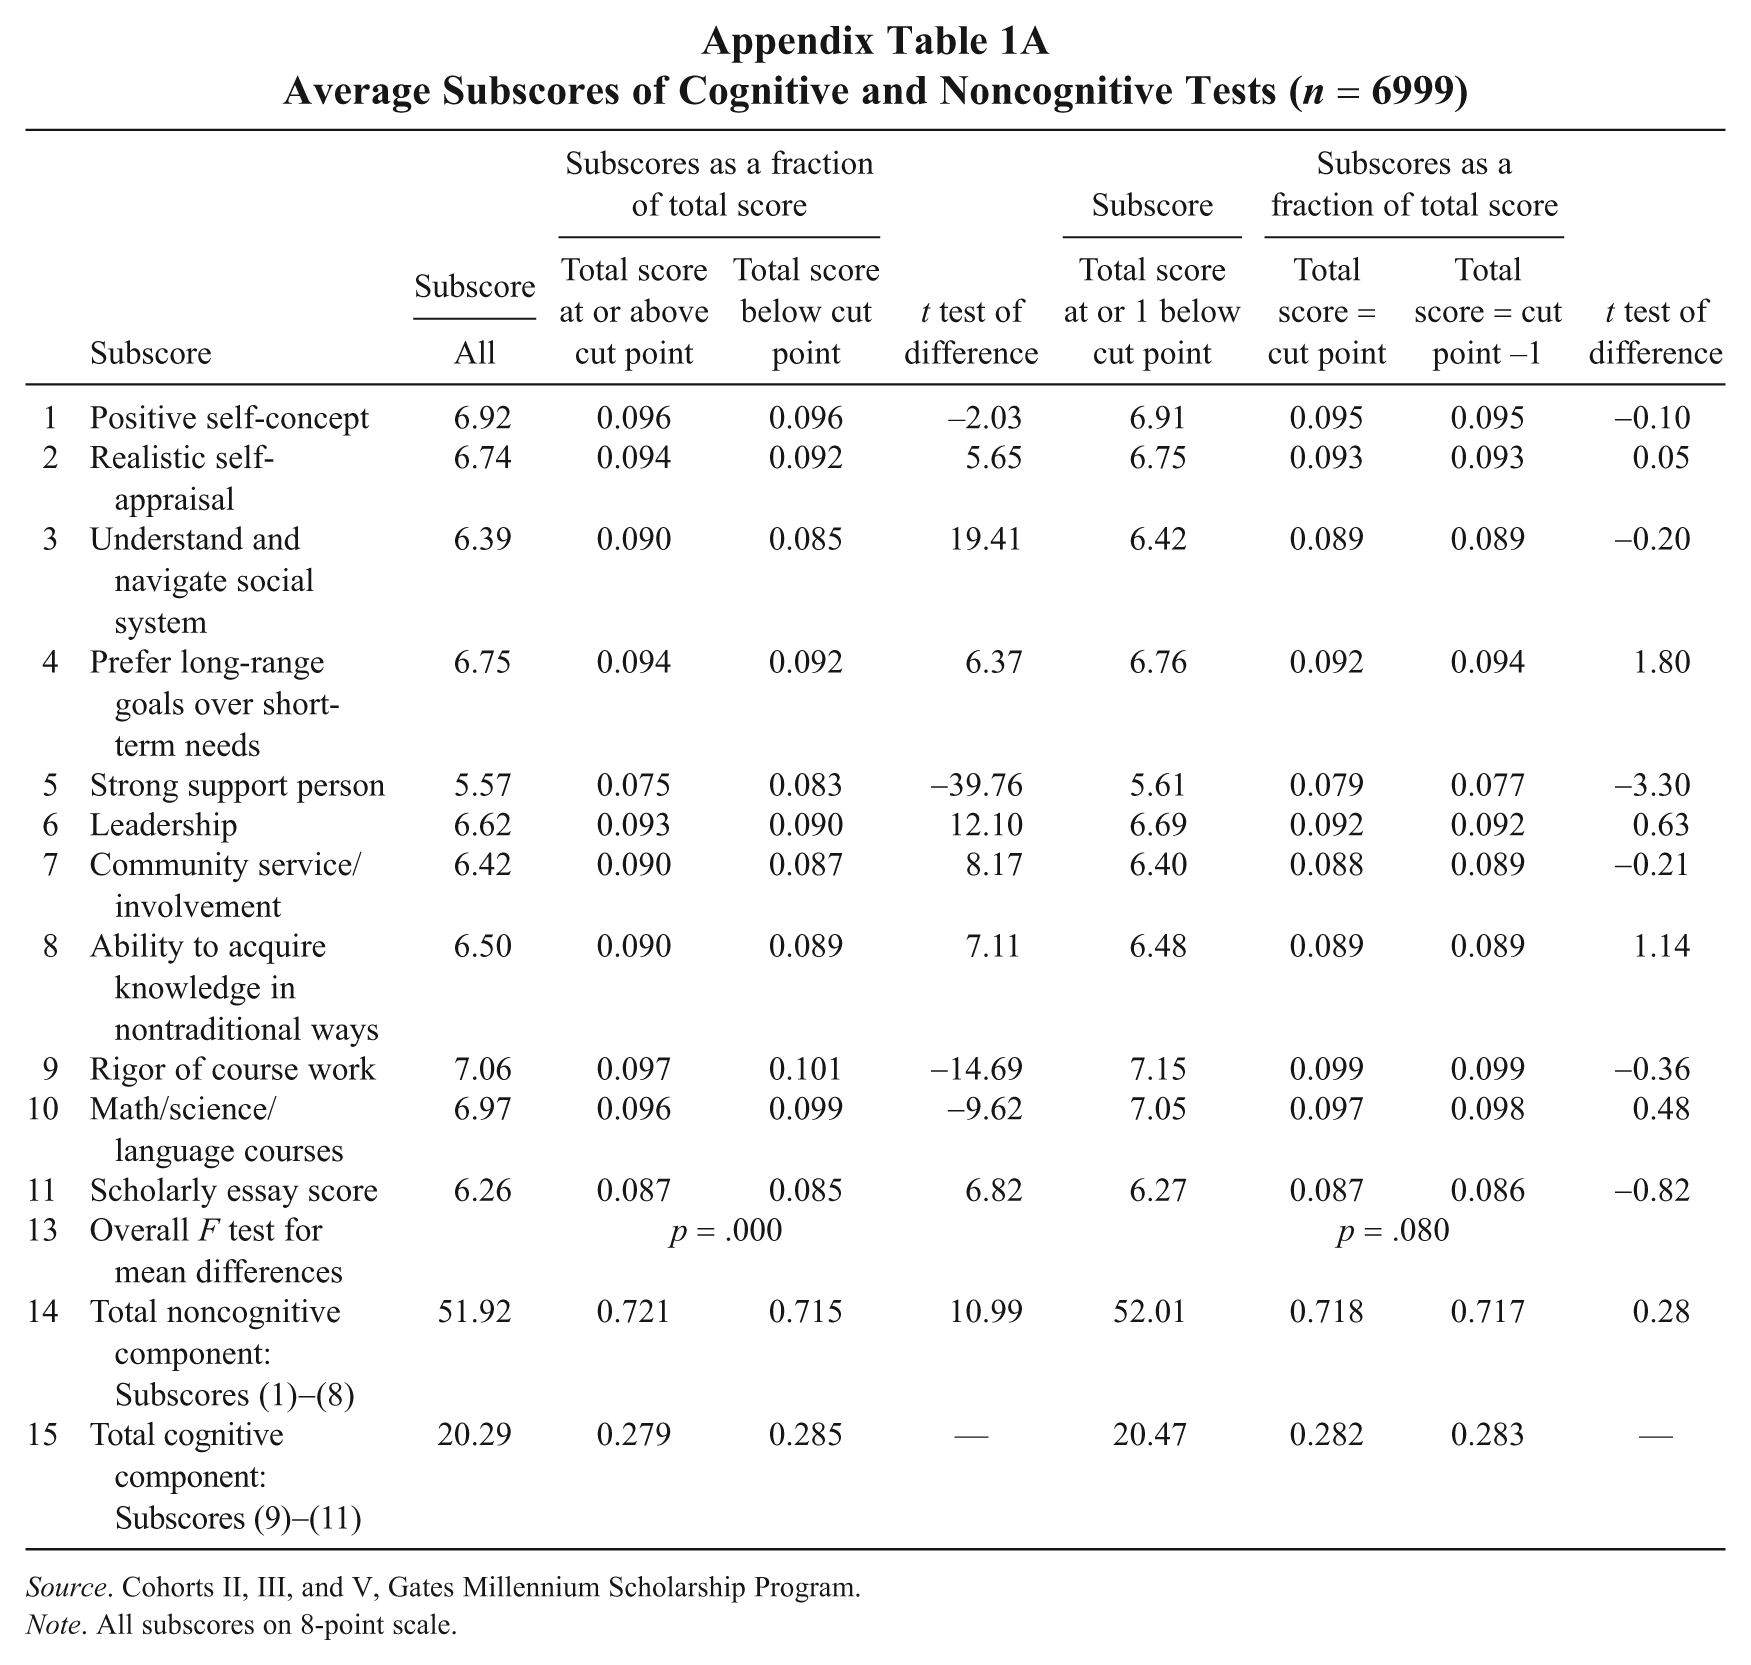
Source. Cohorts II, III, and V, Gates Millennium Scholarship Program.
Note. All subscores on 8-point scale.
The views contained herein are not necessarily those of the Bill & Melinda Gates Foundation.
The authors declared no potential conflicts of interests with respect to the authorship and/or publication of this article.
The authors disclosed receipt of the following financial support for the research and/or authorship of this article: Financial support for the research conducted herein was provided by the Bill & Melinda Gates Foundation, but the authors did not receive any funding to write this paper. The views contained herein are not necessarily those of the Bill & Melinda Gates Foundation.
1.
The eight areas measured by these noncognitive variables are positive self-concept, realistic self-appraisal, successfully handling the system, preference for long-term goals, availability of a strong support person, leadership experience, community involvement, and knowledge acquired in a field. For additional information on the development and use of the noncognitive measures, see Sedlacek (1998, 2003, ![]() .
.
2.
The GMS scholarship program designates that a certain fraction of scholarships goes to each ethnic group. The thresholds are set by moving down the distribution of total scores on noncognitive tests until all scholarships for that racial group are allocated. Thus, the threshold depends on the number of applicants within a racial group for that year. For our purposes, this limits whether an applicant can “game” the system since the threshold is not known in advance.
3.
The Pell Grant program is a federal grant program sponsored by the U.S. Department of Education, covered by legislation titled the Higher Education Act of 1965. The maximum award for the 2009–2010 award year is $5,350; the maximum grant is to increase to $5,400 by 2012. It is awarded based on a “financial need” formula. In the 2005–2006 school year, students with family incomes of less than $20,000 accounted for 57% of Pell Grant recipients. Thirty-five percent of these recipients attended public 2-year colleges, and 42% attended public 4-year colleges. The National Postsecondary Student Aid Study found that during the 1999–2000 school year, students from families making less than $41,000 accounted for 90% of Pell Grant recipients.
4.
In this article, we examine the GMS effects on undergraduates only.
5.
As mentioned above, students must also meet the criteria for the federal Pell financial aid program and GPA requirements, which are stated on the application (and, so, are known beforehand), to receive the scholarship granted to GMS participants.
6.
There are statistically significant differences in the average amount of time spent studying by race/ethnic group. On average, African Americans report studying 22.2 hours per week, Native Americans report studying 18.7 hours per week, Asian Americans report studying 24.5 hours per week, and Latinos/as report studying 22.2 hours per week.
7.
There are statistically significant differences in the average amount of time spent in extracurricular activities by race/ethnic group. On average, African Americans, Native Americans, Asian Americans, and Latinos/as report 7.9, 5.7, 6.0, and 5.8 hours per week engaged in extracurricular activities, respectively.
8.
There are also statistically significant differences in the average amount of time spent relaxing by race/ethnic group. On average, African Americans, Native Americans, Asian Americans, and Latinos/as report 18.3, 18.7, 15.9, and 15.6 hours per week engaged in extracurricular activities, respectively.
9.
Chi-square tests reject the null hypothesis of equal proportions for Gates scholars and nonscholars at the 1% significance level for all categories except fraternity/sorority activities for both the freshman and junior years.
10.
For individuals who took the ACT but not the SAT, the ACT score was converted into the SAT equivalent.
11.
Another issue that is important is the power to detect statistically significant differences around the cut point. To investigate this, we calculated the probability identifying a .10 difference between GMS recipients and nonrecipients in the probability of participating often or very often in the various activities for those within two points of the cut point. For all outcome variables, the power exceeded .80.
13.
The estimates reported in the tables do not incorporate sampling weights. Weighted estimates using sampling weights, however, produced similar results and thus are not reported in this article.
14.
We also estimated models with a noncognitive score cubed variable and its interactions with cohort, race, and cohort–race interactions, although in most cases, these additional variables were not jointly significant. In other specifications, we estimated models that limited the sample to individuals whose noncognitive test score was within 10, 6, and 4 points of the cutoff score. For these specifications, the estimates were for the most part similar to those reported in the text.
15.
In the estimates broken down by whether the college was public or private, we restricted the estimates to individuals attending 4-year colleges.
16.
Since 54 different comparisons are made, we would expect two to three statistically significant results purely by chance. So, some caution is warranted when interpreting these findings.