
Abstract
Recent years have seen the convergence of two major policy streams in U.S. K–12 education: standards/accountability and teacher quality reforms. Work in these areas has led to the creation of multiple measures of teacher quality, including measures of their instructional alignment to standards/assessments, observational and student survey measures of pedagogical quality, and measures of teachers’ contributions to student test scores. This article is the first to explore the extent to which teachers’ instructional alignment is associated with their contributions to student learning and their effectiveness on new composite evaluation measures using data from the Bill & Melinda Gates Foundation’s Measures of Effective Teaching study. Finding surprisingly weak associations, we discuss potential research and policy implications for both streams of policy.
In a separate stream of policy and research, there has been a great deal of recent effort to improve the methods by which teachers are evaluated. This push has been spurred by state and national policy initiatives such as the Race to the Top Fund and the No Child Left Behind (NCLB) waivers. A large part of this effort has focused on teachers’ contribution to student learning, often measured by value-added models (VAMs). Because of the multifaceted nature of teaching, the challenges and limitations of VAM-based measures of teacher effectiveness (e.g., Papay, 2012; Rothstein, 2010), and the guidance from the American Educational Research Association, American Psychological Association, and National Council of Measurement in Education (1999) Standards for Educational and Psychological Testing, there has also been a movement to develop multiple-measures evaluation systems to determine teacher effectiveness by combining VAM scores or other achievement data with observational ratings of teachers’ pedagogical quality, and stakeholder input (e.g., from student survey ratings of teacher quality). In these systems, pedagogical quality is a subset of the larger construct of teacher effectiveness—a definition we also use here. The Bill & Melinda Gates Foundation’s Measures of Effective Teaching (MET) study was designed to provide evidence to policymakers as to the appropriate design of these multiple-measures evaluation systems. Many states have included multiple-measures evaluation systems in state policy under the Race to the Top or Elementary and Secondary Education Act waivers, making them an important topic of study.
Although there is increasing attention paid to these multiple-measures evaluation systems, the research and policy work in this area have generally ignored the potentially important role of content coverage in predicting effective teaching as defined by either value-added measures or by composite measures of effectiveness. The literature tells us that variation in content coverage remains a pressing policy issue, both within and across states (Schmidt et al., 2011), and there is widespread belief that the content of instruction matters—otherwise, why have content standards? Indeed, aligning instruction with content standards is one of the central policy goals underlying standards-based reform (Smith & O’Day, 1991), and alignment is a major focus of federal standards policies. Despite this, there has never been a large-scale analysis of the relationship of both instructional alignment and pedagogical quality to the prediction of VAM. Nor has there been a large-scale study of the relationship of instructional alignment with multiple-measures teacher effectiveness ratings.
This omission of instructional alignment in the literature has both technical and conceptual problems. Technically, the exclusion of alignment from models predicting VAM or other MET may lead to omitted variable bias (for instance, if teachers rated more effective also practice more aligned instruction and it is the alignment driving student achievement gains). That is, the correlations used to derive optimal weights for composites (e.g., Mihaly, McCaffrey, Staiger, & Lockwood, 2013) may be spurious once instructional alignment is controlled. It is also plausible that there could be an interactive effect of instructional alignment with pedagogical quality, such that pedagogical quality only matters, or matters more when that instruction is aligned with standards or the assessment. Conceptually, given the centrality of instructional alignment in the theory of action underlying standards-based reforms, it makes little sense not to study and measure the extent to which teachers actually cover the content in the standards.
To attempt to address these holes in the literature, we conducted a substudy of the MET project, which we present here. The overarching goals of the study were to answer three research questions pertaining to the relationship of instructional alignment with two policy-relevant outcomes—teacher VAM and a composite measure of effectiveness like those currently being enacted in the states:
In what follows, we begin with a brief review of our conceptual framework and other empirical work in this area. Next, we describe the design of the study and the instrumentation, as well as the obtained teacher sample, and we present our analytic strategies. Third, we present our results. Finally, we conclude with a discussion of the limitations and challenges of the work and implications for policy and research.
Conceptual Framework
The conceptual framework guiding our analysis is based on OTL. Students’ opportunity to learn the content of state standards is at the heart of standards-based educational reform efforts (Porter, 1995). A central premise of standards-based reform policies is that the content of teachers’ instruction is weak and variable across sites, owing in large part to the conflicting messages teachers receive about what they should teach (Smith & O’Day, 1991). It is thought that providing teachers with more consistent messages through content standards and aligned assessments, curriculum materials, and professional development will lead them to align their instruction with the standards, and student knowledge of standards content will improve. To the extent that the standards represent a “good target,” student OTL will result in improved student knowledge and skills.
There is abundant evidence from the literature that OTL (including instructional alignment and pedagogical quality) affects student achievement. This appears to be true at both the macro- and the micro-levels. For instance, international comparative studies have found that opportunity to learn the content on international assessments (such as the Trends in International Math and Science Study) is associated with nation-level performance (e.g., Schmidt et al., 2001) and with differences in performance across U.S. states (Schmidt et al., 2011). At the classroom level, numerous studies have indicated associations of OTL variables with student performance (e.g., Cueto, Ramirez, & Leon, 2006; D’Agostino, Welsh, & Corson, 2007; Ruiz-Primo, Shavelson, Hamilton, & Klein, 2002). In some cases, the effects of OTL are so large that there is no statistically significant residual between-course level (e.g., between general and honors levels) variation in achievement gains after controlling for OTL (e.g., Gamoran et al., 1997; Yoon & Resnick, 1998).
There are several important nuances in the OTL literature. One is that the identified effect of OTL depends substantially on the measures of teaching employed. There are numerous dimensions of teachers’ instruction that might influence students’ learning. A recent review (Kurz, 2011) identifies three primary dimensions—instructional time, content, and pedagogical quality. These dimensions can be captured using self-report, as is often done for measures of content coverage (e.g., the alignment index proposed by Porter, 2002), or using observations or student surveys as is often done for measures of pedagogical quality (e.g., Danielson, 2007; Ferguson, 2008). Even within types of measurement strategies, there are important decisions to be made about what and how to capture instruction for the purposes of creating OTL indices. For instance, self-report measures can be semester- or year-end measures (Porter, 2002), or they can be daily or weekly log measures (e.g., Rowan, Camburn, & Correnti, 2004). Observational or student survey tools focus on diverse measures of pedagogical quality based on the theories of instruction that undergirded the creation of the tools (e.g., Danielson, 2007; Ferguson, 2008; Grossman et al., 2010; Hill et al., 2008; Pianta & Hamre, 2009). It is logical, and research finds, that the choice of pedagogical quality measure can substantially affect its predictive power (Polikoff, 2010). In this study, we employ a widely used year-end survey measure of instructional content that has substantial validity evidence (discussed below). We also use observational and student survey measures of teacher quality that have been studied and adopted in numerous state and district evaluation policies. Thus, our work captures two of the three dimensions of OTL using among the highest quality measures available.
A second important nuance is that the identified association of OTL with student learning can vary substantially based on the assessment used to measure that learning. This is a reflection of the fact that assessments vary in their sensitivity to instruction (Polikoff, 2010; Popham, 2007). One dimension that has been identified as affecting an assessment’s sensitivity is its proximity to instruction (Ruiz-Primo et al., 2002). Ruiz-Primo et al. identify four levels of proximity: immediate, close, proximal, and distal; they argue that distal assessments, such as state or national standardized tests, are likely to show the weakest effects of OTL. Even within levels of assessment, however, there appear to be differences in the extent to which test results reflect OTL. For instance, there is recent evidence that state assessments—which are all distal to instruction—differ in their sensitivity to several measures of pedagogical quality (Polikoff, 2012b). It is not yet clear why some state tests reflect OTL differences more strongly than other tests, and our study does not have a large enough sample size to explore differences in sensitivity across the state tests studied, but this is a fruitful area for ongoing investigation (Popham, 2007). One reasonable hypothesis is that the more sensitive assessments are those that are more tightly aligned to the content taught by teachers.
Although there is a substantial literature on OTL and its associations with student learning outcomes, this study contributes to the literature in several ways. First, it is among the first studies to include well-established measures of both instructional alignment and pedagogical quality in their association with VAM. To our knowledge, there is no prior study that includes both a widely used observational measure of pedagogical quality and a detailed measure of instructional alignment in the same model. Second, it is the first to do so in the context of multiple state standardized tests—six states, two grades, and two subjects. Although our sample size in any one state is not sufficient to conduct state-by-state analyses, our multi-state data enhance the generalizability of the work relative to previous studies. Third, this study is among the first to use as dependent variables classroom-level VAM measures of the sort now commonly used in states and districts for evaluating teachers. And fourth, this study is the first to relate instructional alignment to composite measures of teacher effectiveness now being widely implemented in the states. Given that policymakers are taking results from these composite evaluation systems as evidence of “good teaching,” we sought to understand whether “good teachers” practice more aligned instruction.
Method
Study Design
Intended Sample
The intention of the study design was to allow for investigation of the associations of instructional alignment with other measures of teacher effectiveness across two grades and two subjects. Thus, we selected fourth- and eighth-grade mathematics and English language arts (ELA). Preliminary power analyses indicated that samples of 81 teachers were needed to detect an increase in R2 of .1 in the regression equation predicting VAM—we viewed .3 correlations as conservative given the .45 correlation of alignment with achievement gains found in a previous study (Gamoran et al., 1997). Thus, we targeted 81 teachers at each grade/subject, for a total target sample of 324 teachers. To the maximum extent possible, the goal was to spread the teachers evenly across the districts participating in the MET study. These six districts are New York City, Dallas, Denver, Charlotte–Mecklenburg, Memphis, and Hillsborough County (Florida). For the remainder of this article, districts are reported anonymously due to confidentiality agreements with the districts.
To recruit teachers, we began with a list of teachers in each MET district in each target grade/subject. The intention was to target only a random selection of teachers. However, to meet sample size goals, we eventually attempted to recruit all teachers in each district in the target subjects and grades. Teachers were contacted by email approximately 4 weeks before the end of the 2010 school year and invited to participate. Teachers completed a short online response form indicating their willingness to participate. In five of the six districts, teachers were offered a gift card for their participation; the sixth district did not allow teacher compensation. Participation was voluntary for all teachers.
Teachers who indicated that they would like to participate were contacted within 1 week of the end of the school year. They were sent a link to an online survey of the content of their instruction using the Surveys of Enacted Curriculum (SEC) content taxonomies. The survey instructed teachers to think about a target MET class, which we randomly selected in advance. Although each teacher was assigned only one target class on which to focus, some fourth-grade teachers of both mathematics and ELA opted to complete the survey for both subjects (n = 49). These teachers’ survey responses for both subjects are used here.
Obtained Sample
The obtained teacher sample for the research is drawn from all six MET partner districts. In total, 701 teachers were contacted to participate because they taught in the target grades/subjects. Of these, 388 signed up to participate, for a 55% sign-up rate. Among those who signed up, 278 or 72% actually completed a survey (49 of whom completed surveys in both subjects). Thus, the overall participation rate was 39%. The participating teachers are concentrated in a few districts—100 of the 327 surveys come from District 4 and 90 come from District 6. The best participation rate was in District 3, where 83% of teachers signed up to participate and all of them actually did participate. The worst rate was in District 5, where just 29% of recruited teachers signed up to participate and 38% of them actually completed the survey. Both of the District 5 rates are significantly lower than the rates for the other districts combined (z = 6.97, p < .001 and z = 8.29, p < .001, respectively). This was the district that did not allow for teacher compensation. If we exclude this district, the sign-up rate for the remaining districts was 62% and the completion rate was 89%. District 1 did not have any fourth-grade teachers participating in the larger MET study, and Districts 2 and 3 did not have any eighth-grade teachers. We met our 81-teacher target in fourth grade but did not meet it in eighth grade in either subject.
Given these response rates, we sought to verify that the participants were representative of the full sample of MET teachers. Descriptive statistics on each category of teachers (eligible participants, sign-ups, and non-respondents) are shown in Table 1. These descriptive statistics include classroom characteristics and VAM, Tripod, and Framework for Teaching (FFT) scores. The comparisons highlight few meaningful differences among the groups. There are three significant differences in the table—teachers who signed up had classes that were significantly White (t = 2.37, p < .05) and significantly less Black/American Indian (t = −2.28, p < .05) than teachers who did not sign up. Similarly, teachers who did not complete the survey had classes with significantly more Black/American Indian students than teachers who did complete the survey (t = −2.00, p < .05). However, there are no significant differences or obvious patterns in terms of indicators of teacher quality between participants and nonparticipants. It is possible that the groups differ on some unobserved variables (e.g., motivation, agreeableness, amount of free time to complete the survey) that are associated with instruction and student outcomes.
Characteristics of Study Participants and Non-Participants
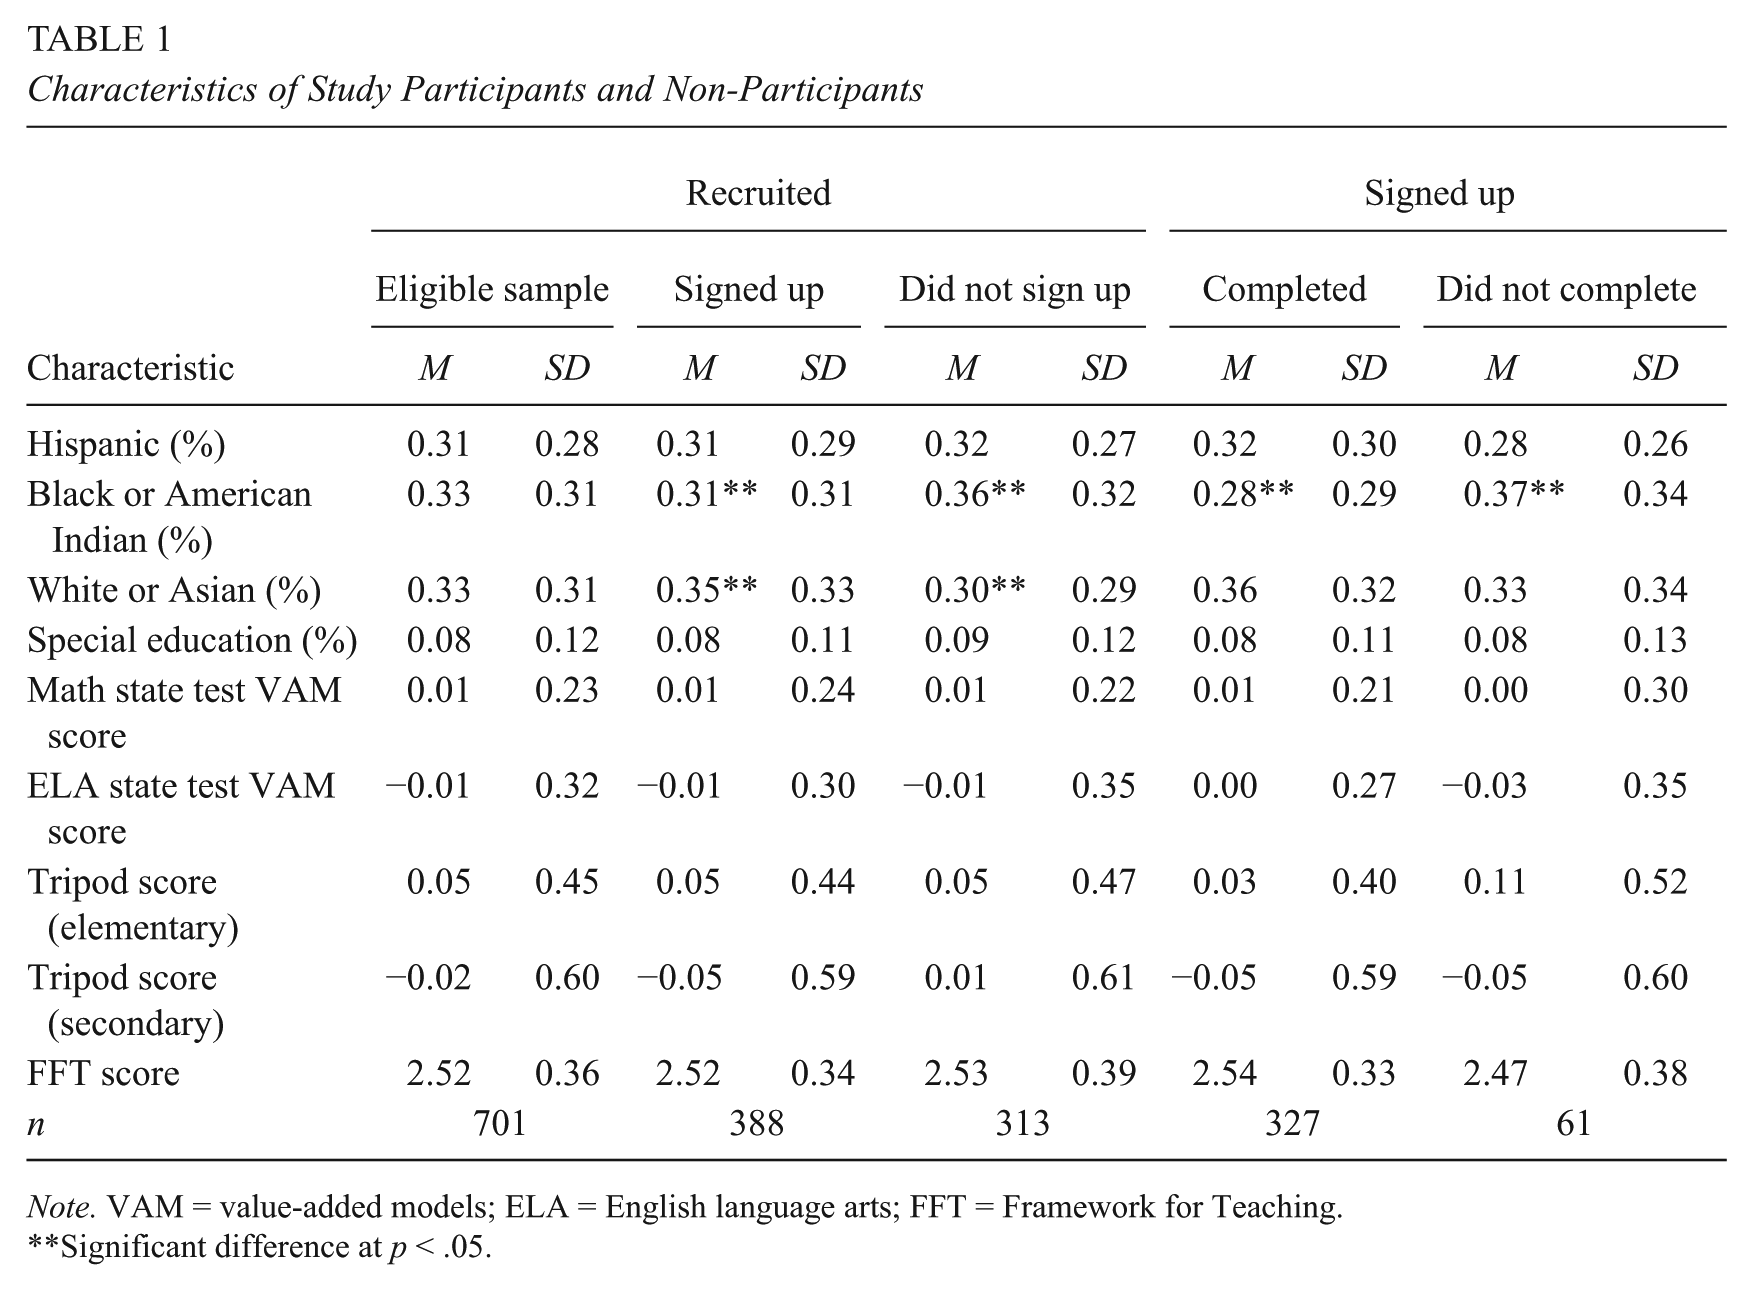
Note. VAM = value-added models; ELA = English language arts; FFT = Framework for Teaching.
Significant difference at p < .05.
Instrumentation
SEC
The measure of instructional alignment used for the study was based on the SEC content taxonomies (Porter, 2002). The tools grew out of research on teachers’ content decisions in mathematics (e.g., Freeman et al., 1983), but the content areas measured by the SEC have expanded to include ELA, science, and social studies. The surveys define content at the intersection of specific topics and levels of cognitive demand. The lists of topics were developed over time with input from teachers and subject area experts and are intended to represent an exhaustive list of the topics covered in K–12 instruction in the target subjects. Fine-grained topics (e.g., multiply fractions) are grouped underneath coarse-grained topics (e.g., operations); there are 183 fine-grained topics in mathematics and 133 in ELA. There are five cognitive demand levels—These differ slightly between math and ELA but generally range from memorization to application or proof. The surveys are available for download online at http://seconline.wceruw.org/secWebHome.htm
Teacher survey
For teachers completing the surveys, the task is as follows. First, they are instructed to think about a target class and target time period. For this study, they were assigned a target class from among their MET course sections and asked to think about the entire school year. Teachers then indicate, from the list of fine-grained topics, which topics they did not cover at all during the target time period. For the remaining topics they did cover, teachers indicate the number of lessons spent on each topic, based on a scale of less than one lesson, one to five lessons, or more than five lessons. Finally, teachers allocate their instructional emphasis on each topic among the five levels of cognitive demand, using a scale of 0% of time, less than 25% of time, 25% to 33% of time, and more than 33% of time. The teachers’ responses are represented by proportions of total instructional time, with each proportion representing the percent of the total year’s instruction spent on each particular topic by cognitive demand combination (cell, in SEC language).
Content analysis
Although the teacher surveys can serve many purposes, the primary purpose for this study was to compare teachers’ survey responses with SEC content analyses of standards and tests to estimate instructional alignment to the target documents. For this investigation, state assessments and state content standards were analyzed for the target subjects and grades in all six participating states, with two exceptions. Two of the states (not identified here to protect state identities) would not allow content analysis of their assessments due to state law. Alternate assessments used in the MET study (the Stanford Achievement Test, 9th series [SAT-9] and the Balanced Math Assessment [BMA]) were also content analyzed with the SEC. Content analyses were carried out by teams of three trained raters. In the case of assessments, content analyses are sometimes carried out at the state department of education headquarters, as was the case for two of the states here. The raters are content-area experts with advanced degrees. All content analysts participating in the current study were experienced analysts who had worked with the SEC for an extended period of time.
Content analysis procedures begin with a short refresher on the procedures. Next, the content analysts analyze the target documents using the SEC language. The task focuses on each document at the finest grained level of detail possible; for assessments that is test items, while for content standards that is generally objectives. Each analyst examines each item or objective and places it into one or more cells in the SEC taxonomy. Multiple cells are allowed because many items and objectives tap multiple topics and/or levels of cognitive demand. Test items may be placed in up to three cells, while objectives may be placed in up to six (in practice, test items do not cover as many cells as objectives). In either case, the weight for each objective or item is evenly divided among the identified cells so that the content analysis accurately represents the proportion of “points” available on the document. Test items are weighted by their number of score points (e.g., a 2-point item placed in three cells would mean two thirds of a point in each cell), while objectives are evenly weighted. Although it would be possible to construct alternative weighting schemes for objectives, such as weighting by some measure of importance, we do not take this approach for at least two reasons. First, most standards documents do not offer weights of importance for objectives. Second, weighting by importance would require identifying a robust system for ranking objectives according to their perceived importance by teachers. Equal weighting is therefore the most replicable and fair approach. The final result of a content analysis for a single analyst is a set of proportions indicating the percent of total standards (or test) content in each cell in the SEC framework. These proportions are then averaged across content analysts to arrive at the final content description of the target document.
Validity evidence for the SEC and alignment index
The most important validity evidence for the SEC comes from three studies. In an early study using a previous version of the instrument, teacher reports on daily logs were correlated with year-end surveys and with ratings by external observers, with correlations generally above .5 and often as high as .7 or more (Porter, Kirst, Osthoff, Smithson, & Schneider, 1993). A study of opportunity-to-learn in high school mathematics showed correlations of nearly .5 between instruction to test alignment and student achievement gains (Gamoran et al., 1997). And an intervention study showed that professional development resulted in significant increases in teachers’ instructional alignment in mathematics (Porter, Smithson, Blank, & Zeidner, 2007). Together, this evidence suggests teachers can accurately report on the content of their instruction and that these reports can be useful as both predictors and outcomes in intervention studies.
Alignment
The main alignment index was first described by Porter (2002). The index can be calculated for any two documents or between instruction and a document. The formula is as follows:
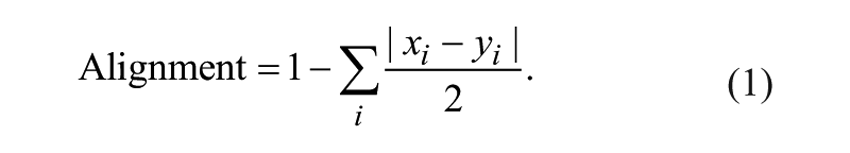
Here, the i subscript represents each cell in the SEC framework; the xi are the cell proportions in document x (e.g., the teacher survey) and the yi are the cell proportions in document y (e.g., the state test). This is mathematically equivalent to the sum of the cell-by-cell minima. Thus, the alignment index is a proportion ranging from zero to one representing the proportion of exact cell-by-cell agreement. The alignment index has been used in a number of studies and has been shown to have desirable properties as a teacher-level independent or dependent variable. For instance, studies have considered the alignment among assessment and standards documents across states or with the Common Core (Polikoff, Porter, & Smithson, 2011; Porter, 2002; Porter, McMaken, Hwang, & Yang, 2011; Porter, Polikoff, & Smithson, 2009) and the alignment of teachers’ instruction with standards and assessments under NCLB (Polikoff, 2012a, 2012c). In general, alignment indices in these analyses have been below 0.5, with means ranging from 0.2 to 0.3 depending on subject and alignment target.
Pedagogical Quality Measures
As part of the MET study, participating teachers were measured on several indicators believed to capture aspects of effective teaching. One measure was the Tripod student survey (Ferguson, 2008). The Tripod measures student perceptions of the seven C’s: care, control, clarify, challenge, captivate, confer, and consolidate. This survey was administered to each student member of the teacher’s target class. Subscales are highly reliable (α > .80). For the purposes of this analysis, as in the main MET reports and when the survey is used in practice, all items are averaged to obtain a composite score.
Each teacher’s instruction was also recorded using video capture technology for the purpose of rating the teacher’s pedagogical quality. Four lessons were captured per teacher—at least two of these lessons from “focal topics” (e.g., for fifth-grade mathematics, adding and subtracting fractions). Each observation was scored by a different trained rater on several observational protocols. We use only the data from the FFT protocol (Danielson, 2007), because this protocol or a variant on it is now widely used in states revising their teacher evaluation policies. Training took 17 to 25 hours, and raters had to pass an exam to move on to coding classroom videos. The FFT protocol used in the MET project includes eight subscales—four each in the areas of “classroom environment” and “instruction.” The four “classroom environment” subscales are (a) creating an environment of respect and rapport, (b) establishing a culture of learning, (c) managing classroom procedures, and (d) managing student behavior. The four “instruction” subscales are (a) communicating with students, (b) using questioning and discussion techniques, (c) engaging students in learning, and (d) using assessment in instruction. The subscale scores were averaged to create a composite score as is done in the main MET reports and in states and districts using the FFT. Thus, the value for each teacher can be taken as the average of their pedagogical quality as measured by the FFT across all observed lessons. Reliabilities of the observational ratings were above .6.
We explored the possibility of analyses using the subscale-level data. However, while subscales of the FFT and Tripod vary in their correlations with VAM (Polikoff, 2012b), none of the subscale correlations are strong (i.e., all smaller than .25). The results we present do not meaningfully change if we use subscale measures of pedagogical quality rather than composite scores. For more details on the FFT and Tripod, see Bill & Melinda Gates Foundation (2012).
Student Achievement Data
VAM data are value-added estimates based on student-level test results from the state assessments and two supplementary assessments. We use the MET project’s main value-added estimates because student-level data were not available for us to analyze. Briefly, these value-added estimates were calculated as follows (Bill & Melinda Gates Foundation, 2010). First, for each test, student scores were standardized to have mean 0 and standard deviation 1 within each district, year, and grade level. The student-level data were then analyzed with the following model:
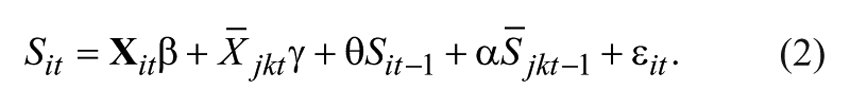
Here, the i subscript represents the student, j subscript represents the teacher, the k subscript represents the course section, and the t subscript represents the year.
Analysis
To answer our first research question, we begin by presenting simple zero-order correlations of the three instructional alignment indices with VAM scores by district, grade, and subject. The three indices are the content alignment of instruction with state standards (correlated with value-added on the state test), the content alignment of instruction with the state test (correlated with value-added on the state test), and the content alignment of instruction with the alternate test (correlated with value-added on the alternate test). We study two separate alignment indices for their correlations with state test VAM; we view instructional alignment to the state standards as an important potential predictor of achievement gains because standards alignment is a central goal of standards-based reform policy, and because aligned instruction is intended to improve student performance on state assessments (Smith & O’Day, 1991). We present these correlations separately by district and grade because the partner districts are each located in a different state and therefore have a different assessment. Prior research suggests that the correlations of VAM with observational and student survey measures differ depending on the test (Polikoff, 2012b).
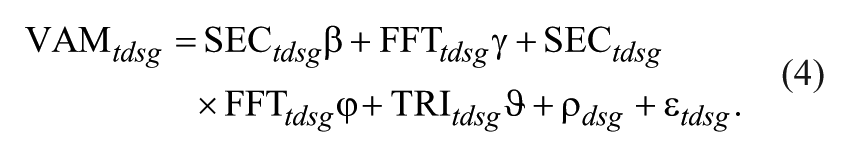
Next, we conduct fixed effects regressions, beginning with three simple models predicting VAM scores from the instructional alignment indices. We include dummy variables for each district/grade/subject combination, so the models are focused on explaining variation in VAM scores within district/grade/subjects (e.g., among eighth-grade ELA teachers in Memphis) using the alignment indices. This accounts for observed and unobserved differences among sites, especially the fact that some documents are more prone to high alignment than others (e.g., those that have fewer score points, those that are coded by more raters; Polikoff, 2012a; Polikoff & Fulmer, 2013). Finally, we fit a model that tests the degree to which instructional alignment explains additional variation in VAM above and beyond that explained by FFT and Tripod. Our final model is as follows:
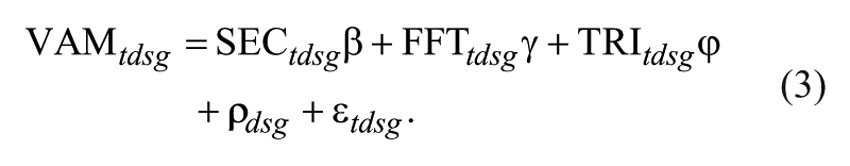
The dependent variable, VAM
tdsg
, represents the VAM estimate for teacher t in district d, subject s, and grade g. SEC is the teacher’s instructional alignment index to the target test (or standards), FFT is the teacher’s rating on the FFT, and TRI is the teacher’s rating on the Tripod. The district/grade/subject fixed effects are contained in the vector
To answer the second question, we present a series of models testing for the presence of moderating effects. Here we center each of the three instructional alignment variables and interact them one at a time with the centered FFT variable, for a total of three regressions per subject. These models take the following form:
A positive coefficient on the interaction term would indicate a positive interaction, such that the association of alignment with value-added is stronger for teachers rated highly on the FFT (or, alternatively, that the association of the FFT score with value-added is stronger in classrooms where more aligned instruction is practiced).
To answer the third question, we first create an equally weighted composite measure across VAM, FFT, and Tripod. To do this, we standardize each measure (VAM scores, FFT scores, and Tripod scores) across the total sample and average them. Our approach follows the methods of the MET main reports (Mihaly et al., 2013) and mirrors the methods used by many states currently implementing multiple-measures teacher evaluation systems. Next, we use the regression technique from Research Question 1 to examine the relationship of alignment with the composite index. The model for this question is as follows:
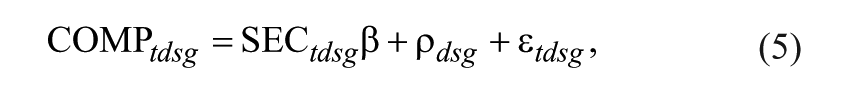
where COMP is the composite measure of effectiveness for that teacher.
Results
The Relationship of Alignment With VAM
Correlations
The alignment of teachers’ instruction with state standards and state and alternate assessments is low in our sample. The maximum alignment to state standards is .41, with a mean of .20 in mathematics and .28 in ELA. The maximum alignment to state tests is .32, with a mean of .16 in mathematics and .15 in ELA. And the maximum alignment to alternate assessments is just .21, with a mean of .08 in mathematics and .06 in ELA. These figures are quite close to data from larger, more national samples (e.g., Polikoff, 2012c).
The zero-order correlations of VAM scores with SEC instructional alignment indices by district, grade, and subject are presented in Table 2. There are three sets of correlations in each subject: alignment to the state standards correlated with state test VAM, alignment to the state test correlated with state test VAM, and alignment to the alternate test correlated with alternate test VAM. Most of the correlations are not significantly different from zero, though there are some correlations that are as large or larger in magnitude than those found for FFT and Tripod measures in the main MET study (see Polikoff, 2012b). The significant coefficients between the instruction-standards alignment and the state test VAM in mathematics are for District 2 (r = .35, p < .05), Grade 4 (r = .22, p < .05), and overall (r = .16, p < .05). In ELA, there is a significant negative relationship between instruction-standards alignment and state test VAM in District 4 (r = −.24, p < .10) and significant positive correlations in District 6 (r = .27, p < .10), Grade 4 (r = .17, p < .10), and overall (r = .14, p < .10) between instruction-alternate test alignment and alternate test VAM.
Correlations of State and Alternate Assessment VAM Measures With Three Alignment Indices by District, Grade, and Subject

Note. Values in each cell are pairwise Pearson correlations and sample sizes. VAM = value-added models; ELA = English language arts.
p < .10. **p < .05. ***p < .01.
Although not statistically significant, there are several other correlations of similar magnitudes. For instance, the pattern of correlations between instruction-alternate test alignment and the alternate test VAM in both subjects indicates some small to moderate correlations, with several district-level correlations of between .20 and .40. Comparing these correlations with those of pedagogical measures and VAM scores (Polikoff, 2012b) suggests that there are varying degrees of sensitivity of state assessments to instructional differences (instructional alignment and pedagogical quality) across districts. For instance, the assessments in District 4 in both subjects tend to be weakly or negatively correlated with all indicators of instructional quality. Unfortunately, District 4 makes up the largest proportion of our teacher sample. Furthermore, in the sample of teachers who completed the SEC, there is just one significant grade-level correlation of either FFT or Tripod with a VAM score (the correlation of Tripod scores and eighth-grade mathematics state test VAM scores) and no significant overall correlations. Overall, the correlations do not show evidence of strong relationships between alignment or pedagogical quality and VAM scores.
Fixed Effects Regressions
The results of the simple fixed effects regressions including only the instructional alignment predictors are shown in Model A in Table 3. There is one coefficient that is significant at the p < .10 level—the coefficient for the relationship of instruction-alternate test alignment with alternate test VAM in ELA (B = 1.45, t = 1.90, p < .09). This coefficient indicates that a 1 standard deviation increase in instruction-alternate test alignment is associated with a .05 unit (approximately 0.2 standard deviations) increase in alternate test VAM scores. Of the other five coefficients, four are positive but not statistically significant, and one is negative but not statistically significant. None of the coefficients are significant if the ELA and mathematics teacher samples are combined (not shown), though all coefficients are positive.
Fixed Effects Regressions of VAM Scores on Alignment Indices
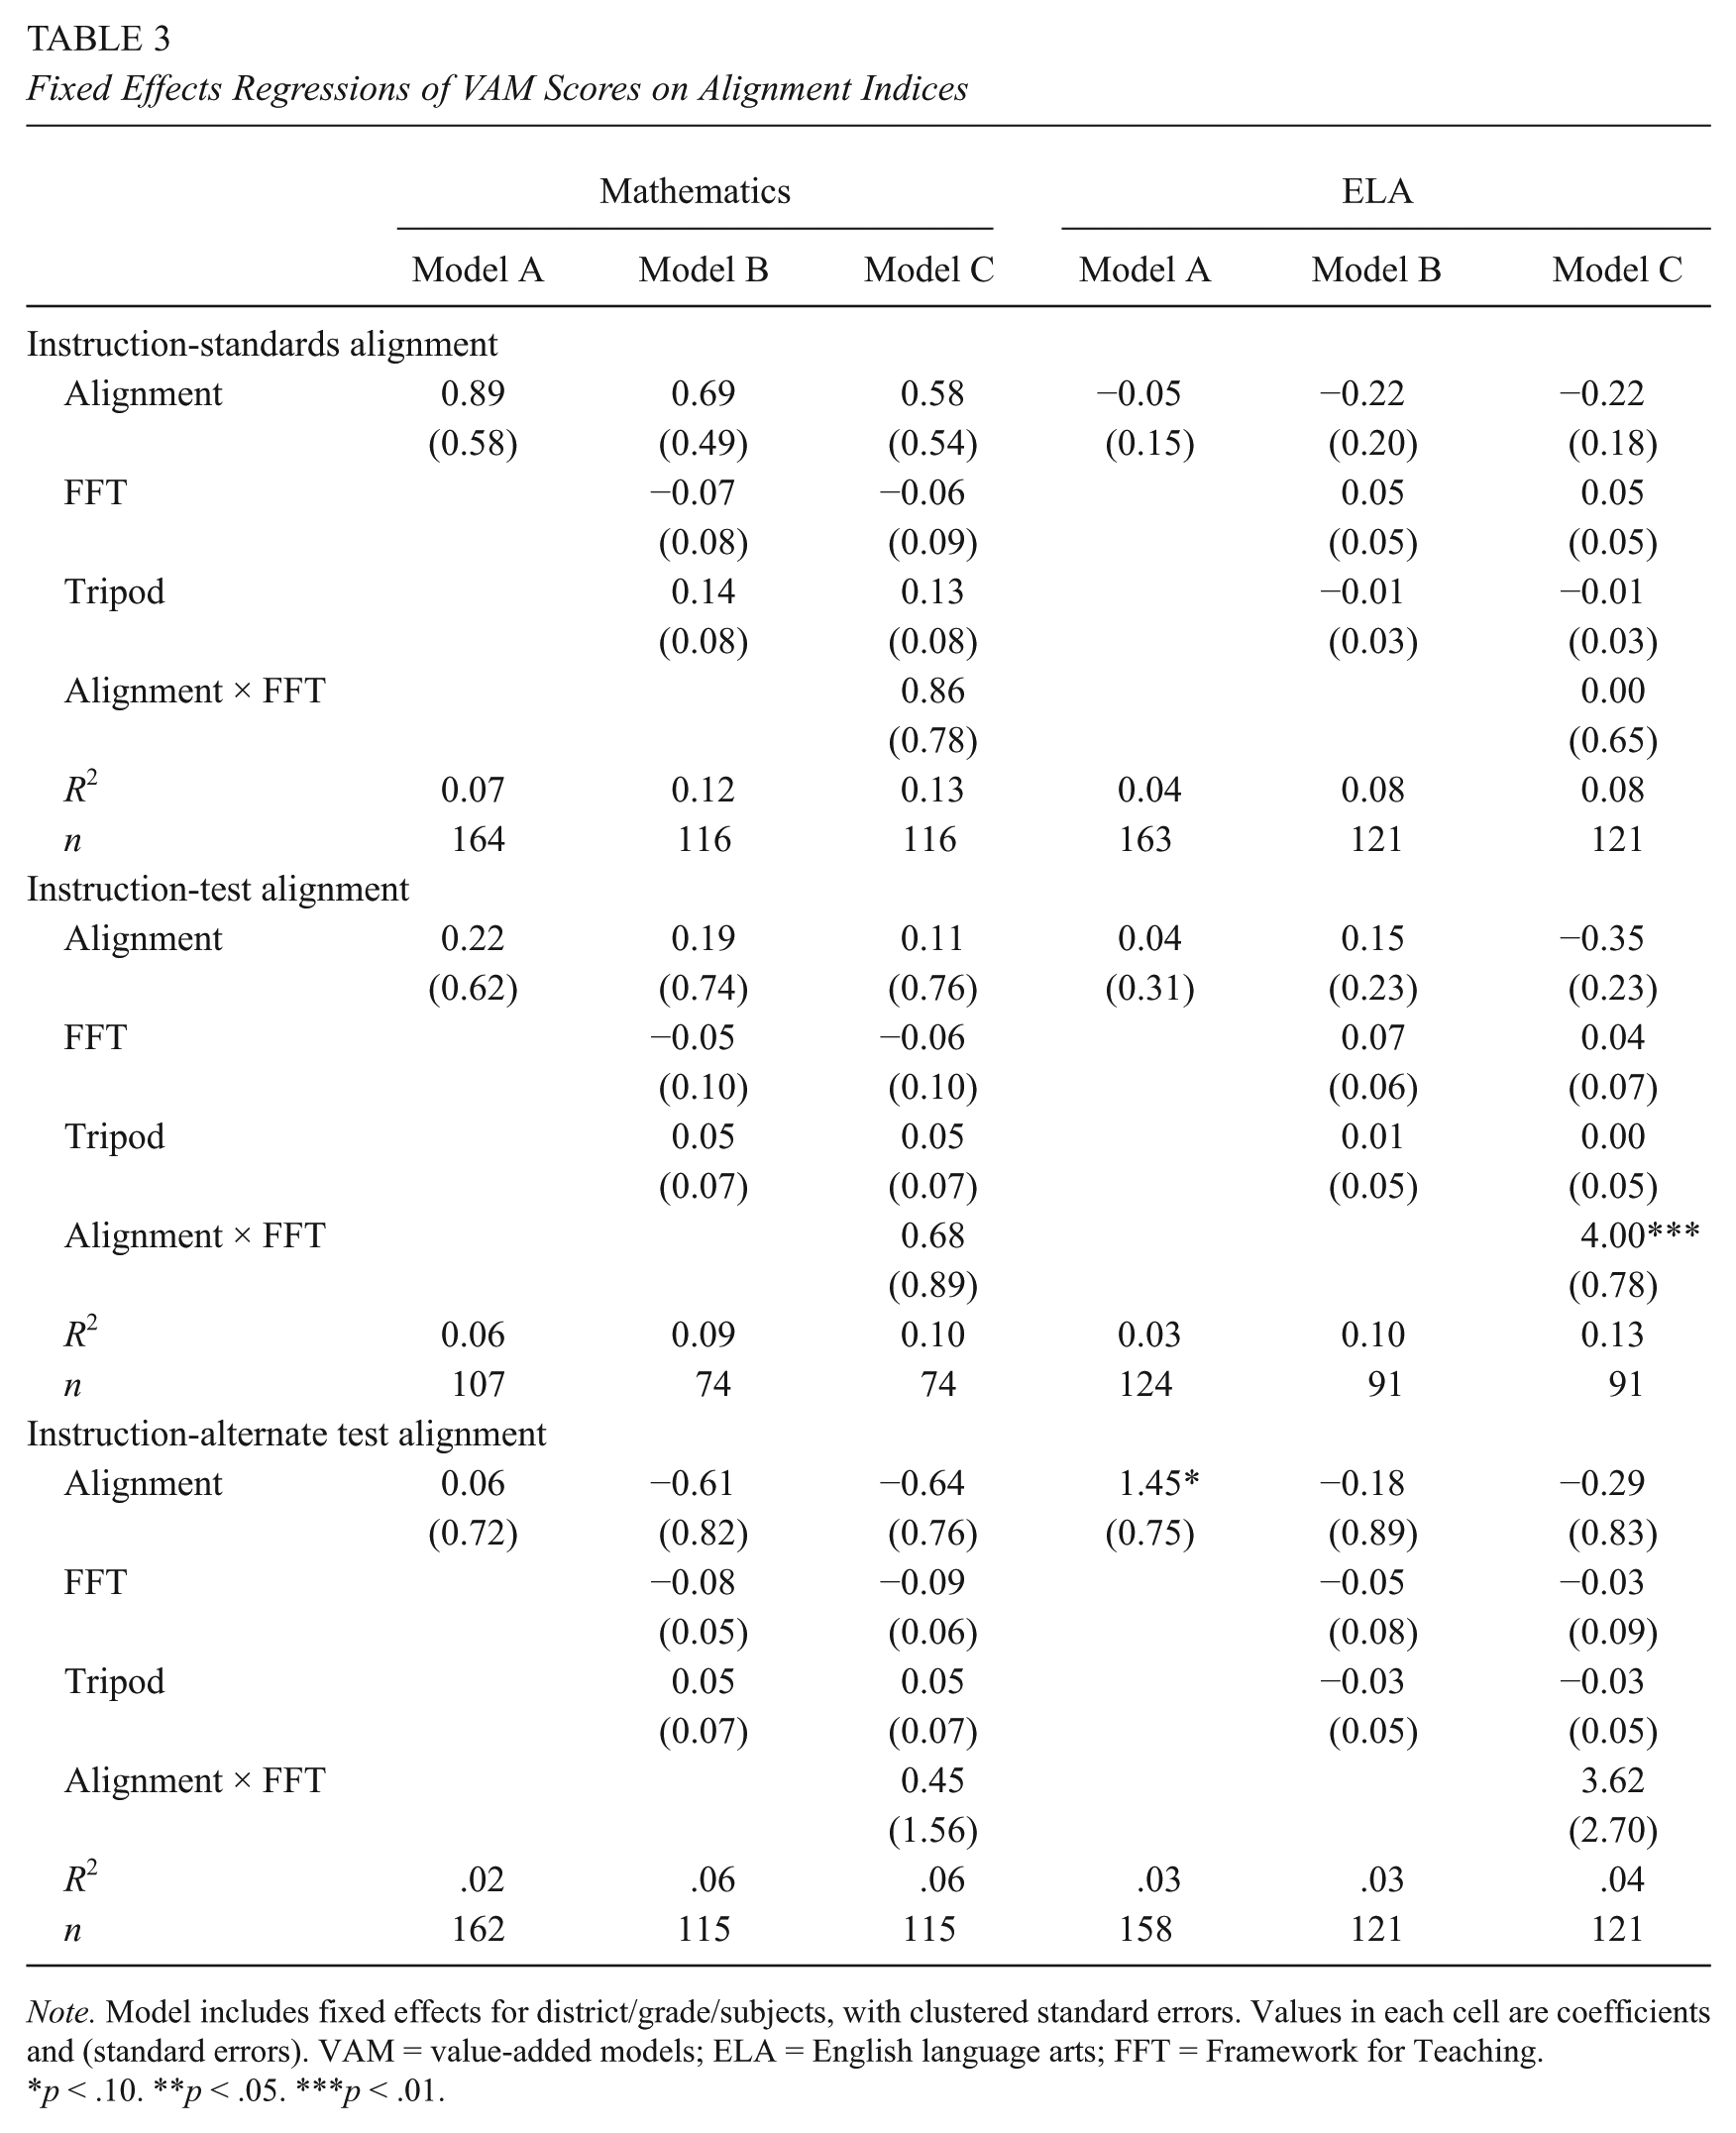
Note. Model includes fixed effects for district/grade/subjects, with clustered standard errors. Values in each cell are coefficients and (standard errors). VAM = value-added models; ELA = English language arts; FFT = Framework for Teaching.
p < .10. **p < .05. ***p < .01.
To compare the relative influence of instructional alignment and pedagogical quality (i.e., FFT and Tripod), Model B shown in Table 3 includes the Tripod measures and the FFT scores in addition to the content alignment indices. There are no statistically significant associations of any of the three variables with any of the VAM outcomes. The finding of lack of relationship between FFT and Tripod to VAM scores is in contrast to the statistically significant relationships found in analyses of the same correlations in the full study database (Bill & Melinda Gates Foundation, 2012; Polikoff, 2012b). Still, the size of relationships both here and in the full study was small.
Moderating Effects
Although we found weak to zero main effects of instructional alignment on the VAM outcomes, it is possible that alignment might have moderating effects on student performance. For instance, it is possible that pedagogical quality and instructional alignment would interact to affect student achievement—for example, alignment affects student achievement more strongly when pedagogical quality is high. To investigate these potential moderating relationships, we conduct a series of interaction models—three in each subject (one for each of the instructional alignment variables). Both the alignment indices and the pedagogical quality variables are centered prior to interacting them, so the main effects can be interpreted as the associations for a teacher at the mean. These results are shown under Model C in Table 3.
Of the six coefficients of interest, one is statistically significant. There is a positive interaction effect of instruction-test alignment and FFT scores in predicting ELA state test VAM (B = 4.00, p < .01). For a teacher one unit above the mean on FFT scores (approximately 3.5 on the 4-point scale), a 1 standard deviation increase in instruction-test alignment (approximately .09 on the alignment scale) is associated with a 0.34 standard deviation increase in state test VAM. For a teacher one unit below the mean on FFT scores, a 1 standard deviation increase in instruction-test alignment is associated with a 0.40 standard deviation decrease in state test VAM. Of the other five coefficients of interest, four are positive but not statistically significant, and one is 0. Together these results provide, at best, modest evidence of an interactive effect of alignment and pedagogical quality, though the results are in the expected direction that the effect of pedagogical quality is positive when alignment is stronger but not when alignment is weaker.
Predicting Composite Measures of Effectiveness
Our final question asks the extent to which measures of instructional alignment are associated with a composite measure of teacher effectiveness. For simplicity, we choose the composite recommended in the main MET reports—an equally weighted composite of standardized measures of VAM, FFT, and Tripod. Our results are not substantively different if we use other composite weights. The composites have weak reliability, because of the low correlations among the components—internal consistency reliability is .40 in mathematics and .30 in ELA.
Zero-order correlations of the composites with the instructional alignment indices are shown in Table 4. There are no consistent or obvious patterns of relationships—quite the contrary, the correlations are as small or smaller than the correlations with VAM. There are just as many statistically significant negative correlations as positive. The regression results, shown in Table 5, also show no relationships of alignment with the composite measure of effectiveness for any of the six regressions. In short, there is no evidence of relationships between alignment and a composite measure of effectiveness.
Correlations of Equally Weighted Composite Measure of Teacher Effectiveness With SEC Alignment Indices by District, Grade, and Subject
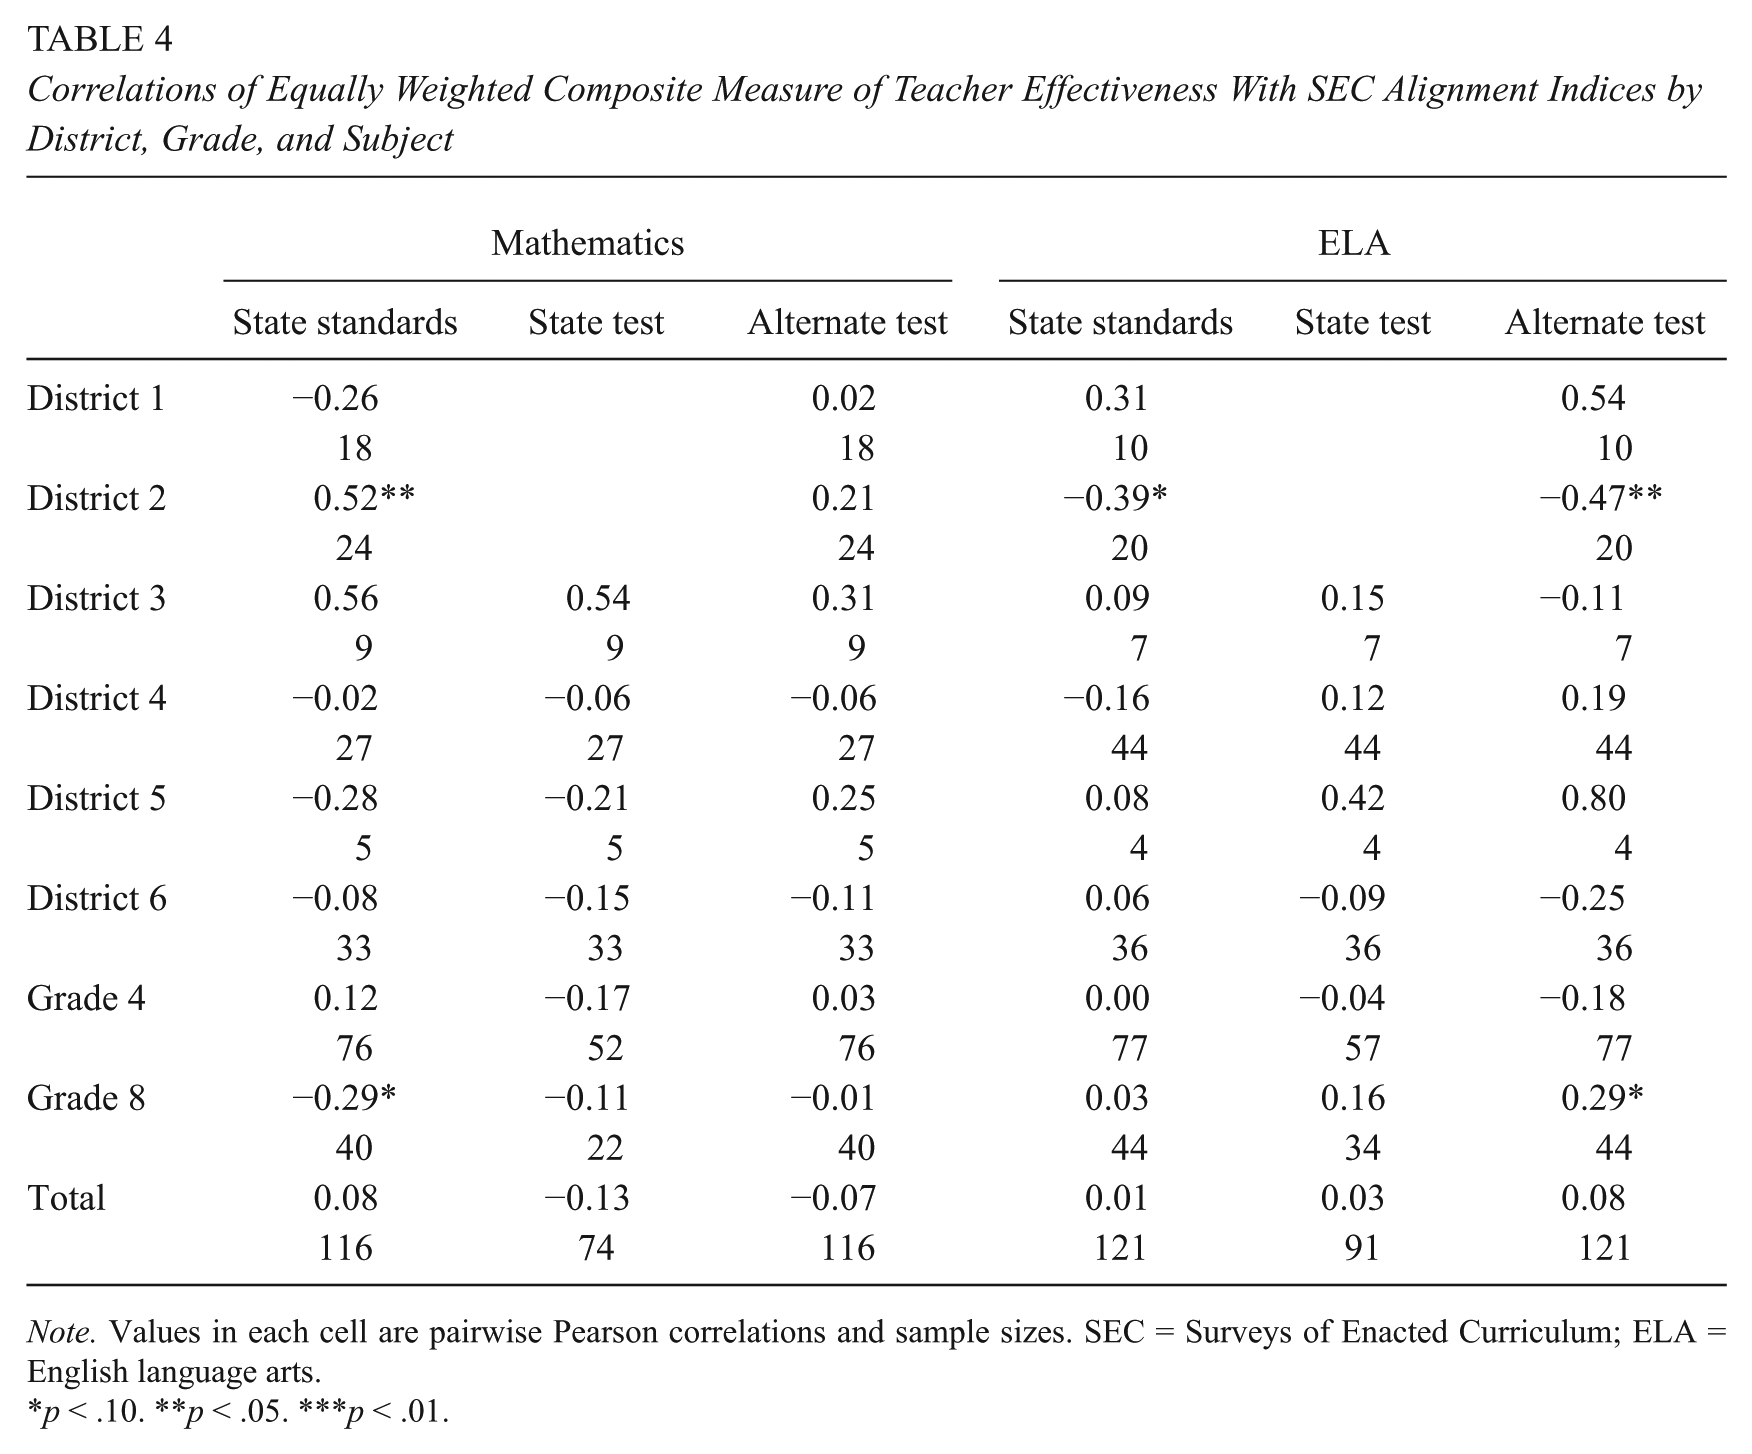
Note. Values in each cell are pairwise Pearson correlations and sample sizes. SEC = Surveys of Enacted Curriculum; ELA = English language arts.
p < .10. **p < .05. ***p < .01.
Six Fixed Effects Regressions of Equally Weighted Composite on Alignment Indices
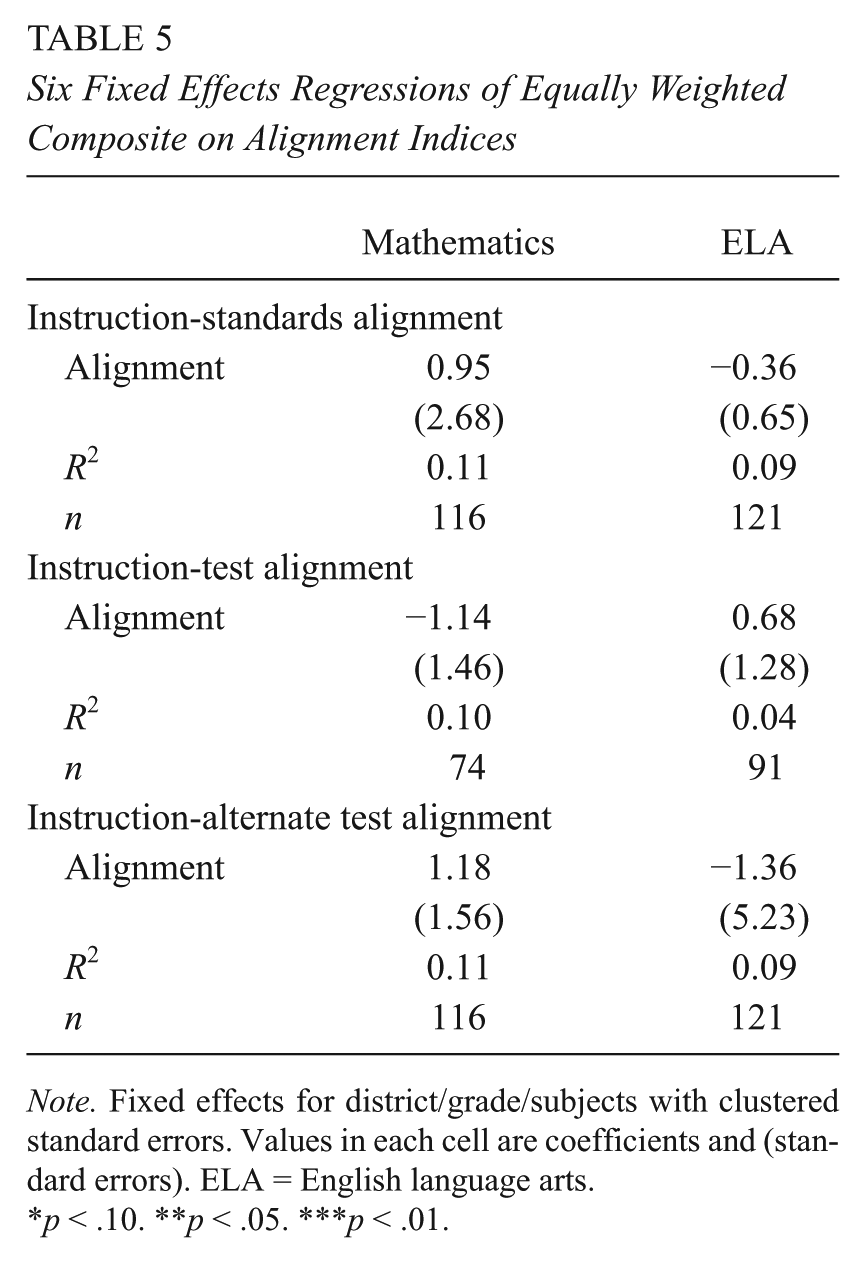
Note. Fixed effects for district/grade/subjects with clustered standard errors. Values in each cell are coefficients and (standard errors). ELA = English language arts.
p < .10. **p < .05. ***p < .01.
Discussion
The purpose of this study was to investigate the role of instructional alignment in predicting other indicators of effective teaching defined by either VAM or a multiple-measure composite. This was the first study to investigate these issues with widely used measures of both instructional alignment and pedagogical quality. For a subsample of approximately 300 teachers from the larger MET study, we surveyed teachers’ coverage of topics and levels of cognitive demand using the SEC. We then compared these survey reports with content analyses of target standards and assessments to estimate alignment. We found modest evidence through zero-order correlations and regressions that alignment indices were related to VAM scores. These relationships went away when controlling for pedagogical quality. We found weak evidence of interaction effects, but the one significant relationship we did find pointed in the expected positive direction (that the association of instructional alignment with VAM is more positive when pedagogy is high quality). Finally, we found no evidence of associations of instructional alignment with a composite measure of teaching effectiveness.
The correlations we found were much smaller than we expected. The design anticipated an increase in R2 of .10, suggesting a correlation of greater than .30. In fact, there were few if any correlations that large between any of the indicators of pedagogical quality and the VAM scores. Nor were there many correlations of that magnitude in the main MET study. Simply put, the correlations of value-added with observational measures of pedagogical quality, student survey measures, and instructional alignment were small.
Hypotheses for Weak Relationships
We explored several possible limitations that we hypothesized might explain our weaker-than-expected relationships. One hypothesis is that the SEC data used here are poor because teachers participating in the substudy did not receive training prior to completing the instrument. Because the instrument is somewhat complex, some studies using the SEC do engage in teacher training, though the previously mentioned study by Gamoran and colleagues (1997) did not. Given the short timeline for data collection and the remote distance of participating teachers, however, training was not possible. We explored this possibility by comparing the responses of the teachers in this study to teachers in previous analyses of SEC data using much larger samples from across the nation (e.g., Polikoff, 2012c). This comparison finds a few small differences between these teachers and others who have completed the SEC before them. For instance, fourth- and eighth-grade mathematics teachers in this study indicated covering an average of 322 and 371 SEC cells, respectively, somewhat higher than national figures of 284 and 348. The reported cognitive demand emphasis of teachers in this study (between 17% and 22% at each level, depending on grade) mirrors the proportions reported in the general population. As mentioned above, the alignment indices we found were also typical of those found in prior studies. It remains possible that teachers in this study had difficulty understanding the survey due to lack of training, but an examination of the survey data do not suggest this is the case.
A second factor we hypothesized may have contributed to our findings is weak relationships due to our chosen method for estimating alignment. Although our chosen alignment index is based on prior work on the SEC (Gamoran et al., 1997; Porter, 2002), there are other ways to define alignment. To investigate this possibility, we compared the results of our main models to the results using one of several alternative definitions of alignment. For instance, in one set of models, we replaced the alignment variable with a variable indicating the alignment at the fine-grained topic level (i.e., ignoring levels of cognitive demand). In another set of models, we replaced the alignment variable with a proportion indicating the percent of total test content on topics/cognitive demand levels not covered at all in the teacher’s instruction. Finally, we tried several variables that characterize the teachers’ instruction without comparison with standard or assessment content (e.g., the percent of reported instruction on the two lowest levels of cognitive demand). In none of these cases, did we find consistent main effects of instructional alignment with either VAM scores or the composite measures of teacher effectiveness. Thus, we ruled out the possibility that our operationalization of alignment drove our findings of small relationships.
A third hypothesis is that there was a limited amount of variation in either the independent or the dependent variables in our obtained sample, relative to the larger MET sample or to “typical” teachers, resulting in attenuated correlations. For the pedagogical quality and VAM variables, we can compare the distributions of each variable in the smaller and larger samples. These comparisons, shown in Table 6, highlight that there is generally a reduction in variation in SEC study subsample as compared with the larger MET sample. These differences are generally between 6% and 50%, with the exception of the Tripod measures (which have 2–3 times as much variation in the full sample as in the subsample). For the alignment variables, we can compare the variance from this study to that from a larger national sample used in a recent analysis of instructional alignment under NCLB (Polikoff, 2012c). These comparisons are not as clean because those national samples included many more teachers scattered across different states than are represented here. However, the results suggest that, except for alignment to state standards in mathematics, the obtained distributions are not dramatically different from national averages in terms of variance. Still, the overall message from the examination of variances is that there is indeed reduced variance in each of the measures in the obtained sample as compared with the larger sample.
Comparing Variances From Reduced Sample to Those From Full Sample
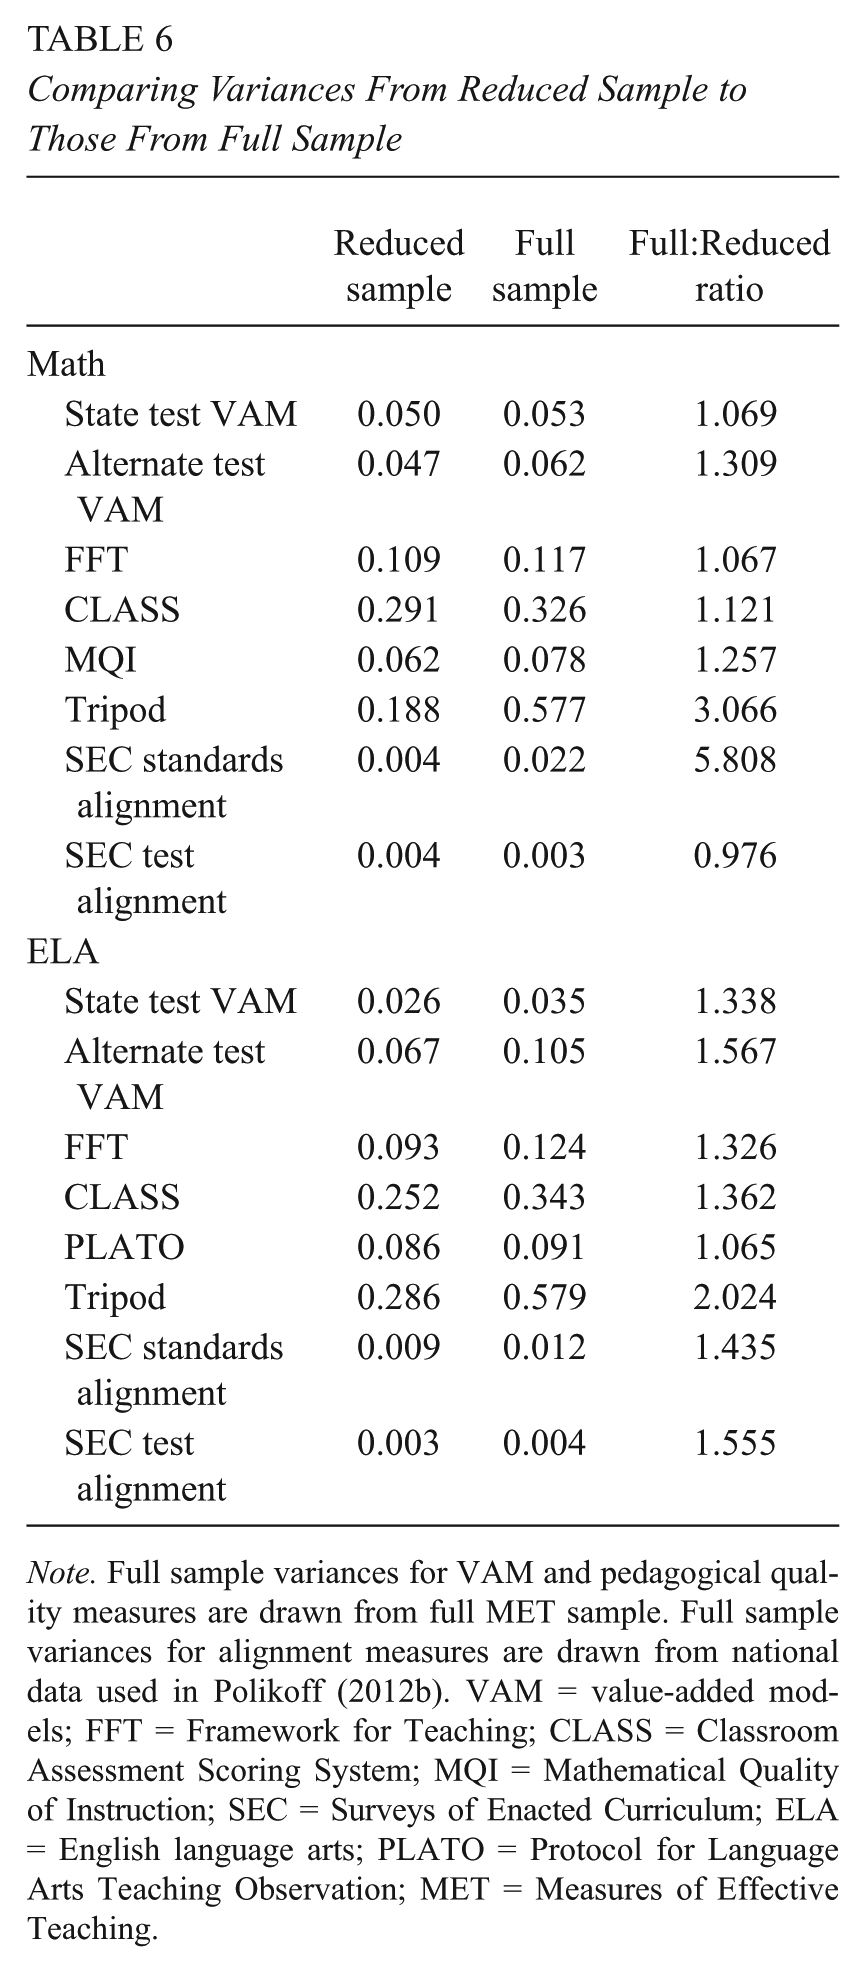
Note. Full sample variances for VAM and pedagogical quality measures are drawn from full MET sample. Full sample variances for alignment measures are drawn from national data used in Polikoff (2012b). VAM = value-added models; FFT = Framework for Teaching; CLASS = Classroom Assessment Scoring System; MQI = Mathematical Quality of Instruction; SEC = Surveys of Enacted Curriculum; ELA = English language arts; PLATO = Protocol for Language Arts Teaching Observation; MET = Measures of Effective Teaching.
A fourth hypothesis we explored is that there is something else about our teacher sample not yet discussed that resulted in idiosyncratically small correlations of instructional measures and VAM scores. Table 7 compares the full MET sample (fourth- through eighth-grade teachers) with the current study subsample on the correlations of observational and student survey measures with VAM scores. Looking just at the overall correlations for each quality measure, in seven of the eight cases, the correlations are larger in magnitude in the full MET sample as compared with the study subsample, though even the full sample correlations are generally weak (generally .20 or below). In four of the eight cases, the sign of the correlation switches direction between the full MET sample (positive) and the study subsample (negative), and three of these differences are statistically significant. These results suggest that the obtained sample may indeed have differed from the larger MET sample in a way that diminished the correlations of pedagogical quality measures with VAM scores. As shown in Table 1, however, the obtained sample is quite similar to the fourth- and eighth-grade teachers in the full MET sample on observable classroom and teacher characteristics. Thus, there may be some unobservable factor that distinguishes our subsample teachers from the broader set of MET teachers and that also somewhat reduces the correlations of observational and student survey measures with VAM. It is not clear what such a factor would be. Whether this is also true for correlations of alignment indices with VAM scores is impossible to say, but it is of course a possibility.
Correlations of State and Alternate Assessment VAM Scores With Scores on Tripod and FFT, Small Sample Versus Full MET Sample
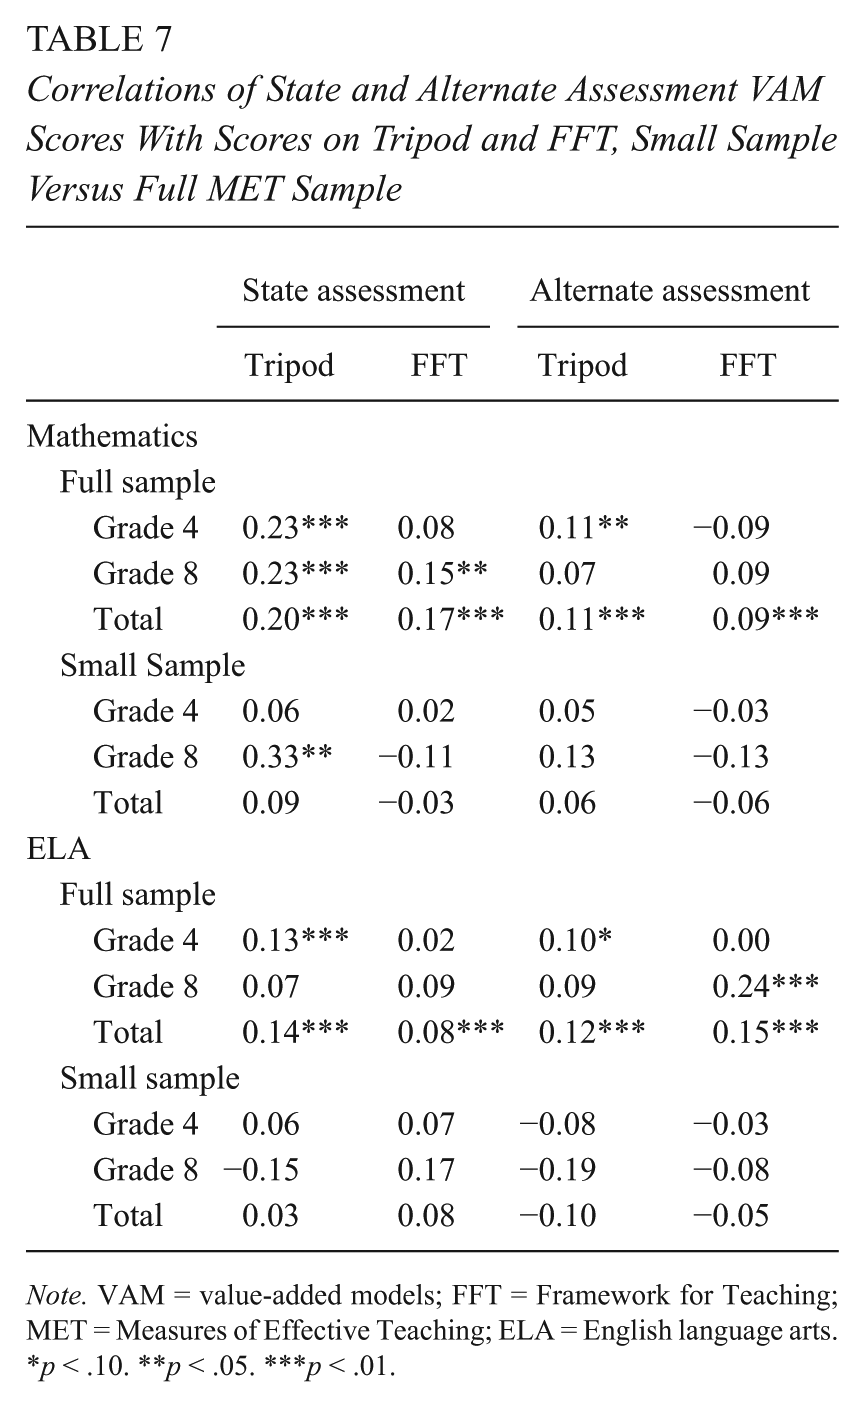
Note. VAM = value-added models; FFT = Framework for Teaching; MET = Measures of Effective Teaching; ELA = English language arts.
p < .10. **p < .05. ***p < .01.
Considerations on Instructional Alignment and Teacher Evaluation
Overall, the results are disappointing. Based on our obtained sample, we would conclude that there are very weak associations of content alignment with student achievement gains and no associations with the composite measure of effective teaching. Although we explored several factors that may have limited the association of OTL with MET, we are left with the conclusion that there are simply weak relationships among these constructs in the populations investigated here. One interpretation of this conclusion is instructional alignment and pedagogical quality are not as important as standards-based reform theory suggests for affecting student learning. A second interpretation is that instructional alignment and pedagogical quality are as important as previously thought, but that the SEC and FFT do not capture the important elements of instruction. Given the volume of literature that links OTL to achievement and the quality of the instructional measures used in this study, either interpretation would be surprising and troubling. For one, these interpretations would suggest that instructional improvement is not likely to be a fruitful path for influencing what and how much students learn. Alternatively, they would suggest that the decades of research underlying these two instruments (and the other instruments in the MET study, which showed correlations of similar magnitude) have not identified what really matters in instruction.
A third interpretation of our findings is that the tests used for calculating VAM are not particularly able to detect differences in the content or quality of classroom instruction. That is, rather than the instructional measures being the cause of our low correlations, it is the tests that are the cause. Both state standardized tests and the alternate assessments used in the MET study are quite distal to the day-to-day instruction occurring in classrooms (Ruiz-Primo et al., 2002). Empirical and conceptual work illustrates that these kind of assessments tend to be, at best, weakly sensitive to carefully measured indicators of instructional content or quality (e.g., D’Agostino et al., 2007; Greer, 1995; Popham, 2007; Ruiz-Primo et al., 2002). Thus, this hypothesis seems both plausible and troubling. Although we would not expect perfect correlations of instructional measures with VAM, correlations at or near 0 should raise concern. And if our research, using high-quality measures, finds low correlations, it is quite likely that the correlations will be low as these systems are rolled out in states and districts. Low correlations raise questions about the validity of high-stakes (e.g., performance evaluation) or low-stakes (e.g., instructional improvement) inferences made on the basis of value-added assessment data. Taken together with the modest stability of VAM measures (e.g., McCaffrey, Sass, Lockwood, & Mihaly, 2009), the results suggest challenges to the effective use of VAM data. At a minimum, these results suggest it may be fruitless for teachers to use state test VAMs to inform adjustments to their instruction. Furthermore, this interpretation raises the question—If VAMs are not meaningfully associated with either the content or quality of instruction, what are they measuring?
Before moving forward with new high-stakes teacher evaluation policies based on multiple-measures teacher evaluation systems, it is essential that the research community develops a better understanding of how state tests reflect differences in instructional content and quality. Researchers have been calling for work on the sensitivity of assessments to instructional content and quality since the dawn of criterion-referenced testing (e.g., Polikoff, 2010; Popham, 2007; Popham & Husek, 1969). However, this study contributes to a growing literature suggesting state tests may not be up to the task of differentiating effective from ineffective (or aligned from misaligned) teaching, except insofar as effective teaching is defined as future VAM (e.g., Winters & Cowen, 2013). Especially as standardized tests are used for an increasing array of purposes, including evaluating the performance of individual teachers, it is essential that researchers verify that tests can indeed detect differences in what and how well teachers teach.
As the Common Core rolls out, it is imperative to develop a deeper understanding of the ways effective teachers implement the standards in the classroom. Although this study makes a limited contribution in this regard, we nonetheless believe that research on teacher effectiveness needs to take a more explicit focus on both the content of instruction and the quality with which it is delivered. Instructional time, the third component of the OTL framework (Kurz, 2011), should also be considered. Given the current policy focus on teachers as the most important within-school factor affecting student learning, there is substantial work to be done to understand the most essential elements of instruction for helping students master advanced knowledge and skills.
Footnotes
Declaration of Conflicting Interests
The author(s) declared no potential conflicts of interest with respect to the research, authorship, and/or publication of this article.
Funding
The author(s) disclosed receipt of the following financial support for the research, authorship, and/or publication of this article: This research was generously supported by the Bill and Melinda Gates Foundation.
Authors
MORGAN S. POLIKOFF is an assistant professor of education at the University of Southern California Rossier School of Education. His research focuses on the design and effects of standards, assessment, and accountability policies.
ANDREW C. PORTER is the dean and George & Diane Weiss Professor of education at the University of Pennsylvania’s Graduate School of Education. His research focuses on curriculum policies and their effects.