
Abstract
Most U.S. public school teachers participate in defined benefit retirement plans, which base benefits on years of service and their last few years of salary. These plans are often backloaded and include sharp economic incentives. We consider the implications of transitioning to a cost-equivalent defined benefit plan under which teachers would earn benefits more evenly across their careers. We show that new teachers who are risk averse would prefer the alternative plan. The magnitude is often substantial. For example, for an entering teacher the certainty equivalent for the CB plan is about 2.1 times the certainty equivalent for the respective FAS plan in New York City and 29 times larger than the respective heavily backloaded FAS plan in Philadelphia.
Keywords
Introduction
The majority of U.S. public school teachers participate in defined benefit plans under which annual benefit payments in retirement are based on final average salary (FAS) and years of service. By their nature, FAS plans are “backloaded” such that teachers accrue a very small benefit in the early and middle parts of their careers and then earn very large benefits in late-career years. Thus, while long-term teachers tend to earn relatively valuable benefits under these systems, those who fail to work for a full career under the same plan commonly earn benefits less valuable than the contributions made on their behalf (Backes et al., 2016). Though their defined benefit plans insulate teachers from investment risk, the backloaded nature of these plans exposes entering teachers to what we might call “attrition risk”—the chance (likelihood) that an entering teacher is not employed within the system long enough to receive a meaningful retirement benefit.
We evaluate whether and the extent to which risk-averse entering teachers would prefer transitioning to a cost-equivalent defined benefit plan under which they would earn benefits more evenly across their careers. Specifically, we compare teacher preferences under FAS plans to model cash balance (CB) plans that offer the same investment and longevity protections, but teachers would earn benefits that are a constant percentage of their cumulative earnings.
The literature regarding worker preferences across different retirement savings plans has focused on whether public employees should prefer a FAS or a defined contribution (DC) plan similar to the 401(k) systems commonly offered to professionals in the private sector (for instance, McCarthy, 2003; Poterba, Rauh, Venti, & Wise, 2007; Schrager, 2009). 2 This prior research has found each style of plan to be desirable under certain circumstances. Recent empirical research suggests that public school teachers, particularly young teachers, are relatively likely to choose DC or hybrid systems over the FAS systems when offered the opportunity (Chingos & West, 2015; Goldhaber, Grout, Pennucci, & Bignell, 2012). This is an important and ongoing debate but is often complicated by the sheer number of factors that contribute to the overall design under either model.
Less well understood, however, are employee preferences across various patterns of retirement benefit accrual holding other factors constant. That is, how should entering employees prefer to accrue benefits across their careers if investment and longevity protections are the same between differing designs? We are not aware of any prior work that considers employee preferences for the distribution of retirement benefits within the guaranteed benefit structure. Such analysis is necessary because the nature of employee preferences is not immediately clear. A more smoothly accruing plan design would ensure that those who exit before reaching the plan’s retirement thresholds receive meaningful retirement compensation for each year of service. However, current FAS plans would often offer considerably higher benefits to those who remain in the same system until retirement. Better understanding entering teachers’ preferences regarding how they earn retirement benefits across their careers is particularly policy relevant because many jurisdictions are considering, or have already made, significant plan design changes for new employees (Brainard & Brown, 2016).
We demonstrate that risk-averse teachers would prefer a cost-equivalent CB plan to the FAS plans offered under today’s pension systems. We then evaluate teacher preferences between the currently operating FAS systems and respective cost-equivalent CB plan in two large urban districts—New York City and Philadelphia—and show that magnitude of the preference is quite large given empirically grounded assumptions about risk aversion.
We focus on only one of several factors that policy makers must consider when designing a retirement plan. Obviously, there are many other considerations that must be weighed before making changes to current systems. For instance, at any given level of total cost employers must balance the retirement compensation provided to younger teachers against the ability to reward long-term employees. Furthermore, because retirement benefits represent a substantial portion of a teacher’s total compensation (McGee & Winters, 2017), it is possible that changes in the distribution of benefits could impact teacher quality by influencing recruitment and the pattern of attrition (Brown, 2013; Koedel, Podgursky, & Shi 2013; McGee & Costrell, 2010; Ni & Podgursky, 2016). Our unique contribution is to isolate and analyze how entering teachers would view a more equitable distribution of retirement compensation. While our findings do not on their own justify a major policy change, our illustration of just how little entering teachers value the distribution of benefits under current plans has important consequences for the ongoing pension reform conversation.
Modeling Current FAS Plans and Cost-Equivalent CB Plans
The majority of public school teachers in the United States earn retirement benefits under a FAS structure. 3 In these systems, teachers earn a lifetime annuity that can only be accessed once they reach their plan’s retirement eligibility thresholds, generally a combination of age and years of service. The size of a teacher’s annuity (i.e., the monthly check she will receive in retirement) increases as she accrues more years of service in the same system and as her salary increases. For a teacher of any given age and years of service, we can calculate the total dollar value of the annuity she has earned to date taking into account how long she will have to wait to start receiving her annuity and her life expectancy. The details of this calculation and the others described in this section are included in the Appendix in the online version of the journal.
The purpose of this article is to compare retirement compensation under the FAS system with a cost-equivalent CB system that exhibits a more even accrual pattern across teachers’ careers. Under the CB design, at each point in a teacher’s career retirement compensation is a constant percentage of cumulative earnings, so the value of retirement benefits increases at a relatively constant rate. The next section will provide more detailed descriptions of the accrual patterns under the two different plan designs.
The simplest way a CB plan can work in practice is for the employer to contribute a consistent percentage of earnings each year to notional individual accounts and guarantee a consistent annual investment return on the accumulated contributions in those accounts. 4 To model CB plans that have the same expected cost as current FAS plans, we calculate the constant percentage of earnings that employers would need to contribute to the FAS plan to cover the expected benefits earned by a cohort of entering teachers. This value is the constant contribution rate that employers would need to make to teachers’ notional accounts under a CB plan for the two plans to be cost-equivalent. In our model, the guaranteed investment return for the CB notional accounts would be equal to the interest rate used to calculate the value of FAS benefits.
The Pattern of Retirement Benefits Accrual
Figure 1 illustrates retirement compensation over the career of an example 25-year-old entrant into New York City’s public teaching workforce. The solid line illustrates the present value of retirement benefit under the current FAS. The dashed line illustrates the present value of retirement benefit under the cost-equivalent CB plan.
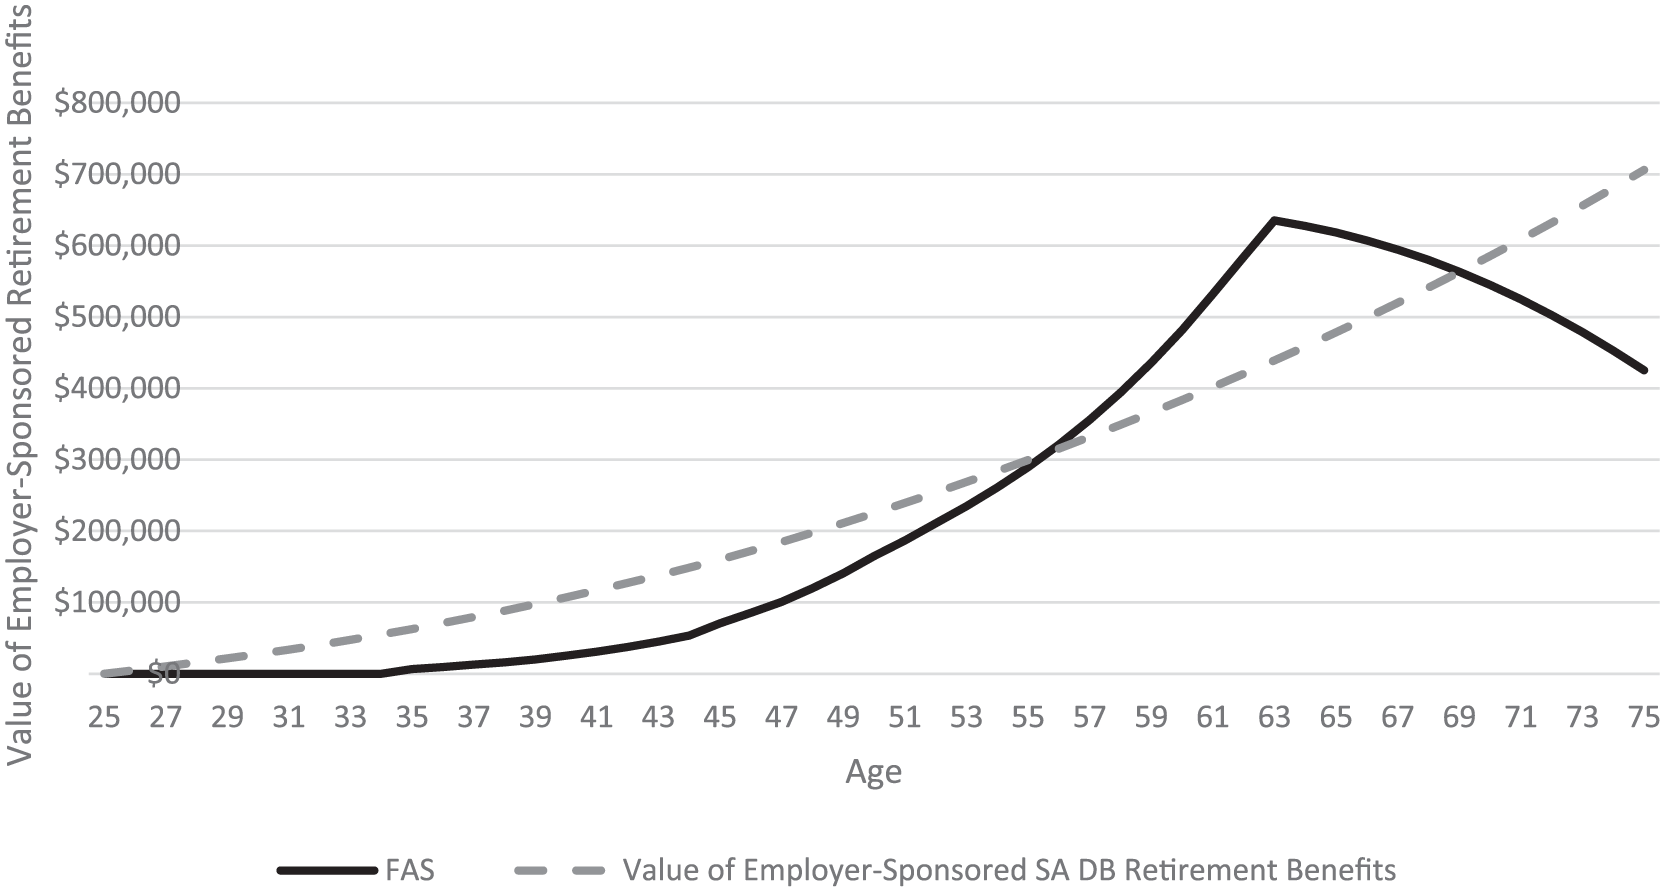
Value of employer-sponsored retirement benefits: New York City (constant dollars).
Figure 1 clearly illustrates the backloaded nature of retirement benefits under the FAS. Teachers earn relatively little retirement compensation for each year of work in the early and middle portions of their careers. Then, as teachers near retirement they earn much larger benefits each year until they hit the system’s maximum at the specified normal retirement age.
Under the CB plan, illustrated by the dashed line, teachers earn consistent benefits for each year of work. Thus, compared with the FAS plan, the CB plan offers much more generous retirement benefits to those who do not work a full career under the same system, but a much smaller benefit for those who remain in the same system until the plan’s specified normal retirement age. The CB plan offers workers more valuable benefits than does the current FAS from the time our example worker is hired until she reaches age 55 at which point the FAS offers more valuable benefits. The CB system would again offer better benefits if the employee works until age 70.
Figure 2 illustrates the proportion of entering teachers expected to remain within the system at each subsequent age, also known as the cohort survival rate. The solid line illustrates this cohort survival rate under the current plan according to the plan’s decrement tables and the dashed line illustrates the predicted cohort survival under a CB plan according to a calculation described in the Appendix in the online version of the journal, which are based on applying recently published empirical results for the relationship between changes to retirement benefits and teacher attrition. 5
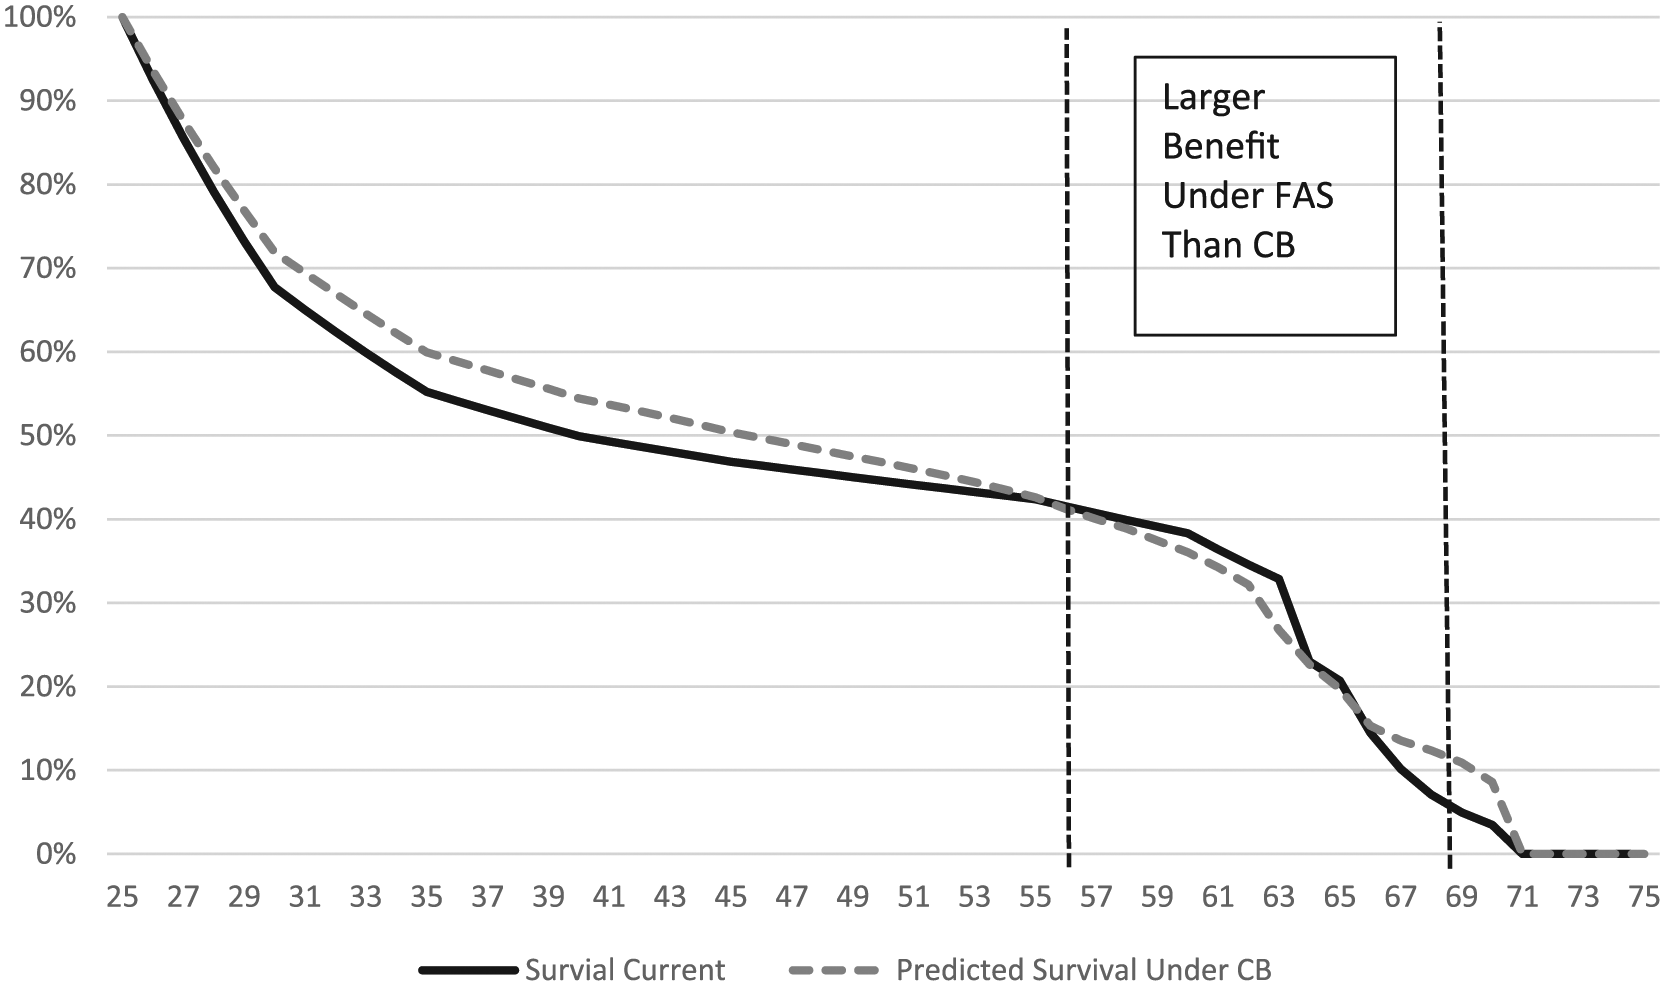
Teacher attrition probabilities: New York City.
The cohort survival rates are important for at least three reasons. First, they illustrate the proportion of teachers who benefit from or are harmed by the backloaded structure of the FAS design. Only teachers who exit at the ages between the dashed lines on the figure receive a larger benefit under the FAS system than under the CB—that is, on Figure 1 the FAS line is above the CB line for teachers who exit at these ages. Even in New York City, which has relatively low teacher turnover for an urban district, only approximately 42% of teachers are expected to remain in the system until age 55 at which point the present value of the employer-sponsored retirement benefit under the FAS design becomes larger than that of the CB design. The majority of 25-year-old entering teachers would exit with a larger benefit under the CB system.
The second reason that the cohort survival rates are important is that they drive the difference in the value of CB and FAS benefits—the gap between the FAS and CB lines on Figure 1. At ages when the CB line is above the FAS line, the contributions made by the employer on behalf of the teacher are more valuable than the benefit that the teacher would receive if he leaves the system. That is, a teacher who exits during these years would in essence earn a negative return on the employer’s contribution to their retirement benefit. When workers leave the system during this period, part of the employer contribution made on their behalf is reallocated to provide a larger benefit for teachers who remain employed by the school system for a full career. That is, the FAS system only offers more valuable late-career benefits relative to the CB system to the extent that there is a large number of teachers who leave the system with benefits that are less valuable than employer contributions made on their behalf. Said another way, if all entering teachers worked a full career, the FAS plan would cost a lot more and the CB line on Figure 1, representing accumulated contributions and interest, would need to touch the very peak of the FAS line to keep the cost of the system constant.
The more backloaded the FAS plan, the more teachers would benefit from a cost-equivalent CB plan. For example, Figure 3 illustrates retirement compensation and Figure 4 illustrates cohort survival in Philadelphia. The Philadelphia plan heavily backloads pension benefits late into an employee’s career, and attrition in Philadelphia is very high for early- and mid-career teachers. Teachers who remain in the system for 25 years, or until age 50, would benefit from the current system. However, only about 18% of entering 25-year-old teachers are expected to remain employed in the system for that amount of time.
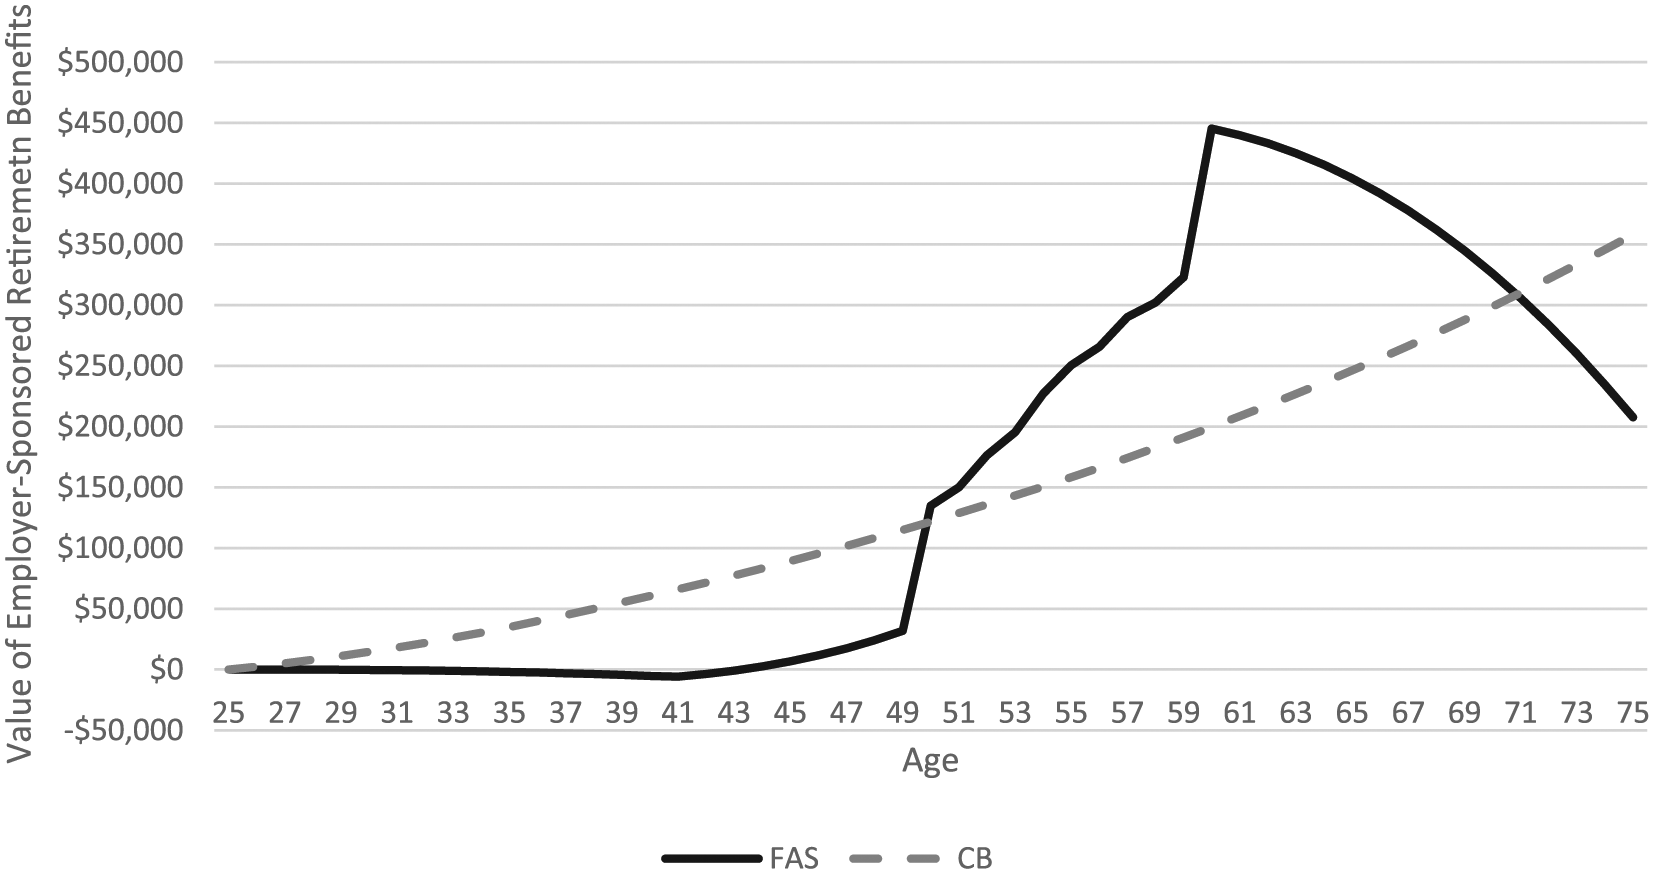
Value of employer-sponsored retirement benefits: Philadelphia, PA (constant dollars).
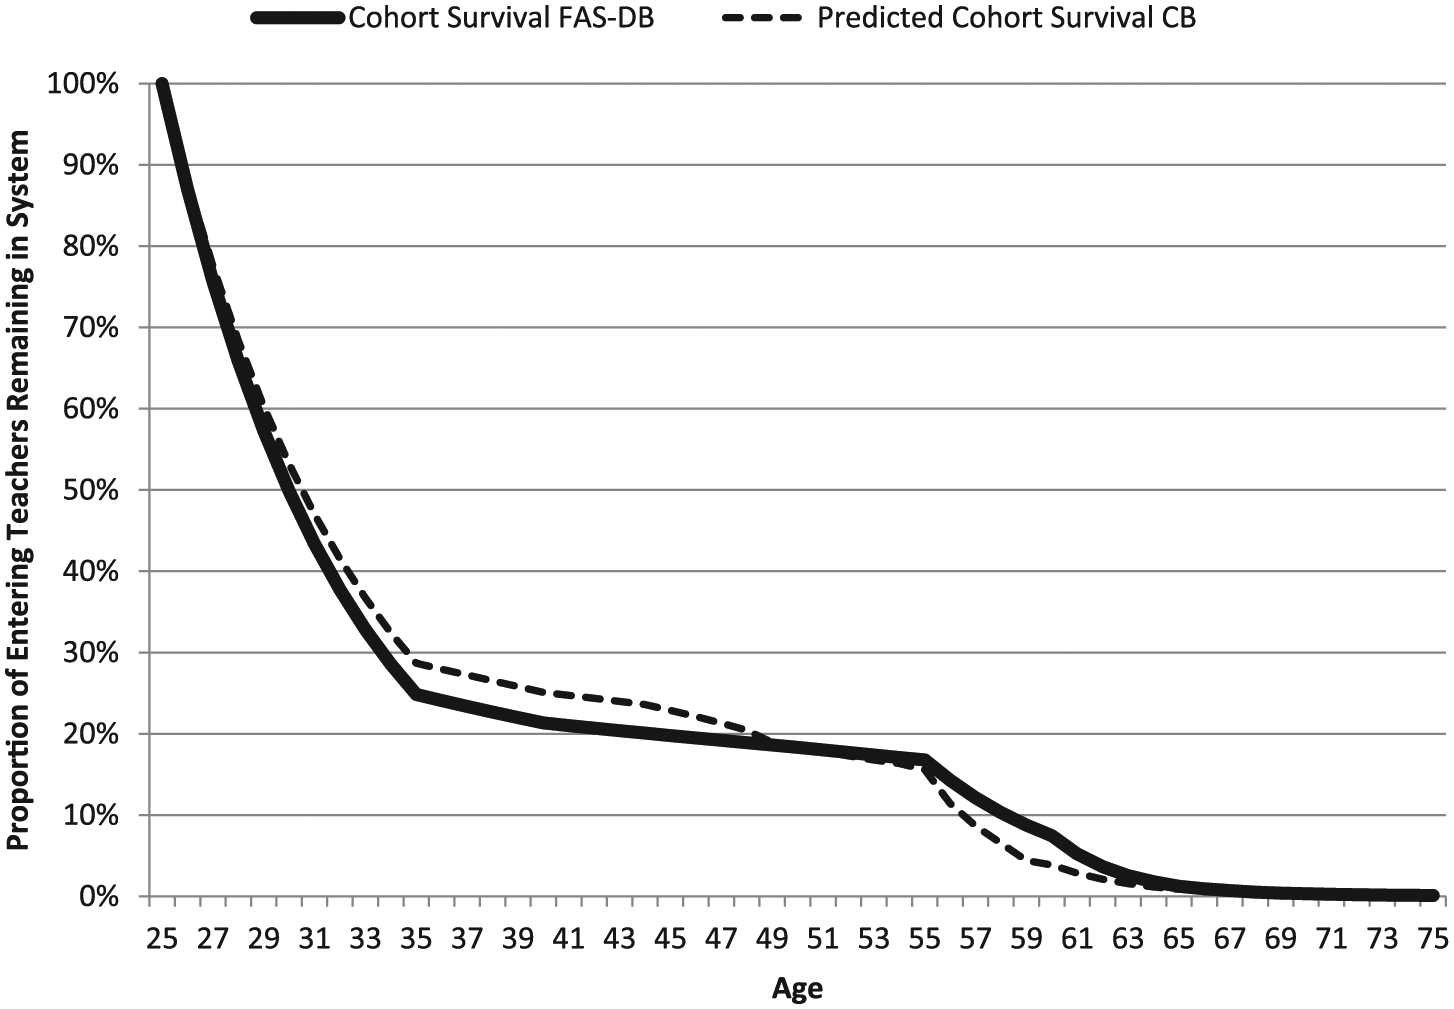
Teacher attrition probabilities: Philadelphia.
The third reason that cohort attrition is important to consider is that changes in teacher attrition rates caused by moving to a CB plan could have policy implications. From the school system’s perspective, the primary concern is that the transition to a CB plan would increase mid-career teacher exits reducing both average experience and quality. Such a change in teacher attrition behavior is worrisome because prior empirical research demonstrates that more experienced teachers are, on average, more effective than are the novice teachers who are likely to replace them should they exit the system (Clotfelter, Ladd, & Vigdor, 2007; Gordon, Kane, & Staiger, 2006; Hanushek, 1997, 2003; Hanushek et al., 2005; Rivkin, Hanushek, & Kain, 2005). Somewhat surprisingly, however, applying recent empirical results to current cohort survival rates results in a prediction that movement to a CB system would have only a very small impact on mid-career teacher exits (i.e., between 15 and 25 years of service). Rather, as illustrated on the dashed lines in Figures 2 and 4, the predicted attrition patterns under the CB plan imply that the larger impact of transitioning to a CB plan would be to delay the exit of more late-career teachers. Though fully modeling the effect of changing to a CB plan on teacher quality is beyond the scope of this article, this result suggests the any such effect would likely be small and could in fact be positive, at least in the short run. 6
Evaluating Preferences of Entering Teachers for Retirement Compensation Distribution
We consider teacher preferences between retirement compensation offered under the current and respective cost-equivalent CB systems by treating the issue as a choice under uncertainty. Each of the two plans provides entering teachers with a lottery for retirement compensation where the payoff is the retirement benefit earned at each possible year of exit weighted by the probability that the teacher exits in that year. We evaluate which pattern of retirement compensation—that is, which lottery—an entering teacher should prefer given different assumptions about their aversion to risk and expectations about their years of service. 7
Our primary analysis considers the preferences of a 25-year-old female entrant to the teaching workforce who at the time of hire has no particular expectation about the number of years she will remain enrolled in the pension system. That is, in the cases of New York City and Philadelphia, we assume that our entering teacher’s probability of exit matches historical pattern of teacher attrition within that particular pension system as illustrated on Figures 2 and 4. Because our exit hazard rates are tethered to the plans’ expected attrition rates, this analysis offers a reasonable estimate for the average entering teacher within the current system. We then use the predicted attrition pattern illustrated in Figures 2 and 4 to determine exit rates under a cost-equivalent CB plan. 8
When offered a choice between two distributions of retirement compensation, a risk-neutral teacher would prefer the lottery that offers the highest expected utility at the point of entry. By design, the CB systems we consider have the same expected value as the respective current system to which it is directly compared. Thus, a risk-neutral entering teacher who is uncertain about the number of years she will remain in the classroom is indifferent between the plans.
Empirical research, however, suggests that workers are at least somewhat risk averse (see, for instance, Chetty, 2006). In addition, anecdotes and at least one laboratory experiment suggest that teachers are particularly risk averse (Bowen, Buck, Deck, Mills, & Shuls, 2013). Thus, we can meaningfully expand upon our analysis by considering teacher preferences under various assumptions for their aversion to risk.
The two retirement compensation lotteries in our analysis yield a series of discrete payoffs across years of service. We assume that a teacher who is uncertain about the number of years she will remain employed by the system would receive each such payoff with probability (p) equal to the percentage of teachers within an entering cohort expected to exit the system after that number of years of service. Both p and the value of retirement compensation are illustrated on the previous figures.
Do Risk Averse Entering Teachers Prefer the FAS or CB Plan?
By design, we are considering CB plans that have the same expected value as the respective FAS plan for an entering teacher. By its nature, retirement compensation under the CB plan has a smaller variance than under FAS systems. For example, using the formula for calculating variance for discrete random variables, we calculate that the weighted standard deviation for the FAS plan is US$106,134 for New York City and US$58,778 for Philadelphia, which in each case is substantially larger than the calculated standard deviation of US$76,991 and US$29,640 for the respective cost-equivalent CB plan. 9
It can be shown that given a choice between lotteries with equal expected values, a risk-averse individual prefers the lottery with smaller variance.10,11 Thus, because the two plans have the same expected value and the CB plan has the smaller variance, it necessarily follows that any risk-averse entering teacher will prefer cost-equivalent CB plan to the respective FAS plan. 12
Quantifying the Magnitude of Entering Teacher Preference for the CB Plan
We are interested in not only the existence but also the magnitude of the preference for the less variable CB plan relative to the respective FAS plan. This is an essential factor to consider if only because altering the structure of public pension systems is a difficult logistical and political undertaking, and thus, might only be worthwhile from a policy maker’s perspective if teachers have a strong preference for the CB system.
Considering the magnitude of entering teachers’ preferences for one or the other plan requires that we first quantify how they value each plan. Such a calculation requires assuming a utility function. As is common in the literature, we assume that teacher utility follows a constant relative risk aversion (CRRA) isoelastic utility function taking the form

where W represents a teacher’s retirement compensation (i.e., present value of employer provided retirement benefits) at any given point in her career, and η represents the coefficient of risk aversion. 13 In the case where η = 0, the individual is risk neutral. Prior empirical research suggests that η = 0.71 offers a good approximation of the actual risk aversion exhibited by members of the current workforce (Chetty, 2006). We might consider this finding based on research evaluating all workers to be a lower-bound in the case of teachers, whom we might assume are especially risk averse.
If a person is risk averse, then they are willing to give up some potential value to have a more certain outcome. In our case, a risk-averse teacher would be willing to give up some potential retirement benefits to protect themselves from the chance that they might leave before working a full career and without earning meaningful retirement benefits.
In the subsequent analyses, we illustrate preferences if teachers exhibit any of several assumed levels of risk aversion that are less than or equal to what empirical research finds for the average worker. We do this to highlight the robustness of our findings and illustrate the role that risk aversion plays when considering our results. Though the true level of risk aversion for both the average worker and for teachers is at least as likely to be higher than 0.71 than it is to be lower, we end our analysis at that level of risk aversion because it is more than high enough to demonstrate the point.
For this analysis, we use the previously determined values for retirement compensation and exit probabilities to calculate the teacher’s expected utility from each lottery. As shown in Equation 2, the expected utility from a lottery equals the sum of the products of utility derived from the retirement compensation at age a (Ua(Wa)) and the probability (pa) of exiting at age a. 14 We consider teacher exits between age of entry, ae, and last possible age at which an employee might separate from employment, az:
Each of the values necessary to calculate Equation 2 are known for each system we consider, and so we can directly compare the expected utility resulting from each lottery for a teacher entering the profession under various assumptions for η.
We measure the magnitude of teacher preferences for one or the other system by comparing the certainty equivalent for each lottery for a given level of risk aversion. The certainty equivalent is the certain amount of compensation that an individual is indifferent to accepting to avoid participating in a lottery. For our purposes, consider a thought experiment where a policy maker allows entering teachers to choose between participating in the pension plan, and thus receiving a retirement benefit based on the number of years before exiting the system, or a lump sum of cash upfront at the time of hire. The certainty equivalent is the size of that upfront cash payment that is just large enough that a teacher of a given level of risk aversion would be indifferent between accepting it and participating in the pension plan.
The value of the certainty equivalent depends on both the probability that the teacher would receive a particular benefit amount and the teacher’s aversion to risk. As the probability of receiving a large benefit increases, the certainty equivalent will also increase because the teacher would need a higher upfront payment to compensate for the better chance for a large retirement benefit. As the teacher’s aversion to risk increases, the value of the certainty equivalent will decrease because the teacher would be willing to accept a smaller upfront payment to avoid the chance that she exits the system with a smaller benefit.
Combining Equations 1 and 2 and performing some algebra yields for the calculation of the certainty equivalent (CE) the formula shown in Equation 3:
Figures 5 and 6 illustrate the certainty equivalents for each system given various assumptions for risk aversion. To interpret preferences from the figure, the system that produces the higher certainty equivalent is preferred by the average teacher entering the system under a given level for η. The intuition here is that an entering teacher would require a larger up-front payment to be convinced to forgo the preferred lottery versus the alternative lottery.
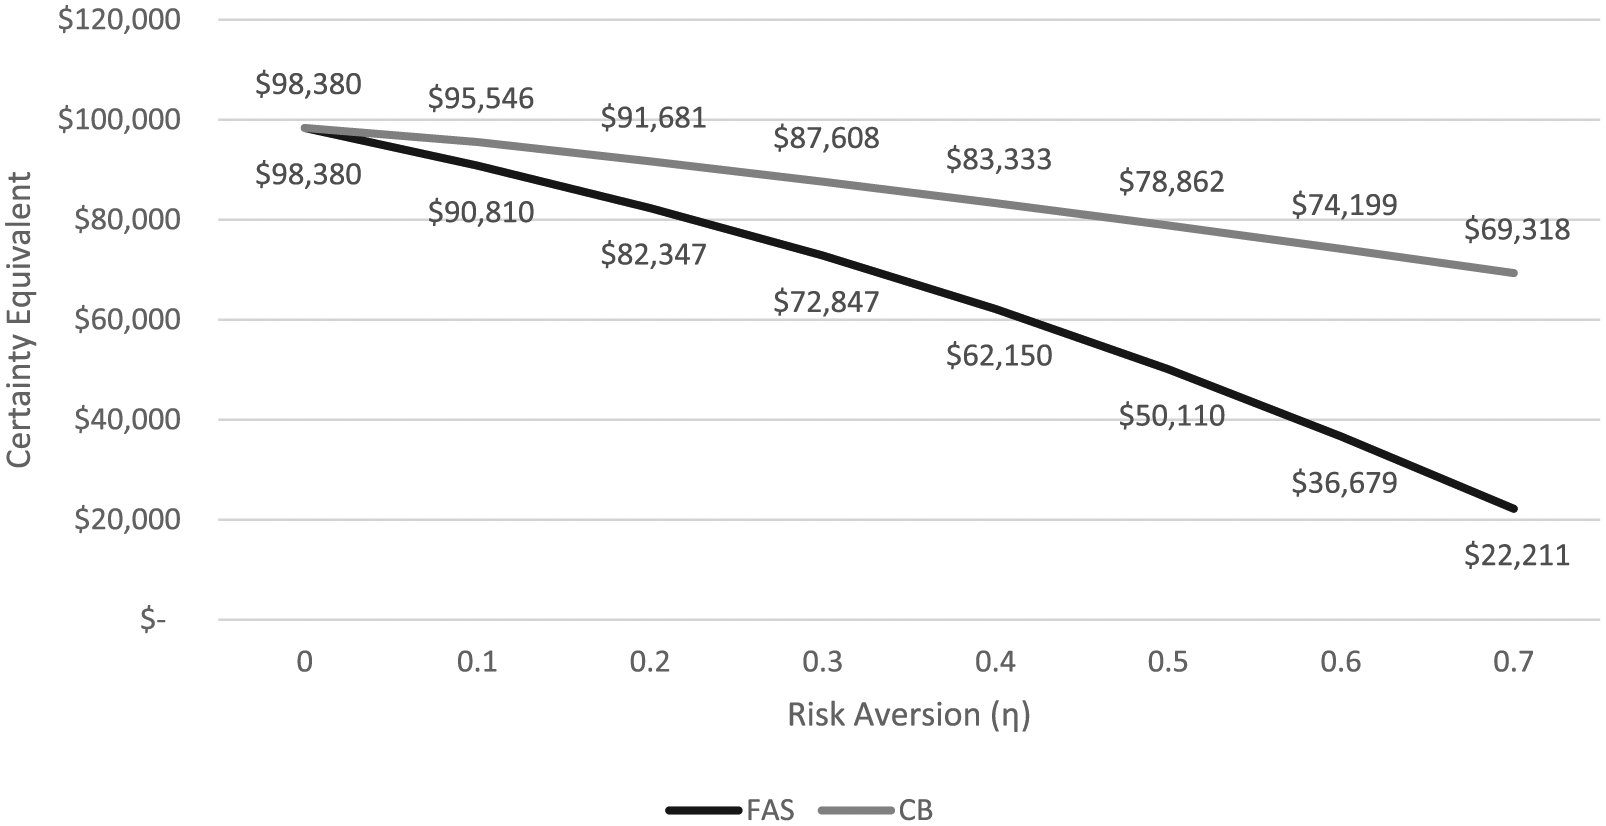
Certainty equivalents under various assumptions for risk aversion: New York City.
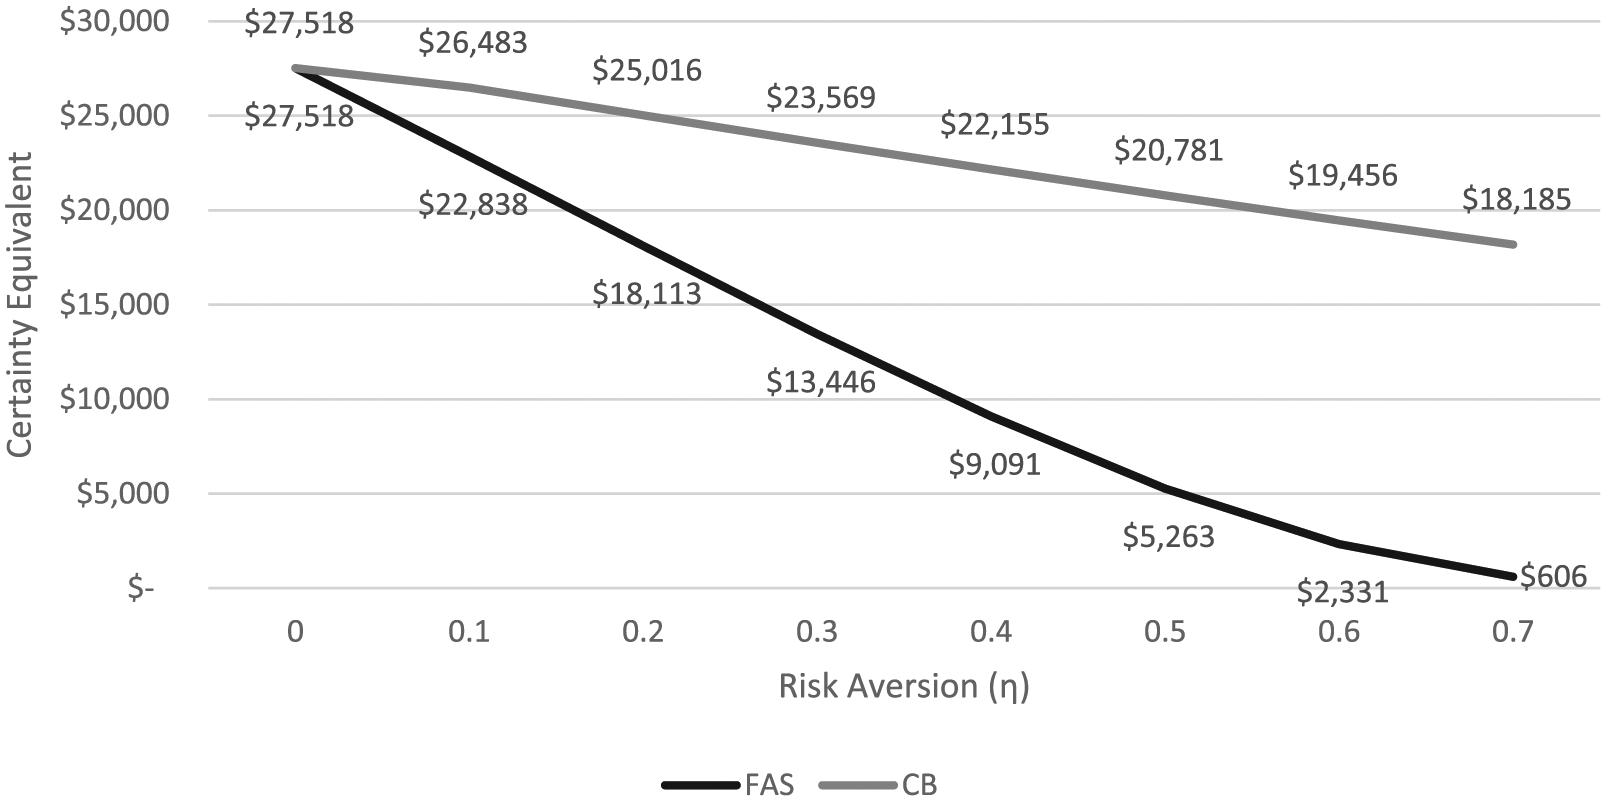
Certainty equivalents under various assumptions for risk aversion: Philadelphia.
Consistent with the earlier finding regarding preferences across plans with the same expected value but different variances, once risk aversion is introduced (η > 0) in each case teachers would prefer the CB plan. The magnitude of the preference for the CB plan is substantial and increases with increases in aversion to risk. The final point on each figure sets the level of risk aversion to the level that prior research finds is a good approximation for the average worker. Given this empirically grounded level of risk aversion, for an entering teacher the certainty equivalent for the CB plan is about 2.1 times the certainty equivalent for the respective FAS plan in New York City and 29 times larger than the respective heavily backloaded FAS plan in Philadelphia.
The very small value that entering teachers with reasonable levels of risk aversion should place on their current retirement plans is notable and in some cases quite shocking. For instance, an entering New York City teacher with η = 0.7 should be indifferent between a cash payment at entry of US$22,211 and participating in the pension plan, in which they would receive a benefit worth US$635,090 if they work a full career and exit at the system’s normal retirement age (as shown on Figure 1). An entering Philadelphia teacher with the same level of risk aversion should be indifferent between a payment of only US$606 at entry and participating in their more heavily backloaded plan, which offers a maximum benefit valued at US$445,357 for those who exit at age 60 (Figure 3).
These results seem extreme at first blush. But they become clearer when considered within the context of the payoff and attrition rates described above. Teachers should be willing to take such a small upfront payment in lieu of participating in the potentially lucrative retirement systems because very few of them will actually remain employed in the system long enough to collect a retirement benefit large enough to outweigh even that relatively small upfront payment. Looking at Figure 3, the value of Philadelphia’s FAS benefit does not go above US$606 until a teacher’s 20th year of employment, at which point (as shown on Figure 4) only 20% of the original cohort is still employed with the system. That is, Philadelphia teachers should be willing to accept such a low payment upfront because for about 80% of them the value of that small upfront payment is larger than the value of the benefit they will receive under the FAS pension plan.
Introduction of even modest levels of risk aversion impacts the value that entering teachers should place on their current retirement plans. The extent to which an increase in the level of risk aversion influences the magnitude of the preference varies according to the extent to which the current system backloads retirement benefits. Marginal increases in risk aversion have a larger impact on the preference for Philadelphia’s plan than under New York City’s less sharply backloaded plan.
In both cities, the difference in the preference for the CB plan relative to the FAS plan is substantial given reasonable assumptions for aversion to risk.
Preferences of Teachers With High Expectations for Longevity in the System
Thus far, we have considered the preferences of teachers who enter a school system with no particular expectation for the amount of time they will remain employed within the same system. Because our entering teacher’s exit hazard rates are based on real attrition rates, we argue that this analysis is the best way to consider the average entering teacher’s preference between the plans. However, it is also worthwhile to consider the preferences of entering teachers who expect to work under a particular retirement plan for a sustained period of time. In all likelihood, the vast majority of entering teachers, including many who in fact do exit after only a few years, expect and fully intend to work within a particular school system for a sustained period of time. Thus, this analysis might better reflect the preferences that teachers could actually have at entry, even if their prediction for the amount of time they will remain in the system ends up being incorrect. It also puts our results to a difficult test in that the longer that a teacher expects to remain in the system, the more that teacher will tend to prefer the backloaded FAS plan.
Figures 7 and 8 illustrate the certainty equivalents for entering teachers who exhibit risk aversion of η = 0.3 or η = 0.7 and vary in the number of years that they are certain at entry they will remain within the current system. That is, at workforce entry these hypothetical teachers have a 0% chance of exiting the school system within the first 5 years, and so on, and thereafter exhibit the same attrition pattern assumed by the current pension plan. To do this, we follow the prior procedures, but assign a probability of exit at earlier years of service to be 0. As before, we then utilize information from the respective pension system’s decrement tables for the probability that a teacher who has reached a given year of service exits in that year.
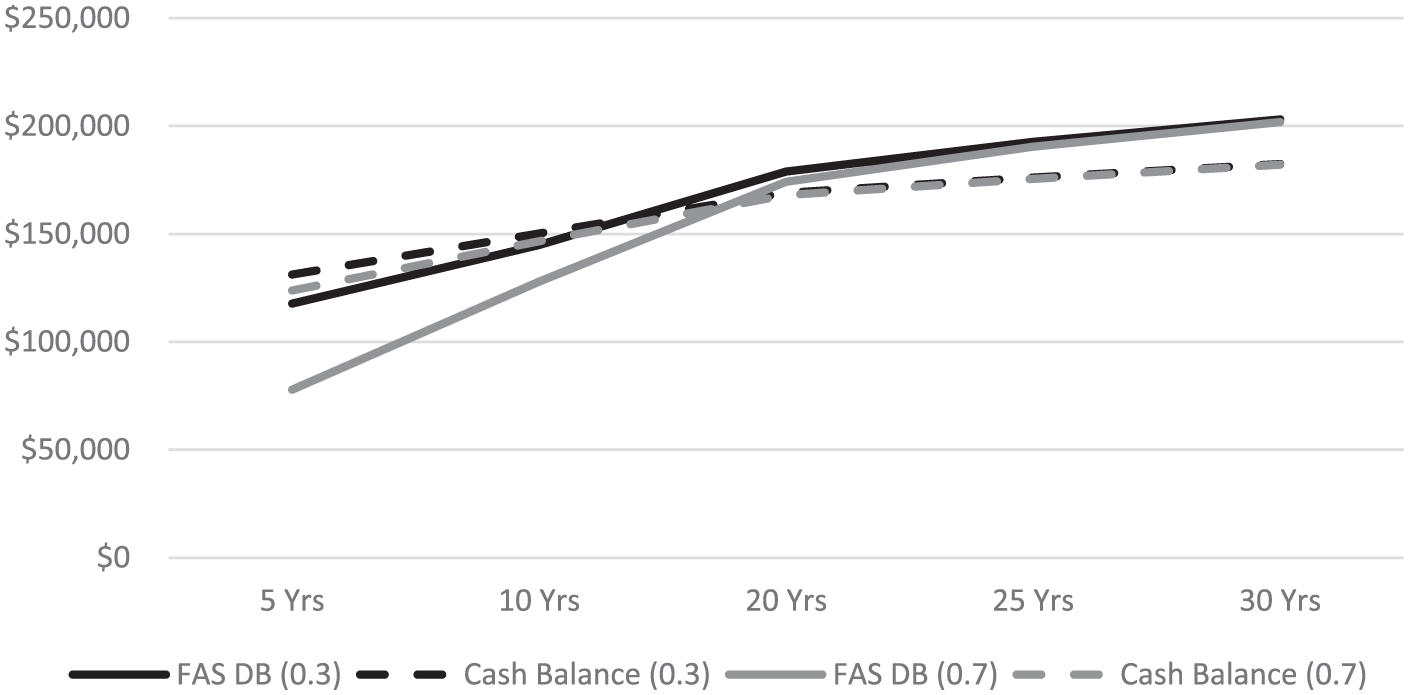
New York City: Certainty equivalents by certainty of remaining in system.
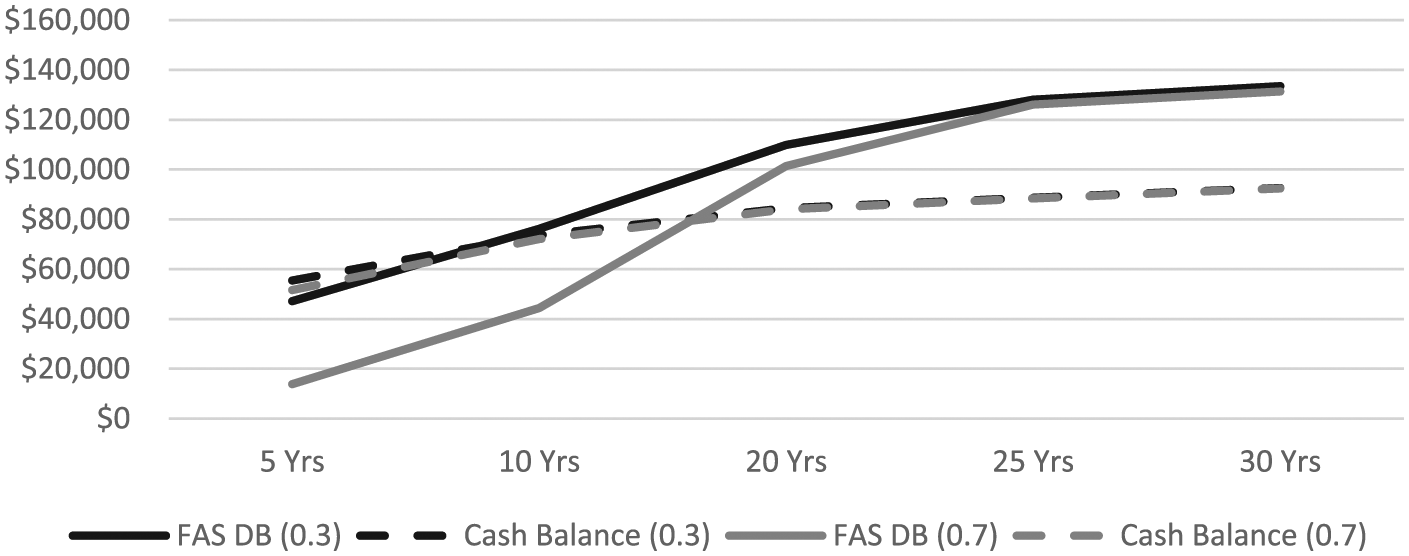
Philadelphia: Certainty equivalents by certainty of remaining in system.
Certainty of remaining within the system for a prolonged period of time has a large effect on the certainty equivalent for participating in the FAS plan but no discernable effect on the certainty equivalent for participating in the respective CB plan. That result emerges because the CB plan does not provide a particular reward to teachers for remaining within the system for additional years.
The most notable feature illustrated by the figures is that teachers must have very high expectations about their longevity when they enter the school system to prefer the FAS plan over the respective CB plan. In both New York City and Philadelphia, a teacher certain to remain in the same retirement system for at least 10 years would continue to prefer the CB plan to the existing pension plan. In both cities, teachers must be certain that they will remain for about 20 years to prefer the current system to the CB plan. 15
The results in Figures 7 and 8 are particularly telling given the extreme nature of the test under consideration: Even if they strongly believe it to be true, in practice few if any individuals at the time they are hired in any job know with absolute certainty that they will remain employed within that system for at least 10 years. Our result suggests that even if such an individual did exist—in fact, even if that odd individual was the average entering public school teacher—under a conventional assumption for risk aversion, teachers would prefer to earn retirement compensation under the CB system rather than the current system. If instead teachers were not certain but rather just likely to remain in the system (say, were 50% sure they would remain for 10 years rather than 100% sure), the preference for a CB plan design would increase. The practical implication of the result from this stylized example is that the only teachers who would prefer the current system to the respective CB plan are those with a confidence in their longevity that is either very rare or delusional.
Benefits Cost Holding Employee Value Constant
An important implication of our findings is that current FAS retirement plans provide less value for teachers at a given cost than would a CB plan. It follows that teachers would prefer a CB plan that offers a lower expected value for the average entrant—and thus, a lower cost for the employer—to the current FAS plan. In this section, for teachers in our example districts, we calculate how much the employer contribution could be reduced under a CB plan and still yield the same certainty equivalent as the current FAS plan.
Before we introduce this analysis, it is worth noting that we do not intend to argue for states to reduce teachers’ benefits. For starters, as we will see, the reduced employer contribution that produces an equal certainty equivalent under the CB plan is often so low that it would not place teachers on a retirement secure savings path.
However, these results do serve at least three purposes. First, they illustrate the extent to which states faced with the need to reduce teacher benefits costs to address fiscal realities could make such cuts more palatable for entering employees by coupling them with a restructuring of how retirement benefits are distributed. Second, these results only further highlight just how undesirable the current system is from the perspective of an entering teacher. Finally, even if it is unwise to reduce benefits to the extent suggested possible below, the fact that moving to a CB system would allow states to reduce costs while offering entering teachers a retirement plan that is at least as attractive as their current plan could offer policy makers a valuable opportunity to productively reallocate employee compensation. For instance, research finds that teachers value deferred retirement benefits much less than they value salary (Fitzpatrick, 2015; Koedel & Xiang, 2017). Thus, policy makers might consider switching to a lower cost CB plan and using the savings to increase teacher salaries.
We begin with the certainty equivalents for the current FAS, reported in Figures 5 and 6, and calculate the employer contribution that would produce a CB plan with an equal certainty equivalent. That is, in this analysis, we consider how much policy makers could reduce the CB benefit’s expected value while offering employees a retirement benefit that they value equally to the current FAS plan. The difference in the cost of the two designs represents a cost savings for the employer without reducing the value that teachers place on their retirement benefits.
Table 1 reports the results of the analysis when the risk-aversion coefficient is set to either 0.3 or 0.7. 16 The first column reports the employer contribution under both the existing FAS plan and the cost-equivalent CB plan. The second column restates the certainty equivalent for the current FAS plan for a given assumed level of risk aversion as previously shown on Figures 5 and 6. The third column reports the employer contribution under a CB design that would offer entering teachers the same certainty equivalent as the FAS plan at the given level of risk aversion. The CB plan could deliver a benefit that would be equally valued by entering teachers at a much lower cost than current FAS plans.
Comparing Employer Contributions Under FAS and CB Plan With Same Certainty Equivalent for Entering Teachers
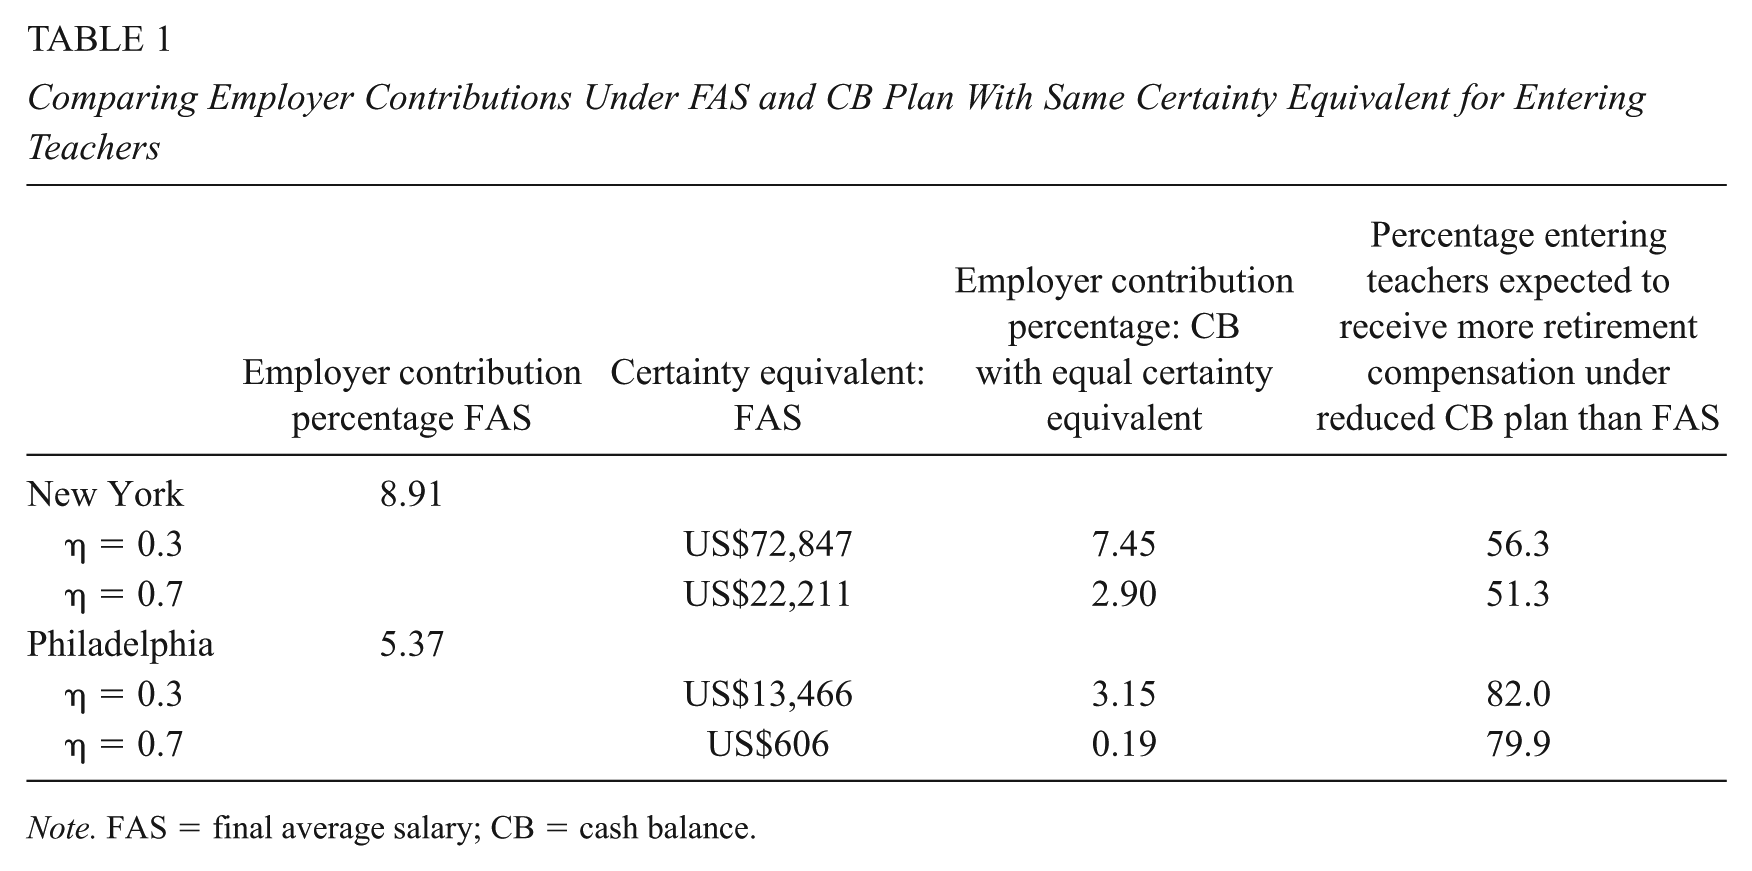
Note. FAS = final average salary; CB = cash balance.
For example, the FAS plan in New York City provides teachers with a benefit that is equal to about 8.91% of their cumulative compensation. However, because they prefer its less backloaded design, entering teachers who exhibit an average level of risk aversion would equally value a CB plan where they receive an employer contribution of only 2.9%. That is, such entering teachers are indifferent between the current backloaded FAS plan and a CB that offers about a third of the contribution rate. The result is even more stark under Philadelphia’s more heavily backloaded plan: Entering teachers with an average level of risk aversion would be indifferent between their current FAS and a CB plan in which employers contribute on their behalf only 0.19% of their cumulative compensation.
The cost savings represented by the plan changes described in Table 1 are significant. For example, if we conservatively assume a risk aversion coefficient of 0.3, then the moving to a CB plan that provides the same certainty equivalent would reduce the employer’s annual contribution percentage by about 16.4% in New York City and 41.3% in Philadelphia. Again, these results seem less extreme when we recall that the majority of entering teachers separate before retirement compensation under the FAS is more valuable under the CB plan.
In fact, even if the move to a CB is coupled with such large benefit reductions, it remains the case that a majority of entering teachers in these systems would earn a larger employer-funded retirement benefit under the CB plan than the current FAS plan. The fourth column in Table 1 reports the percentage of entering teachers that would earn more valuable benefits under a reduced CB plan with the same certainty equivalent as the respective existing FAS plan. Even after the large benefit reduction associated with an equivalent plan assuming teachers exhibit average risk aversion, 51.3% of entering teachers in New York City and 79.9% of entering teachers in Philadelphia would be expected to leave the retirement system having earned more valuable employer-sponsored benefits than they would under the respective existing FAS DB plan.
We again highlight that we do not suggest that policy makers use these results to make such draconian cuts to the benefits offered to entering teachers. Rather, the purpose of this analysis is to further highlight that moving to a CB design would have major benefits from the teacher’s perspective at the same or lesser cost to the system.
Discussion and Conclusion
This article has considered teacher preferences for the distribution of retirement benefits across teachers’ careers while remaining within the guaranteed benefit structure. We present evidence that risk-averse entering teachers would have a preference, indeed a very strong preference, for the more even distribution offered under a CB plan relative to currently operating FAS plans.
Perhaps the most startling result of our analysis is the illustration of just how undesirable current pension plans are from the entering teacher’s perspective once we account for risk aversion. These results suggest that future teachers would benefit substantially from a more equitable distribution of retirement compensation across tenure.
To our knowledge, our article represents the first formal consideration of employee preferences between differing distributions of retirement compensation within the guaranteed benefit structure. While switching from a FAS plan to a cost-equivalent CB plan reduces the maximum amount of retirement compensation that a teacher could possibly earn, we show that under reasonable assumptions teachers would prefer the more evenly distributed pattern of retirement compensation that gives them far more assurance they will earn a meaningful retirement benefit for each of their years in the classroom. Our primary contribution is to show that the increased security that results from the pattern of compensation offered under the CB plan is highly desirable for entering teachers. Given reasonable assumptions for how teachers view risk, the preference for a CB structure is very large indeed.
Supplemental Material
DS_10.3102_0162373718798488 – Supplemental material for Rethinking the Structure of Teacher Retirement Benefits: Analyzing the Preferences of Entering Teachers
Supplemental material, DS_10.3102_0162373718798488 for Rethinking the Structure of Teacher Retirement Benefits: Analyzing the Preferences of Entering Teachers by Josh B. McGee and Marcus A. Winters in Educational Evaluation and Policy Analysis
Footnotes
Declaration of Conflicting Interests
The author(s) declared no potential conflicts of interest with respect to the research, authorship, and/or publication of this article.
Funding
The author(s) disclosed receipt of the following financial support for the research, authorship, and/or publication of this article: This research was supported by the Laura and John Arnold Foundation.
Notes
Authors
References
Supplementary Material
Please find the following supplemental material available below.
For Open Access articles published under a Creative Commons License, all supplemental material carries the same license as the article it is associated with.
For non-Open Access articles published, all supplemental material carries a non-exclusive license, and permission requests for re-use of supplemental material or any part of supplemental material shall be sent directly to the copyright owner as specified in the copyright notice associated with the article.