
Abstract
Michigan Merit Curriculum (MMC) is a statewide college-preparatory policy that applies to the high school graduating class of 2011 and later. Using detailed Michigan high school transcript data, this article examines the effect of the MMC on various students’ course-taking and achievement outcomes. Our analyses suggest that (a) post-MMC cohorts took and passed approximately 0.2 additional years’ of math courses, and students at low socioeconomic status (SES) schools drove nearly all of these effects; (b) post-policy students also completed higher-level courses, with the largest increase among the least prepared students; (c) we did not find strong evidence on students’ ACT math scores; and (d) we found an increase in college enrollment rates for post-MMC cohorts, and the increase is mostly driven by well-prepared students.
Introduction
Given the prevalence of such policies, one would expect a burgeoning literature examining their impact. However, despite the appeal of default curriculum policies, we actually know surprisingly little about whether changing course requirements will necessarily lead to improved outcomes for students (Mazzeo, 2010). While there is a lack of knowledge regarding their impact, theories suggest these kinds of policies may address two potential concerns in U.S. high schools. First, they are often implemented to update high school curricula to match the increasingly rigorous expectations of colleges and employers (Gardner, Larsen, Baker, Campbell, & Crosby, 1983). Second, they aim to reduce inequality in course offerings (National Governors Association, 1990). Previous literature on course tracking has demonstrated that it often results in segregation of students by race and socioeconomic class, and the attempts to break such patterns by allowing students to choose courses freely often perpetuate previous patterns of tracking (Kao & Thompson, 2003; Kelly, 2009; Oakes, 1990). Requiring all students to take more advanced courses is one way to address this issue.
There is a growing body of research on the potential impacts of such policies, especially how they can improve academic and job market outcomes. However, additional research is needed to assess how this type of change may affect less-prepared students. In this study, using the uniquely detailed high school transcript data from the Michigan Transcript Study (MTS), we are able to investigate the mechanism through which the MMC may influence an important long-run outcome: course-taking behavior. The analysis in this article focuses on how and for whom course-taking behavior has changed, and whether students have passed the additional courses they took as a result of the policy. Our hypotheses center on how course-taking behavior is expected to change. First, we expect students in post-policy cohorts to take more math, and that these changes will be concentrated among low socioeconomic status (SES) schools where previous graduation requirements were not as strict as those imposed by the MMC. Second, we expect failure rates in math courses to increase: If unprepared students are pushed into more difficult courses, they are likely to fail these courses at a higher rate. Finally, we expect students to attempt higher level math courses, which should also raise the highest level of math completed. However, it is unclear whether students will rise to the higher standards set out by the policy without additional preparation, or how school will help those students succeed.
Our findings mirror research on similar programs, like the one implemented in 1997 by Chicago Public Schools (CPS), which mandated that students take Algebra 1 and English 1 in ninth grade. In analyzing Chicago’s program, Mazzeo (2010) found that 90% of students met this requirement in the post-policy period. However, grades in those courses decreased, and no long-term increase in performance was observed. Our study finds that students in the post-policy period take almost one additional semester of math during high school and that students are about 4% more likely to fail math courses post-policy. Further breakdown of this analysis shows that these changes are driven by students in low-SES schools catching up to their peers in higher-SES schools. While the increase in failure rates is an area of concern for practitioners considering similar policies, it is worth noting that the increased failure rate is smaller than the increased rate at which students take math courses, resulting in a net increase in math courses passed for the average student.
Jacob et al. (2017) used statewide administrative data to examine the impact of the MMC on student achievement and high school graduation. Results found no evidence of an increase in ACT math score but a 0.04 standard deviation improvement in science score. The impact of the MMC on high school graduation is sensitive to the choice of sample and specification, though some evidence suggests that the MMC reduced graduation rates for the least prepared students. This study explores the fidelity of policy implementation by studying how the MMC altered the high school math course-patterns of students and college attendance. The MMC requires students to take a full load of college preparatory courses, and this study provides valuable feedback on how well the MMC is being implemented in our random sample of schools. To do so, we additionally use transcript data from the representative sample of 129 high schools in Michigan that contain information on course-taking behavior from 300,000 students for 10 years, to cover both pre- and post-MMC periods. 1 These data allow us to build sequences of courses that demonstrate whether or not there is a corresponding increase in the rigor of student course-taking that could be related to college enrollment.
Using these extensive data from 25 million course records and using a pre–post design, with respect to the implementation of the policy, we find that post-policy students took additional math and passed higher levels of math courses. In addition, post-MMC cohorts are more likely to enroll in 4-year colleges. The rest of the article proceeds as follows: We first briefly review the background of the MMC and prior literature on similar policies, we then introduce the data and methods used in this study, and finally, we discuss the results and conclude with implications for policy makers and future research.
Background and Literature Review
Curricular Intensification on Achievement and Social Stratification
Historically, most American high schools placed students into overarching tracks, which resulted in only a small number of students in academically rigorous honors or college-preparatory tracks and a larger number of students in less rigorous, applied general, or basic tracks (Lucas, 1999). While high schools across the country dismantled these tracks beginning in the 1960s and 1970s (Moore & Davenport, 1988), most continued to stratify courses, allowing students to place themselves into different levels in different subjects (Domina & Saldana, 2012). However, existing research on stratification in schools has shown that increasing students’ exposure to the curriculum can lead to improvement in a variety of outcomes. For example, access to advanced courses is directly related to future opportunity to learn (Gamoran, 1987; Stevenson, Schiller, & Schneider, 1994), performance on achievement tests such as college entrance exams (Pallas & Alexander, 1983), and college enrollment (Schneider, Swanson, & Riegle-Crumb, 1998) and success (Moreno & Muller, 1999). Critics argue that the current tracking system limits students’ opportunity and exposure to advanced courses and, thus, intensifies inequality during adolescence. This creates a foundation that leads to social and occupational stratification in adulthood (Riegle-Crumb, 2006).
In response, state and local agencies have focused on curricular intensification as a part of the solution. For example, schools were asked to offer rigorous classes for all students, create incentives for all students to succeed in these classes, or establish higher graduation requirements (National Governors Association, 1990). The objective here is to equalize learning opportunities in American high schools and to improve students’ college and career readiness. In the decades that followed, states enacted an estimated 700 new pieces of educational policy, many of which raised standards for grade promotion and high school completion (Darling-Hammond & Berry, 1988; Timar & Kirp, 1989; Wilson & Rossman, 1993). By 2008, 25 states required students to satisfy the New Basics academic courses to earn a high school diploma, 2 and 24 states had implemented high school exit exams to certify that graduates have mastered basic academic skills (Zhang, 2009).
The MMC falls on this continuum of policies by requiring all high school students (starting with the ninth-grade cohort in the spring of 2008) to pass a set of 18 rigorous academic courses, including four credits each of mathematics and language arts, three credits each of science and social studies, two credits of foreign language (effective beginning with students graduating in 2016), and one credit each of physical education, art, and online learning. Perhaps more importantly, the law specifies rigorous math and science course requirements: Students must take courses covering the content traditionally taught in Algebra 1, Algebra 2, and Geometry, as well as Biology and Physics or Chemistry. To demonstrate competency in the subject matter, students must complete an end-of-course assessment that measures understanding of the subject’s state-defined content expectations. The state developed a new set of content standards, end-of-course exams, and a new statewide high school exam to ensure a high level of rigor in required classes. 3 While completion of these courses is common among students who attend 4-year colleges, most high school graduates (from 2003 to 2011) prior to the implementation of the policy experienced a diverse set of district-level requirements and school course-taking norms. For example, according to a state-administered survey, only about a third of school districts required 4 years of math before the MMC was put in place; a similar proportion required 3 years of science.
Previous Research
As all students are required to take the mandated courses and students in low-performing and/or low-income schools are taking fewer of the courses mandated at baseline, in theory, policies such as the MMC have the potential to (a) increase enrollment in more advanced level courses and (b) act as a form of de-tracking and reduce the inequality in students’ opportunity to learn and, thus, reduce the gap in students’ achievement. However, recent evidence on the impacts of such reforms has been mixed (Allensworth & Lee, 2009). Studies using CPS data show that student enrollment in college-preparatory courses increased overall when the mandatory curriculum policy was introduced. In addition, enrollment in courses such as college-preparatory Algebra 1 and English became much more equitable by race and ethnicity (Mazzeo, 2010).
In recent work by Jacob et al. (2017), the authors examined the impacts of the MMC using all public-school students in Michigan and found that the MMC had little impact on student outcomes. The results found no evidence of an increase in ACT math score and only an increase in science score, with the largest improvement among students that entered high school with the weakest academic preparation. However, the impact of the MMC on high school completion is sensitive to the sample and methodology used. While the intended consequence of the MMC is to expose and push all high school students into more advanced math courses, it is possible that some students may not be prepared for those more rigorous courses. This is especially salient when one considers the variation in a student’s motivation and preparation prior to high school. Thus, because some students are pushed into these courses unprepared, such policies could produce unintended consequences—such as higher dropout rates and higher failure rates, as suggested by Lillard and Decicca (2001). However, the evidence to-date is mixed. Some researchers have shown that increased course-taking enhances a student’s performance and high school completion (Attewell & Domina, 2008; Balfanz & West, 2008), while others have shown that lifting the bar for graduation can increase dropout rates and does not improve student achievement (Dee & Jacob, 2006; Jacob, 2001; Warren, Jenkins, & Kulick, 2006).
Math Course-Taking as the Main Outcome
In this article, we study the impact of the MMC on students’ course-taking outcomes. While the MMC could affect many behavioral outcomes, we focus on students’ mathematics course-taking behavior as our main outcome for several reasons. First, the hierarchical organization of high school math courses is a key mechanism of academic stratification (Riegle-Crumb & Grodsky, 2010). Math’s hierarchical organization begins in middle school with Algebra or Pre-algebra and requires that students master the curriculum and meet teachers’ expectations consistently over a period of many years to participate in advanced math courses like precalculus and calculus (Burkam, Lee, & Smerdon, 1997; Dougherty, Mellor, & Shuling, 2006; Stevenson et al., 1994). Second, successful completion of advanced math courses has been associated with more short-term positive academic and social outcomes (Frank et al., 2008); increasing the likelihood of attending college (Adelman, 1999; Sadler & Tai, 2007; Sells, 1973; Simpkins, Davis-Kean, & Eccles, 2006), particularly at 4-year institutions (Kim, 2018a; Riegle-Crumb, 2006; Schneider et al., 1998); and long-term labor market outcomes (Goodman, 2019; Levine & Zimmerman, 1995; Rose & Betts, 2004). Advanced math course-taking in high school is also a strong determinant of degree completion among those who attend college (Adelman, 1999). Third, the content of math courses tends to be more standardized across high schools than in many other subject areas (Archbald & Porter, 1994; Stodolsky & Grossman, 1995), allowing us to connect transcript course labels to particular instructional content and, thus, to more readily identify curricular content changes in response to the MMC. 4
Data
We use two datasets to analyze the impact of the MMC on course-taking: data from the MTS and the Michigan Consortium for Educational Research (MCER) data on school and demographic controls and exams. 5 This section describes the two datasets and variables of interest.
We obtain information on high school students’ course-taking, including enrollment history, credits, and grades from the MTS, which is a proprietary dataset collected as a part of an IES grant by MCER. The MTS attempted to collect transcript data from a representative sample of 150 Michigan High Schools from the 2001–2002 school year through the 2013–2014 school year to investigate the impact of the MMC. For simplicity, we refer to school year by the year in which the spring term occurs (e.g., the school year 2007–2008 is 2008).
Sample
To estimate the impact of the MMC on course-taking behaviors, high school transcripts between 2003 and 2012 were collected from a generalizable sample of 150 Michigan high schools that was drawn by an independent contractor based on the following strata characteristics: region/urbanicity, poverty, Detroit, LEP, school size, and percentage minority. Out of 150 schools, 37 schools were replaced mainly due to nonparticipation. To select the replacement schools, we found the schools within the same strata characteristics described earlier and selected the school that was most like the original school. 6 Out of 150 schools, we have transcripts from 129 schools, which represents a response rate of 86%. One of the major causes of sample reduction is school closure. 7 The sample of 129 schools represents the schools that were open during the entire period of study. The data include nearly 25 million student-course records, which contain information on course title and course content, credits attempted and awarded, grades, and school where the transcript is collected from. In the analysis, the data are recoded to student year level, which contains nearly 1 million observations from 300,000 students.
Sample Restrictions
We make a series of restrictions to obtain our analytic sample. First, we start with the sample that covers the 2002/2003–2008/2009 cohorts and exclude student-year observations that are not linked to either demographic or school datasets, which drops 2% of the sample. The pre-policy sample consists of the 2003 through 2007 cohorts, whereas the post-policy sample comprises the 2008 and 2009 cohorts. Second, we exclude observations with unusual academic progress (3.4%), gender conflicts (0.8%), and birthdate conflicts (1.9%). The final student-year dataset contains 1,030,753 student-year observations from 293,749 students. 8
Measures
A. MTS
Course information
Course title and content are assigned by School Courses for the Exchange of Data (SCED), which comes from the National Center for Education Statistics (NCES). In addition to identifying the course titles, we assigned SCED based on course description information using school-specific catalog data, 9 which enables us to measure the depth of the course. Each SCED course code contains five digits. The first two digits identify the main program area, and the next three digits identify the specific course. For example, regarding SCED 02052, the first two digits (02) define mathematics, and the three digits (052) define Algebra 1.
Course level
This study uses the SCED assigned to each course to construct course intensity level by employing the math pipeline measure introduced by Burkam, Lee, and Smerdon (2003). This measure is intended to capture the highest level of math. 10 For simplicity, we assign the course level equivalent to the pipeline values. For example, Algebra 1 is assigned the level of 3.
Credits
To consistently measure the number of math credits students obtain, we generate year-equivalent credit, which standardizes the number of math courses taken using the information included in the data about the school’s term structure. For each course, we can observe if it was a semester-, trimester-, or year-long course. Using this information, we weight a semester-long course as a half-year of math and a trimester-long as a third. Math courses with positive credits awarded are recorded as passed.
B. Administrative Data
We obtain information on school characteristics, demographic controls, exams, and college enrollment from multiple administrative datasets from Michigan’s Center for Educational Performance and Information (CEPI) and its Department of Education, spanning 2003–2014. The records of school characteristics are linked to MTS using a school identifier. In all, around 94% of student-year records are linked to administrative data.
Demographics
The dataset contains information on gender, ethnicity, economically disadvantaged status, receipt of special education, limited English proficiency (LEP) status, and graduation status from Michigan public schools. The dataset further contains information about whether a student has an unusual grade progression—where a student jumps more than two grades (9th to 12th grade) or goes back a grade, and whether the data have gender and/or birthdate conflicts.
Exams
The dataset contains scores for math standardized exams. We use the Michigan Educational Assessment Program (MEAP), which is recorded at fourth and eighth grade to capture students’ math preparedness before taking high school math courses, and standardize scores across all cohorts relative to the 2005 cohort. We also use the first ACT math score.
College attendance
College attendance information comes from the National Student Clearinghouse (NSC) and is linked to MTS using student identifier. We construct college attendance status in 2- and 4-year institutions in the 4 to 6 years following ninth grade. Considering the sharp increase in the college enrollment coverage of the NSC between the fall of 2008 and the fall of 2009 (Dynarski, Hemelt, & Hyman, 2015), the sample employs the postsecondary enrollment information from colleges that joined the NSC prior to June 2008.
School controls
The school identifier indicates the school that the transcripts are collected from, and the dataset includes the fraction of economically disadvantaged students, per-pupil total expenditures, enrollment, magnet school indicator, and the number of teachers.
Research Method
As the MMC was implemented statewide, we do not have a group of schools that we can use as a control group. To evaluate the policy impacts, we use a rich set of student and school characteristics to control for any time-varying and time-invariant factors. We also control for existing trends for all outcomes (i.e., course-taking, achievement, and college enrollment) to capture increases in outcomes that are not related to the policy. We conduct a within-school comparison, which attributes any deviations in the existing trend to the policy. We estimate the following regression model:
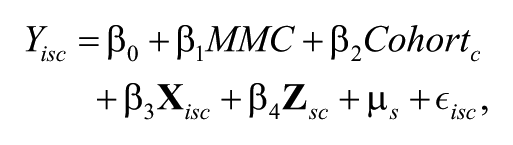
where
The study first analyzes different course-taking outcomes, starting with how the policy affected the number of math credits a student attains in high school. Because the policy was implemented across the entire state at the same time, we need to control for outside factors that may have also influenced a student’s course-taking behavior at the same time as the policy. Controlling for school-level fixed effects, time-trends, and student-level socioeconomic characteristics goes a long way toward addressing alternative explanations for any change associated with the policy.
Second, we analyze if the pass rate changed as a result of the policy. If student preparation did not increase prior to implementing the MMC, we may expect failure rates in these courses to increase. To analyze this, we interact the policy dummy (MMC) with the number of credits a student takes. The coefficient on this interaction then tells us the differential rate at which students pass math courses in the post-policy period. This also allows comparison of the pass rates for students taking the same number of courses pre- and post-policy.
Third, we focus on how course-taking patterns vary with respect to three dimensions of heterogeneity: namely, grade level, SES of the school, and math preparedness of the students before entering high school. To do this, we run the same specifications as earlier but break the data into subsamples by grade, SES of the school, and math score in eighth grade. Analyzing in what grade the students experienced the greatest change post-policy provides a more complete picture of how course-taking patterns changed in response to the policy.
Finally, the analysis evaluates the policy effect on achievement, measured by ACT math score and college attendance. We use each student’s first ACT math score to avoid possible endogeneity of retaking, and we measure college attendance 4 to 5 years after each student entered high school.
Summary Statistics
The final dataset links the MTS with administrative datasets and is recorded on the student-year level. For each year, we calculate the number of year-equivalent math credits and the highest level of math. We report summary statistics of demographics and school characteristics in Table 1. Columns 1 to 3 show sample means for the cohort of students, before and after the policy implementation. Pre- and post-policy cohorts have similar demographic backgrounds, except for an economically disadvantaged status for cohorts in years 2008 and 2009. 11
Summary Statistics on Student and School Characteristics
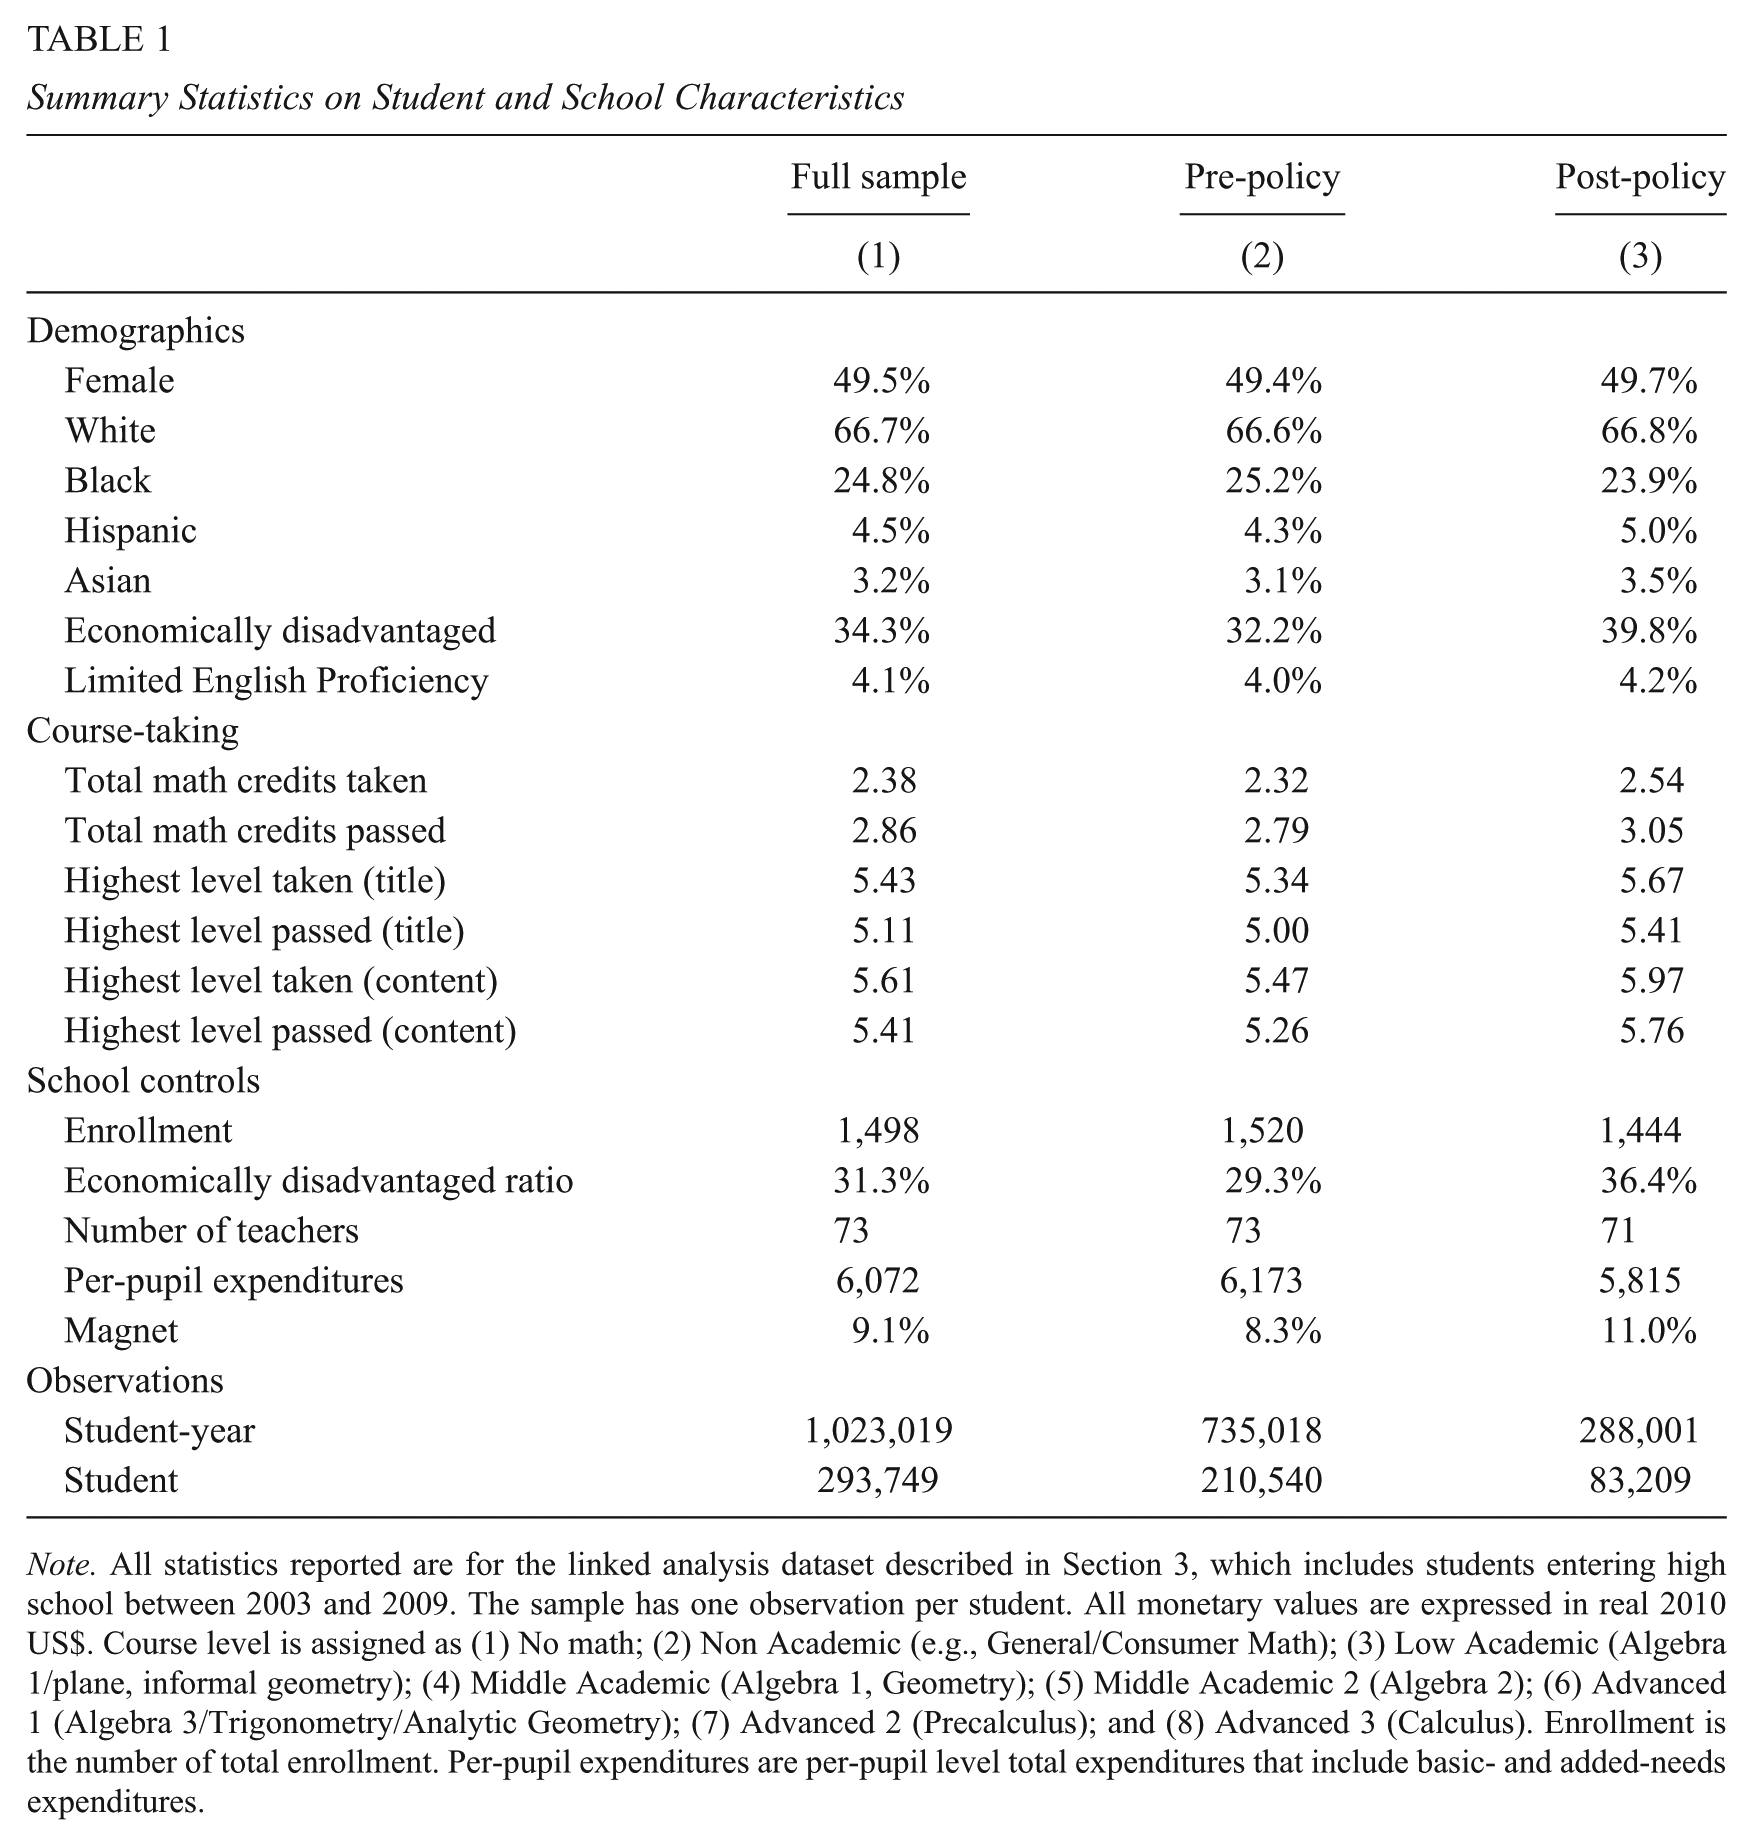
Note. All statistics reported are for the linked analysis dataset described in Section 3, which includes students entering high school between 2003 and 2009. The sample has one observation per student. All monetary values are expressed in real 2010 US$. Course level is assigned as (1) No math; (2) Non Academic (e.g., General/Consumer Math); (3) Low Academic (Algebra 1/plane, informal geometry); (4) Middle Academic (Algebra 1, Geometry); (5) Middle Academic 2 (Algebra 2); (6) Advanced 1 (Algebra 3/Trigonometry/Analytic Geometry); (7) Advanced 2 (Precalculus); and (8) Advanced 3 (Calculus). Enrollment is the number of total enrollment. Per-pupil expenditures are per-pupil level total expenditures that include basic- and added-needs expenditures.
Figure 1 displays the time series of conditional means for key outcomes (course-taking, achievement, and attainment) by cohort. The conditional mean comparison in the Supplemental Table 3 (in the online version of the journal) shows that post-policy students take and pass more math courses and that the rigor levels of courses are higher. This suggests that the policy likely had an impact on the number and rigor of courses taken by students in the 2008 and 2009 cohorts. Course-taking by each MMC-required math course in Figure 1 further supports the hypothesis, as the fraction of students taking and passing those courses is higher for post-policy cohorts.

Impact of MMC on course-taking, achievement, and attainment
Post-policy students achieved 0.24 standard deviations higher in the standardized math test score in Grade 8 but achieved marginally higher test scores than the pre-policy cohorts. 12 College enrollment rate measured at 4 to 6 years following Grade 9 is about two percentage points higher for post-policy students.
Results
Course-Taking
Effects on the Number of Math Credits
We begin by analyzing the impact of the MMC on the number of math credits in high school.
13
Column 1 of Table 2 estimates the effect of the MMC, controlling for grade level
14
and demographic controls
Estimated Impacts of MMC on Math Credits
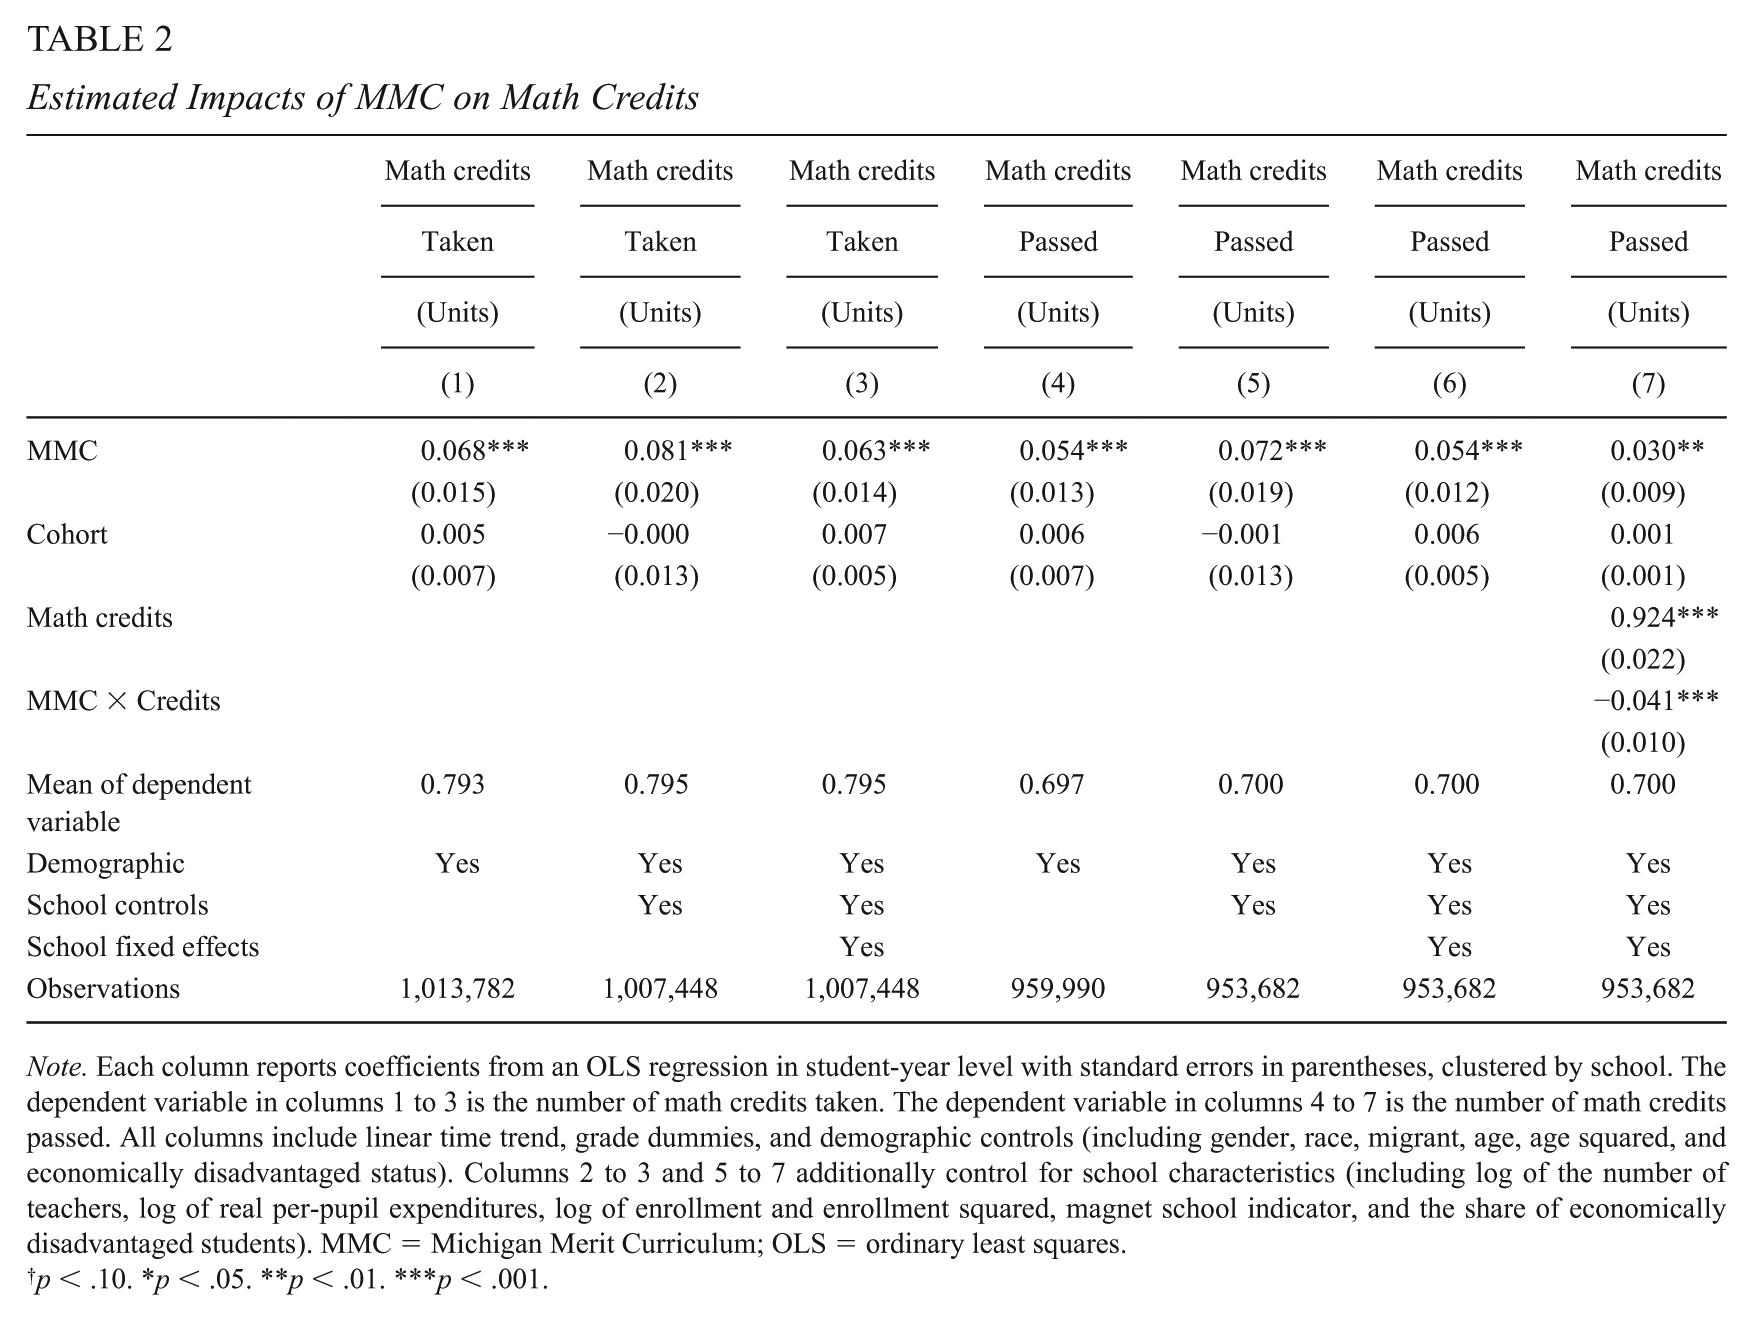
Note. Each column reports coefficients from an OLS regression in student-year level with standard errors in parentheses, clustered by school. The dependent variable in columns 1 to 3 is the number of math credits taken. The dependent variable in columns 4 to 7 is the number of math credits passed. All columns include linear time trend, grade dummies, and demographic controls (including gender, race, migrant, age, age squared, and economically disadvantaged status). Columns 2 to 3 and 5 to 7 additionally control for school characteristics (including log of the number of teachers, log of real per-pupil expenditures, log of enrollment and enrollment squared, magnet school indicator, and the share of economically disadvantaged students). MMC = Michigan Merit Curriculum; OLS = ordinary least squares.
p < .10. *p < .05. **p < .01. ***p < .001.
Columns 4 to 7 investigate the effect of the policy on the number of math credits passed. Column 4 uses the same specifications as column 1 and shows that students post-policy passed on average 0.05 more credits than pre-policy cohorts. When school observables and fixed effects are controlled for, the estimate stays stable. 15 As the policy requires students to pass certain math courses, one might be concerned about changes in the course pass rate. Jacob et al. (2017) found that the effects of the MMC on high school completion are sensitive to the choice of sample and specification. Column 7 explores the change in the pass rate by controlling for the number of math credits taken and interacting this with the policy variable. Note that the coefficient for the MMC, 0.03, is not comparable to other coefficients because of the interaction; instead, we are interested in the interaction term and the coefficient on math credits taken. The estimates in column 7 show that, on average, 92% of math credits taken are passed for pre-policy cohorts, and the pass rate has decreased for post-policy students. In other words, students taking a math course post-policy are about four percentage points less likely to pass than their pre-policy counterparts. 16
Note that the estimates in Table 2 are from the student-year-level sample. In additional analysis (results not shown here but are available from authors upon request) when we use a full description of all the math courses that a student took in a high school and analyze the impact of the MMC on the total number of math credits, the results show that, on average, post-policy students are likely to take 0.16 more credits and to pass 0.14 more credits than pre-policy cohorts. 17
Next, we analyze whether the MMC’s impact on the number of math credits varies across grade levels, school characteristics, and previous math score quintiles. Estimates in each column are coefficients from a separate regression of math credits on demographic- and school-controls controlling for between-school variation. Estimation specifications in Table 3 are analogous to column 3 of Table 2 in each subgroup. Columns 1 to 4 consider heterogeneity by grade, and columns 5 to 9 present the heterogeneity by math score quintiles in Grade 8. To account for changes in scores across cohorts, these quintiles were generated by cohort, which makes the comparison of math preparation only meaningful within the cohort.
Estimated Heterogeneous Impacts of MMC on Math Credits
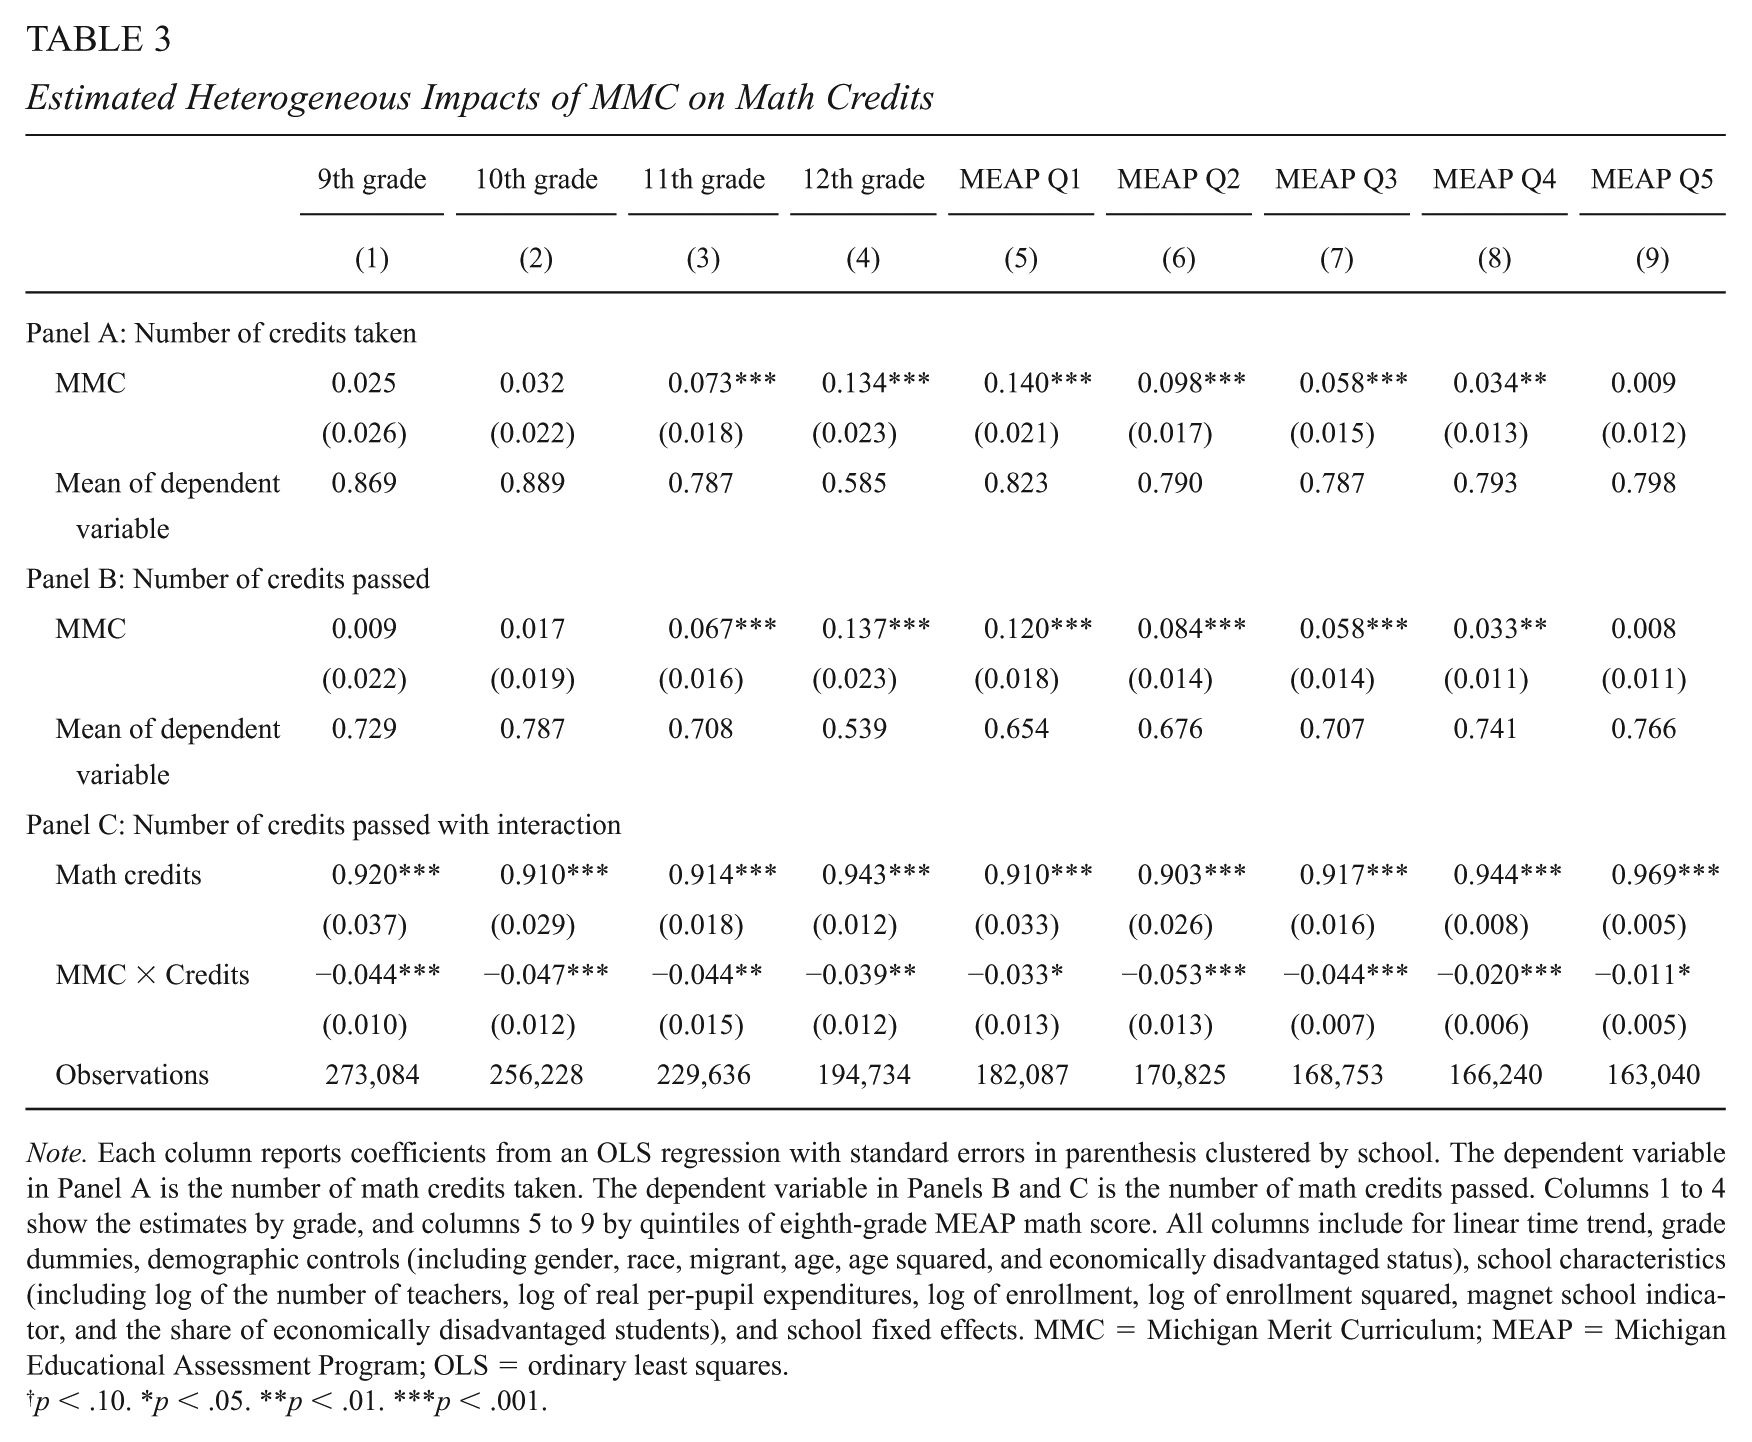
Note. Each column reports coefficients from an OLS regression with standard errors in parenthesis clustered by school. The dependent variable in Panel A is the number of math credits taken. The dependent variable in Panels B and C is the number of math credits passed. Columns 1 to 4 show the estimates by grade, and columns 5 to 9 by quintiles of eighth-grade MEAP math score. All columns include for linear time trend, grade dummies, demographic controls (including gender, race, migrant, age, age squared, and economically disadvantaged status), school characteristics (including log of the number of teachers, log of real per-pupil expenditures, log of enrollment, log of enrollment squared, magnet school indicator, and the share of economically disadvantaged students), and school fixed effects. MMC = Michigan Merit Curriculum; MEAP = Michigan Educational Assessment Program; OLS = ordinary least squares.
p < .10. *p < .05. **p < .01. ***p < .001.
There are four points to note. First, high school students are, on average, taking more math courses, with a statistically significant increase for students in the 11th and 12th grade. Second, although students in higher grades pass more total math courses, 11th and 12th graders in the post-policy period do pass math courses at a similar rate. Third, the least-prepared students, measured by math test score in Grade 8, have the largest increase in the number of math credits taken and passed, and the impact of the policy becomes smaller as students are better prepared. Fourth, at the school level, the biggest increase in math credits in the post-policy period occurs among the most disadvantaged schools (results not shown here). Schools with a lower share of economically disadvantaged students are unaffected by the policy. As it is in schools with a higher share of economically disadvantaged students and those least-prepared that we see the most dramatic policy-related changes, it seems that the policy successfully provided an opportunity for disadvantaged and unprepared students to take more rigorous math courses, to better prepare them for college enrollment. This statement, however, requires additional investigation. Demonstrating that students took more math courses post-policy does not show they are more prepared for college until we look at changes in the level of math courses taken and passed. This is what we analyze next.
Effects on the Course Intensity
To gain a sense of the level of course difficulty, we use course title in the following analysis as specified in SCED. 18 Course level is calculated by pipeline measures introduced by Burkam et al. (2003). Columns 1 to 3 of Panel A in Table 4 estimate the impact of the policy on highest level taken by including school controls and controlling for between-school variation. The specifications in Table 4 mirror columns 1 to 3 in Table 3, but the dependent variable is the course level passed. The estimates indicate that, on average, for each grade, high school students after the policy take the same level of math courses as students in pre-policy periods once we control for observables. Columns 4 to 6 use the highest level of math passed as a dependent variable and indicate that post-policy students pass math courses that are slightly higher levels than their pre-policy counterparts passed after we control for between-school differences.
Estimated Impacts of MMC on Math Level
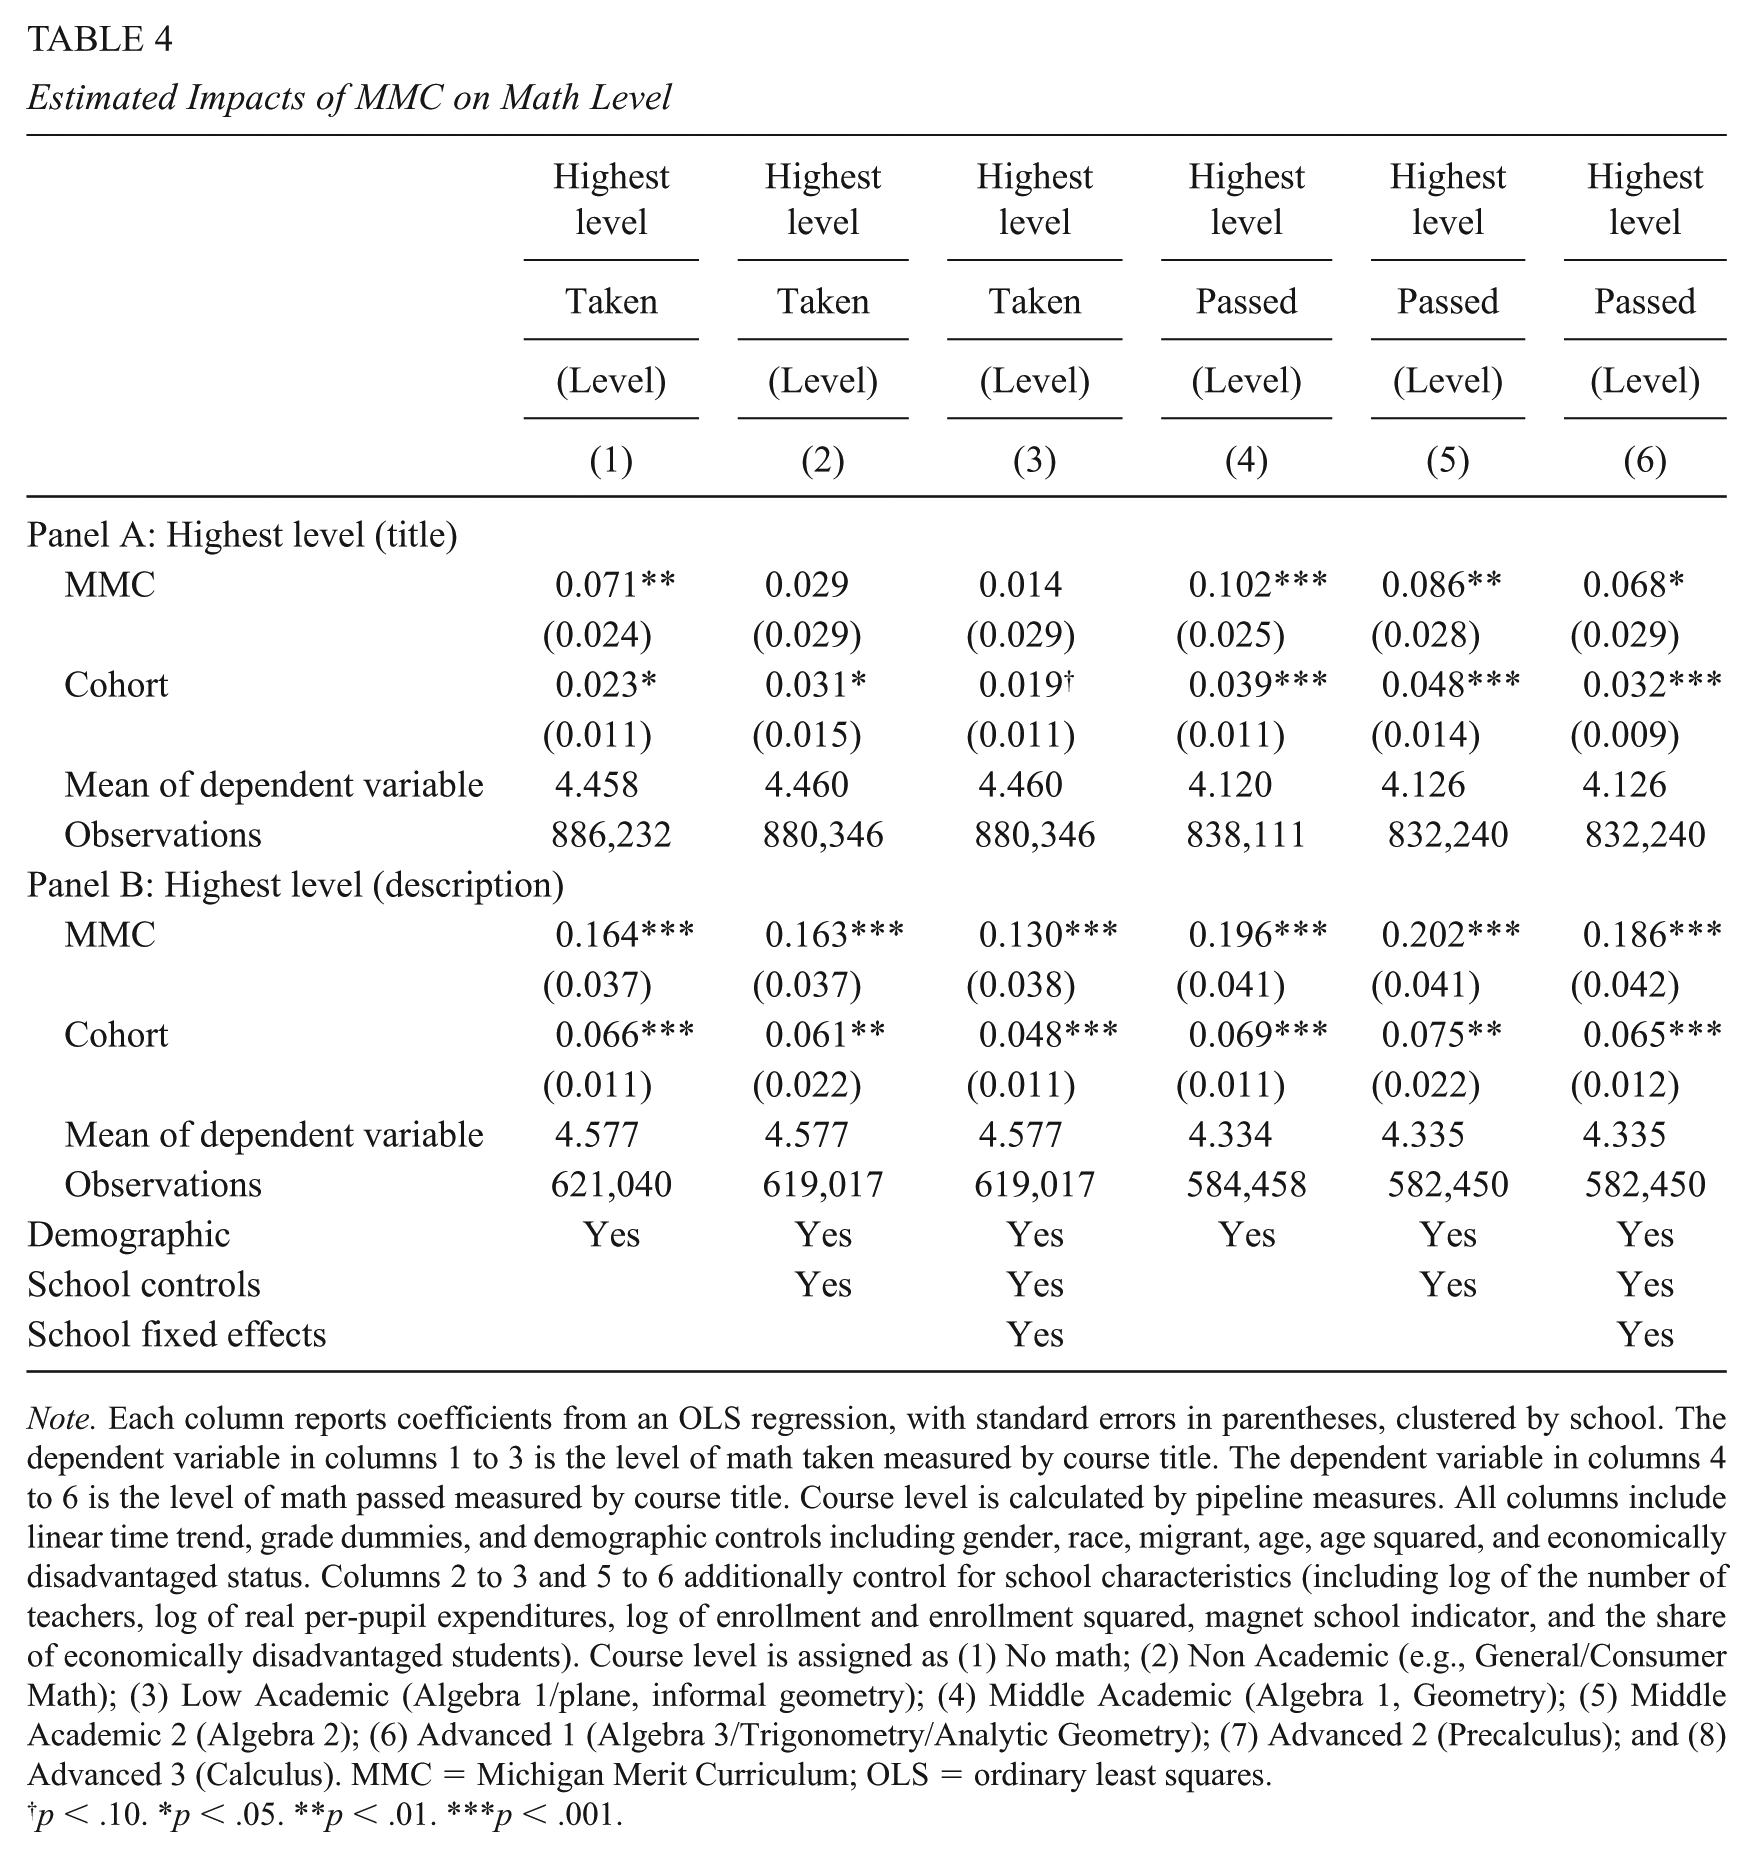
Note. Each column reports coefficients from an OLS regression, with standard errors in parentheses, clustered by school. The dependent variable in columns 1 to 3 is the level of math taken measured by course title. The dependent variable in columns 4 to 6 is the level of math passed measured by course title. Course level is calculated by pipeline measures. All columns include linear time trend, grade dummies, and demographic controls including gender, race, migrant, age, age squared, and economically disadvantaged status. Columns 2 to 3 and 5 to 6 additionally control for school characteristics (including log of the number of teachers, log of real per-pupil expenditures, log of enrollment and enrollment squared, magnet school indicator, and the share of economically disadvantaged students). Course level is assigned as (1) No math; (2) Non Academic (e.g., General/Consumer Math); (3) Low Academic (Algebra 1/plane, informal geometry); (4) Middle Academic (Algebra 1, Geometry); (5) Middle Academic 2 (Algebra 2); (6) Advanced 1 (Algebra 3/Trigonometry/Analytic Geometry); (7) Advanced 2 (Precalculus); and (8) Advanced 3 (Calculus). MMC = Michigan Merit Curriculum; OLS = ordinary least squares.
p < .10. *p < .05. **p < .01. ***p < .001.
But some might say that title is not sufficient. We took this one step further by analyzing the course catalog (see Kim, Troutman, Minor, Schneider, & Frank, 2015). Here, we found that 30% of math courses in the MTS have a course description that differs from what would be inferred by the course title. We, therefore, argue that the course description is better suited for analyzing course level, since course descriptions are often based on the content of textbooks and provide a closer link to what is taught in a class than the course’s title. We, therefore, turn to analysis using course description.
The dependent variable in Panel B is the course level, as measured by course description. After controlling for demographic and school characteristics and between-school variation, the estimates in column 3 imply that the highest level of math a post-policy student took increased by an average of 0.13 levels, whereas the highest level passed increased by 0.19 levels. The highest level of math passed for pre-policy cohorts lies between Geometry (Level 4) and Algebra 2 (Level 5), and the highest level achieved is moving toward the Algebra 2 threshold set by the policy, indicating that some students are still not meeting the graduation requirement. 19 When we measure course level using course descriptions, we find larger increases in the highest level of math taken than when measured by the course title. This could imply that a course might teach students content that differs from that which can be inferred from the title. Furthermore, this may be the result of schools updating the contents of courses described in the catalog to meet the state requirements.
Next, we examine the heterogeneity in the impacts of the MMC on course level by the grade level and varying ability level of high school students. Estimates in each column are coefficients from a separate regression of highest level of math on demographic and school controls, controlling for time-invariant between-school heterogeneity. Estimation specifications in Table 5 are analogous to column 3 of Table 4 in each subgroup.
Estimated Heterogeneous Impacts of MMC on Math Level (Description)
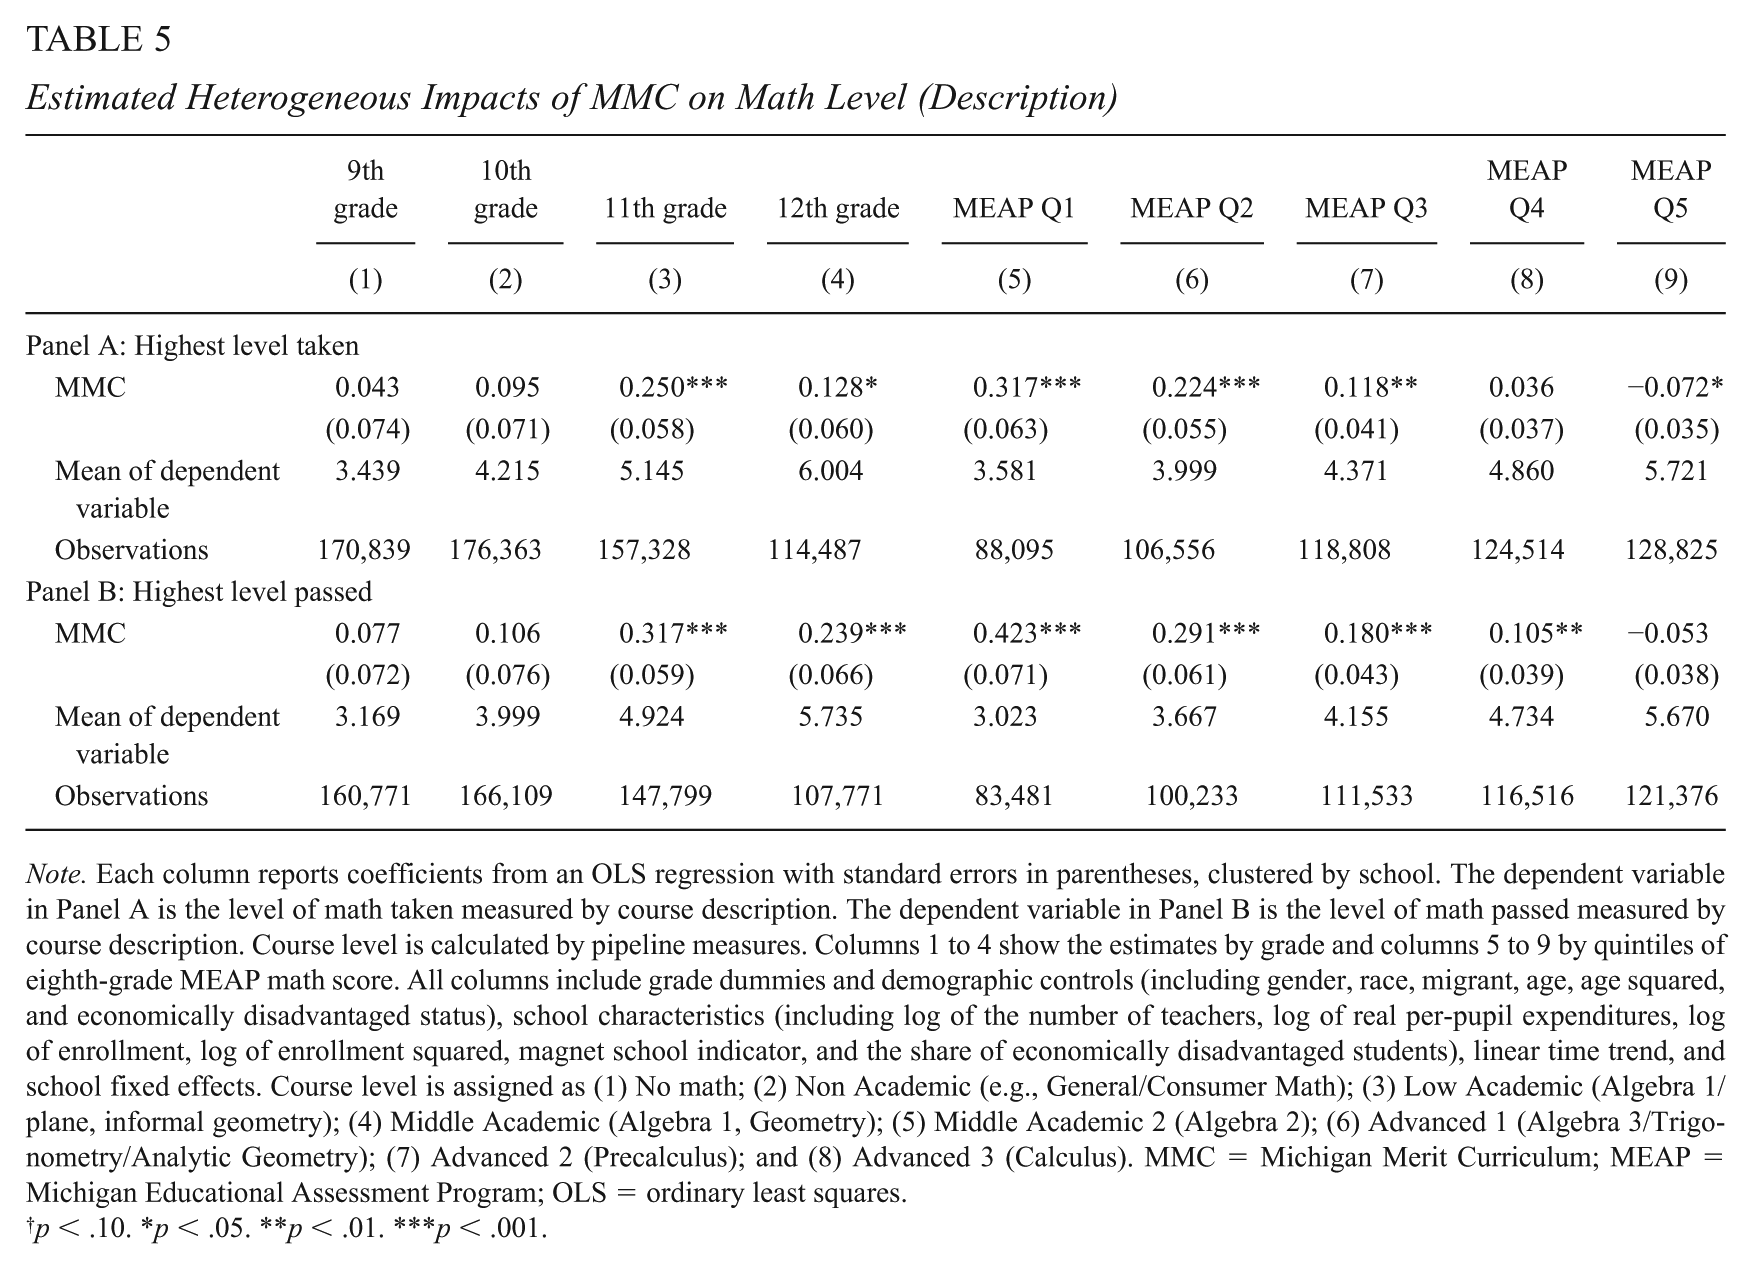
Note. Each column reports coefficients from an OLS regression with standard errors in parentheses, clustered by school. The dependent variable in Panel A is the level of math taken measured by course description. The dependent variable in Panel B is the level of math passed measured by course description. Course level is calculated by pipeline measures. Columns 1 to 4 show the estimates by grade and columns 5 to 9 by quintiles of eighth-grade MEAP math score. All columns include grade dummies and demographic controls (including gender, race, migrant, age, age squared, and economically disadvantaged status), school characteristics (including log of the number of teachers, log of real per-pupil expenditures, log of enrollment, log of enrollment squared, magnet school indicator, and the share of economically disadvantaged students), linear time trend, and school fixed effects. Course level is assigned as (1) No math; (2) Non Academic (e.g., General/Consumer Math); (3) Low Academic (Algebra 1/plane, informal geometry); (4) Middle Academic (Algebra 1, Geometry); (5) Middle Academic 2 (Algebra 2); (6) Advanced 1 (Algebra 3/Trigonometry/Analytic Geometry); (7) Advanced 2 (Precalculus); and (8) Advanced 3 (Calculus). MMC = Michigan Merit Curriculum; MEAP = Michigan Educational Assessment Program; OLS = ordinary least squares.
p < .10. *p < .05. **p < .01. ***p < .001.
Starting in column 1 through column 4, we find that 11th and 12th graders in the post-policy period take higher level courses than students in pre-policy periods. As the average level taken in 11th-grade is 5.145, which is equivalent to Algebra 2, the increase in the level taken implies students who successfully take Algebra 1 and Geometry in the first 2 years in high school are taking Algebra 2 in 11th grade and Algebra 3 in 12th grade. Similarly, post-policy cohorts are more likely to complete Geometry in 10th grade and Algebra 2 in 11th grade—which are the intended outcomes of the policy—leading to a large increase in the level passed in the 12th grade. In this regard, the policy seems to have been successful.
Second, estimated effects in columns 5 to 9 indicate that the largest increase in the level of math course taken and passed occurs among the least-prepared students, and the increase gets smaller as the proficiency level in Grade 8 increases. Combining this fact with the results in Table 2, which show that post-policy cohorts are taking more courses, suggests that those students might pass the required courses by retaking them. The estimated effects on the level passed by the school share of economically disadvantaged students (results not shown here) indicate marginally significant increases only from schools with a medium share of disadvantaged students.
This rather sudden and dramatic increase in the level of math attained by the low-SES students in post-policy cohorts leads us to speculate that the standards for passing these courses may have changed. Future research examining the grades attained, rather than simply the pass rates in these courses, would allow us to study in detail the changes in pass rates.
Effects on the Policy-Mandated Courses
We also examine the differences in the probability of passing MMC-required math courses separately by 9th, 10th, 11th, and 12th graders and Grade 8 math score quintiles, between pre- and post-policy cohorts. With respect to changes in the probability of passing Algebra 1 (Supplemental Table 4, Panel A in the online version of the journal), we see that only the least-prepared students are 12 percentage points more likely to pass the course in ninth grade than pre-policy cohorts. Next, estimates in Panel B indicate that the majority of post-policy cohorts are more likely to pass Geometry in 9th grade, and the least-prepared students are 12 percentage points more likely to pass Geometry in 10th grade. The magnitudes are almost identical to the increased probability of passing Algebra 1 in 9th grade for the least-prepared students, which suggests that those students are on track as the policy intended. As post-policy students are more likely to take Algebra 1 and Geometry in 9th and in 10th grade, the impact of the MMC on the likelihood of passing Algebra 2 is in effect in 11th and in 12th grade, as shown in Panel C. The impact is larger for less-prepared students: a 26-percentage-point increase for the least prepared-students and a 6-percentage-point increase for the most-prepared students in 11th grade. The impact on the probability of passing Algebra 2 in Grade 12 is at its largest for the least-prepared students and positive for students from higher quintiles. Overall, there is no statistically significant indication of increased probability of passing MMC-required courses for the most-prepared students.
This analysis suggests that the MMC may have had positive impacts on a variety of course-taking measures. Post-policy cohorts not only took more math courses but also took and passed higher level math courses than their pre-policy peers. Furthermore, the impacts are largest for the least-prepared students and students at the most disadvantaged schools. Perhaps most telling is the lack of impact among high-performing students and well-off schools where the policy is unlikely to have resulted in a change to the school’s graduation requirements. Furthermore, the math progression of who passed which courses also demonstrates that schools are pushing students along the more rigorous track mandated by the policy. Unfortunately, the policy is not without repercussions. Overall, students are slightly less likely to pass math courses, and when we examine the timing of those passing 9th- and 10th-grade courses taken in 11th and 12th grade, it suggests that, for the least-prepared students, pushing them into this more-rigorous track sets them on a path that is challenging for them to keep pace with. 20
Achievement
Post-MMC students took more math courses and higher levels of math courses than their pre-policy counterparts, and in this section, we examine how the improvement in math course-taking is reflected in achievement. As the ACT became mandatory beginning with the 2005 cohort, we focus on the ACT math scores for the 2005 through 2009 cohorts, generally taken in 11th grade, and use each student’s first score on the exam. In addition to the sets of variables controlled for in the previous section, we add local unemployment rates in Grades 9 and 10 to control for any effects of the changes in labor market conditions across time—especially during the Great Recession—on achievement and standardized math score taken in Grade 8 (see Jacob et al., 2017, for this rationale).
Table 6 explores the impact of the MMC on math achievement, as measured by the first ACT math score. Columns 1 to 2 show that post-policy students are about 3 percentage points more likely to take the ACT math test, and the sample size decreases by 11% when previous math score is included. Columns 3 to 4 present the impact of the MMC on ACT math score. Post-policy students earn 0.119 points higher in ACT math than their pre-policy counterparts. Once we further control for the previous math test in Grade 8, the magnitude increases to 0.225, which is equivalent to 0.05 standard deviations. 21 In column 5, we estimate the impact of the policy with an interrupted time series (ITS) design following Jacob et al. (2017). 22 The estimated coefficient of −0.276 (0.076), which is close to −0.333 (0.069) from Jacob et al. (2017), indicates that the estimated impact of the MMC on test score is negative.
Estimated Impacts of MMC on Achievement
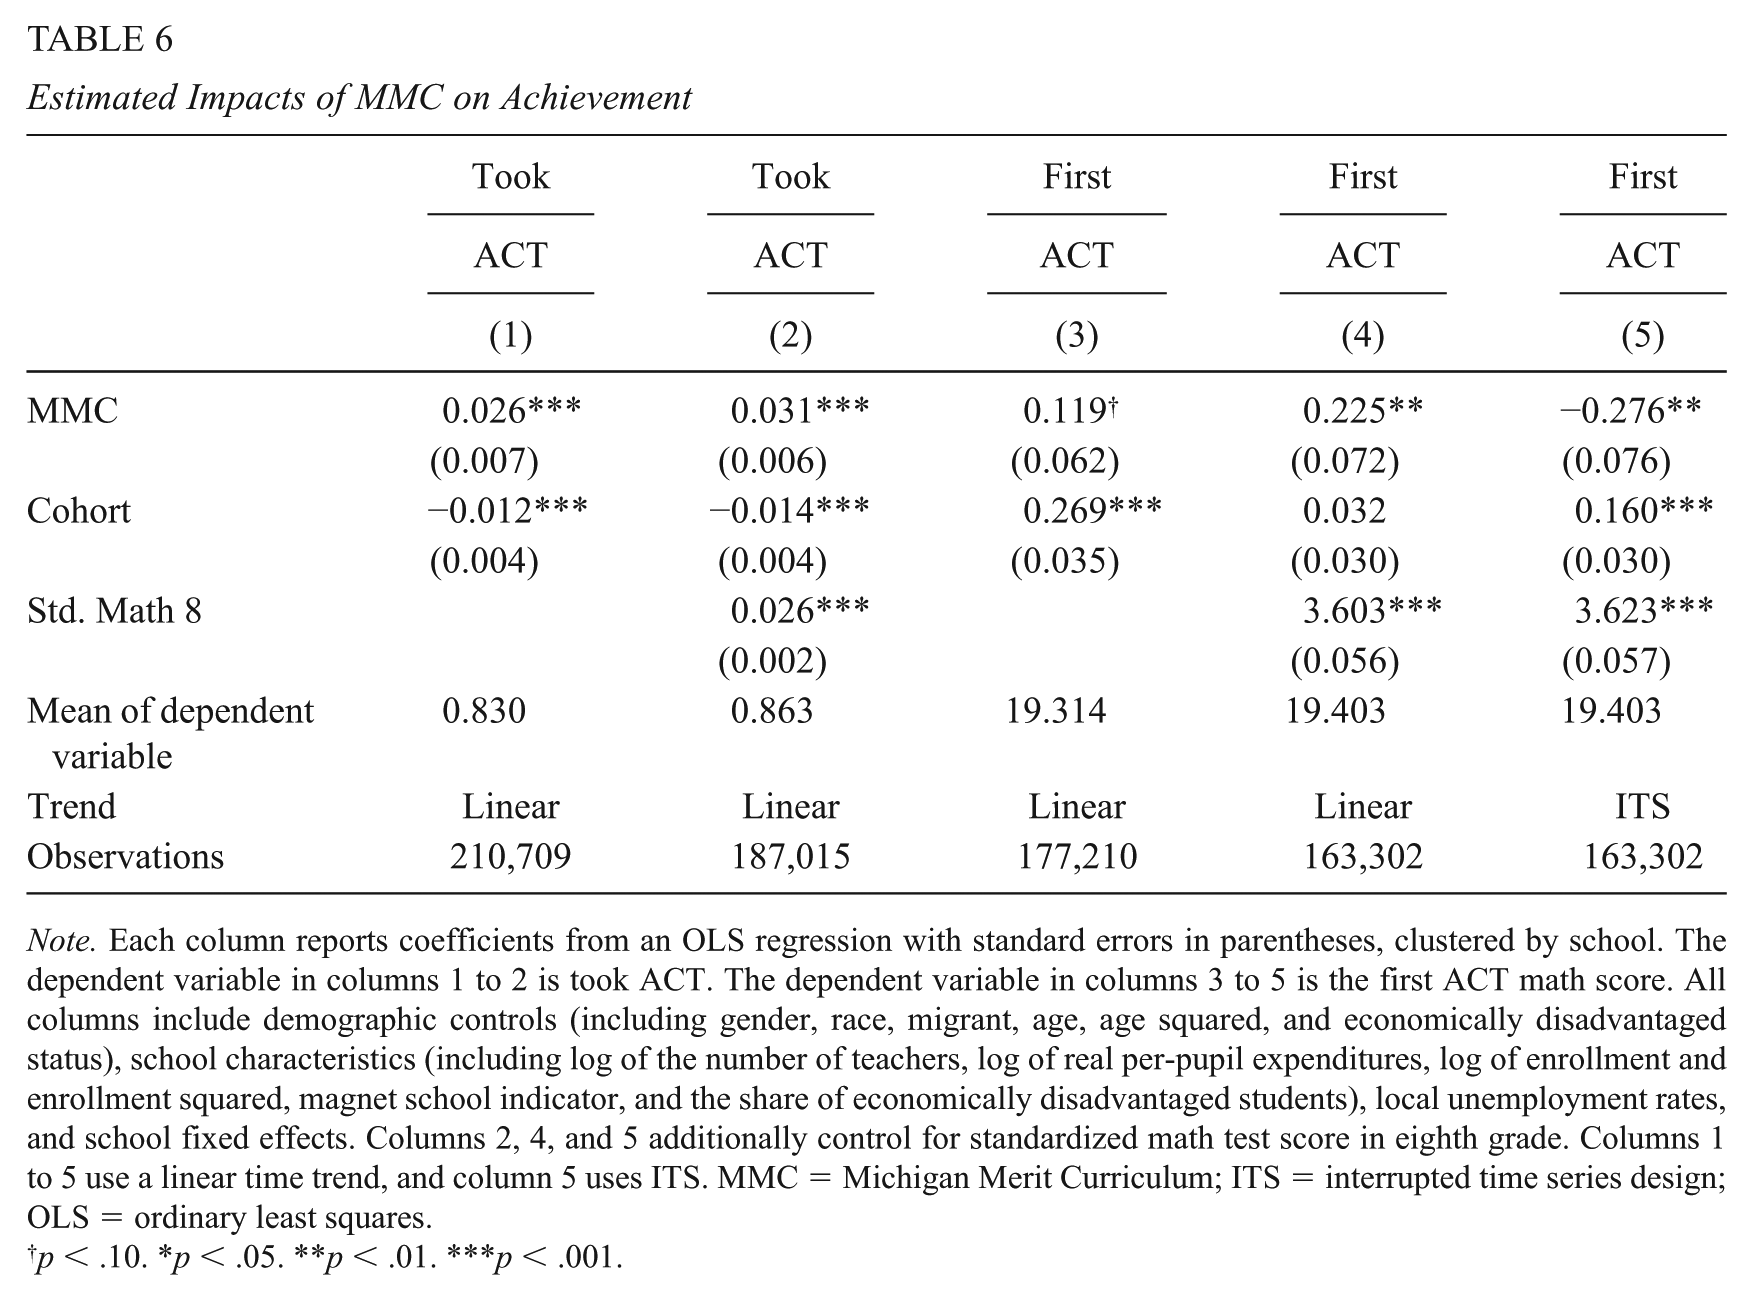
Note. Each column reports coefficients from an OLS regression with standard errors in parentheses, clustered by school. The dependent variable in columns 1 to 2 is took ACT. The dependent variable in columns 3 to 5 is the first ACT math score. All columns include demographic controls (including gender, race, migrant, age, age squared, and economically disadvantaged status), school characteristics (including log of the number of teachers, log of real per-pupil expenditures, log of enrollment and enrollment squared, magnet school indicator, and the share of economically disadvantaged students), local unemployment rates, and school fixed effects. Columns 2, 4, and 5 additionally control for standardized math test score in eighth grade. Columns 1 to 5 use a linear time trend, and column 5 uses ITS. MMC = Michigan Merit Curriculum; ITS = interrupted time series design; OLS = ordinary least squares.
p < .10. *p < .05. **p < .01. ***p < .001.
The estimated impacts of the MMC on ACT math scores are very sensitive to specifications, and we do not find any persuasive evidence that there was any significant policy impact on overall achievement. 23 On one hand, it might be natural to expect that the test score would increase for post-policy students, as they are taking more and higher levels of math courses. On the other hand, the fact that students passed additional courses would not necessarily improve test scores. If the school did not receive enough resources from the state to accommodate the higher requirements—hiring new teachers, for instance—then average input per student is likely to decrease. Or, if the newly hired teachers are less experienced than existing teachers and are teaching lower track students, then the policy impact on test scores could be unclear.
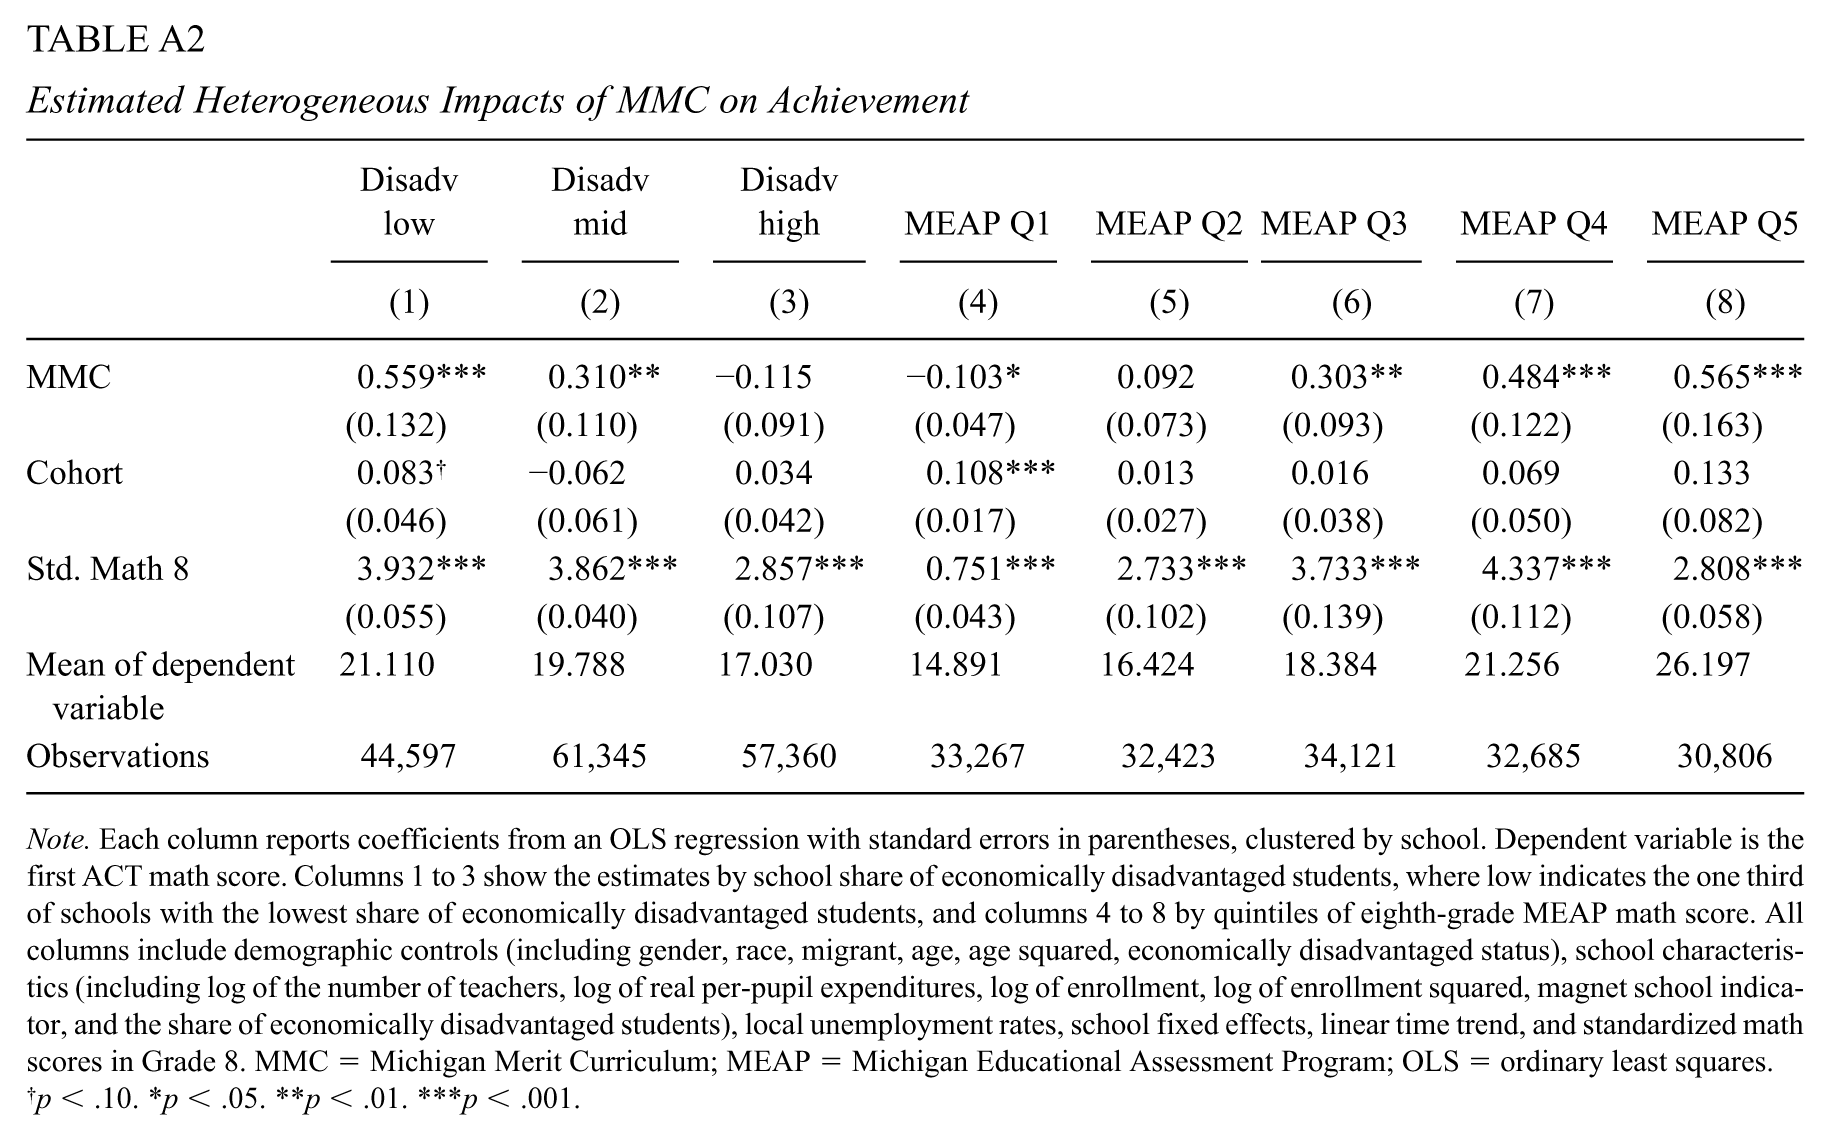
Table A2 provides the heterogeneous impact of the MMC on ACT math by school characteristics and previous test score in Grade 8. We divide schools into three groups, with “Disadv Low” representing one third of the sample with the lowest share of economically disadvantaged students. Contrary to the results found in the heterogeneity of course-taking, the estimated impact is positive only for well-prepared students and students from advantaged schools, which implies a widening achievement gap between the most prepared and the least prepared students post-policy. 24
College Enrollment
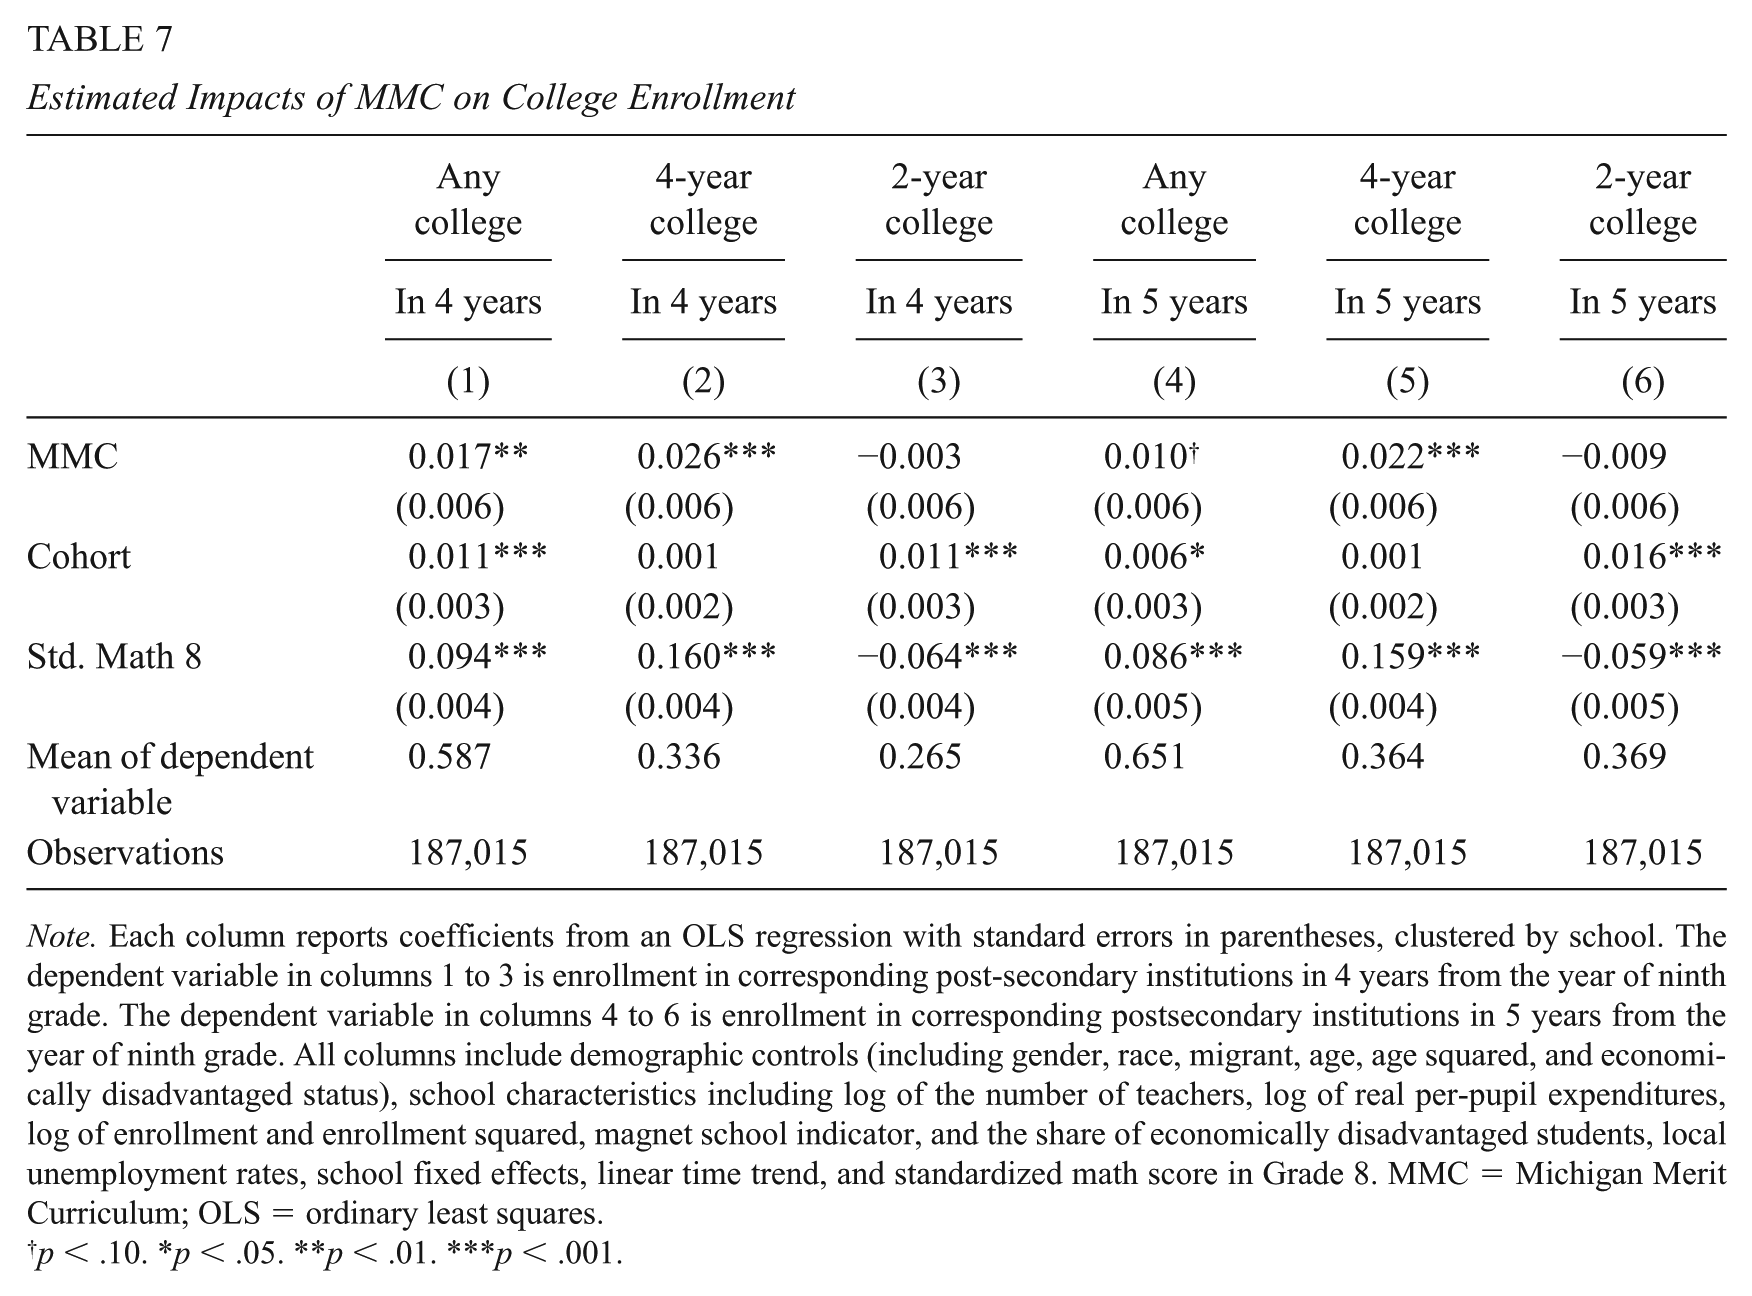
In the previous section, we have seen clear evidence that post-MMC students took more and higher levels of courses than pre-MMC students, but we could not find any consistent policy impact on achievement. Jacob et al. (2017) estimated impacts of the MMC on ACT subjects and showed that the introduction of the MMC had a larger impact on ACT science and reading than in math or English, which could have a positive impact on college enrollment. We, therefore, obtained college enrollment information from the NSC, and in Table 7, we present the estimated impact of the MMC on college enrollment, additionally controlling for local unemployment rates in ninth, 10th, and 11th grade. We measure college enrollment status within 4 to 5 years from the 9th grade.
Estimated Impacts of MMC on College Enrollment
Note. Each column reports coefficients from an OLS regression with standard errors in parentheses, clustered by school. The dependent variable in columns 1 to 3 is enrollment in corresponding post-secondary institutions in 4 years from the year of ninth grade. The dependent variable in columns 4 to 6 is enrollment in corresponding postsecondary institutions in 5 years from the year of ninth grade. All columns include demographic controls (including gender, race, migrant, age, age squared, and economically disadvantaged status), school characteristics including log of the number of teachers, log of real per-pupil expenditures, log of enrollment and enrollment squared, magnet school indicator, and the share of economically disadvantaged students, local unemployment rates, school fixed effects, linear time trend, and standardized math score in Grade 8. MMC = Michigan Merit Curriculum; OLS = ordinary least squares.
p < .10. *p < .05. **p < .01. ***p < .001.
Seventy percent of students in our sample have college enrollment information from the NSC, from which we construct college enrollment variables at 2- and 4-year institutions. We code students missing college enrollment information from the NSC as not enrolled. Dynarski et al. (2015) showed that the NSC covers 84% of college enrollment for the 2004 cohort and more than 94% for the 2006 and 2008 cohorts, and presented the measurement errors as including enrollment coverage rates, matching errors, and suppressed student-level information. Given the misclassification of postsecondary enrollment status and poorer coverage among for-profit institutions, our approach categorizes students who are enrolled in for-profit private colleges as not attending college. If the misclassification is uncorrelated with the policy, our estimates will be attenuated toward zero (Bound, Brown, & Mathiowetz, 2001). Another potential source of bias is if the policy has induced students to attend for-profit institutions with poorer coverage, in which case we are underestimating the policy effects. 25 Cellini and Turner (2016) stated that the vast majority of for-profit students work before attending college and showed that the average age when students completed a for-profit degree program is 28 years old for an associate degree and 30 years old for a bachelor’s degree. As our sample measures college attendance status within 5 years of starting ninth grade, the low coverage for for-profit institutions is not likely to significantly bias the estimates.
In Table 7, we present estimated impacts of the MMC on college enrollment, where the dependent variable is a measure of whether an individual is enrolled in a college within 4 years starting from ninth grade (columns 1–3) and/or 5 years (columns 4–6). Once observables and between-school variations are controlled for, post-MMC students are three percentage points more likely to enroll in 4-year institutions, whereas there are no changes in 2-year college enrollment rates. Columns 4 to 6 present the impact on college enrollment at 5 years from ninth grade and the results are similar to those in columns 1 to 3.
Table 8 explores the heterogeneous policy impact on college enrollment by math test score quintile in Grade 8. We do not find any changes in 4-year college enrollment rates for less-prepared students, but around a four- to six- percentage-point increase in enrollment rates for better-prepared students, which is consistent with the increase in ACT math scores in Panel A in Table A2. We do not find any changes in 2-year college enrollment rates for most subgroups. If it takes longer to graduate high school, the estimates with on-time high school graduates are likely to underestimate changes in college enrollment rates. However, the changes in college enrollment rates 5 years from ninth grade in Panels D to F are very similar to those at 4 years.
Estimated Heterogeneous Impacts of MMC on College Enrollment
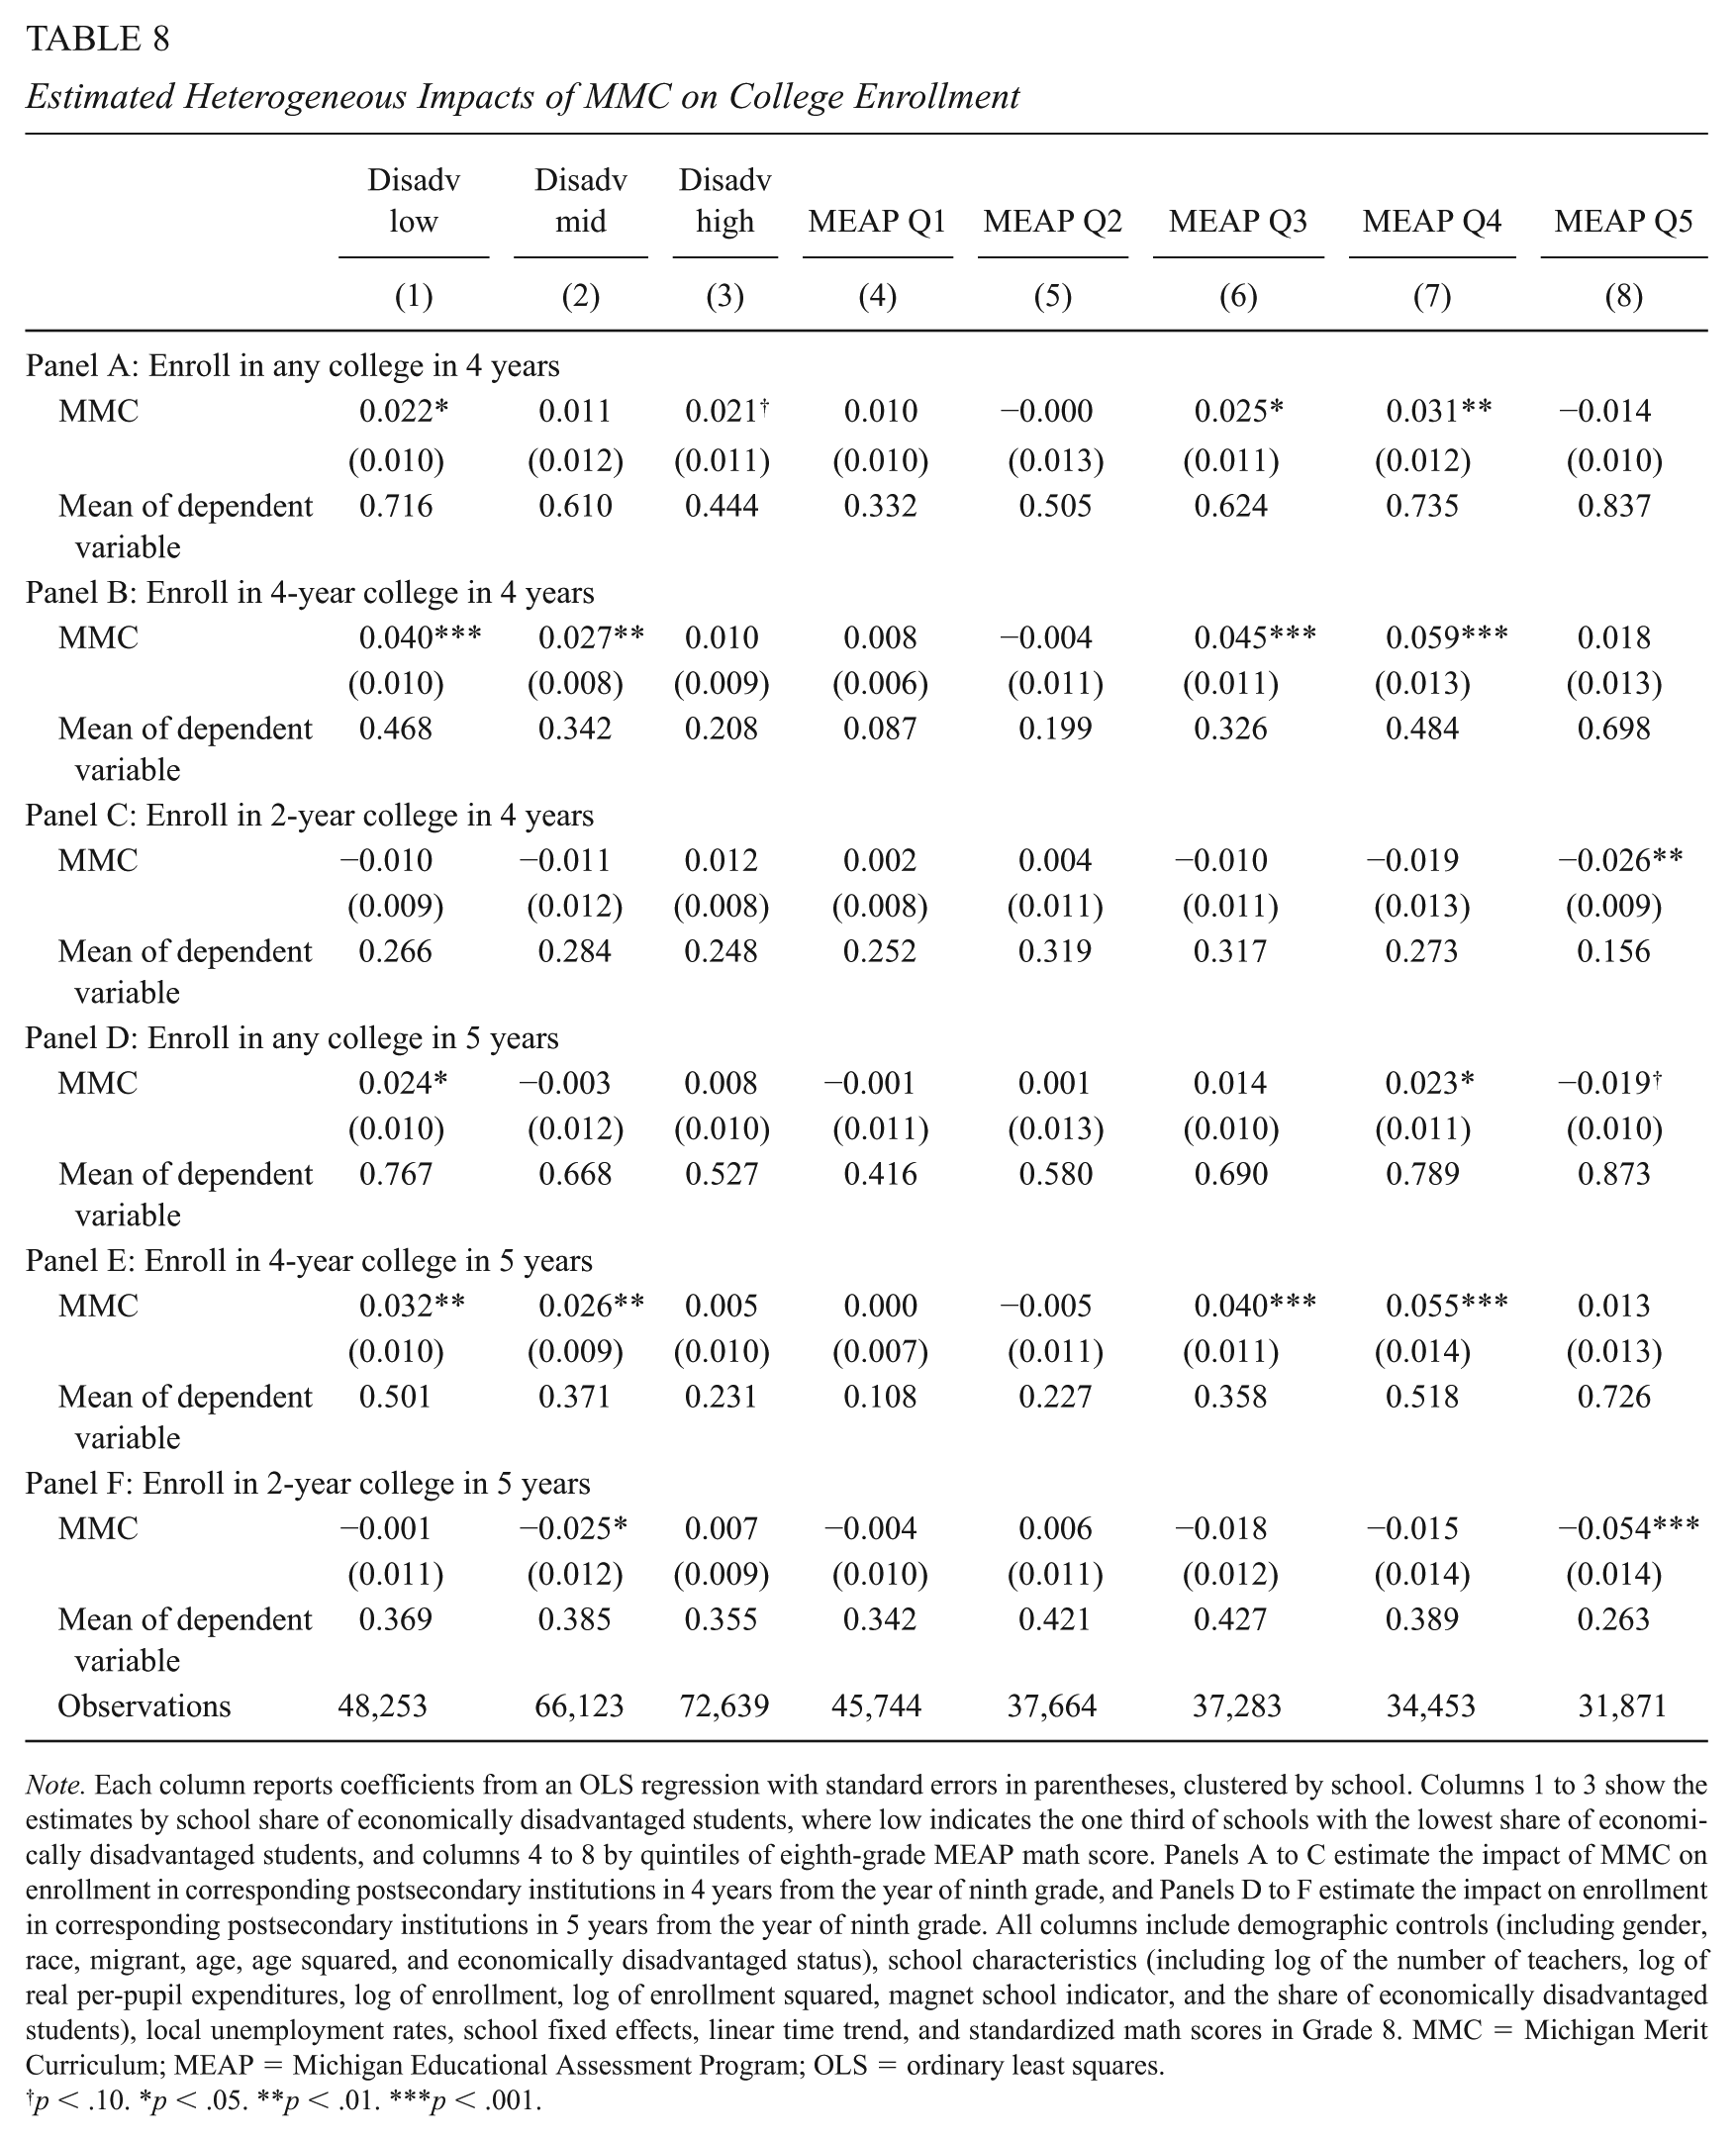
Note. Each column reports coefficients from an OLS regression with standard errors in parentheses, clustered by school. Columns 1 to 3 show the estimates by school share of economically disadvantaged students, where low indicates the one third of schools with the lowest share of economically disadvantaged students, and columns 4 to 8 by quintiles of eighth-grade MEAP math score. Panels A to C estimate the impact of MMC on enrollment in corresponding postsecondary institutions in 4 years from the year of ninth grade, and Panels D to F estimate the impact on enrollment in corresponding postsecondary institutions in 5 years from the year of ninth grade. All columns include demographic controls (including gender, race, migrant, age, age squared, and economically disadvantaged status), school characteristics (including log of the number of teachers, log of real per-pupil expenditures, log of enrollment, log of enrollment squared, magnet school indicator, and the share of economically disadvantaged students), local unemployment rates, school fixed effects, linear time trend, and standardized math scores in Grade 8. MMC = Michigan Merit Curriculum; MEAP = Michigan Educational Assessment Program; OLS = ordinary least squares.
p < .10. *p < .05. **p < .01. ***p < .001.
Sensitivity Analyses
Because we do not have a comparison group, we conduct several sensitivity analyses to assess the robustness of the research design and estimation assumptions. First, in an effort to determine how much bias would have been necessary to invalidate our inference, we adopt the approach outlined by Frank, Maroulis, Duong, and Kelcey (2013). We apply our analysis to the estimated effect of .063 and standard error of .014 from the third column of Table 2 for the number of math credits students have taken, controlling for covariates and school fixed effects. Using statistical significance as a threshold for our sample of 1,007,448 (df of 1,007,363), and standard error of .014, the threshold for statistical significance is δ# = se × tcritical,df =1.96, 1007363 =.014 × 1.96 = .027. Given the estimated effect of .063, to invalidate the inference, bias must have accounted for 1 − .027 / .063 = .56, or about 56% of the estimated effect. Drawing on Rubin’s Causal Model, to invalidate our inference one would have to replace about 56% (about 564,123) of the cases, and assume the limiting condition of zero effect in the replacement counterfactual cases. For the estimate of 0.081 that does not account for the school fixed effects (column 2), the bias would have to be roughly 52% of the estimated effect. These levels of robustness are greater than half to two thirds of the EEPA studies reviewed by Frank et al. (2013). Thus, while we concede that there are limitations to our identification strategies in this case, we would argue that those limitations are likely not great enough to invalidate our inferences.
Second, we consider subgroups that may have been less affected by the policy as an additional sensitivity test. Communities that are near college areas might be less affected by the policy because most students in these communities were already meeting the new course requirements in the pre-policy period. Thus, we measure the distance by miles to the nearest college and compare schools that are close to the college areas (high-SES/achievement communities) with communities further located from the colleges (distances divided by quintiles) and estimate the MMC impacts by using a difference-in-differences method. Results indicate that students who lived further away from college areas showed marginal improvement only in terms of highest level of math taken or passed compared with those students who attended schools in college areas, but no changes in predicted probability in college enrollment (see Supplemental Appendix Table 5 in the online version of the journal).
Finally, given the finding that college enrollment increased among more well-prepared students, we examine whether these effects are driven by geographic regions in Michigan. We divide the sample into six geographic regions and examine whether high-achieving students, measured by eighth-grade state math test, from certain regions drove the improvement in college enrollment. Results indicate that the 4-year college enrollment rates from two regions—the Upper Peninsula region and the southwest region—showed that students from the third and fourth performance quintiles did not significantly improve after the intervention. However, the predicted probability of enrolling in 4-year colleges did improve for students in the third or fourth quintiles in the other four regions after the intervention. Thus, the effects are not uniform across regions or pre-test quintiles (see Supplemental Appendix Table 6 in the online version of the journal).
Conclusion
Using this unique representative sample of high school student transcript data over time, we find positive and substantial impacts of the MMC on course-taking. Cohorts in the post-policy period are taking on average approximately 0.2 additional years’ worth of math, and are passing the majority of these additional courses. However, we do find that students are four percentage points less likely to pass a math course in the post-policy period. We argue that this is in part due to the fact that the policy did not help prepare students for the more rigorous courses they were required to take. We also find that nearly all of these effects are driven by low-SES schools. In addition to taking more courses, we find students are completing higher-level courses in the post-policy period.
The estimated impact of the MMC on achievement is sensitive to the choice of specifications and sample. If we use the preferred specification, we find a 0.225 (0.05 standard deviation) increase in ACT math scores; if we use an ITS design, the estimate suggests a 0.276 decline in the scores; if we use the 2005 through 2008 cohorts, the estimate is 0.185. Thus, we do not find any clear evidence of policy impacts on ACT math scores.
We do, however, find an increase in college enrollment rates measured within 4 or 5 years of starting high school: The estimates suggest a three-percentage-point (8%) increase in 4-year college enrollment rates in 4 years and a two-percentage-point (6%) increase in 5 years. The increase in college enrollment rates is mostly driven by well-prepared students and students from advantaged schools. As our data only include two post-policy cohorts, this potentially limits our capacity to reliably estimate the long-term effects of the MMC. For example, we might expect to see more students that have mastered the math content required by the state and a larger increase in students’ ACT scores several years after the MMC’s initial implementation. One possible reason is that it usually takes extra time to hire more qualified math teachers to teach the new math courses and maintain class size, especially in the disadvantaged schools.
It is, however, interesting to note that the least-prepared students have the largest increase in the number of courses and the highest levels passed, but they do not show any improvement in ACT math score and college enrollment. The obvious explanation is that, contrary to expectations, there is no link between course-taking, ACT performance, and college attendance. This may be because college attendance continues to be based more on resources than ability, or perhaps that the ACT is not well-aligned with the new required courses. The mechanism of how the improvement in course-taking is translated to test scores or to college enrollment is left for future research.
Without exogenous variation in the policy, we cannot make direct claims of causality; however, the evidence is quite consistent with the argument that changes are being driven by the policy itself. Most importantly, we see changes that are consistent with what we would expect from the policy: a one-time change in course-taking behavior and no impact in schools for which the policy requirements were least likely to be binding. Finally, controlling for existing trends in course-taking behavior and looking only at within-school changes, we still see a strong impact of the policy. These techniques do not control for all alternative explanations, but taken as a whole, the evidence for a causal impact is convincing. This differential expected impact from the policy highlights some additional quasi-experimental techniques that could be used to further explore the impact of policies like these—for example, comparing the impact across schools with different pre-policy graduation requirements.
The results lead to mixed conclusions with regard to the success of the policy. On its face, the policy seems to have been quite successful. The average student takes nearly an additional semester’s worth of math and passes these additional courses at a rate of about 88%. This seems like a monumental short-term success story. However, as pointed out by Jacob et al. (2017), evidence has not yet been found suggesting that this has resulted in significant performance gains as measured by standardized exams. The answer to why we do not see gains in performance lies in achieving a better understanding of what was actually taught in these courses, and how the standards for these courses may have changed. We see strong evidence that the content that courses were supposed to cover has become more rigorous, as we see greater gains in achievement when course level is measured using course description rather than course title. However, this does not necessarily tell us what was actually taught in these courses. Analysis of a similar policy in Chicago suggested that teachers often lowered standards to accommodate students who may not have taken the more rigorous courses pre-policy (Mazzeo, 2010). Nonetheless, we can learn quite a bit from both the success and failure of this policy. If the increased failure rate in math courses is driven by unprepared students being pushed into more rigorous courses, the solution to ensuring the success of similar policies may lie in better preparation. This leads us to suggest that a staggered roll-out or longer time frame for implementation of such policies may help ensure their success, by allowing more time for schools to prepare students for the higher standards. 26
Perhaps the greatest success of the policy, as evidenced by this data, is the increased parity in course-taking across SES status. When we look at the policy impact heterogeneously, we see that all of the changes are driven by students attending schools in the bottom two thirds, with regard to a fraction of the economically disadvantaged students. If, as suggested by a significant body of research, inequality in access to courses drives some of the observed differences in academic performance among disadvantaged students, then this policy has successfully addressed this issue. Far more students in these schools are taking—and passing—these courses. This implies that if observed differences in outcomes associated with participating in a more rigorous high school curriculum are not driven by selection into that curriculum, mandated curriculum policies may be an important piece of an education policymaker’s toolkit. If, on the other hand, we do not see outcomes improve over time for students taking these courses, we should turn toward more rigorous analysis of both how course work is related to college and job-market success and how teaching in these courses changes in response to policies mandating standard curricula for diverse student population.
Supplemental Material
DS_10.3102_0162373719834067 – Supplemental material for The Impact of the Michigan Merit Curriculum on High School Math Course-Taking
Supplemental material, DS_10.3102_0162373719834067 for The Impact of the Michigan Merit Curriculum on High School Math Course-Taking by Soobin Kim, Gregory Wallsworth, Ran Xu, Barbara Schneider, Kenneth Frank, Brian Jacob and Susan Dynarski in Educational Evaluation and Policy Analysis
Footnotes
Appendix
Estimated Heterogeneous Impacts of MMC on Achievement
| Disadv low | Disadv mid | Disadv high | MEAP Q1 | MEAP Q2 | MEAP Q3 | MEAP Q4 | MEAP Q5 | |
|---|---|---|---|---|---|---|---|---|
| (1) | (2) | (3) | (4) | (5) | (6) | (7) | (8) | |
| MMC | 0.559*** | 0.310** | −0.115 | −0.103* | 0.092 | 0.303** | 0.484*** | 0.565*** |
| (0.132) | (0.110) | (0.091) | (0.047) | (0.073) | (0.093) | (0.122) | (0.163) | |
| Cohort | 0.083 † | −0.062 | 0.034 | 0.108*** | 0.013 | 0.016 | 0.069 | 0.133 |
| (0.046) | (0.061) | (0.042) | (0.017) | (0.027) | (0.038) | (0.050) | (0.082) | |
| Std. Math 8 | 3.932*** | 3.862*** | 2.857*** | 0.751*** | 2.733*** | 3.733*** | 4.337*** | 2.808*** |
| (0.055) | (0.040) | (0.107) | (0.043) | (0.102) | (0.139) | (0.112) | (0.058) | |
| Mean of dependent variable | 21.110 | 19.788 | 17.030 | 14.891 | 16.424 | 18.384 | 21.256 | 26.197 |
| Observations | 44,597 | 61,345 | 57,360 | 33,267 | 32,423 | 34,121 | 32,685 | 30,806 |
Note. Each column reports coefficients from an OLS regression with standard errors in parentheses, clustered by school. Dependent variable is the first ACT math score. Columns 1 to 3 show the estimates by school share of economically disadvantaged students, where low indicates the one third of schools with the lowest share of economically disadvantaged students, and columns 4 to 8 by quintiles of eighth-grade MEAP math score. All columns include demographic controls (including gender, race, migrant, age, age squared, economically disadvantaged status), school characteristics (including log of the number of teachers, log of real per-pupil expenditures, log of enrollment, log of enrollment squared, magnet school indicator, and the share of economically disadvantaged students), local unemployment rates, school fixed effects, linear time trend, and standardized math scores in Grade 8. MMC = Michigan Merit Curriculum; MEAP = Michigan Educational Assessment Program; OLS = ordinary least squares.
p < .10. *p < .05. **p < .01. ***p < .001.
Acknowledgements
We are grateful for comments and encouragement from Cassandra Guarino, editor, two anonymous referees, and our partners at the Michigan Department of Education (MDE) and Michigan’s Center for Educa-tional Performance and Information (CEPI), especially Thomas Howell, Venessa Keesler, and Melissa Bisson.
Authors’ Note
This research uses data structured and maintained by the Michigan Consortium for Educational Research (MCER). MCER data are modified for analysis using rules governed by MCER and are not identical to data collected and maintained by the Michigan Department of Education (MDE) and/or Michigan’s Center for Educational Performance and Information (CEPI). Results, information, and opinions are the authors’ and do not reflect the views or positions of MDE or CEPI.
Declaration of Conflicting Interests
The author(s) declared no potential conflicts of interest with respect to the research, authorship, and/or publication of this article.
Funding
The author(s) disclosed receipt of the following financial support for the research, authorship, and/or publication of this article: The authors gratefully acknowledge support for this work from the Institute of Education Sciences through Grant R305E100008, the National Science Foundation, by Grant 1661236, and the Office of the John A. Hannah Chair in the College of Education at Michigan State University. Any opinions, findings, and conclusions or recommendations expressed in this manuscript are those of the authors and do not necessarily reflect the views of the funding organizations.
Notes
Authors
References
Supplementary Material
Please find the following supplemental material available below.
For Open Access articles published under a Creative Commons License, all supplemental material carries the same license as the article it is associated with.
For non-Open Access articles published, all supplemental material carries a non-exclusive license, and permission requests for re-use of supplemental material or any part of supplemental material shall be sent directly to the copyright owner as specified in the copyright notice associated with the article.