
Abstract
School Improvement Grants (SIGs) exemplify a capacity-building investment to spur sustainable changes in America’s persistently lowest-performing schools and stimulate the economy. This study examines both short- and longer-term effects of the first two cohorts of SIG schools from four locations across the country. Dynamic difference-in-differences models show that SIGs’ effects on achievement in Grades 3 to 8, as measured by state test scores in math and English language arts, gradually increased over the three reform years and were largely sustained for 3 or 4 years afterward. Evidence on high school graduation rates, though less robust, also suggests SIGs had positive effects. SIGs’ effects on students of color and low-socioeconomic-status students were similar to or significantly larger than the overall effects.
Keywords
School Improvement Grants (SIGs) exemplify such capacity-building investments in education. To incentivize the transformation of the nation’s persistently lowest-performing public schools, and in response to the Great Recession of 2008, Congress appropriated US$3.5 billion for the first cohort of SIG schools through the American Recovery and Reinvestment Act of 2009 and continued the investment by raising funds totaling approximately US$7 billion for five subsequent cohorts of SIG schools (U.S. Department of Education, 2016). SIG funds typically doubled grantee schools’ regular budgets and were available to them for 3 years. SIG schools were required to undertake dramatic transformations, such as replacing the principal, implementing curricular reforms, and tying teacher evaluations to personnel decisions. States and districts provided technical assistance and coaching to build these schools’ capacity to remedy underperformance.
While SIG reforms involved substantial investments, research findings on their near-term effects have been mixed (Dee, 2012; Dragoset et al., 2017; Sun et al., 2017). Although researchers in one study have started to compile 6-year postreform evidence for a similar turnaround initiative in Tennessee (Pham et al., 2019), no study that we know of has examined SIGs’ longitudinal effects beyond the three intervention years and across multiple locations. In this article, we examine the grants’ effects over 6 or 7 years on the first two SIG cohorts of 99 schools from four locations: North Carolina (NC), Washington State (WA), San Francisco Unified School District (SFUSD), and Beachfront County Public Schools (BCPS, pseudonym). 1
This study has several strengths. First, it is the first to comprehensively document the longitudinal effects of SIGs on school performance. Our data extend from 3 years before the SIG awards to 6 or 7 years after, so our longitudinal analysis is aligned with the policy’s intent to help schools build capacity for long-term success. Second, the four locations represent a geographically diverse group of states and districts. Although the SIG program was highly prescriptive relative to other federal capacity-building initiatives, local contexts and capacities nonetheless played a role in implementation (Carlson & Lavertu, 2018; Ginsburg & Smith, 2018). We conducted a pooled analysis across the four locations to examine the overall effects and a separate analysis for each location to examine the effects’ heterogeneity. Third, we examined the effects for student subgroups, analyzing SIGs’ effects for historically underserved students of color and students from low-socioeconomic-status (SES) communities. Finally, we conducted a battery of sensitivity analyses and robustness checks to rule out other possible explanations for the identified effects (Wong et al., 2017).
Using dynamic event analyses based on a difference-in-differences (DID) framework, we identified gradually increasing positive effects of SIGs on math and English language arts (ELA) test scores during the intervention years in elementary and middle schools (Grades 3–8). The effects were larger in the second and third years of the intervention than in the first year. After the SIG program ended, the positive effects on math and ELA test scores decreased slightly. However, the positive effects for math were sustained through at least the third or fourth postpolicy year (6 or 7 years after schools initially received the grant). Turnaround schools, which adopted more dramatic reform strategies than did transformation schools, demonstrated larger increases in test scores during the treatment years and were more able to sustain the positive effects after the funding ended. The evidence on 4-year high school graduation rates is less robust but generally suggests positive program effects. SIGs’ effects varied substantially across the four locations, suggesting differential implementation. The grants’ effects on students of color and low-SES students were similar to and sometimes significantly larger than those for all students. These findings are relevant for future school improvement work, as the Every Student Succeeds Act (ESSA) requires that states spend 7% of state Title I funds—more than US$1 billion a year—on turning around their lowest-performing schools.
Policy Background
SIGs, authorized under section 1003(g) of Title I of the Elementary and Secondary Education Act of 1965, were grants to state education agencies for them to use to make competitive subgrants to local education agencies. SIGs represented a dramatic increase in federal funding levels for remedying underperformance in the nation’s public schools. For instance, the U.S. Department of Education appropriated US$491,265 for this purpose in fiscal year 2008, whereas in fiscal year 2009, under the American Recovery and Reinvestment Act, it appropriated more than US$3.5 billion to states to be used by the first cohort of SIG schools over a 3-year implementation period (from the 2010–2011 school year through 2012–2013). In fiscal years 2010, 2011, and 2012, it appropriated a total of US$1.6 billion to fund a second cohort of SIG schools. In Cohorts 1 and 2, each grantee school received between US$50,000 and US$2 million per year—an award that often doubled their regular budgets. Most states made fewer SIG awards in Cohort 2 than in Cohort 1. However, on average, the annual per-pupil award amount in Cohort 2 was larger than that in Cohort 1.
The SIG program targeted the persistently lowest-performing schools in the state, which were typically defined as schools among the lowest 5% in 3-year average proficiency rates for all students on state assessments in math and ELA (combined). High schools were eligible for the program if their graduation rate for all students was less than 60%. Districts applied to their state education agencies on behalf of some or all eligible schools. State education agencies then competitively awarded grants to schools that met the eligibility criteria and other selection criteria, such as school capacity and commitment to the prescribed turnaround models or geographic location.
SIG schools were required to adopt one of four reform models. The transformation model required replacing the principal, implementing significant instructional reform, increasing learning time, and developing teacher- and leader-evaluation systems that took student progress into account and were tied to personnel decisions (e.g., rewards, promotions, retention, and firing). The turnaround model included all of the transformation model requirements and the replacement of at least 50% of the staff. The restart model required the school to close and reopen under the leadership of a charter or education management organization. Finally, the closure model simply closed the school. About 75% of SIG schools chose the transformation model, 20% chose the turnaround model, and 5% selected the restart model. The closure model was rarely chosen (Ginsburg & Smith, 2018). As a result, more than 99% of SIG funds went to turnaround and transformation schools (Hurlburt et al., 2012). Because of our interest in capacity-building approaches, for this study, we focus only on turnaround and transformation schools, assessing their combined outcomes and comparing the effects of the two models. 2
Schools used SIG funds for a variety of purposes, including funding additional professional development for school leaders and teachers, hiring additional staff members, providing co-planning time for teachers, extending school days, providing differential rewards to teachers based on their performance, implementing curriculum reforms, using student data to adjust instruction, and engaging parents and communities (Sun et al., 2017, 2019). States typically supplemented local investments by providing designated support staff (e.g., school improvement coaches for each SIG school in WA), professional development for SIG-awarded districts or schools (e.g., a principal leadership institute in NC), and improvement tools (such as Indistar, an online planning and implementation tool adopted by NC and WA). The study sites’ states monitored schools’ progress annually to determine whether the SIG funds should continue. Monitoring strategies included a combination of in-person site visits (CA, BCPS, NC, WA), observations by staff assigned to specific districts or schools (BCPS), check-in meetings (e.g., in person or by telephone in BCPS and WA), and online tools (e.g., Indistar in NC and WA). States used a variety of measures to monitor school progress, including student academic progress (e.g., proficiency levels, graduation and dropout rates, academic growth patterns, and percentage of students completing advanced coursework), student engagement and school climate (e.g., student attendance rates, disciplinary incidents, and truancy rates), and staff talent management (e.g., teacher or principal performance distributions and teacher attendance rates).
After the 3-year implementation period, SIG schools in the four states experienced different policy environments. California (where SFUSD is located) and WA did not receive Race to the Top funds. California also did not receive (or apply for) No Child Left Behind (NCLB) waivers, whereas NC, WA, and BCPS received NCLB waivers in 2012–2013. As a result, state and federal school turnaround efforts were discontinued for SIG schools in SFUSD after the three grant years. SIG schools in the other three states could be identified as priority or focus schools under NCLB waivers after the 3 years of SIG grants if they continued to be in the lowest 5% based on student performance (priority schools) or the lowest 10% based on subgroup performance (focus schools). Of the 99 schools in our sample, 84 were designated as priority schools after SIG funds were discontinued. Of those 84 schools, 14 were moved to a focus designation after the initial 3 years following the end of the grant. Priority and focus schools continued to receive monitoring, technical assistance, and financial supports from the states. However, policy interventions were typically much less intense and financial supports substantially lower than under the SIG program. Figure 1 summarizes the changes that occurred after the SIG intervention ended by location.
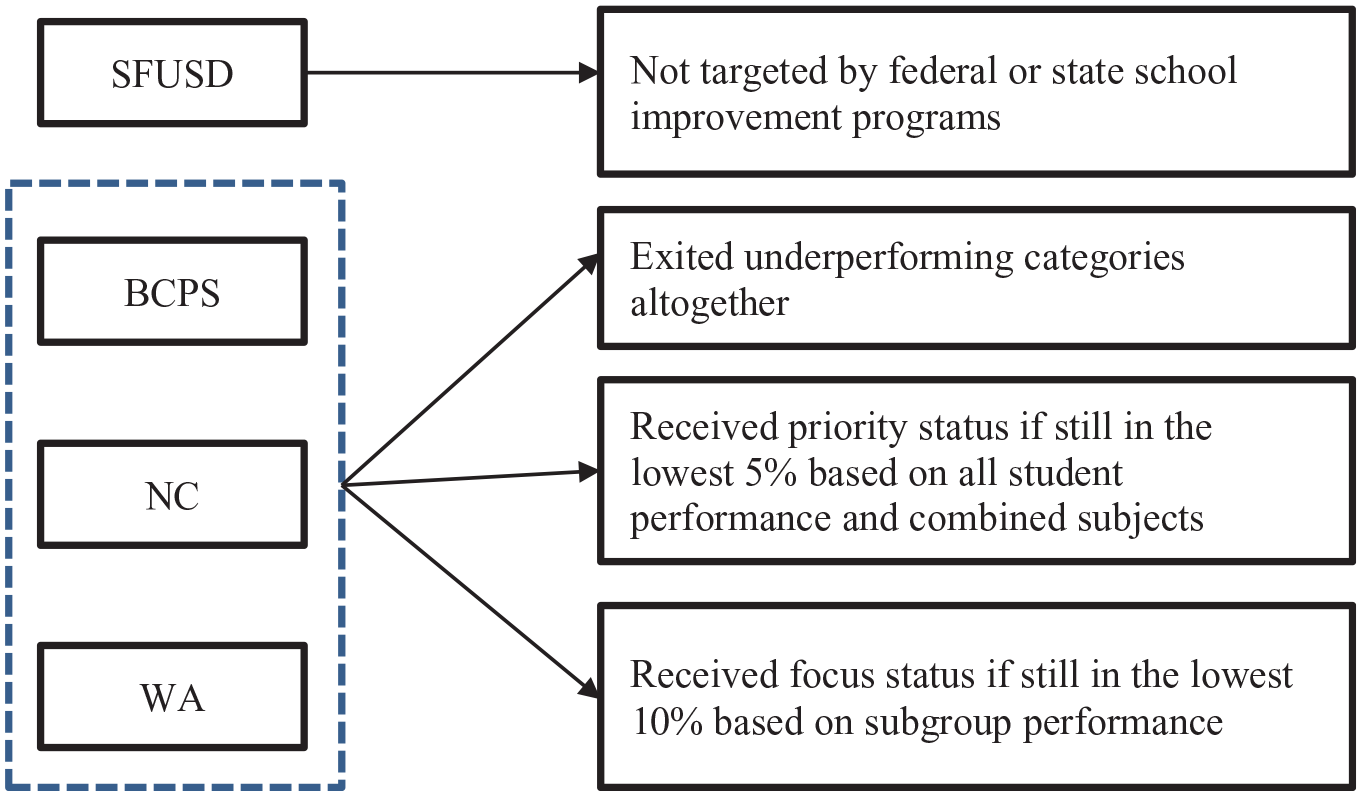
Changes in interventions for SIG schools in post-SIG years.
Literature Review
The extant research evidence, summarized in Supplementary Table A1 in the online version of the journal, shows mixed effects of SIGs and similar interventions across locations. Early research on SIGs examined its first-year impacts and found mixed results (Dee, 2012; Dickey-Griffith, 2013). For example, Dee (2012) used a fuzzy regression discontinuity (RD) design and found significant improvements in posttreatment performance in California schools whose baseline proficiency rate just met the lowest achieving threshold. Dickey-Griffith (2013), meanwhile, used a DID approach to assess 1-year effects in Texas and found mixed results, including negative effects on student achievement in elementary and middle school but positive effects on high school graduation rates.
More recent work has examined the effects of SIGs beyond the first year. Our study in SFUSD (Sun et al., 2017) showed a pronounced positive effect of Cohort 1 SIG interventions on student achievement in the third year. Similar positive effects emerged in the first year of reform and grew through the fourth year in Massachusetts (Papay & Hannon, 2018). Nineteen SIG schools (including both Cohorts 1 and 2) in Colorado showed positive effects in math and ELA (Colorado Department of Education, 2015). A study of SIG schools in Ohio estimated positive effects of approximately 0.24 standard deviations on achievement and 7 to 9 percentage points on high school graduation rates (Carlson & Lavertu, 2018). In contrast, a study commissioned by the U.S. Department of Education using data from 22 states did not find positive effects on test scores, high school graduation, or college enrollment for Cohort 1 SIG schools, although the estimates were not precise enough to rule out the positive effects shown in other studies (Dragoset et al., 2017).
Several studies have examined improvement trends over time and revealed patterns of gradual rather than sudden gains. These studies—in Colorado, Massachusetts, Ohio, San Francisco, and Tennessee—show that improvement tended to be greater in Year 2 than in Year 1. While San Francisco and Massachusetts showed better outcomes in Year 3 than in Year 2, the achievement levels were not substantially better in Year 3 than in Year 2 in Colorado, Ohio, and Tennessee.
Some prior studies have compared the differences in effects between turnaround schools and transformation schools. Most of these studies provide evidence that the turnaround model is more effective than the transformation model (Carlson & Lavertu, 2018; Dee, 2012; Dragoset et al., 2017; Sun et al., 2017), although a study in New Jersey found that the transformation model was more effective than the turnaround model (Kyse et al., 2014).
Studies of programs with similar reform strategies, such as those funded through the Race to the Top and NCLB waivers, have found mixed results across locations and over time. The Turning Around Lowest-Achieving Schools (TALAS) program, funded through Race to the Top in NC, was found to have modest positive effects in some grades (Henry & Guthrie, 2019) but mostly null or negative effects (Heissel & Ladd, 2018). Pham and his colleagues (2019) found positive effects in Tennessee among Innovation Zone schools that were governed and managed separately by intradistrict networks. Two companion studies in Louisiana and Kentucky produced divergent findings of statewide turnaround efforts under NCLB waivers: The Louisiana analysis showed that, over each of 3 years, focus school reforms had no measurable impact on school performance (Dee & Dizon-Ross, 2019), whereas the Kentucky study found that focus school reforms led to substantial improvements in math and reading achievement (Bonilla & Dee, 2017).
Besides federal programs, several large urban districts have embedded similar types of dramatic school transformations within other local reform efforts. The findings on these, too, are mixed. For example, the Los Angeles Unified School District’s Public School Choice Initiative had inconsistent effects on student achievement across three rounds of school turnarounds (Strunk et al., 2016). On the contrary, research on New Orleans’s portfolio district reforms found positive effects on student achievement (Harris & Larsen, 2018; McEachin et al., 2016), and a study of Massachusetts’s Lawrence Public Schools in the first 2 years of reform showed similar positive gains in math and reading (Schueler et al., 2017).
Overall, some school turnaround programs have produced positive results for students, whereas others have not. The findings point to four gaps in the literature. First, there is an open question regarding whether some of the variation in findings is due to the timing of the research relative to program implementation and whether the effects of the programs were sustained after implementation. Prior studies have demonstrated a gradually emerging effect of SIGs during the three reform years, but little research to date has assessed whether the effects were sustained beyond the reform years, particularly when the substantial financial support and intense public accountability subsided. In this study, we trace the effects after the SIG funding ended. Second, the extent to which the variation in the findings can be explained by estimation strategies is unclear (e.g., Henry & Guthrie, 2016). For the current study, we used a consistent estimation approach over time and across sites to distinguish variation in effects from variation in estimation methods. Third, research has not determined whether the variation in findings stems from variation in reform design and implementation across schools, districts, and states. While SIGs were more prescriptive than most policies, some design choices still varied across sites. Attending to this location variation, our study pools data across diverse regions in the country and assesses both the aggregated effects and separate effects in each location. Finally, policymakers have little evidence of which groups of students benefit most from these comprehensive school reforms (CSRs). This study provides evidence on the heterogeneity of effects across locations to help answer this question.
Data and Sample
We estimated the effects of SIGs on student achievement and graduation rates in the first two SIG cohorts across four locations: SFUSD, BCPS, NC, and WA. We removed schools in later SIG cohorts (Cohorts 3 and 4 were offered in WA and NC, respectively), which include two Cohort 1 schools in WA. We focused on schools that adopted transformation or turnaround models, as we could not follow schools that closed, and few schools were taken over by a charter or education management organization. The sample includes 66 Cohort 1 schools that were awarded funding starting in the 2010–2011 school year: 23 in NC, 15 in WA, 19 in BCPS, and 9 in SFUSD. It also includes 33 Cohort 2 schools that were awarded funding in the next year (2011–2012): 17 in NC, 10 in WA, and 6 in BCPS (there were no Cohort 2 schools in SFUSD).
We drew on state and district administrative data sets on schools’ student characteristics, performance on state standardized tests in math and ELA, graduation rates, and school contexts. The data are longitudinal in nature and span a decade, from the 2007–2008 school year to the 2016–2017 school year, or from 3 years before the start of Cohort 1 SIGs to 3 or 4 years after the SIGs ended. 3 We collected graduation rate data from publicly available sources (state or district websites) and matched them to our administrative data files. To measure students’ SES, we linked our data to the U.S. Census’s American Community Survey data files using students’ geocoded addresses; this enabled us to obtain the 5-year characteristics of the neighborhoods where the students lived. Using a principal component factor analysis, we derived a composite factor score across the following neighborhood characteristics: the log of median household income, the percentage of residents aged 25 or older with a bachelor’s degree or higher, the percentage of residents aged 18 or below living below the poverty threshold, and the log of median housing value (owner-occupied). We defined the bottom 20% of the composite score as low SES.
Table 1 provides descriptive statistics of baseline student and school attributes during the 3-year prereform period. SIG and non-SIG schools differed significantly on almost all observed pretreatment characteristics both for the pooled sample and within each location. SIG schools served students who were lower achieving, had lower graduation rates, and were more likely to be people of color, English language learners, and in special education programs.
Pre-SIG School Characteristics for Analytical Sample by Location
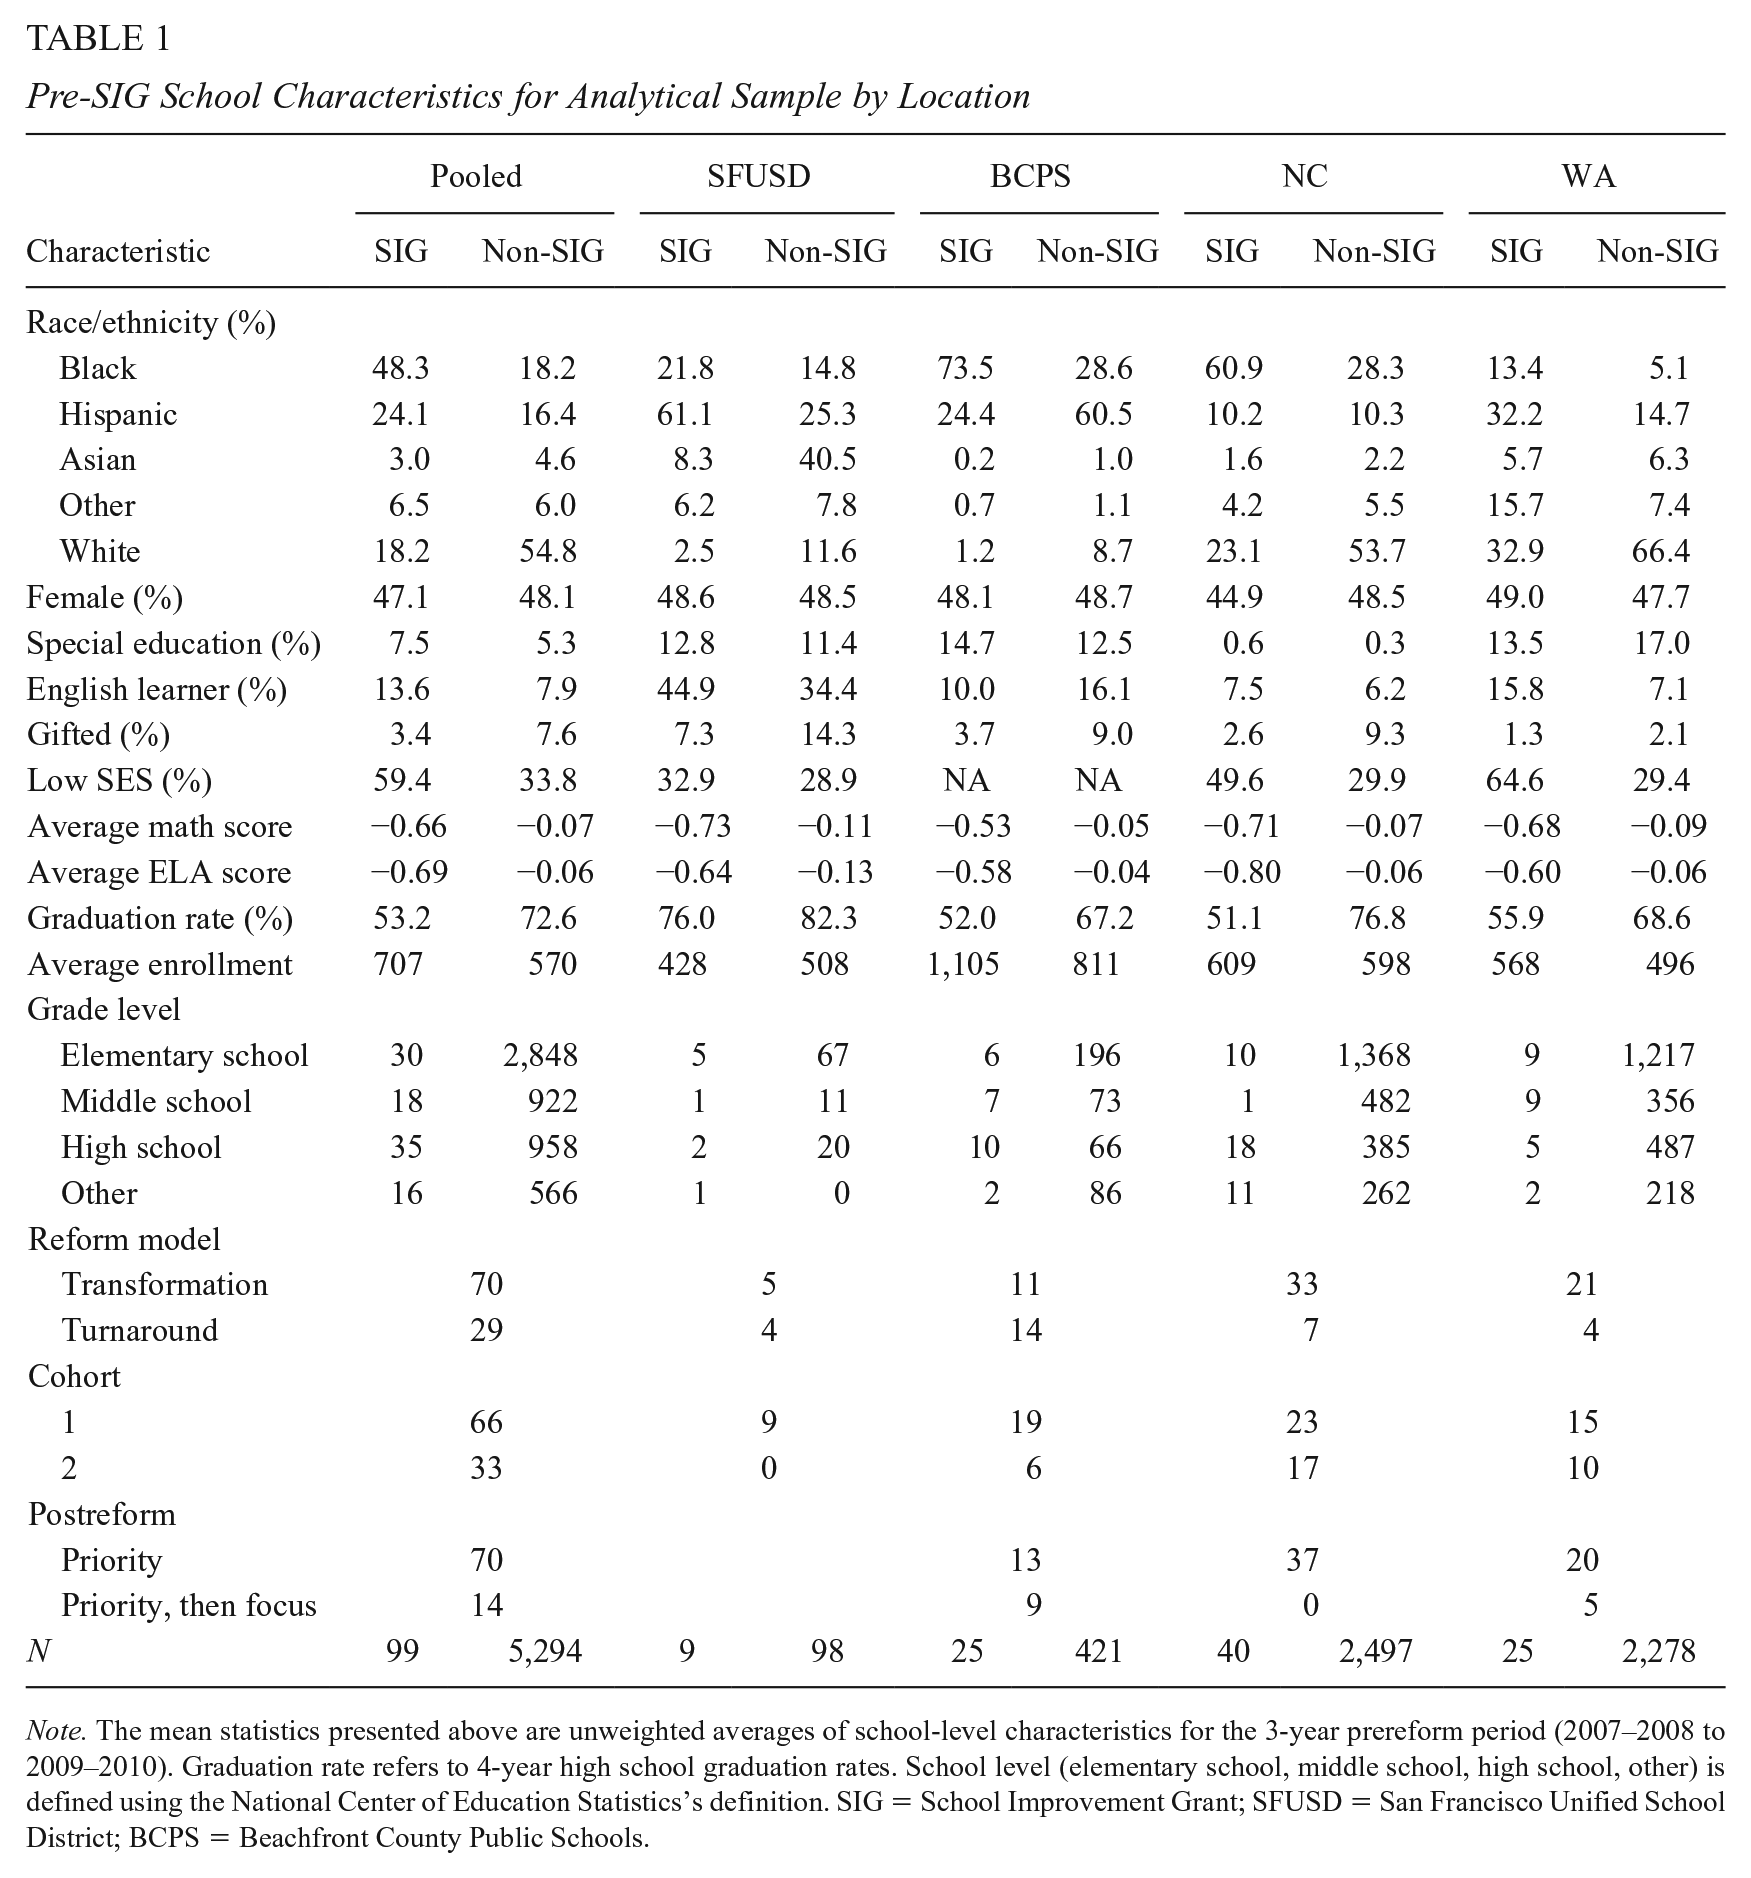
Note. The mean statistics presented above are unweighted averages of school-level characteristics for the 3-year prereform period (2007–2008 to 2009–2010). Graduation rate refers to 4-year high school graduation rates. School level (elementary school, middle school, high school, other) is defined using the National Center of Education Statistics’s definition. SIG = School Improvement Grant; SFUSD = San Francisco Unified School District; BCPS = Beachfront County Public Schools.
Analytic Strategies
We used an event study model, also known as a Granger-style DID model, to examine the dynamic nature of SIGs’ treatment effects during and after the grant years (Angrist & Pischke, 2008; Autor, 2003; Sun et al., 2017). This approach essentially tests whether treatment schools had higher performance (e.g., higher test scores or graduation rates) during or after the intervention compared with nontreatment schools, relative to prereform differences between treatment and nontreatment schools, controlling for changes in their students’ demographic characteristics.
The analysis is conducted at the school-by-year level. The main benefit of a school-by-year analysis is the ability to follow a school even as cohorts of students move through it. This approach of using the school as the unit of analysis is consistent with the SIG program’s intent that almost all of the SIG funds were spent on the whole school turnaround efforts at school sites of these identified persistently lowest-performing schools to build their organizational capacity. This approach is also necessary for estimating the sustainable effects of SIGs, as the average elementary school student has at most 3 years of test scores, and as a result, even the youngest students would have left the school by the end of the analysis period. Equation 1 describes our base model specification.
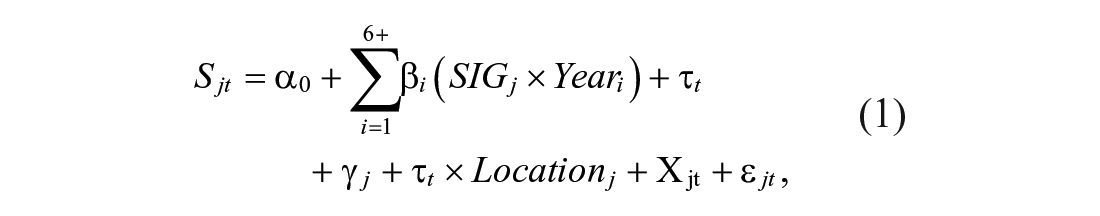
where Sjt is the math or ELA standardized test score (Grades 3–8) or the 4-year high school graduation rate for school j in year t. We standardized the scores for a given test, grade, location, and year to account for differences in tests across locales. Although the subscript for subjects is omitted, we performed the estimations separately for math, ELA, and graduation rates.
Our goal was to estimate the effects of SIGs on average achievement and graduation, net of location-wide and school-specific factors that may also have influenced changes in student outcomes. School fixed effects,
Time-varying school factors may also have influenced changes in student outcomes, even after controlling for school-specific and region-year-specific shocks. For example, students are not randomly assigned to schools, and student populations might have changed during the course of the SIG interventions. To address student selection bias, we included time-varying controls,
We also estimated potential differential effects of transformation and turnaround models
5
and for each cohort, respectively, by interacting SIG model type or SIG cohort with each of the
Finally, we conducted several robustness and sensitivity checks. Briefly, we first examined the parallel-trend assumption that trends in treatment schools would have been the same as those in nontreatment schools if they had not received the reforms. Second, we addressed the degree to which our estimations of SIG effects could be biased by policy changes that occurred at the same time as the SIG reforms and might have affected student outcomes. Third, we assessed the possibility that changes in student selection into SIG schools mask the true effects of SIG reforms on school quality. Entering cohorts of students during SIG years, for example, may have been higher or lower performing than in prereform years. We addressed this concern in part by controlling for time-varying student demographics, but these controls may not be sufficient. To understand whether the student body changed in SIG schools, we used a model similar to Equation 1 but with test scores of newly entering students prior to their enrollment at SIG schools as the dependent variables. If the prior performance of entering students changed during the SIG years, we would have reason to be concerned about the validity of the estimated effects, and we would be able to predict whether our estimates likely underestimate or overestimate the true effects of the program on schools.
Results
For each outcome measure, we present the results for the pooled sample along with the differential effects for transformation and turnaround schools and for each of the two cohorts. We then discuss the robustness and sensitivity of the estimates. Finally, we include results on SIGs’ effects for each location and for student subgroups.
Pooled Analysis of Grade 3 to 8 Student Achievement
As shown in Figure 2, SIG interventions significantly increased average student achievement in math and ELA in Grades 3 to 8 during the treatment years. Treatment effects were more pronounced in the second and third years of the intervention than in the first year in the pooled sample. Figure 2A and 2B shows that prior to the reform, the average math scores of SIG schools were considerably lower than the average math scores of non-SIG schools: scores at Cohort 1 schools were 0.5 standard deviations (SD) lower, and scores at Cohort 2 schools were 0.6 SD lower. Notably, the pretrends were nearly parallel for SIG and non-SIG schools. After fall 2010, in obvious contrast to the pretrends, mean math achievement increased much more quickly in SIG schools than in non-SIG schools. Gaps in average math achievement between SIG and non-SIG schools were the smallest in the third year of the intervention. Test score gains among SIG schools were mostly sustained in the first postreform year but began to decrease thereafter.
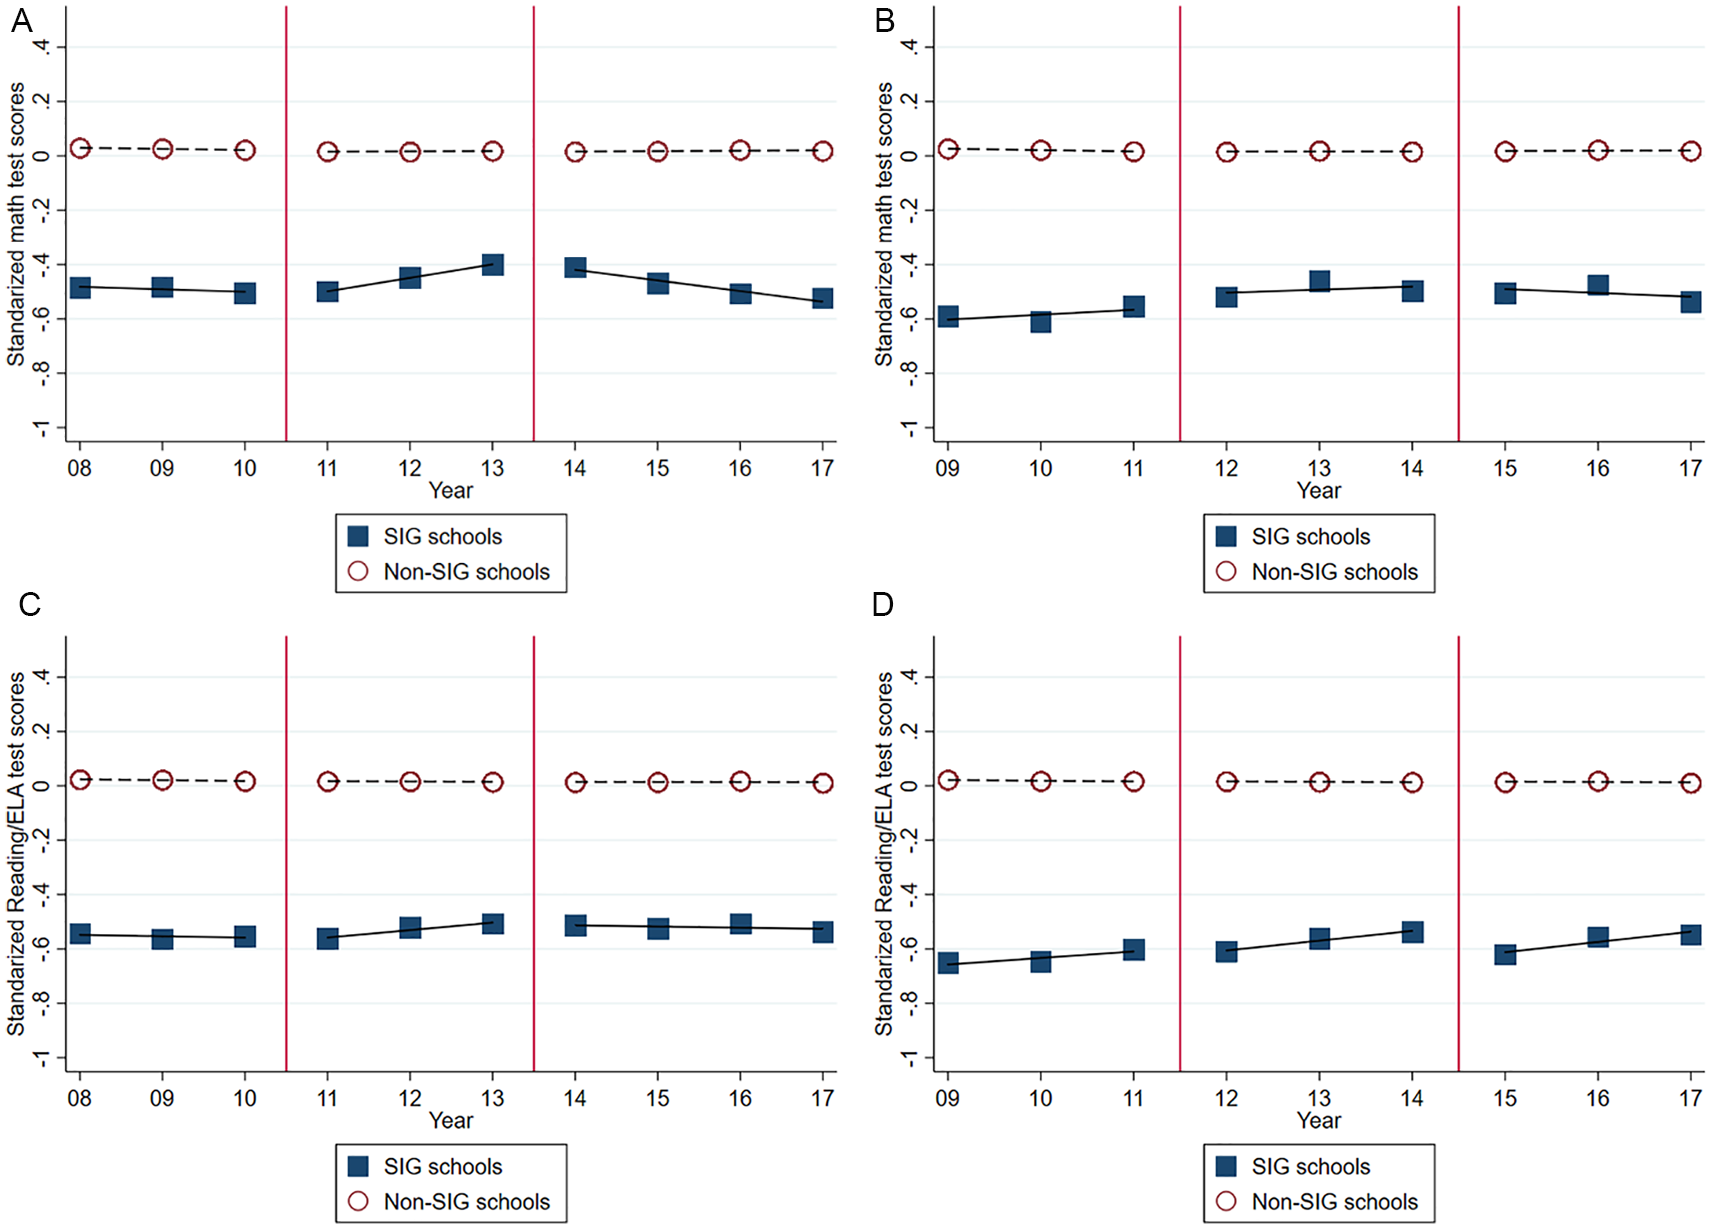
Trends in Grade 3 to 8 student achievement at SIG and non-SIG schools by cohort. (A) Cohort 1 math, (B) Cohort 2 math, (C) Cohort 1 ELA, (D) Cohort 1 ELA.
Table 2 shows the corresponding estimates from the dynamic DID modeling, which confirm the descriptive findings in Figure 2. The average effect of SIG reforms in math was about 0.12 SD in the first reform year and climbed to 0.23 SD in the third reform year. These estimates of gradually emerging effects align with the magnitudes and patterns shown in prior studies in Ohio and Massachusetts (Carlson & Lavertu, 2018; Papay & Hannon, 2018). After the program ended, SIGs’ effects started to fade; however, even 3 or 4 years after the end of the program, the effects in math were still positive and statistically significant at 0.12 standard deviations. Similar patterns are evident in ELA, although the estimated effects for ELA are generally smaller than those for math: 0.04 SD in the first reform year, 0.12 SD in the third reform year, and 0.11 SD in the third or fourth year postreform.
Estimated Longitudinal Effects of SIGs on Grade 3 to 8 Student Achievement
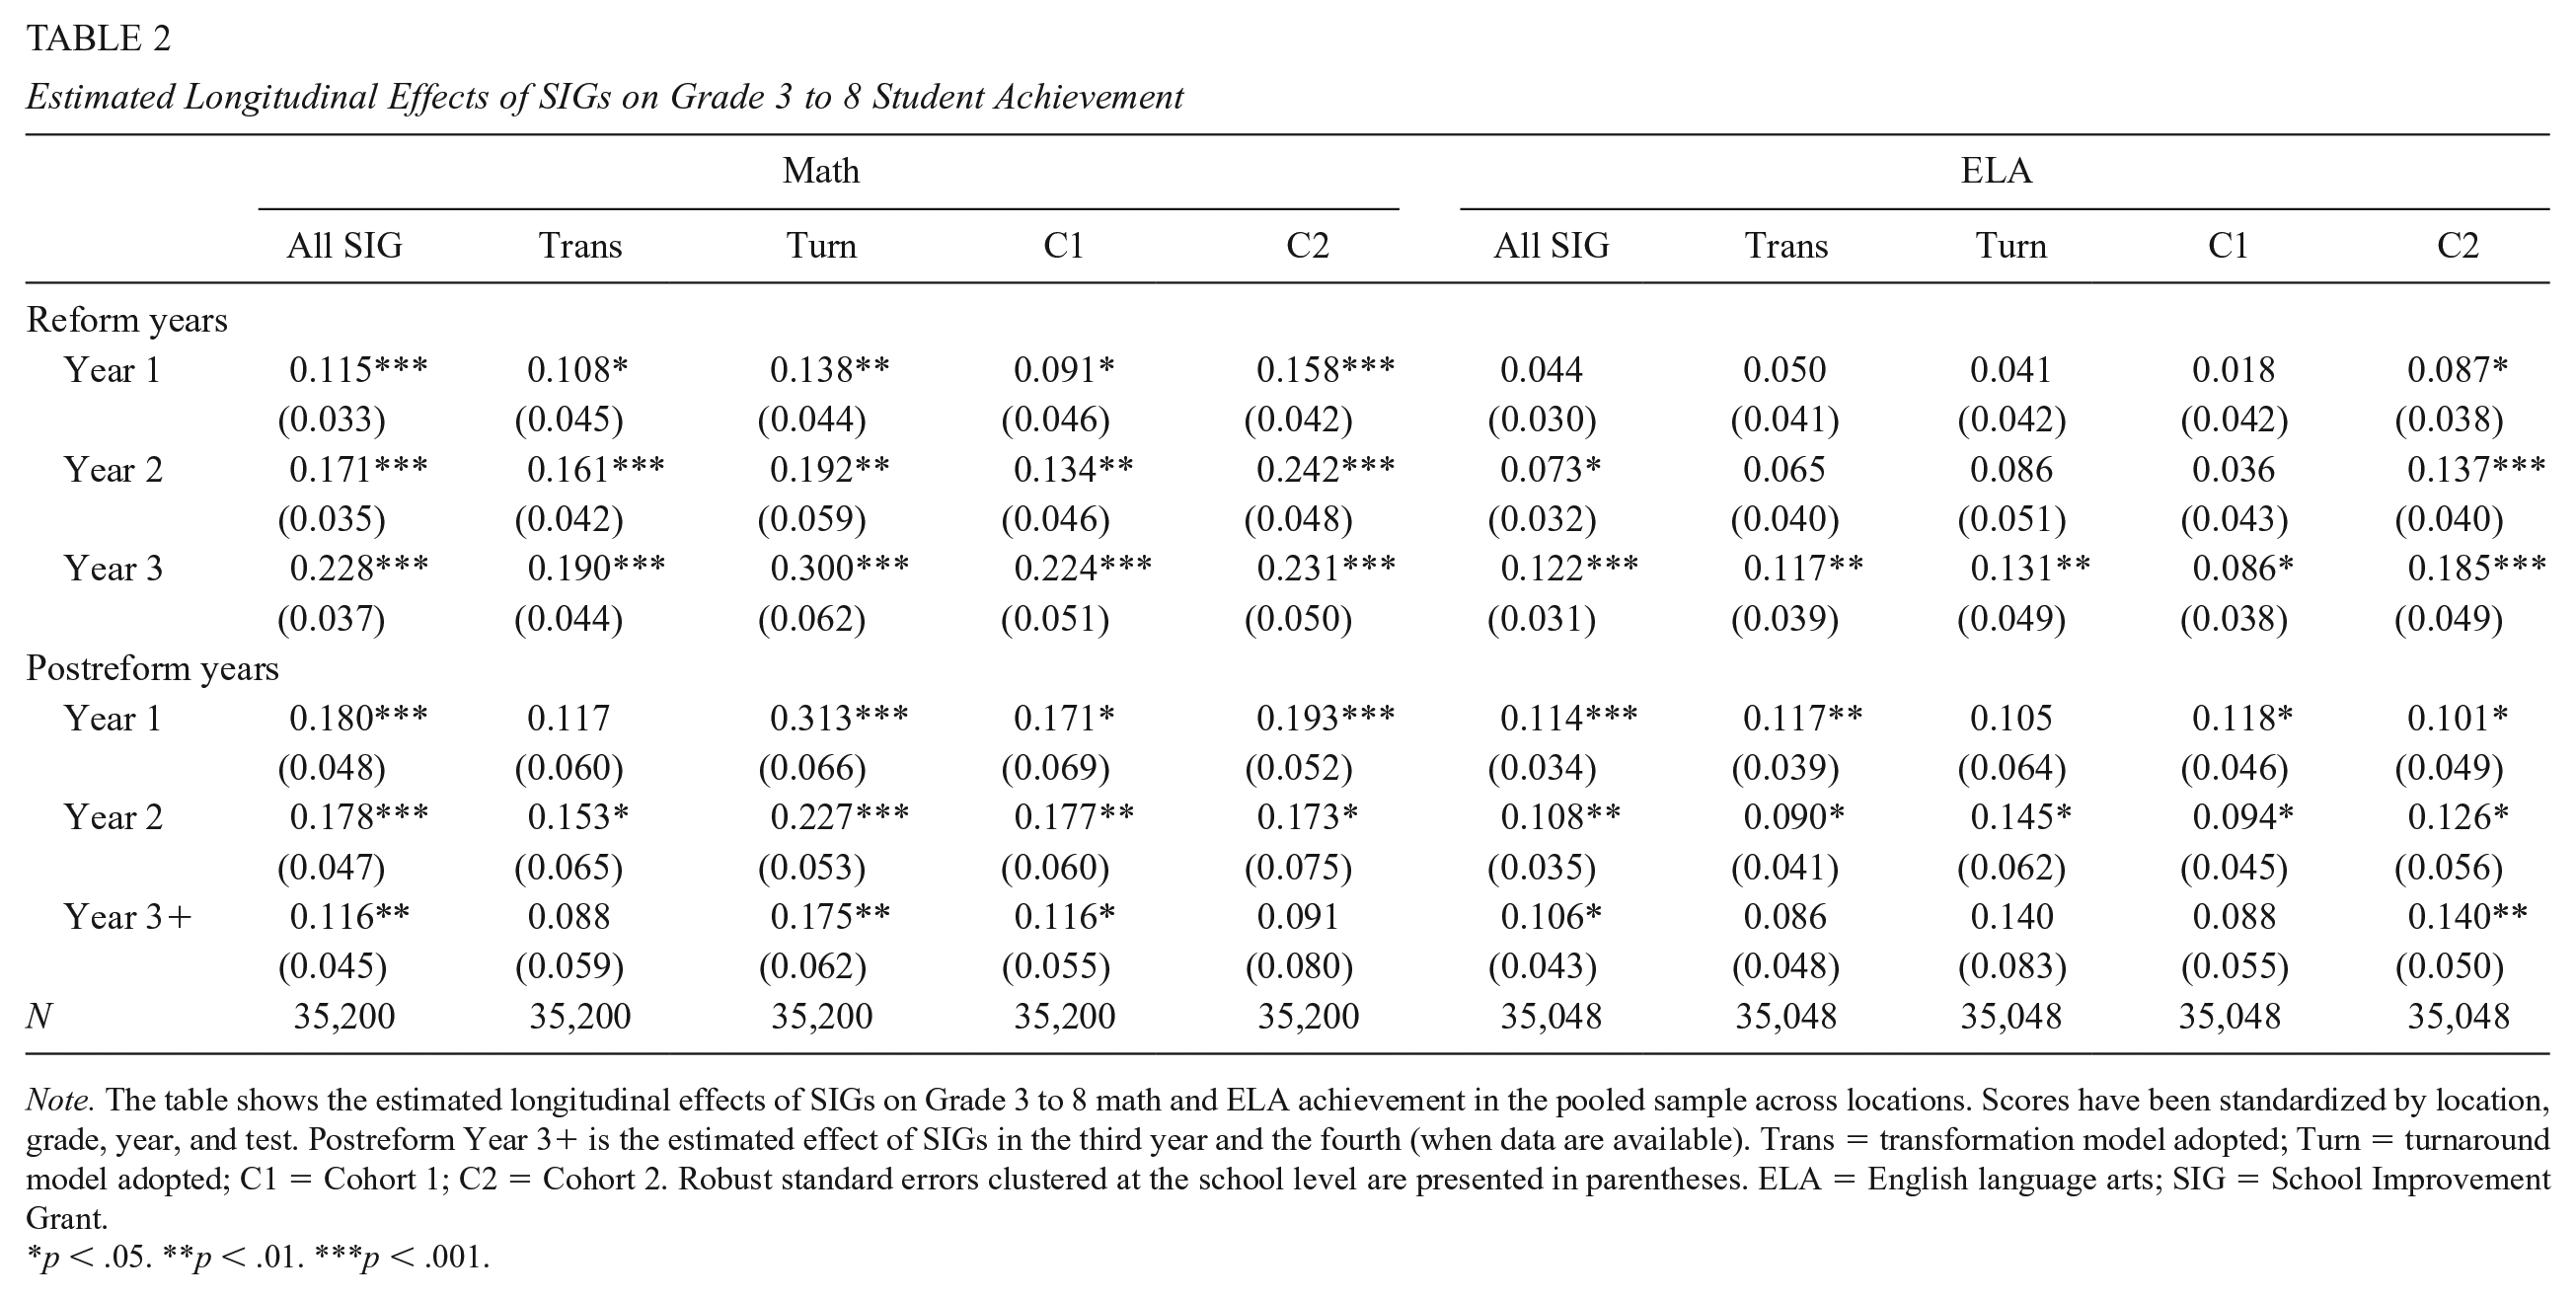
Note. The table shows the estimated longitudinal effects of SIGs on Grade 3 to 8 math and ELA achievement in the pooled sample across locations. Scores have been standardized by location, grade, year, and test. Postreform Year 3+ is the estimated effect of SIGs in the third year and the fourth (when data are available). Trans = transformation model adopted; Turn = turnaround model adopted; C1 = Cohort 1; C2 = Cohort 2. Robust standard errors clustered at the school level are presented in parentheses. ELA = English language arts; SIG = School Improvement Grant.
p < .05. **p < .01. ***p < .001.
Although transformation and turnaround schools adopted many similar interventions, turnaround schools replaced leaders and staff, potentially resulting in different treatment effects. As shown in “Trans” and “Turn” (abbreviations for Transformation and Turnaround models, respectively) columns in Table 2, turnaround schools had somewhat larger effects than did transformation schools across all years in math, although the differences were often not statistically different from zero. 6 For example, in the first reform year, the estimated average effect in math was 0.11 SD in transformation schools and 0.14 SD in turnaround schools. Similarly, in the third reform year, the estimated average effect was 0.19 SD in transformation schools and 0.30 SD in turnaround schools. One year after treatment, transformation schools had an estimated average effect of 0.12, a decrease from the third year of treatment, and turnaround schools had an estimated effect of 0.31, approximately the same level of gain as the third year of the treatment. Three or four years postreform, SIG effects were more sustained in turnaround schools (0.18) than in transformation schools. The patterns for ELA are not as consistent, although the majority of point estimates for turnaround schools were greater than those for transformation schools. These differences are not statistically significant. The slightly more pronounced effects for turnaround schools are consistent with previous evidence from California and Ohio (Carlson & Lavertu, 2018; Dee, 2012; Dragoset et al., 2017; Sun et al., 2017).
In terms of differential effects between cohorts, Cohort 2 SIG schools had somewhat larger effects in ELA than Cohort 1 schools did across all years, though again, most of the differences are not statistically significant. This pattern may suggest organizational learning in which useful lessons from Cohort 1 schools were passed along with Cohort 2 schools. There are similar patterns favoring Cohort 2 in math in the short term (Years 1 and 2 of the reform), but the differences are not evident in the longer term.
Pooled Analysis of High School Graduation Rates
Figure 3 and Table 3 provide results for 4-year high school graduation rates. Descriptively, Figure 3 shows that in both cohorts, SIG schools had steeper gains relative to non-SIG schools during the reform years, and graduation rates in SIG schools increased more rapidly in the postreform years. 7 Table 3 shows that the estimated effect across schools is 6.23 percentage points in the first reform year, 10.76 percentage points in the third reform year, and 14.17 percentage points in the third or fourth year postreform. A possible explanation for this trend is that graduation rates capture delayed program effects that occurred when treated students moved through the school system. Another explanation may be that students in later years experienced more years of treatment.
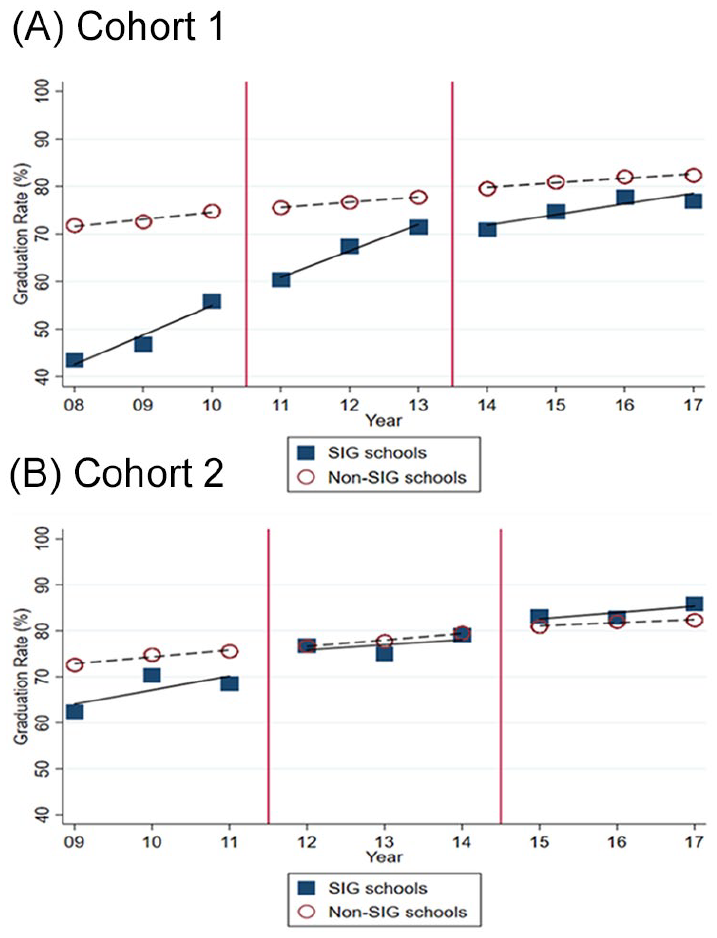
Trends in 4-year graduation rates at SIG and non-SIG high schools by cohort.
Estimated Longitudinal Effects of SIGs on 4-Year High School Graduation Rates
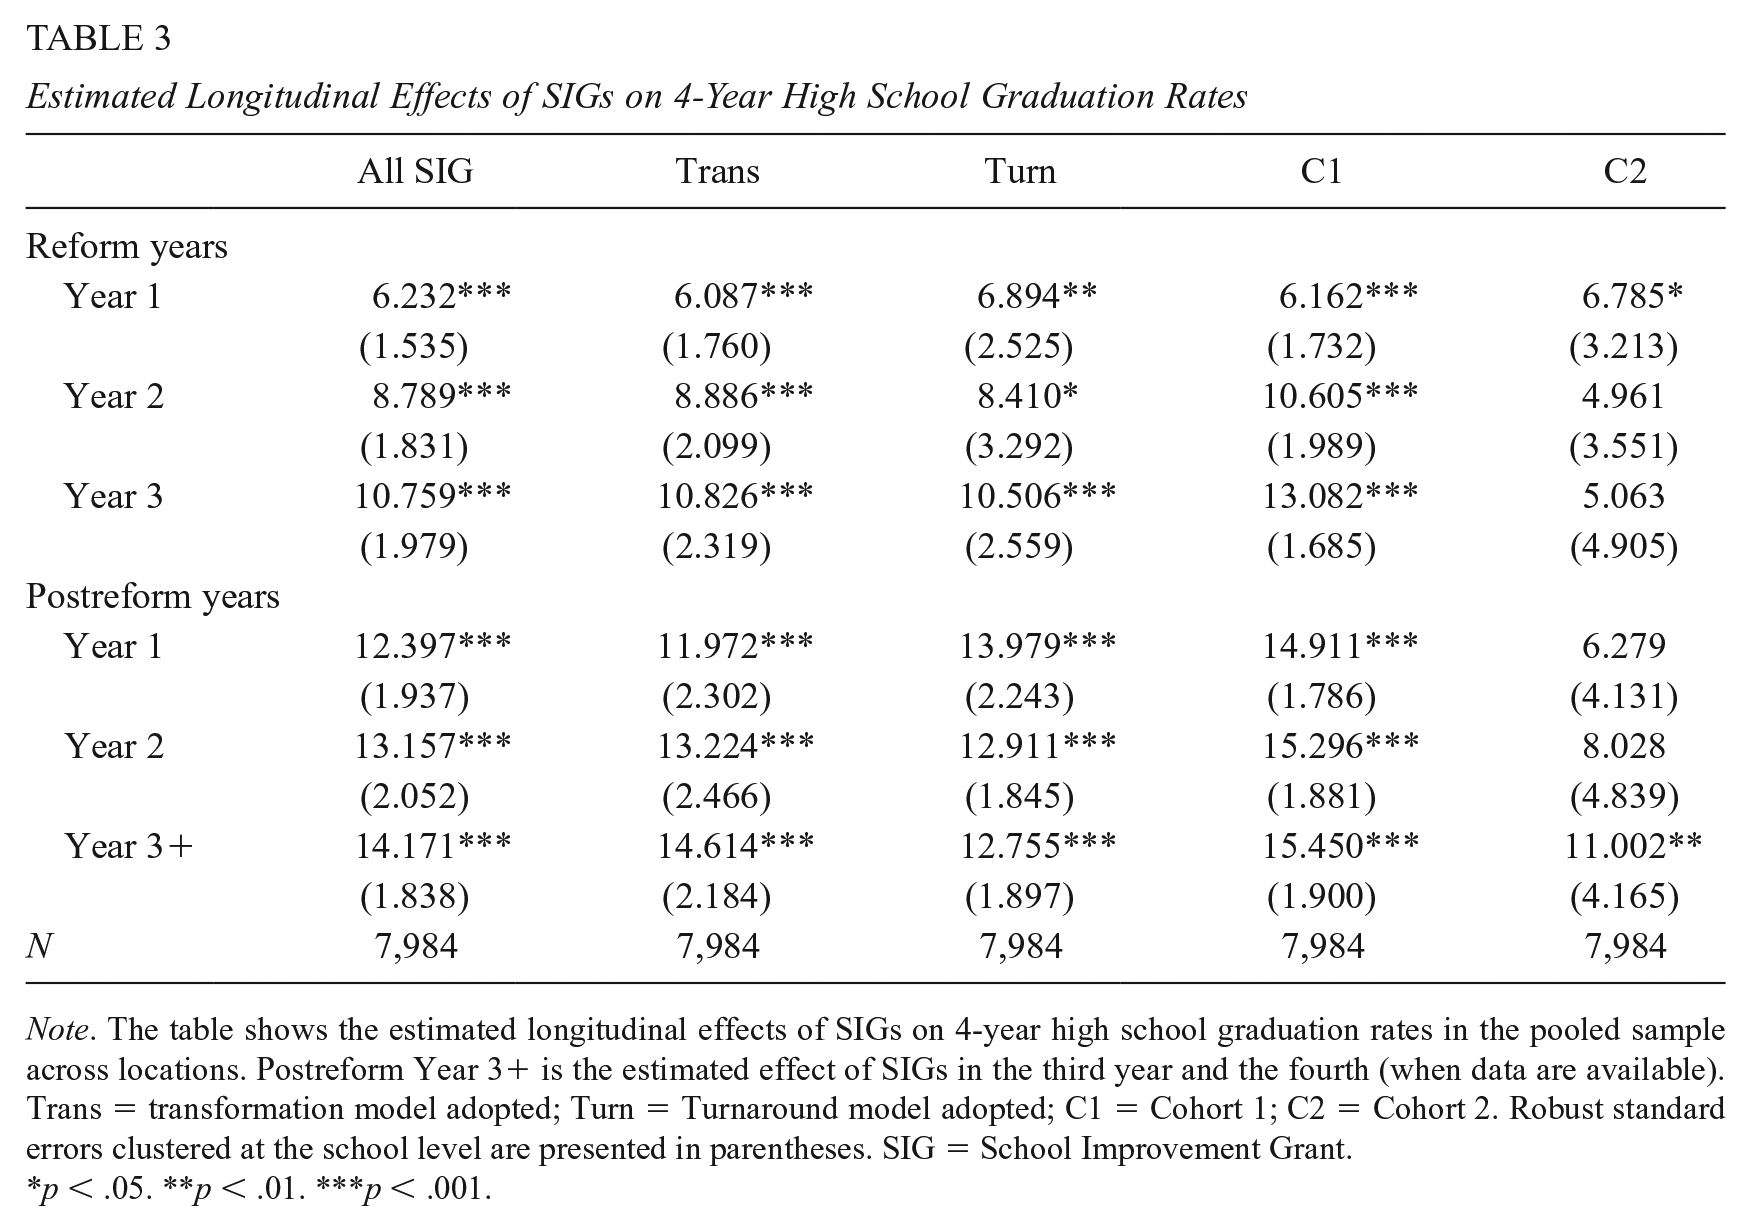
Note. The table shows the estimated longitudinal effects of SIGs on 4-year high school graduation rates in the pooled sample across locations. Postreform Year 3+ is the estimated effect of SIGs in the third year and the fourth (when data are available). Trans = transformation model adopted; Turn = Turnaround model adopted; C1 = Cohort 1; C2 = Cohort 2. Robust standard errors clustered at the school level are presented in parentheses. SIG = School Improvement Grant.
p < .05. **p < .01. ***p < .001.
While these results are suggestive, the potentially nonparallel pretrends among Cohort 1 schools, which we discuss in-depth below, call into question the causal interpretation of the observed trends. Cohort 2 schools have more parallel trends, and as a result, these estimates are more solid. As shown in Table 3, the estimated effect for Cohort 2 starts at 6.79 percentage points in the first year and then remains similar in magnitude but turns statistically insignificant in the following years. This pattern remains steady until the third or fourth year postreform, when the effect increases to approximately 11 percentage points.
The estimated effects on graduation rates are largely similar for transformation and turnaround schools. The effects are somewhat larger in Cohort 1 than in Cohort 2, although the differences are mostly not distinguishable from zero.
The Robustness of Estimated SIG Effects
A key assumption of the DID approach is that treatment and comparison schools would have had parallel trends if SIG had not been implemented, so trends in outcomes in comparison schools can serve as counterfactuals for trends in treatment schools in the treatment and posttreatment periods. A common way to examine this assumption is to conduct pretrend testing. As shown in Figure 1, the pretrends in achievement measures were almost parallel between SIG and non-SIG schools in the pooled samples. Estimates of prereform differences in Supplementary Table A2 (in the online version of the journal) are close to zero, providing further evidence of parallel trends in test scores. However, as shown in Figure 2 and Supplementary Table A3 (in the online version of the journal), graduation rates had a greater increase in SIG schools than in non-SIG schools prior to the intervention for Cohort 1 schools. The pretrends were more similar for Cohort 2 schools.
Recent literature has critiqued this pretrend testing approach for two reasons. First, statistically nonsignificant pretrend testing results do not always guarantee postintervention parallel trends without the treatment. If the treatment corresponded with other changes that could affect trends, parallel pretrends may not indicate bias-free estimates. Moreover, even if the pretrends differ, researchers and policymakers may be interested in learning something about the treatment effects (Rambachan & Roth, 2019). A useful alternative approach is to conduct sensitivity analyses to examine the extent to which treatment effect estimates are robust to methods that address possible differences in trends. We adopted two such methods to inform our interpretations of our findings.
First, a common approach when there is a concern about the potential violation of the parallel-trend assumption is to adjust for the extrapolation of a posttrend from the pretreatment period (e.g., Dobkin et al., 2018; Goodman-Bacon, 2018). After accounting for pretrend differences, the estimated effects of SIGs during and after the reform, shown in Supplementary Tables A2 and A3 in the online version of the journal, remain positive and are similar in magnitude to those in our main models in Tables 2 and 3.
A second common approach is to use propensity score matching to identify comparison schools based on SIG selection criteria that were near to being selected and most comparable with SIG schools. For each location, we matched schools using both prereform performance levels and trends from 2007–2008 to 2009–2010, as well as student demographics, grade span, and school contextual factors before and after the policy treatment. We used nearest-neighbor one-to-one propensity score matching without replacement. 8 We then reestimated the effects of SIGs by applying Equation 1 to the matched samples. As shown in Supplementary Table A4 in the online version of the journal, the estimated effects on achievement continue to be positive in both math and ELA. The estimates are somewhat smaller than those from our benchmark model, but the differences are neither substantial in magnitude nor statistically distinguishable from zero. The estimates for graduation rates are included in Supplementary Table A5 in the online version of the journal. Compared with the results in Table 3, the estimated effects for the full sample in Supplementary Table A5 in the online version of the journal are about 3 or 4 percentage points lower in each year. The effects for Cohort 2 are largely nonsignificant.
The results of these specification checks suggest the appropriate use of findings from benchmark DID modeling for the effects of SIGs on Grade 3 to 8 test scores and Cohort 2 graduation rates. Propensity score matching often generates less precise estimates due to the reduced sample size and may introduce more bias if the selected pretreatment measures do not track the counterfactual posttreatment patterns of outcome variables well. This matching method can also be prone to omitted variable bias (Betts et al., 2010). In contrast, the estimation that includes all non-SIG comparison schools generates more precise estimates and reduces the chance of bad matches by averaging out unusual year-to-year fluctuations in student outcomes in posttreatment years as the number of comparison schools increases (Betts et al., 2010).
Our second set of sensitivity analyses address synchronous policies or programs that occurred during the SIG period or after, and may serve as alternative explanations for the improved school performance. We conducted thorough inquiries to identify such policies and programs in each location by referring to the websites and press releases of federal, state, and local education agencies, seeking information from researchers who had conducted related studies in these locations, and calling state and district officials. For brevity, we highlight only one such program here.
Among the 90 SIG schools in NC, WA, and BCPS, only 15 had completely exited underperforming designations after their 3-year SIG interventions; the others were identified as either priority or focus schools. To examine the degree to which the sustained postreform effects may have been driven by post-SIG designations as priority or focus schools, we applied Equation 1 to a sample of schools (both SIG and non-SIG) that had either priority or focus designations in the postreform years. If postreform effects were primarily driven by continued support through priority and focus designations, this model should show near-zero postreform effects; SIG and non-SIG schools should have received the same treatment and thus should have improved similarly. As shown in Supplementary Tables A6 and A7 in the online version of the journal, the estimated post-SIG effects are very consistent with those in Tables 2 and 3, indicating that the effects were driven by SIG reforms and not by the priority or focus designations. Moreover, there were other concurrent programs in each location, such as TALAS in NC (Table A8) and the Local Control Funding Formula in SFUSD. Supplementary Table A9 in the online version of the journal summarizes concurrent event analyses by location. Overall, these identified programs appear to pose minimal threats.
Finally, we examined whether the identified effects could be driven by changes in entering cohorts of students. We used an approach similar to that in Equation 1 where the dependent variables are entering cohorts’ achievement prior to their enrollment in SIG schools. This approach estimates the extent to which SIG schools became more or less likely to attract academically prepared students during our period of study. As shown in Supplementary Table A10 in the online version of the journal, although some coefficients are significant, either positive or negative, most of the effects are indistinguishable from zero, and no common pattern emerges. These results add support for the conclusion that our estimated effects are not primarily driven by schools attracting academically better prepared students.
Heterogeneity in the Effects of SIGs
Variation by Location
As shown in Table 4, the patterns of achievement in Grades 3 to 8 shown in the pooled analysis largely apply to individual locations. In both math and ELA, gradual improvements are evident during the SIG reform years, and then a slow decrease occurs in the postreform years. The most salient variation is that SIG schools in WA showed the most sustainable effects in math after the grants ended.
Estimated Longitudinal Effects of SIGs on Grade 3 to 8 Student Achievement by Location
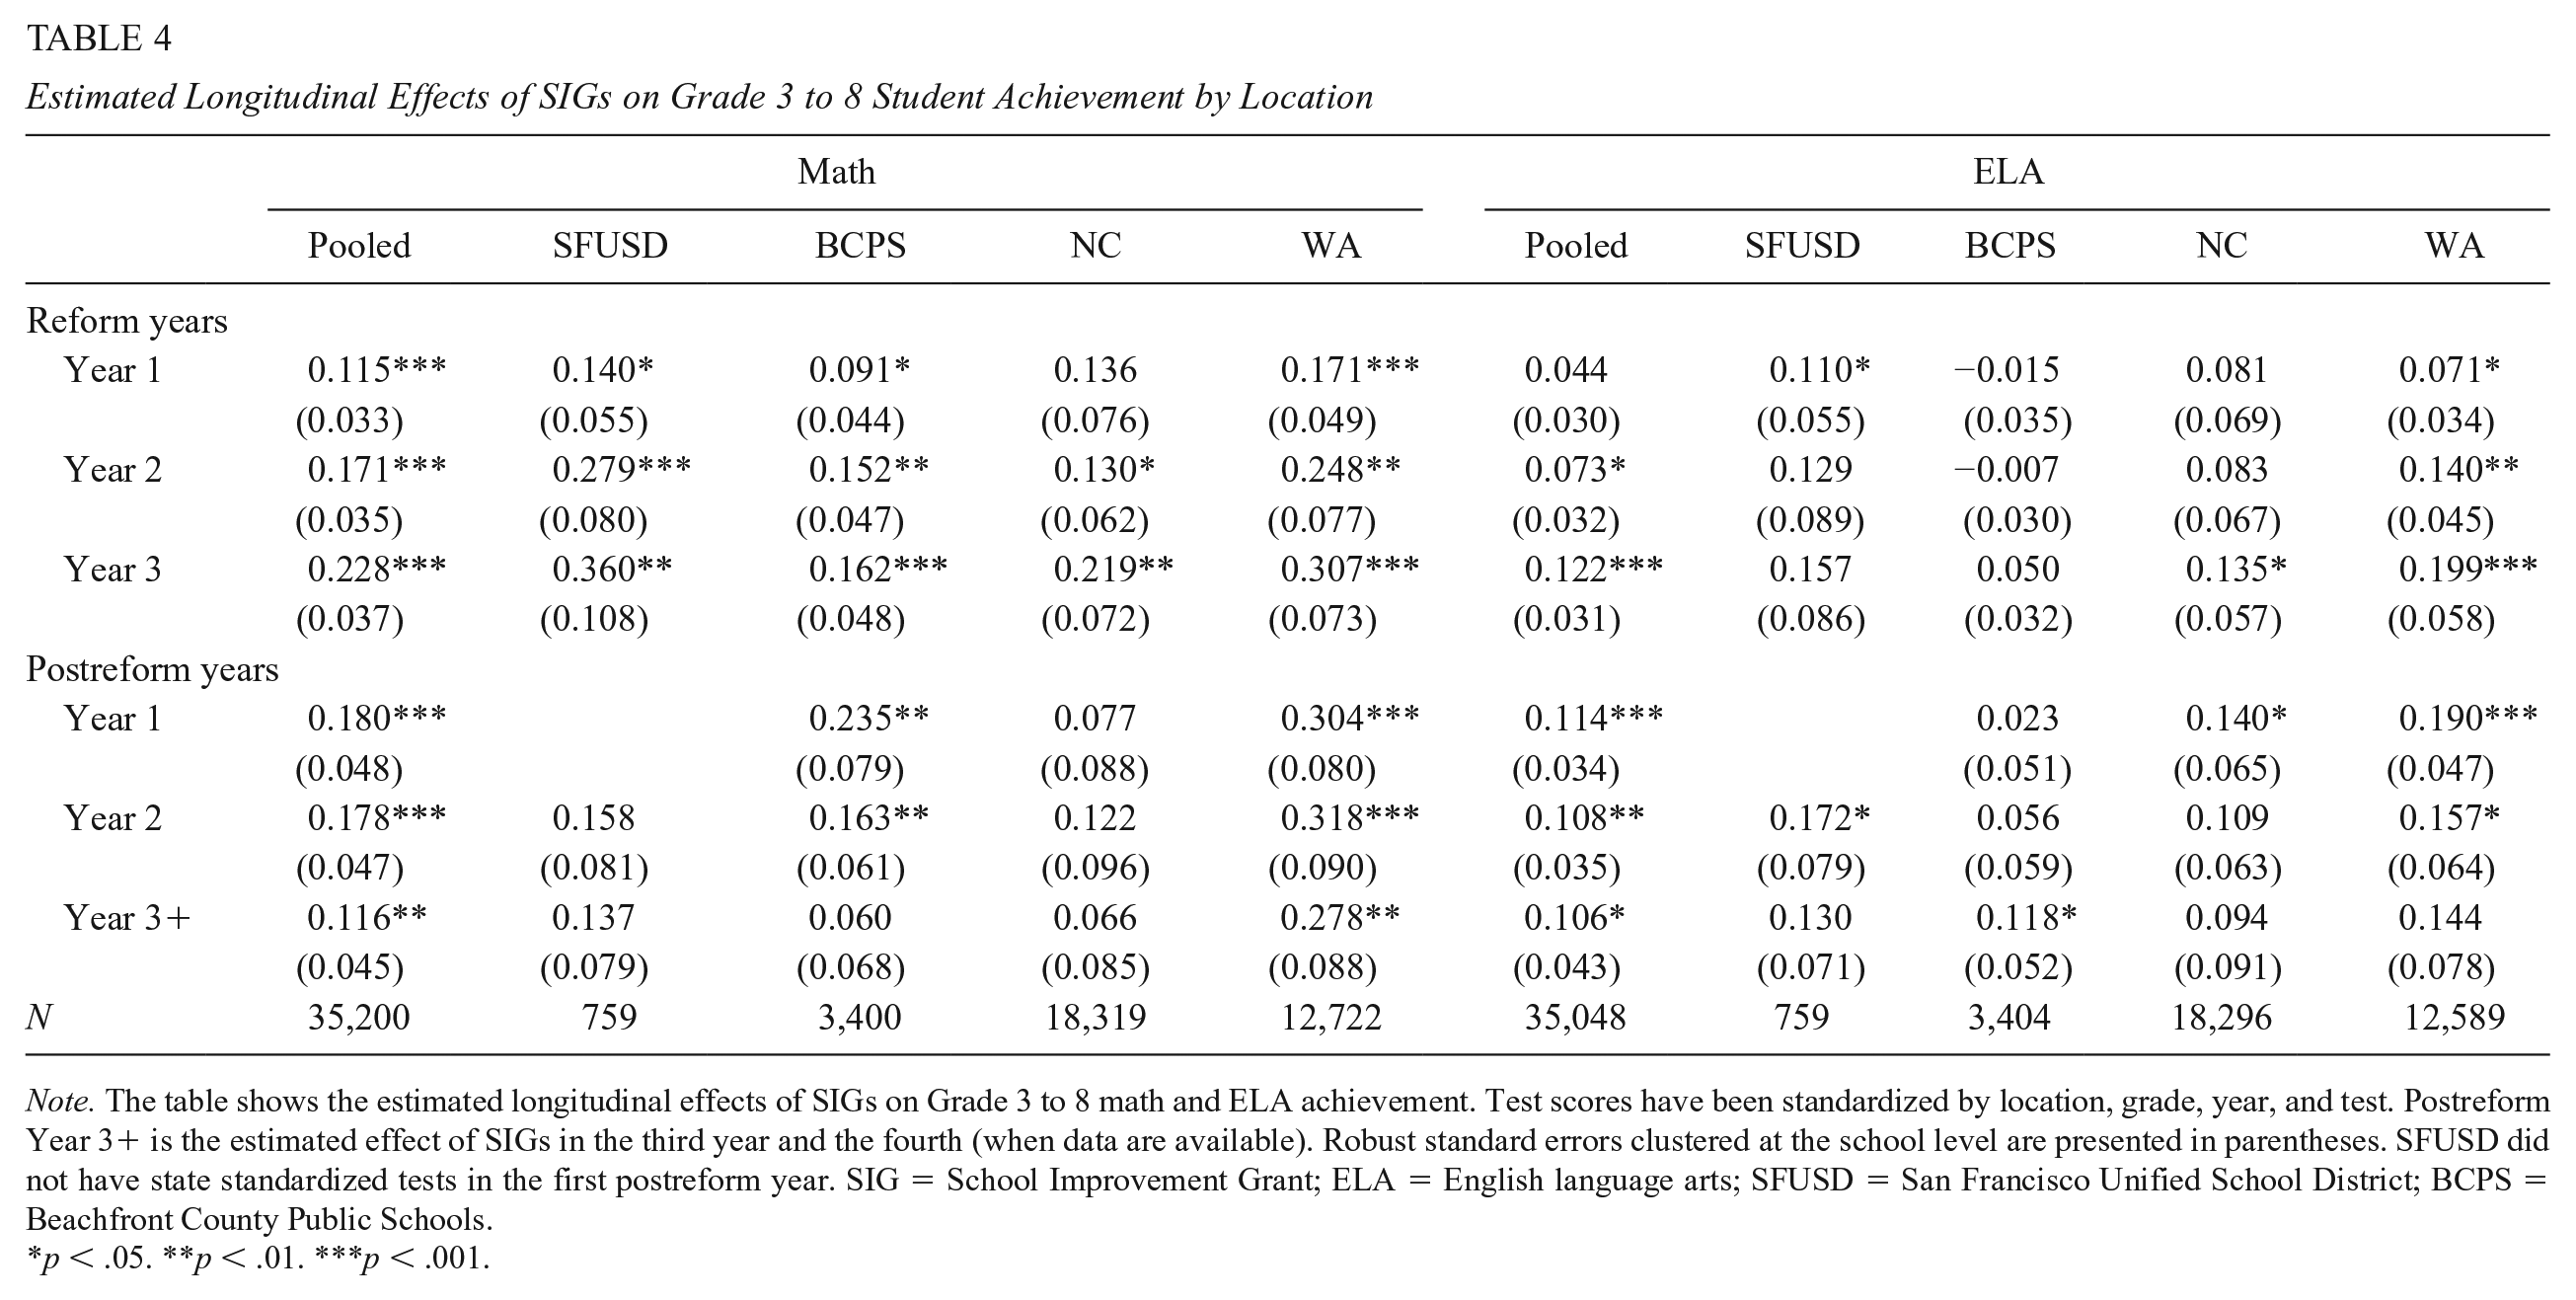
Note. The table shows the estimated longitudinal effects of SIGs on Grade 3 to 8 math and ELA achievement. Test scores have been standardized by location, grade, year, and test. Postreform Year 3+ is the estimated effect of SIGs in the third year and the fourth (when data are available). Robust standard errors clustered at the school level are presented in parentheses. SFUSD did not have state standardized tests in the first postreform year. SIG = School Improvement Grant; ELA = English language arts; SFUSD = San Francisco Unified School District; BCPS = Beachfront County Public Schools.
p < .05. **p < .01. ***p < .001.
Table 5 shows SIGs’ longitudinal effects on graduation rates across locations. WA had the largest gains in graduation rates that potentially can be attributed to SIGs, ranging from 16.6 percentage points in the first reform year to 29.9 percentage points in the third year postreform. In addition to the general caution based on pretrends, caution is warranted in interpreting the WA and SFUSD results because WA had only five SIG high schools and SFUSD had only two, so the estimates are imprecise.
Estimated Longitudinal Effects of SIGs on Four-Year Graduation Rate by Location
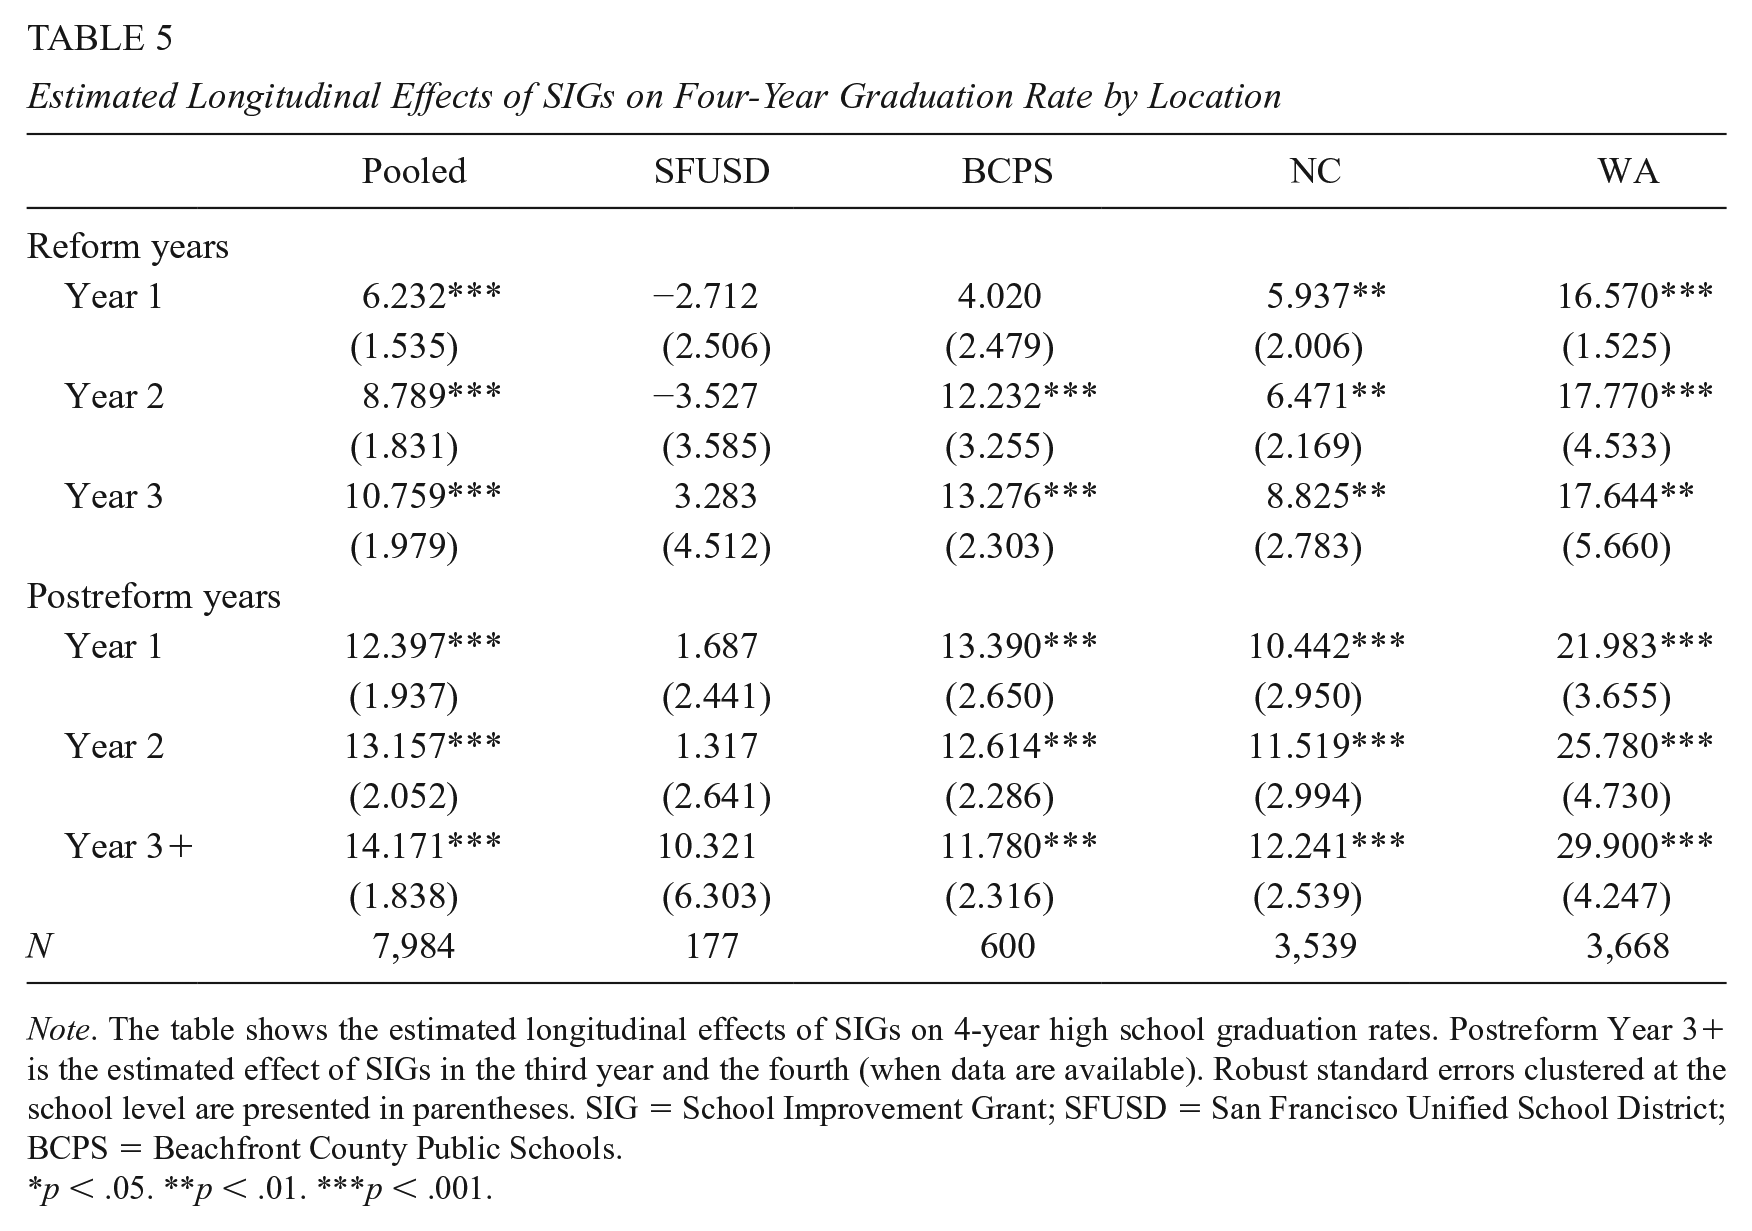
Note. The table shows the estimated longitudinal effects of SIGs on 4-year high school graduation rates. Postreform Year 3+ is the estimated effect of SIGs in the third year and the fourth (when data are available). Robust standard errors clustered at the school level are presented in parentheses. SIG = School Improvement Grant; SFUSD = San Francisco Unified School District; BCPS = Beachfront County Public Schools.
p < .05. **p < .01. ***p < .001.
Variation by Race/Ethnicity
We further examined SIGs’ effects for historically underserved students of color (non-White and non-Asian students). We analyzed outcomes for these subsets of students only in schools that had at least 20 of these students. As shown in Table 6, across all outcome measures, SIG program effects look larger for historically unserved students of color than for other students. Although most of these differential effects are not statistically significant, some are. The pattern is sustained through the postreform years.
Estimated Longitudinal Effects of SIGs for Underserved Students of Color
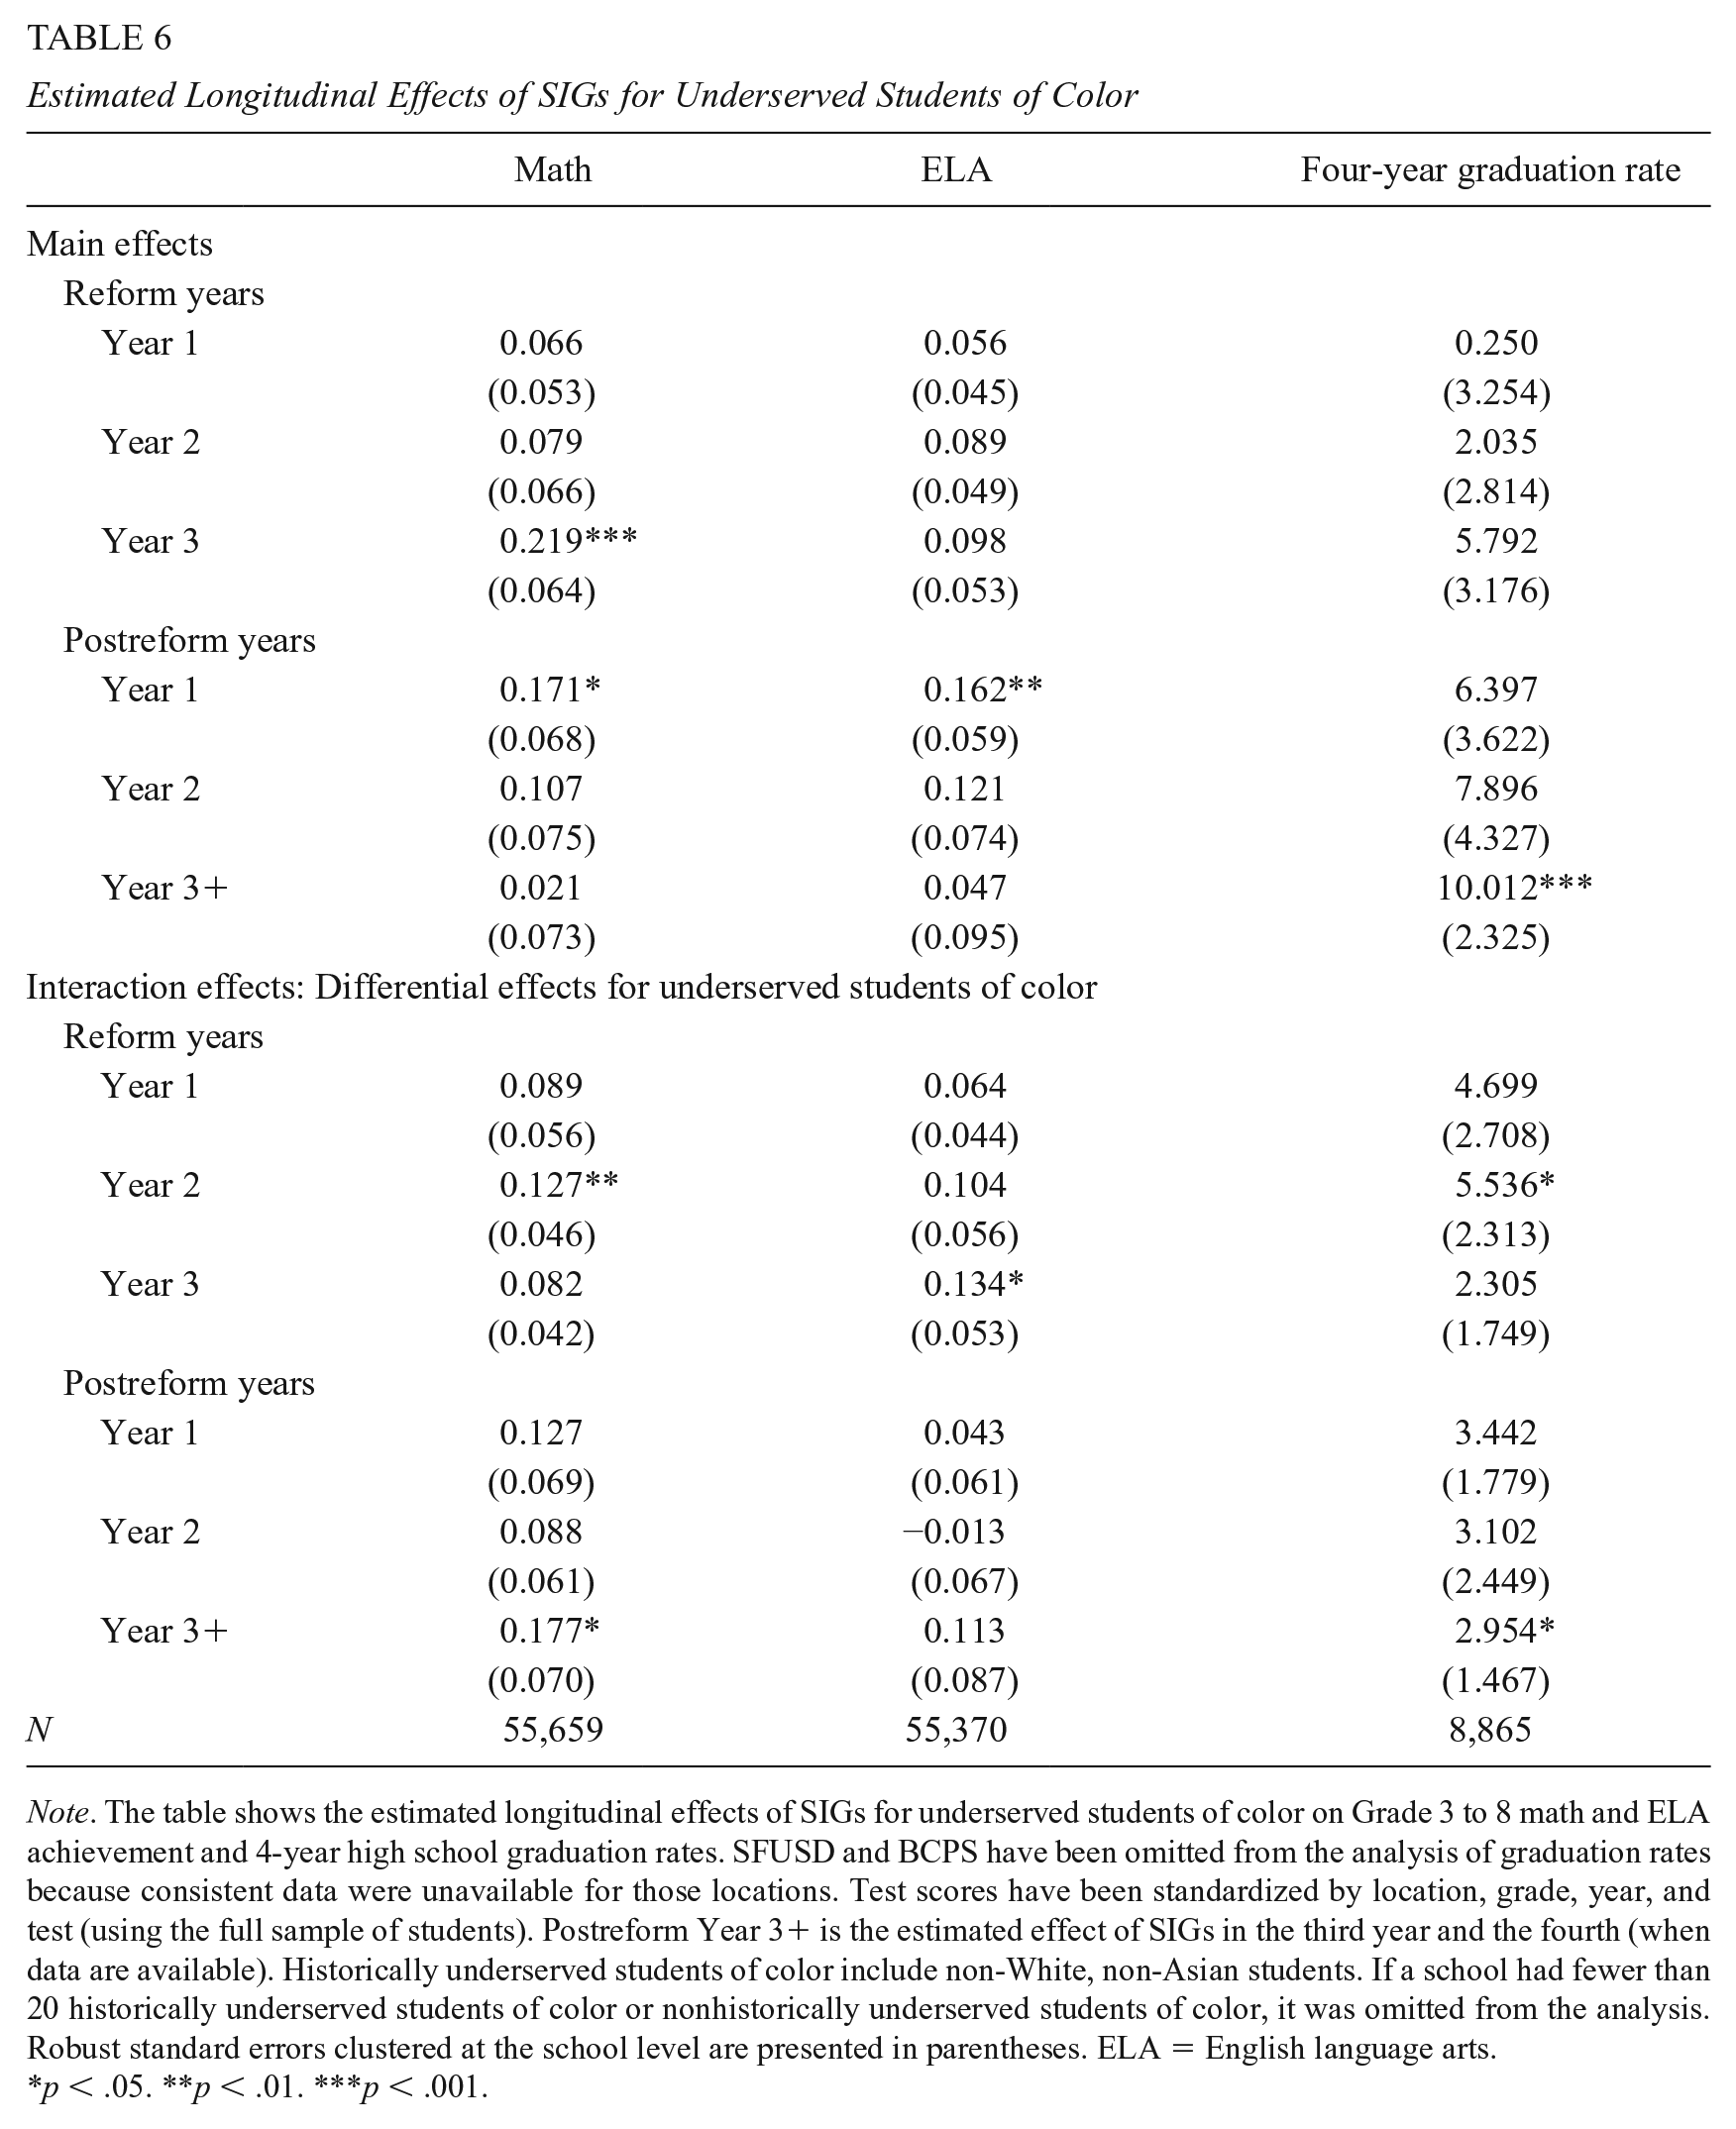
Note. The table shows the estimated longitudinal effects of SIGs for underserved students of color on Grade 3 to 8 math and ELA achievement and 4-year high school graduation rates. SFUSD and BCPS have been omitted from the analysis of graduation rates because consistent data were unavailable for those locations. Test scores have been standardized by location, grade, year, and test (using the full sample of students). Postreform Year 3+ is the estimated effect of SIGs in the third year and the fourth (when data are available). Historically underserved students of color include non-White, non-Asian students. If a school had fewer than 20 historically underserved students of color or nonhistorically underserved students of color, it was omitted from the analysis. Robust standard errors clustered at the school level are presented in parentheses. ELA = English language arts.
p < .05. **p < .01. ***p < .001.
Variation by SES
We analyzed the effects of SIGs separately for students from low-SES families. The majority of low-SES students were concentrated among a smaller number of schools. As a result, the sample size is smaller for this analysis. Table 7 shows that the effects for low-SES students are substantially larger during the early reform years but similar to the main effects in later years. We were not able to estimate separate effects on graduation rates for low-SES students because the public available data are not disaggregated by SES.
Estimated Longitudinal Effects of SIGs for Low-SES Students
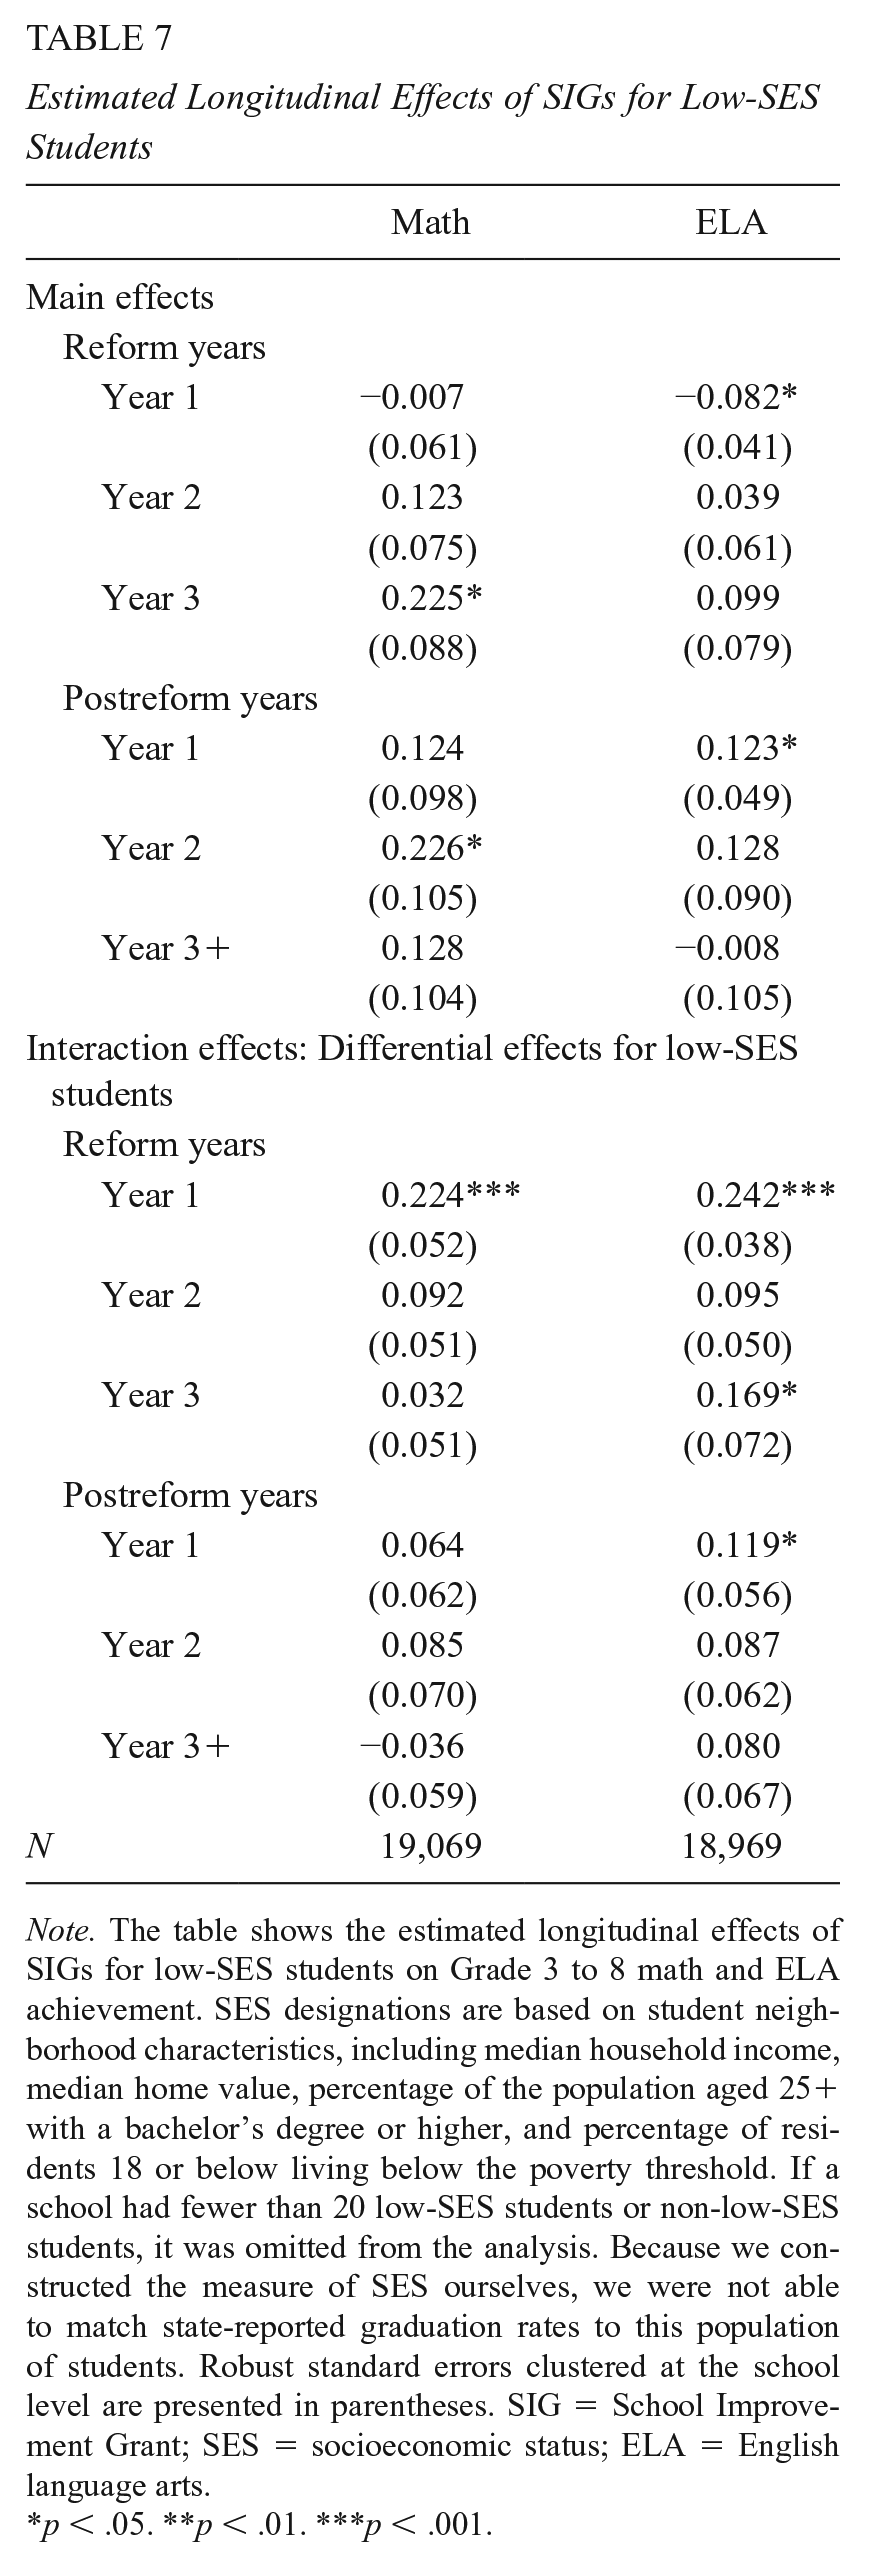
Note. The table shows the estimated longitudinal effects of SIGs for low-SES students on Grade 3 to 8 math and ELA achievement. SES designations are based on student neighborhood characteristics, including median household income, median home value, percentage of the population aged 25+ with a bachelor’s degree or higher, and percentage of residents 18 or below living below the poverty threshold. If a school had fewer than 20 low-SES students or non-low-SES students, it was omitted from the analysis. Because we constructed the measure of SES ourselves, we were not able to match state-reported graduation rates to this population of students. Robust standard errors clustered at the school level are presented in parentheses. SIG = School Improvement Grant; SES = socioeconomic status; ELA = English language arts.
p < .05. **p < .01. ***p < .001.
Discussion
SIGs provide an unprecedented opportunity for studying the extent to which government investments in building organizational capacity can pay off in the short term and the longer term. This study is the first, to our knowledge, to comprehensively estimate the longitudinal effects of SIGs on student achievement and graduation rates across multiple locations more than 7 years.
Although the SIG program ended under ESSA, the findings from this study are relevant as states and districts continue to work to improve their lowest achieving schools. Moreover, under ESSA, states are required to use evidence-based practices to transform underperforming schools, and many states plan to continue capacity-building approaches similar to SIGs, with some variations in program designs (Sun et al., 2019). Given that the aim of the SIG program was to spur dramatic change and build organizational capacity, understanding whether the effects of SIGs increased, remained steady, or declined over the longer term—particularly after the SIG funds ended—is central to understanding the advantages and disadvantages of this type of capacity-building policy. Given that prior studies show variation in SIG program implementation and effects across locations, it is valuable to examine the effects of SIGs in different regions of the country to assess both average effects and differential effects across locations.
The results provide some reasons for optimism regarding the SIG program’s effectiveness. We found positive, gradually increasing effects on test scores during the three reform years. This gradual emergence of effects echoes findings from earlier studies showing that capacity-building programs take time to yield impacts (Borman et al., 2003; Bryk et al., 2010; Sun et al., 2017). Schools need time to adopt new curricula, hire and train staff, and make changes to their organizational climate and culture. While the effects of SIGs diminished slightly after the program ended, the positive effects, particularly in turnaround schools and on math test scores, were sustained for at least 3 years after the program ended. Although our evidence on SIGs’ effects on 4-year high school graduation rates is less robust, the overall pattern of continuous improvement in high schools is encouraging. Moreover, the estimated effects for students of color and low-SES students are similar to or slightly larger than the estimated effects for all students. Targeted assistance to the persistently lowest-performing schools may be a critical policy lever for promoting equity in education.
Our estimates provide evidence that SIGs may have been more successful than many other government-driven programs designed to build organizational capacity to remedy underperformance in public schools. For example, the CSR program, originally funded in 1998 with US$145 million, was another significant capacity-building government initiative. This program later became part of NCLB, and Congress budgeted US$200–310 million per year for the program until 2015. Nearly 7,000 schools nationwide received 3-year awards to implement CSR models between 1998 and 2006 (Orland et al., 2010). Five years after initially receiving CSR awards, grantee schools did not demonstrate larger achievement growth in math or ELA than did nongrantee matched comparison schools (Orland et al., 2010). The CSR program included several features similar to those of the SIG program, such as evidence-based reforms, comprehensive design, professional development for school staff, measurable goals, parent and community involvement, and external assistance. The null effects of CSR were largely attributable to the low-level implementation of designed program. Compared with SIG schools, CSR schools received lower funds per year, and they were not required to undertake staff changes (e.g., replacing principals and 50% of staff members) or tie personnel decisions to student performance growth.
Similarly, under NCLB, states were required to improve underperforming schools with both sanctions and capacity-building approaches, including through the provision of additional resources and technical assistance (Dee & Jacob, 2011; Hanushek & Raymond, 2005; Strunk et al., 2014). Strunk et al. (2014) assessed the effects of District Assistance and Intervention Teams, state-approved external experts providing technical assistance to underperforming school districts in California. They found that students in districts with this support performed significantly better on state standardized tests in math but not in ELA. The effect sizes of 0.005 to 0.045 standard deviations in math in the first 2 years of implementation are considerably smaller than the estimates for the effects of SIGs in the current study (0.10–0.16 standard deviations). Although external experts provided an array of supports to districts and schools, treatment schools and districts did not receive as substantial an influx of resources as SIG schools did.
The identified effects of SIGs on test scores in this study are similar to the effects on student test scores estimated for the market-based reforms in New Orleans after Hurricane Katrina in 2005 (Harris & Larsen, 2018). In the New Orleans reforms, the state took over almost all public schools, which then turned over management to autonomous nonprofit charter management organizations working under performance contracts. Harris and Larsen’s study showed average effects on test scores of 0.10 to 0.40 standard deviations after 4.5 years of market-based reforms, which are similar to our estimated effects of 0.14 to 0.31 standard deviations for SIG turnaround schools.
Our study also corroborates prior research showing variation in the effects of SIGs, perhaps due to variation in local program design and implementation. For example, we found larger effects in WA, suggesting the benefits of further investigating reform strategies employed by this state and its SIG schools. Sun et al. (2019) used text analysis techniques to analyze WA schools’ improvement planning and implementation reports and found several promising reform strategies associated with reductions in student absences and gains in state standardized test scores during the reform years. Those strategies include teachers’ use of data to adjust instruction and develop targeted interventions for at-risk students, along with the establishment of improvement goals for both students and teachers coupled with incentives and supports for meeting those goals. Other studies indicate that the hiring of effective teachers and school leaders partially explains the positive effects of efforts to turn around underperforming schools (see, for example, Henry et al., 2020). Evidence on why school turnaround programs are more successful in some districts or schools than in others can inform states’ and districts’ development of evidence-based school turnaround strategies under ESSA.
While this study provides initial evidence on the longer-term effects of SIGs, it has shortcomings. First, we were able to examine outcomes for only a few years after the SIGs’ implementation. More years of data will eventually allow researchers to better understand the long-term impacts of SIGs on school performance. Second, this study examines the effects of the SIG program on schools. It does not look at the effects of attending a SIG school on long-run outcomes for students. Following cohorts of students who attended SIG schools to examine the grants’ long-term effects on outcomes such as educational attainment and earnings would provide further evidence on the effectiveness of SIGs.
Despite these limitations, this study is useful and timely in that it sheds light on promising approaches for continuous school improvement. Because persistently underperforming schools often educate large proportions of students from traditionally underserved groups, improving these schools is a critical lever for reducing educational inequality. Yet, SIG-like capacity-building programs require substantial investments and often substantial upheaval in schools. Such disruption makes it critical to learn what reform programs work and how they work. Our study highlights the importance of this knowledge and of policy strategies for building sustainable organizational capacity in public schools.
Supplemental Material
sj-docx-1-epa-10.3102_01623737211012440 – Supplemental material for The Longitudinal Effects of School Improvement Grants
Supplemental material, sj-docx-1-epa-10.3102_01623737211012440 for The Longitudinal Effects of School Improvement Grants by Min Sun, Alec I. Kennedy and Susanna Loeb in Educational Evaluation and Policy Analysis
Footnotes
Acknowledgements
Min Sun’s contribution to this study is supported by grants from the National Science Foundation under Grant DRL-1506494 and from the Spencer Foundation under Grant 201900028. Any opinions, findings, and conclusions or recommendations expressed in this material are those of the authors and do not necessarily reflect the views of the funders. We also thank our partners at each of the four locations (WA OSPI, NCERDC, SFUSD, and BCPS) for sharing their data.
Declaration of Conflicting Interests
The author(s) declared no potential conflicts of interest with respect to the research, authorship, and/or publication of this article.
Funding
The author(s) received no financial support for the research, authorship, and/or publication of this article.
Notes
Authors
MIN SUN is an associate professor in education policy in the College of Education at the University of Washington. Her work uses quantitative methods to study educator quality, school accountability, and school improvement.
ALEC I. KENNEDY is an educational policy analyst in the Research, Planning, and Assessment division at San Francisco Unified School District. His research areas include educational policy and quantitative research methods. His work currently involves supporting data use in school improvement efforts.
SUSANNA LOEB is professor of education and international and public affairs and the director of Annenberg Institute at Brown University. Her work addresses issues of educator career choices and professional development, of school finance and governance, and of early childhood systems.
References
Supplementary Material
Please find the following supplemental material available below.
For Open Access articles published under a Creative Commons License, all supplemental material carries the same license as the article it is associated with.
For non-Open Access articles published, all supplemental material carries a non-exclusive license, and permission requests for re-use of supplemental material or any part of supplemental material shall be sent directly to the copyright owner as specified in the copyright notice associated with the article.