






Abstract
Teacher evaluations should reflect teaching performance rather than the characteristics of the students assigned to a teacher. Exploiting naturally occurring year-to-year variation in classroom composition within teachers, this article examines whether teacher performance ratings assigned by evaluators and students are influenced by classroom context. We find that teachers with higher-achieving and less disruptive students, holding constant the teacher and school, receive systematically higher performance ratings. These effects are robust across model specifications, placebo tests, and multiple dimensions of teaching practice. By contrast, classroom demographics show no consistent association with performance ratings. A policy that adjusts evaluator scores for classroom characteristics, analogous to value-added models, increases the relative ranking of Black teachers by 8 percentage points, highlighting equity impacts of considering classroom context.
Keywords
Introduction
Amid concerns that traditional teacher evaluation systems failed to identify low-performing teachers for remediation or removal, the federal Race to the Top (RTTT) initiative spurred districts across the United States to adopt more rigorous teacher evaluation policies. Most large districts now use evaluation systems that combine classroom observation rubrics with measures of student growth (Steinberg & Donaldson, 2016). Because these systems carry high stakes for teachers’ careers, understanding whether subjective performance ratings reflect instructional quality or classroom context beyond teachers’ control is policy relevant.
While value-added measures (VAMs) have received considerable attention and have been shown to provide unbiased estimates of teachers’ causal contributions to student learning (Chetty et al., 2014a; Kane & Staiger, 2008), they are only available for a minority of teachers and remain controversial due to concerns about reliability and bias (Papay, 2011; Rothstein, 2009, 2017). In practice, classroom observations—conducted by school administrators using standardized rubrics—receive the most weight in teacher evaluations, supplemented in some districts by student surveys. These subjective measures predict student achievement (Harris & Sass, 2014; Jacob & Lefgren, 2008; Sartain et al., 2011), but they may also be sensitive to factors unrelated to teacher effectiveness.
Teachers themselves have raised concerns that classroom observation ratings are shaped by the characteristics of the students they teach. For instance, teachers report it is harder to earn top ratings when serving larger proportions of students with behavioral challenges, special education needs, or limited English proficiency. Evaluators’ expertise and the cultural fit of the rubric may further influence scores. A persistent finding in the literature is that teachers serving students with lower prior achievement or from disadvantaged backgrounds tend to receive lower observation scores (Chaplin et al., 2014; Sporte & Jiang, 2016; Whitehurst et al., 2014). This correlation presents a key identification problem: it could be a result of non-random sorting of teachers to schools and classrooms, or it could reflect a causal effect of classroom context on ratings. Causal channels could include teaching being genuinely more difficult in more challenging settings, or evaluator bias, where raters subconsciously penalize or reward teachers based on the students they serve. At stake is whether these measures reflect teaching practice or classroom context.
This article examines whether classroom composition influences teacher performance ratings. We ask: (i) To what extent are administrator observation ratings and student survey reports affected by the characteristics of students in the classroom? and (ii) How would adjusting observation ratings for student characteristics change the distribution of teacher rankings, and which teachers would be most affected? The classroom factors we study include student academic and behavioral measures (prior-year test scores, GPA, attendance, suspensions, and grade repetition), as well as student demographics (gender, race/ethnicity, free or reduced-price lunch (FRPL) eligibility, and special education status) and class size.
Using 5 years of administrative data from Chicago Public Schools (CPS)—the third-largest school district in the United States at the time of the data collection—we employ a teacher fixed-effect design to address identification challenges. This quasi-experimental design leverages natural year-to-year variation in classroom composition for the same teacher, allowing us to isolate the causal effect of student characteristics while controlling for time-invariant teacher quality and sorting.
Our findings provide evidence of a causal effect of classroom characteristics on teacher performance ratings. We find that teachers receive significantly higher ratings in years when they teach higher-achieving students with fewer behavioral challenges, even when they remain in the same school. Specifically, a 1 SD increase in a constructed classroom quality index (based on baseline academic and behavioral measures) leads to a 0.07 SD increase in classroom observation ratings and a 0.13 SD increase in student survey scores. These effects appear across multiple dimensions of practice, including classroom management and instruction. By contrast, we find that classroom demographic composition does not consistently predict ratings. Results are robust across alternative specifications, placebo tests, and subsample analyses. For example, we test whether current classroom composition predicts past or future teacher ratings once teacher fixed effects are included, and find null effects, supporting exogeneity of within-teacher composition shocks. Furthermore, our exploration of mechanisms indicates that these classroom effects are not reflected in outcome-based measures of teacher productivity (i.e., student growth measures), pointing to evaluator bias or other factors rather than genuine changes in teacher effectiveness as the likely driver.
Finally, a policy simulation shows that adjusting ratings for classroom characteristics would meaningfully change teacher rankings, with Black teachers benefiting the most. Their average ranking would improve by about 8 percentile points relative to non-Black peers.
This study contributes to the literature on teacher effectiveness and evaluation by providing large-scale, quasi-experimental evidence that classroom context systematically affects subjective performance ratings. Our findings highlight both measurement validity concerns and equity implications for teacher evaluation policies and suggest possible ways to address them.
Related Literature
The importance of high-quality teachers for student achievement and later-life outcomes is well-established (Aaronson et al., 2007; Chetty et al., 2014b; Rivkin et al., 2005; Rockoff, 2004; Sanders & Horn, 1998). Recognizing this, policymakers have increasingly focused on developing more effective teacher evaluation systems. Spurred by federal initiatives like RTTT, states and districts moved to implement evaluation systems using multiple measures of teacher practice, which heavily emphasize rubric-based classroom observations conducted by school administrators (Doherty & Jacobs, 2013; Steinberg & Donaldson, 2016). While much academic and public debate has centered on the validity of student growth measures like VAMs, classroom observations remain the cornerstone of most evaluation systems, carrying the most weight in final ratings and applying to all teachers, unlike VAMs which are only available for tested grades and subjects (Chetty et al., 2014a; Kane & Staiger, 2008; Papay, 2011; Rothstein, 2009).
Evidence shows that both subjective and objective measures of teacher effectiveness predict future student achievement (Jacob & Lefgren, 2008; Rockoff & Speroni, 2011), and strong teaching can be especially important for lower-achieving students (Aaronson et al., 2007). Much of the validation research of subjective performance ratings has compared observation ratings to VAMs. A study using findings from Chicago’s Excellence in Teaching Pilot found that, on average, teachers with higher classroom observation ratings had significantly higher VAMs (Sartain et al., 2011). Students also showed the most growth in classrooms of highly rated teachers and the least growth in classrooms of poorly rated teachers. These findings are supported by the five observation instruments used in the Measures of Effective Teaching (MET) project, which were positively associated with student achievement gains (Kane & Staiger, 2012).
A central challenge to the validity of these observation ratings is their consistent correlation with classroom composition. Several studies find that teachers serving students with lower prior achievement, limited English proficiency, or from low-income backgrounds tend to receive lower observation scores (Chaplin et al., 2014; Sporte & Jiang, 2016; Whitehurst et al., 2014). For example, Whitehurst et al. (2014) found that teachers of low-achieving students were nearly four times less likely to be rated in the top quintile compared to teachers of high-achieving students. These correlations raise concerns that, rather than reflecting instructional quality, ratings may be conflated with the classroom context in which teaching occurs—a context often outside a teacher’s control.
Interpreting this correlation presents a key identification problem. One explanation is the non-random sorting of teachers to schools and classrooms. More experienced and credentialed teachers tend to be assigned higher-achieving students, while novice teachers more often teach classrooms with greater concentrations of low-income or minority students (Borman & Kimball, 2005; Clotfelter et al., 2006; Kalogrides & Loeb, 2013; Lankford et al., 2002). Sorting can occur through administrator assignment, parent advocacy, or teacher mobility across schools (Boyd et al., 2011; Goldhaber et al., 2015; Paufler & Amrein-Beardsley, 2014). Such sorting could explain the link between classroom characteristics and evaluation scores.
A second explanation, however, is that classroom context has a causal influence on ratings. This could occur if teaching is genuinely more difficult in more challenging settings, thereby depressing a teacher’s observable performance. New teachers often work both in disorganized schools and in a less supportive environment than other teachers, which may further depress ratings (Kraft & Papay, 2014). Alternatively, it could reflect rater bias, where evaluators subconsciously penalize or reward teachers based on the students they teach, independent of the teacher's actual effectiveness. Distinguishing between sorting and these causal channels is critical for assessing the validity and fairness of observation-based evaluations.
To isolate the causal effect of classroom composition, a set of studies take advantage of the experimental design of the MET project, which randomly assigned students to teachers within schools (Campbell & Ronfeldt, 2018; Cherng et al., 2022; Steinberg & Garrett, 2016). This design mitigates concerns about within-school teacher sorting. These studies find that classroom context matters: Steinberg and Garrett (2016) and Campbell and Ronfeldt (2018) both found that teachers receive higher observation ratings when assigned higher-achieving students. The latter authors believed both rater bias and actual differences in instructional quality may explain their estimates, but cannot disentangle the effects of the two. Cherng et al. (2022) found that teachers in classrooms with higher proportions of Black and Hispanic students tend to receive lower ratings, regardless of the teacher’s own race. In our analysis, classroom demographic composition is not systematically related to overall observation scores after controlling for students’ baseline achievement and behaviors; however, a higher share of Black students is associated with lower ratings in the classroom environment and instruction domains. While compelling, a limitation of the MET studies is that ratings were conducted by trained external observers on videotaped lessons for a small sample of teachers, a context that differs from the high-stakes, in-person evaluations conducted by school principals that are the norm in practice.
This study builds on and extends this literature in several ways. First, we analyze authentic, high-stakes evaluations conducted by school administrators in CPS. Our data include evaluation ratings for the universe of teachers in CPS, the then third largest school district in the United States, and include teachers in general education, math and English subjects as well as arts, music, and other subjects. Therefore, the findings in this article are more generalizable for policy and practice. Second, we employ a teacher-by-school fixed-effects design that leverages naturally occurring year-to-year variation in classroom composition for the same teacher, and at the same time control for time-varying teacher characteristics, such as teaching experience. Under the identifying assumption of exogenous classroom shocks, this quasi-experimental design identifies the causal effects of classroom context while mitigating concerns about the sorting of teachers to schools. Third, we contrast the effects on high-stakes administrator ratings with those on low-stakes student surveys, providing insight into whether these two perspectives are differentially sensitive to classroom context. Finally, we simulate a policy adjustment to ratings, quantifying the potential equity implications of accounting for classroom composition in teacher evaluations.
Teacher Evaluation in Chicago Public Schools
In response to state legislation, CPS implemented a new teacher evaluation system, Recognizing Educators Advancing Chicago (REACH), 1 beginning with non-tenured teachers in 2012–2013 and expanding to all teachers in 2013–14. REACH was designed to improve instruction and student learning by providing a clear definition of high-quality teaching and supporting ongoing professional growth (CPS, 2019). Teachers receive a composite score on a 100–400 scale, which is then converted into one of four categories: Unsatisfactory, Basic, Proficient, or Distinguished. Despite this formative intent, the ratings carry significant stakes. Tenured teachers with unsatisfactory or basic ratings face remediation plans and potential dismissal, while non-tenured teachers with these ratings cannot progress toward tenure and are subject to dismissal.
REACH evaluation scores are based on two primary components: classroom observation ratings (70% of the final score) and student growth metrics (30% of the final score). Student surveys are not part of teacher evaluations.
High-Stakes Teacher Performance Measures
Classroom Observations
Each teacher is observed four times during the evaluation cycle by a certified principal or assistant principal, in both announced and unannounced visits. CPS uses an adaptation of the Charlotte Danielson Framework for Teaching, which structures teacher practice into four domains: Planning and Preparation, Classroom Environment, Instruction, and Professional Responsibility. These domains are further broken down into 19 specific components (e.g., Managing Student Behavior, Using Assessment in Instruction). Each component is rated on a four-point scale, and these ratings are aggregated into a single teacher practice score. Supplemental Appendix Table A1 provides a list of the domains and components, while Supplemental Appendix Table A2 shows a sample rubric.
Student Growth
This metric is calculated using one of two methods. The first method uses VAMs based on the Northwest Evaluation Association (NWEA) test for grades 2–8. These measures are used for teachers in tested subjects in reading and math. The second method, which applies to all other teachers, is based on performance tasks. These are subject- and grade-level-specific assessments developed by the district and administered by teachers at the beginning and end of the year. Student growth is then calculated based on the scores from these tasks. There is already an extensive body of literature on the construction and use of VAMs, which is not the focus of this article.
Because most teachers do not teach tested grades or subjects, classroom observations determine the majority of REACH ratings in practice. Even for teachers with value-added scores, observations carry the heaviest weight. Teachers also tend to value the feedback from these observations, making it especially important to understand whether scores reflect instructional quality or classroom composition.
Low-Stakes Student Surveys
In addition to the formal evaluation system, CPS administers an annual, low-stakes survey to students in grades 6–12 through a partnership with the University of Chicago Consortium on School Research. This 5Essential survey captures various aspects of school climate and culture. With student response rates around 80%, improvements on these constructs are associated with school-level achievement gains (Bryk et al., 2010; Hart et al., 2020). While the survey results are publicly available and included in the school accountability system, they do not directly influence individual teacher evaluations, distinguishing them from the REACH system.
A key component of the survey asks students to report on their experiences in a specific, randomly selected class (English, math, or science). These course-specific items cover topics such as teacher expectations, coursework relevance, and classroom behavior. We use these granular, course-specific items because they can be linked to teacher-level administrative data, providing a unique measure of teacher practice from the student perspective. Supplemental Appendix Table A3 lists the specific survey items and their associated indices.
Methodology and Data
Conceptual Framework
We define evaluator bias as a systematic deviation in teacher ratings that is attributable to classroom characteristics, independent of the teacher’s true quality (Grissom & Bartanen, 2022). Formally, let

where
Observational data often show a correlation between student characteristics and teacher ratings. Figure 1 illustrates this pattern in our data, plotting the distribution of teacher observation scores (Panel A) and survey scores (Panel C) conditional on the classroom’s average baseline student test scores. As shown in Panel A, teachers whose classrooms are in the bottom quartile of prior student achievement are disproportionately rated in the bottom quartile of observation scores (40%) and rarely in the top quartile (11%). The reverse is true for teachers with students in the top achievement quartile. This correlation could reflect true causal bias (
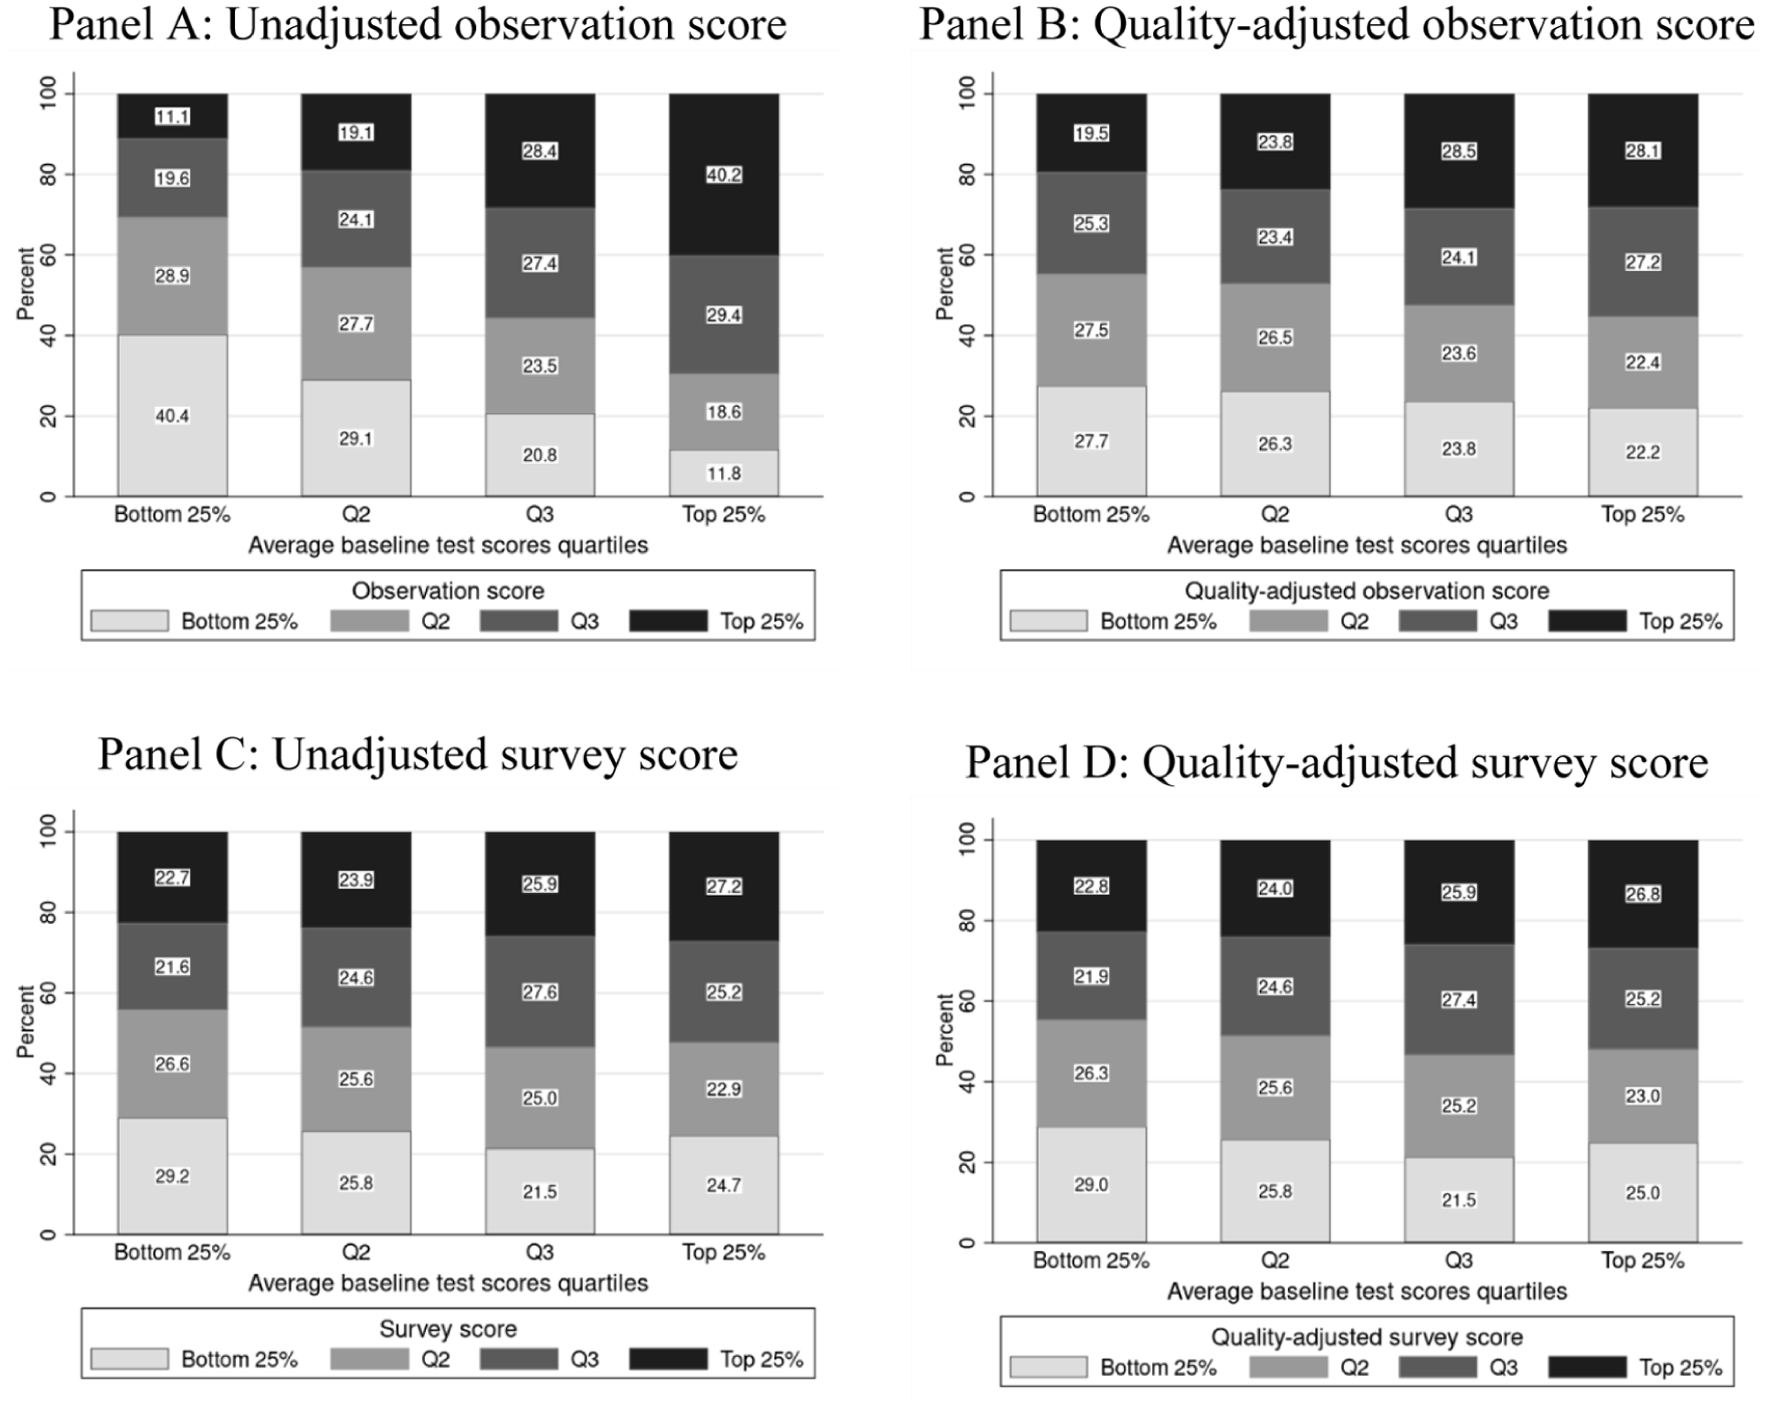
Conditional distribution of unadjusted and quality-adjusted classroom observation and survey scores given average baseline test scores. Panel A: Unadjusted observation score. Panel B: Quality-adjusted observation score. Panel C: Unadjusted survey score. Panel D: Quality-adjusted survey score.
The ideal experiment to disentangle these channels would randomly assign teachers to higher-achieving and lower-achieving classrooms, so that teachers are balanced across settings, and test for systematic differences in teacher performance ratings. In the absence of such experiment, we employ a quasi-experimental approach.
We decompose teacher quality into a time-invariant component,

where the composite error term is

This assumption allows for systematic sorting, such as more effective teachers consistently being assigned to higher-achieving students. It would be violated, however, if teachers who experience improvements in their effectiveness are systematically assigned different types of classrooms in subsequent years. One potential threat therefore arises from the joint dynamics of teacher experience and student assignment. The literature documents that teacher effectiveness grows with experience and that more experienced teachers are often sorted into different classrooms (Kalogrides & Loeb, 2013; Kraft & Papay, 2014). To mitigate this concern, our main specifications control for a flexible function of teaching experience. We further assess the plausibility of Assumption 1 through a series of robustness and placebo tests in Sections “Robustness Checks” and “Plausibility of Exogenous Variation.”
Data and Key Variables
We use de-identified administrative and survey data from CPS for the 2012–2013 to 2016–2017 school years. These longitudinal data include student demographics, test scores, attendance, 5Essential surveys, teacher personnel files, and REACH evaluation data.
Teacher Performance Ratings
Our primary dependent variables are two measures of teacher performance.
Classroom observation score: The final score from the district’s teacher evaluation system, averaged across four domains: planning and preparation, classroom environment, instruction, and professional responsibilities. Scores for each domain serve as secondary outcomes. Virtually all teachers (98%) have complete domain data.
Survey score: The 5Essentials student survey includes 36 course-specific items for a randomly selected class (English, math, or science). Items are grouped into seven theory-based indices: peer group for academic work, classroom rigor, academic press, course clarity, academic engagement, academic personalism, and classroom disruption. We compute student-level means for each index, aggregate to teacher-year means, and average indices to a single teacher-level survey score. 2 The individual indices are secondary outcomes.
Classroom Characteristics
We construct a rich set of classroom-level characteristics by aggregating student-level data. Student characteristics include demographics (gender, race/ethnicity, FRPL status, and special education status), behaviors (lagged attendance, whether suspended, and whether repeating the grade), and prior academic achievement (lagged GPA and standardized test scores). Test scores are from the NWEA exam, and we average math and reading scores and normalize them by grade and year. We use lagged achievement and behavior variables to mitigate simultaneity bias, as these could be influenced by the teacher’s current-year effectiveness. We also include class size.
Classroom Quality Index
To reduce the dimensionality of multiple classroom characteristics, we construct a summary measure of classroom context using principal component analysis (PCA). The classroom quality index is defined as the first principal component of student-level baseline achievement and behavioral measures: standardized test scores, GPA, attendance, suspensions, and grade repetition status. We aggregate this index to the classroom level. A higher value indicates a classroom that, on average, consists of higher-achieving students with fewer behavioral issues (see Supplemental Appendix Table A4 for component loadings). The first principal component explains 40% of the joint variation in these underlying measures. 3 Finally, we note that the composite index also simplifies downstream analyses—such as heterogeneity and policy simulations—by allowing us to study interactions with a single, interpretable measure of classroom context rather than a high-dimensional vector of correlated variables.
Teacher Characteristics
We control for teacher gender, race/ethnicity, tenure status, age, years of experience within the district (years since CPS hire), educational level, and teaching credentials. These variables are derived from district personnel files.
Sample Description
We use student transcript files to link students to teachers and construct classroom rosters. 4 All students taught by the same teacher in a year are pooled into a single roster, as the administrative data do not record actual classroom assignments and REACH data do not identify which section was observed. Pooling classrooms avoids potential selection bias if a teacher with multiple sections were more likely to be observed in the most advantaged class. 5
Our sample includes all grades 3–8 teachers with rosters of at least five students with lagged test scores. We exclude classrooms with more than 25% special education students, since co-teaching arrangements may affect ratings. 6 After applying these restrictions, 94% of teachers match to REACH evaluation data and 36% match to student survey records (reflecting eligibility rules for middle-grade English, math, and science). Given the high matching rate to the REACH data, we restrict the sample to these teachers.
Our analysis uses two primary samples. The classroom observation sample includes 30,479 teacher-year observations from 10,934 unique teachers. The survey sample includes 10,991 observations from 3,345 unique teachers. Nearly all eligible teachers (
Table 1 presents descriptive statistics. In the observation sample, the typical teacher is female (83%), White (47%), or Black (26%), around 40 years old, with 9 years of CPS experience, and 74% are tenured. Nearly all hold a college degree (96%) and teaching certification (98%), about 70% hold a master’s degree, and 8% hold National Board Certification. Teachers are linked to an average of 62 students. Classrooms are on average 38% Black, 46% Hispanic, and 11% White, and predominantly low-income (85% FRPL); however, classrooms are highly racially segregated (see Figure 2, Panel C). Classroom observation scores cluster between 3 and 4, while student survey scores concentrate near 3 on the 1–4 scale (see Figure 2, Panels A and B).
Summary Statistics of Analytic and Survey Samples
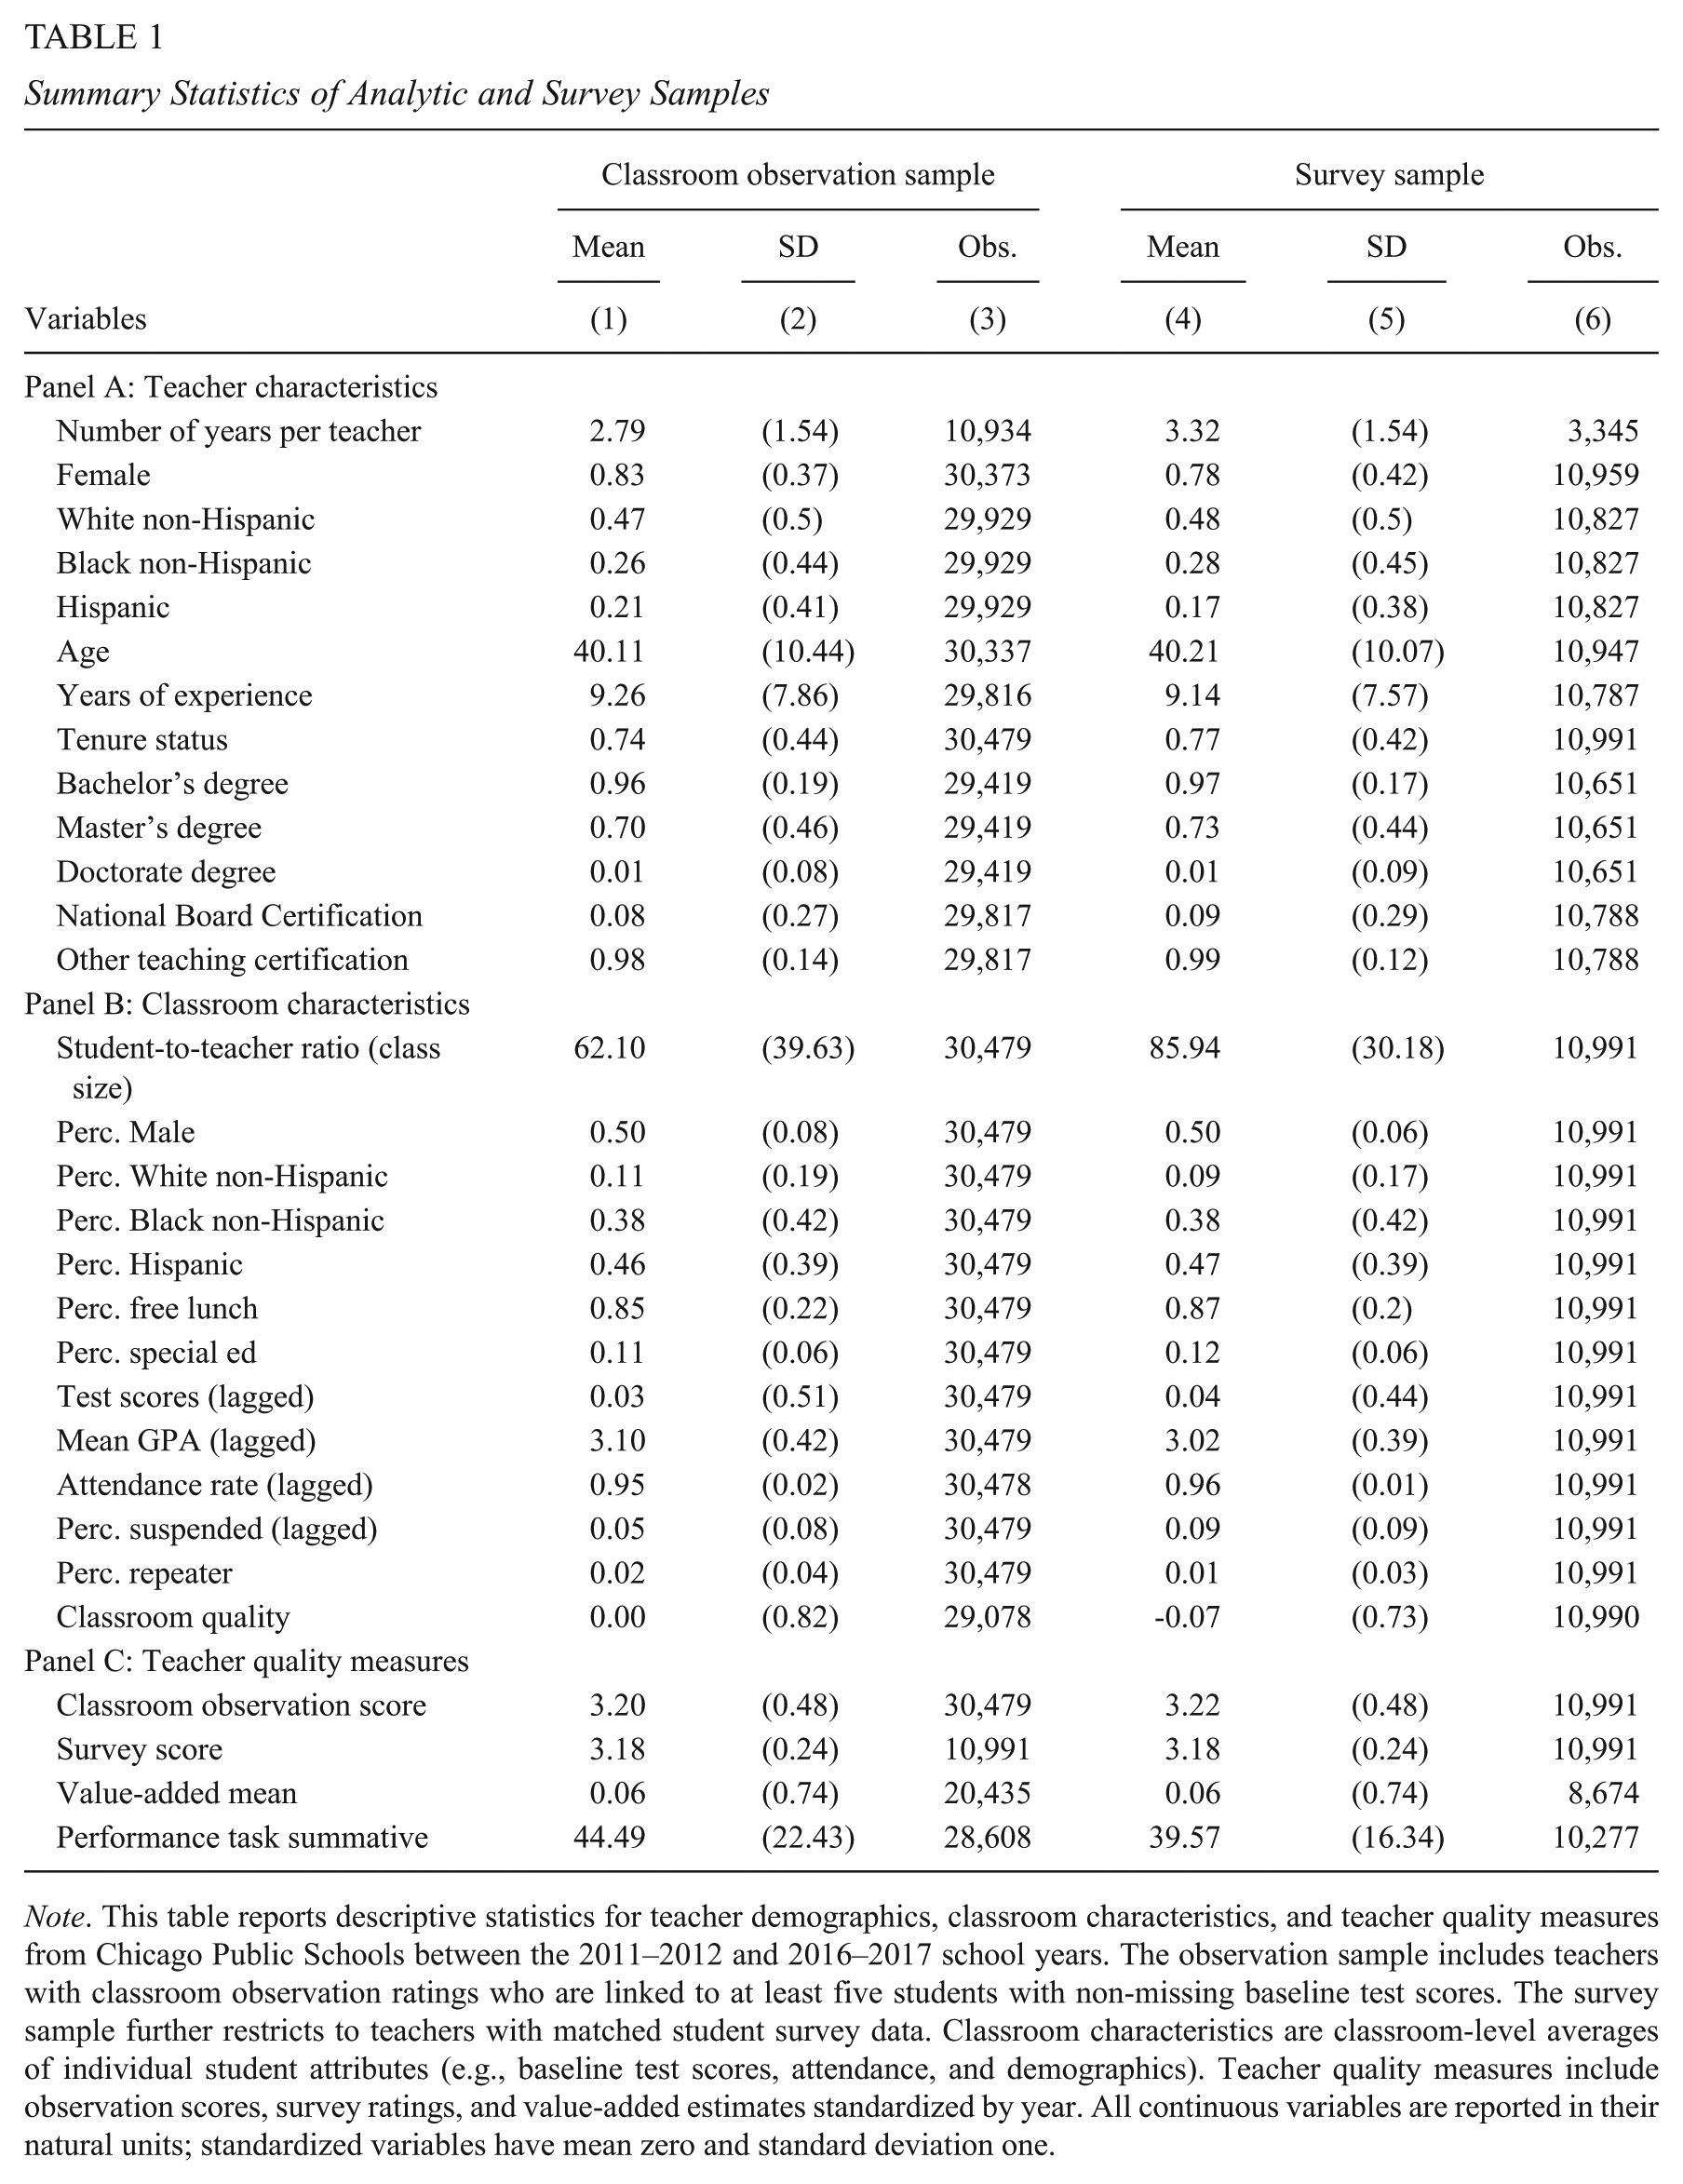
Note. This table reports descriptive statistics for teacher demographics, classroom characteristics, and teacher quality measures from Chicago Public Schools between the 2011–2012 and 2016–2017 school years. The observation sample includes teachers with classroom observation ratings who are linked to at least five students with non-missing baseline test scores. The survey sample further restricts to teachers with matched student survey data. Classroom characteristics are classroom-level averages of individual student attributes (e.g., baseline test scores, attendance, and demographics). Teacher quality measures include observation scores, survey ratings, and value-added estimates standardized by year. All continuous variables are reported in their natural units; standardized variables have mean zero and standard deviation one.
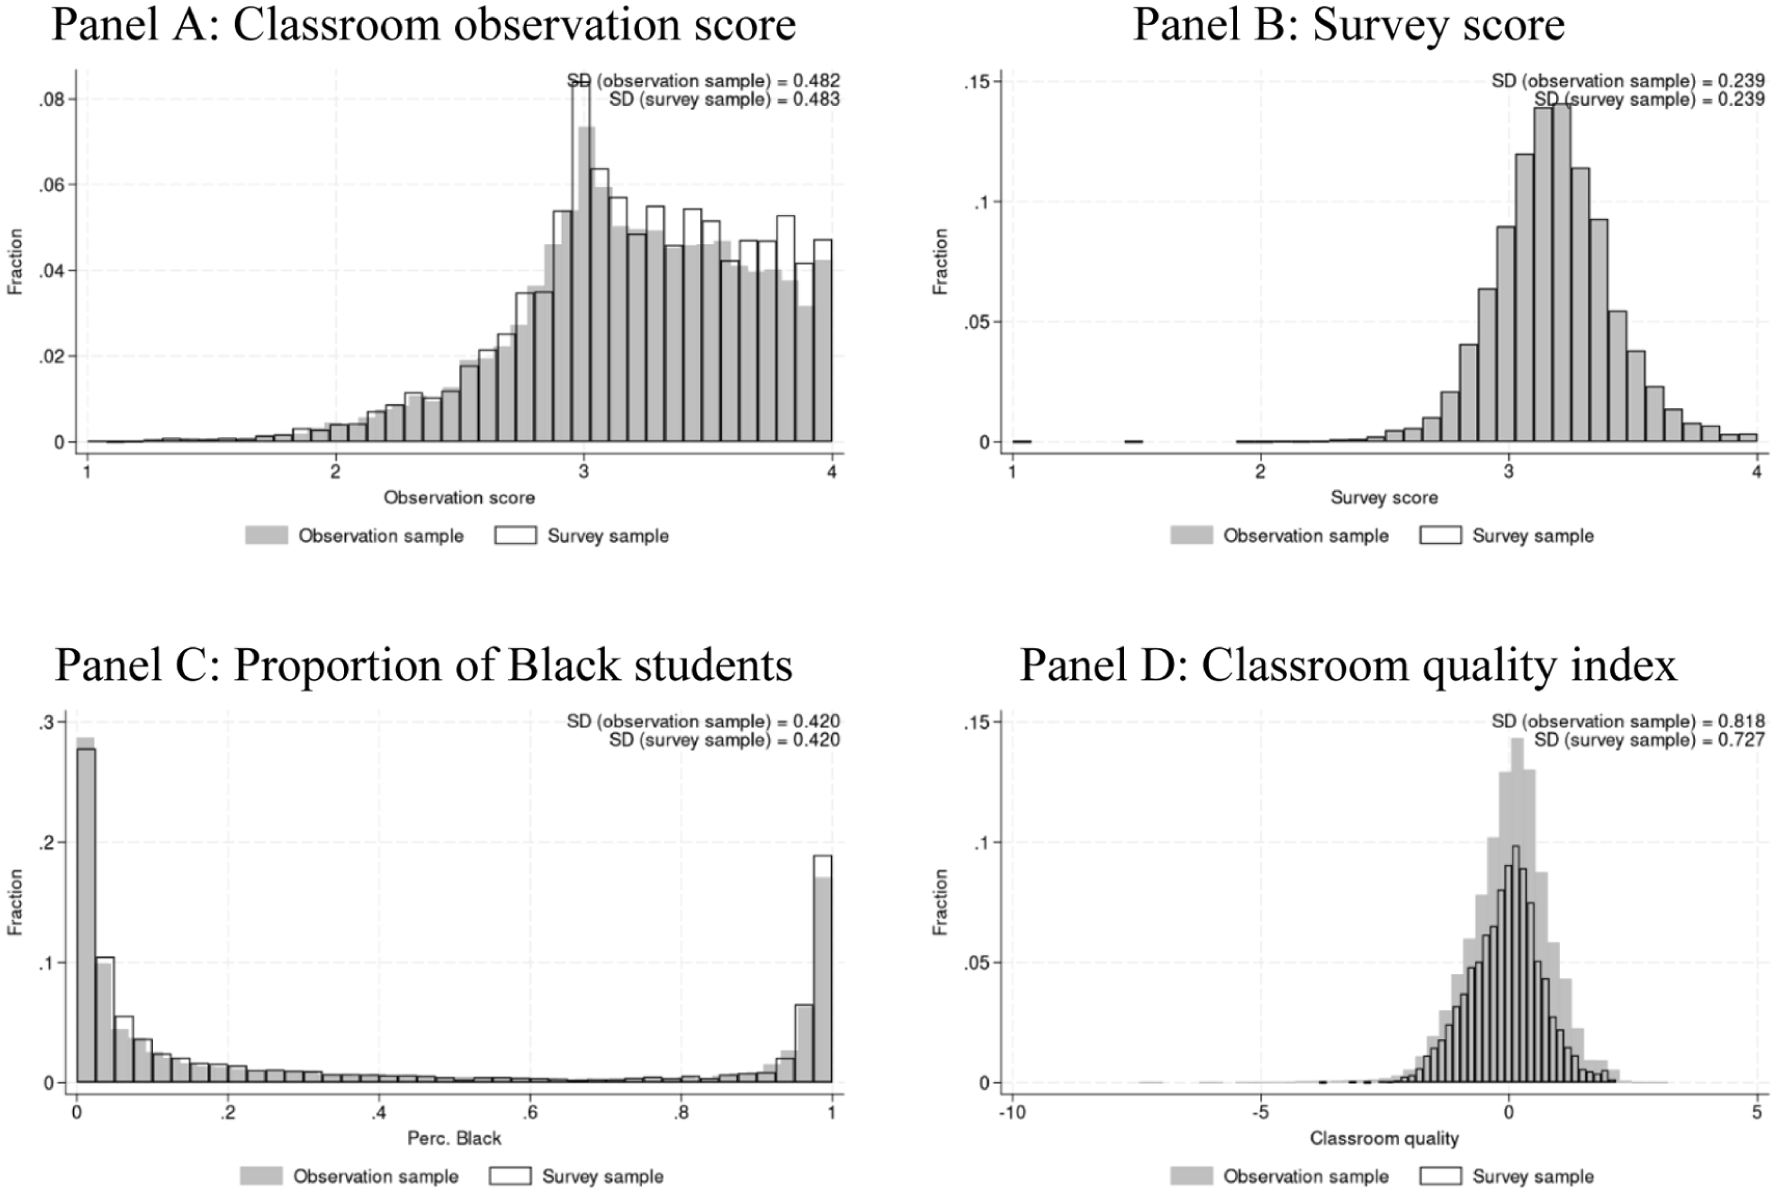
Distribution of teacher performance ratings and selected classroom characteristics (between-teacher variation). Panel A: Classroom observation score. Panel B: Survey score. Panel C: Proportion of black students. Panel D: Classroom Quality Index.
Supplemental Appendix Table A5 shows that classroom observation and student survey scores are moderately correlated with each other (
Empirical Strategy
We estimate the causal effect of classroom characteristics on teacher ratings using a teacher-by-school fixed effects model. This quasi-experimental design leverages variation in the composition of students assigned to the same teacher in the same school over different years. Our main specification is:

where
The model includes teacher-by-school fixed effects (
The identifying variation for
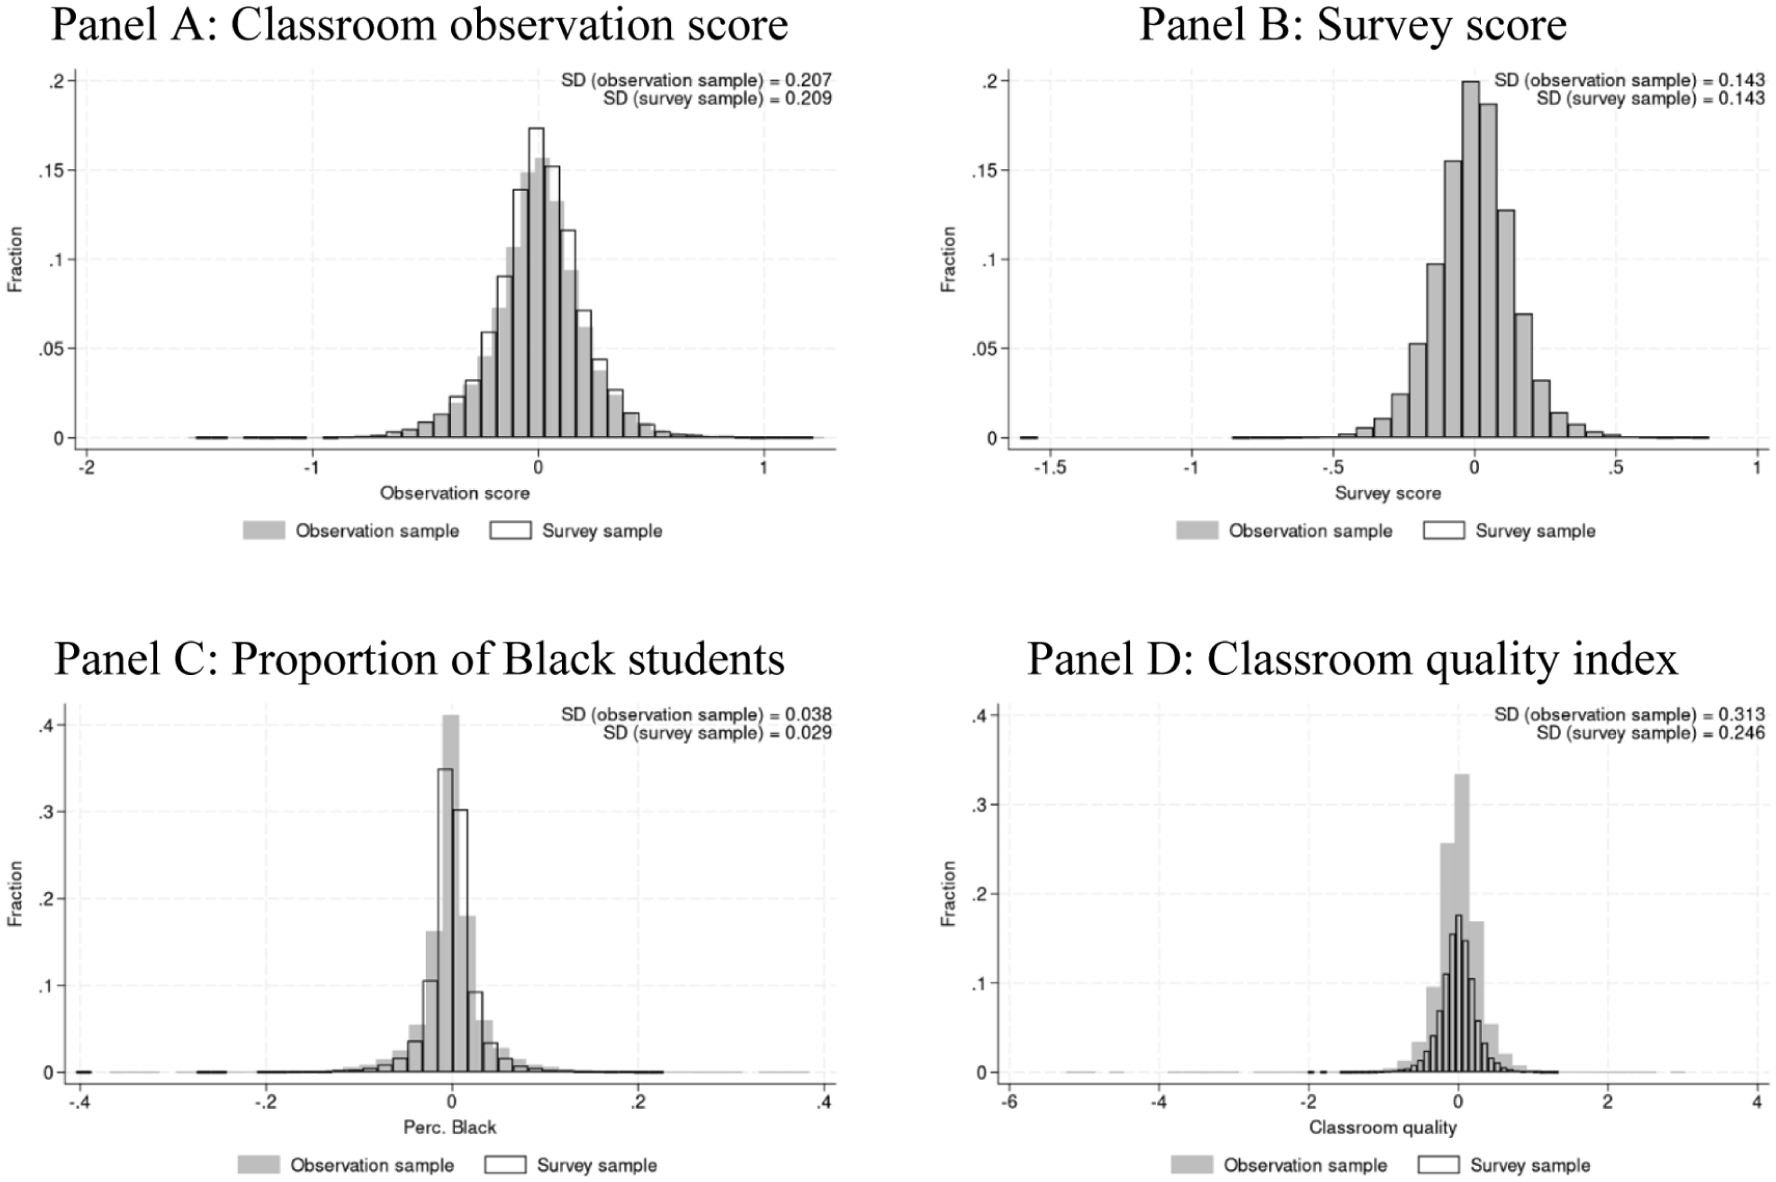
Distribution of teacher performance ratings and selected classroom characteristics (within-teacher variation). Panel A: Classroom observation score. Panel B: Survey score. Panel C: Proportion of Black students. Panel D: Classroom Quality Index.
Results
Effects of Classroom Characteristics on Evaluator Ratings
We begin by examining the effect of classroom characteristics on teachers’ observation scores using the fixed-effects model specified in Equation 4. For ease of interpretation, both the dependent variables and the classroom quality index are standardized by year to have a mean of zero and a standard deviation of one.
Table 2 presents the main results. Columns 1–3 progressively introduce controls. In a specification with only classroom demographics and year fixed effects (Column 1), a 1 SD increase in the classroom quality index is positively and significantly associated with 0.17 SD higher observation scores. Several demographic characteristics also show significant correlations; for instance, a 10 percentage point increase in the share of Black students is associated with a 0.05 SD decrease in scores, while a similar increase in non-Black, non-Hispanic students is associated with a 0.02 SD increase. These relationships persist after controlling for teacher characteristics (Column 2) and school fixed effects (Column 3), indicating that even within the same school, teachers assigned to classrooms with higher-achieving students and fewer underserved students tend to receive higher ratings.
Effects of Classroom Characteristics on Classroom Observation and Survey Scores Across Samples
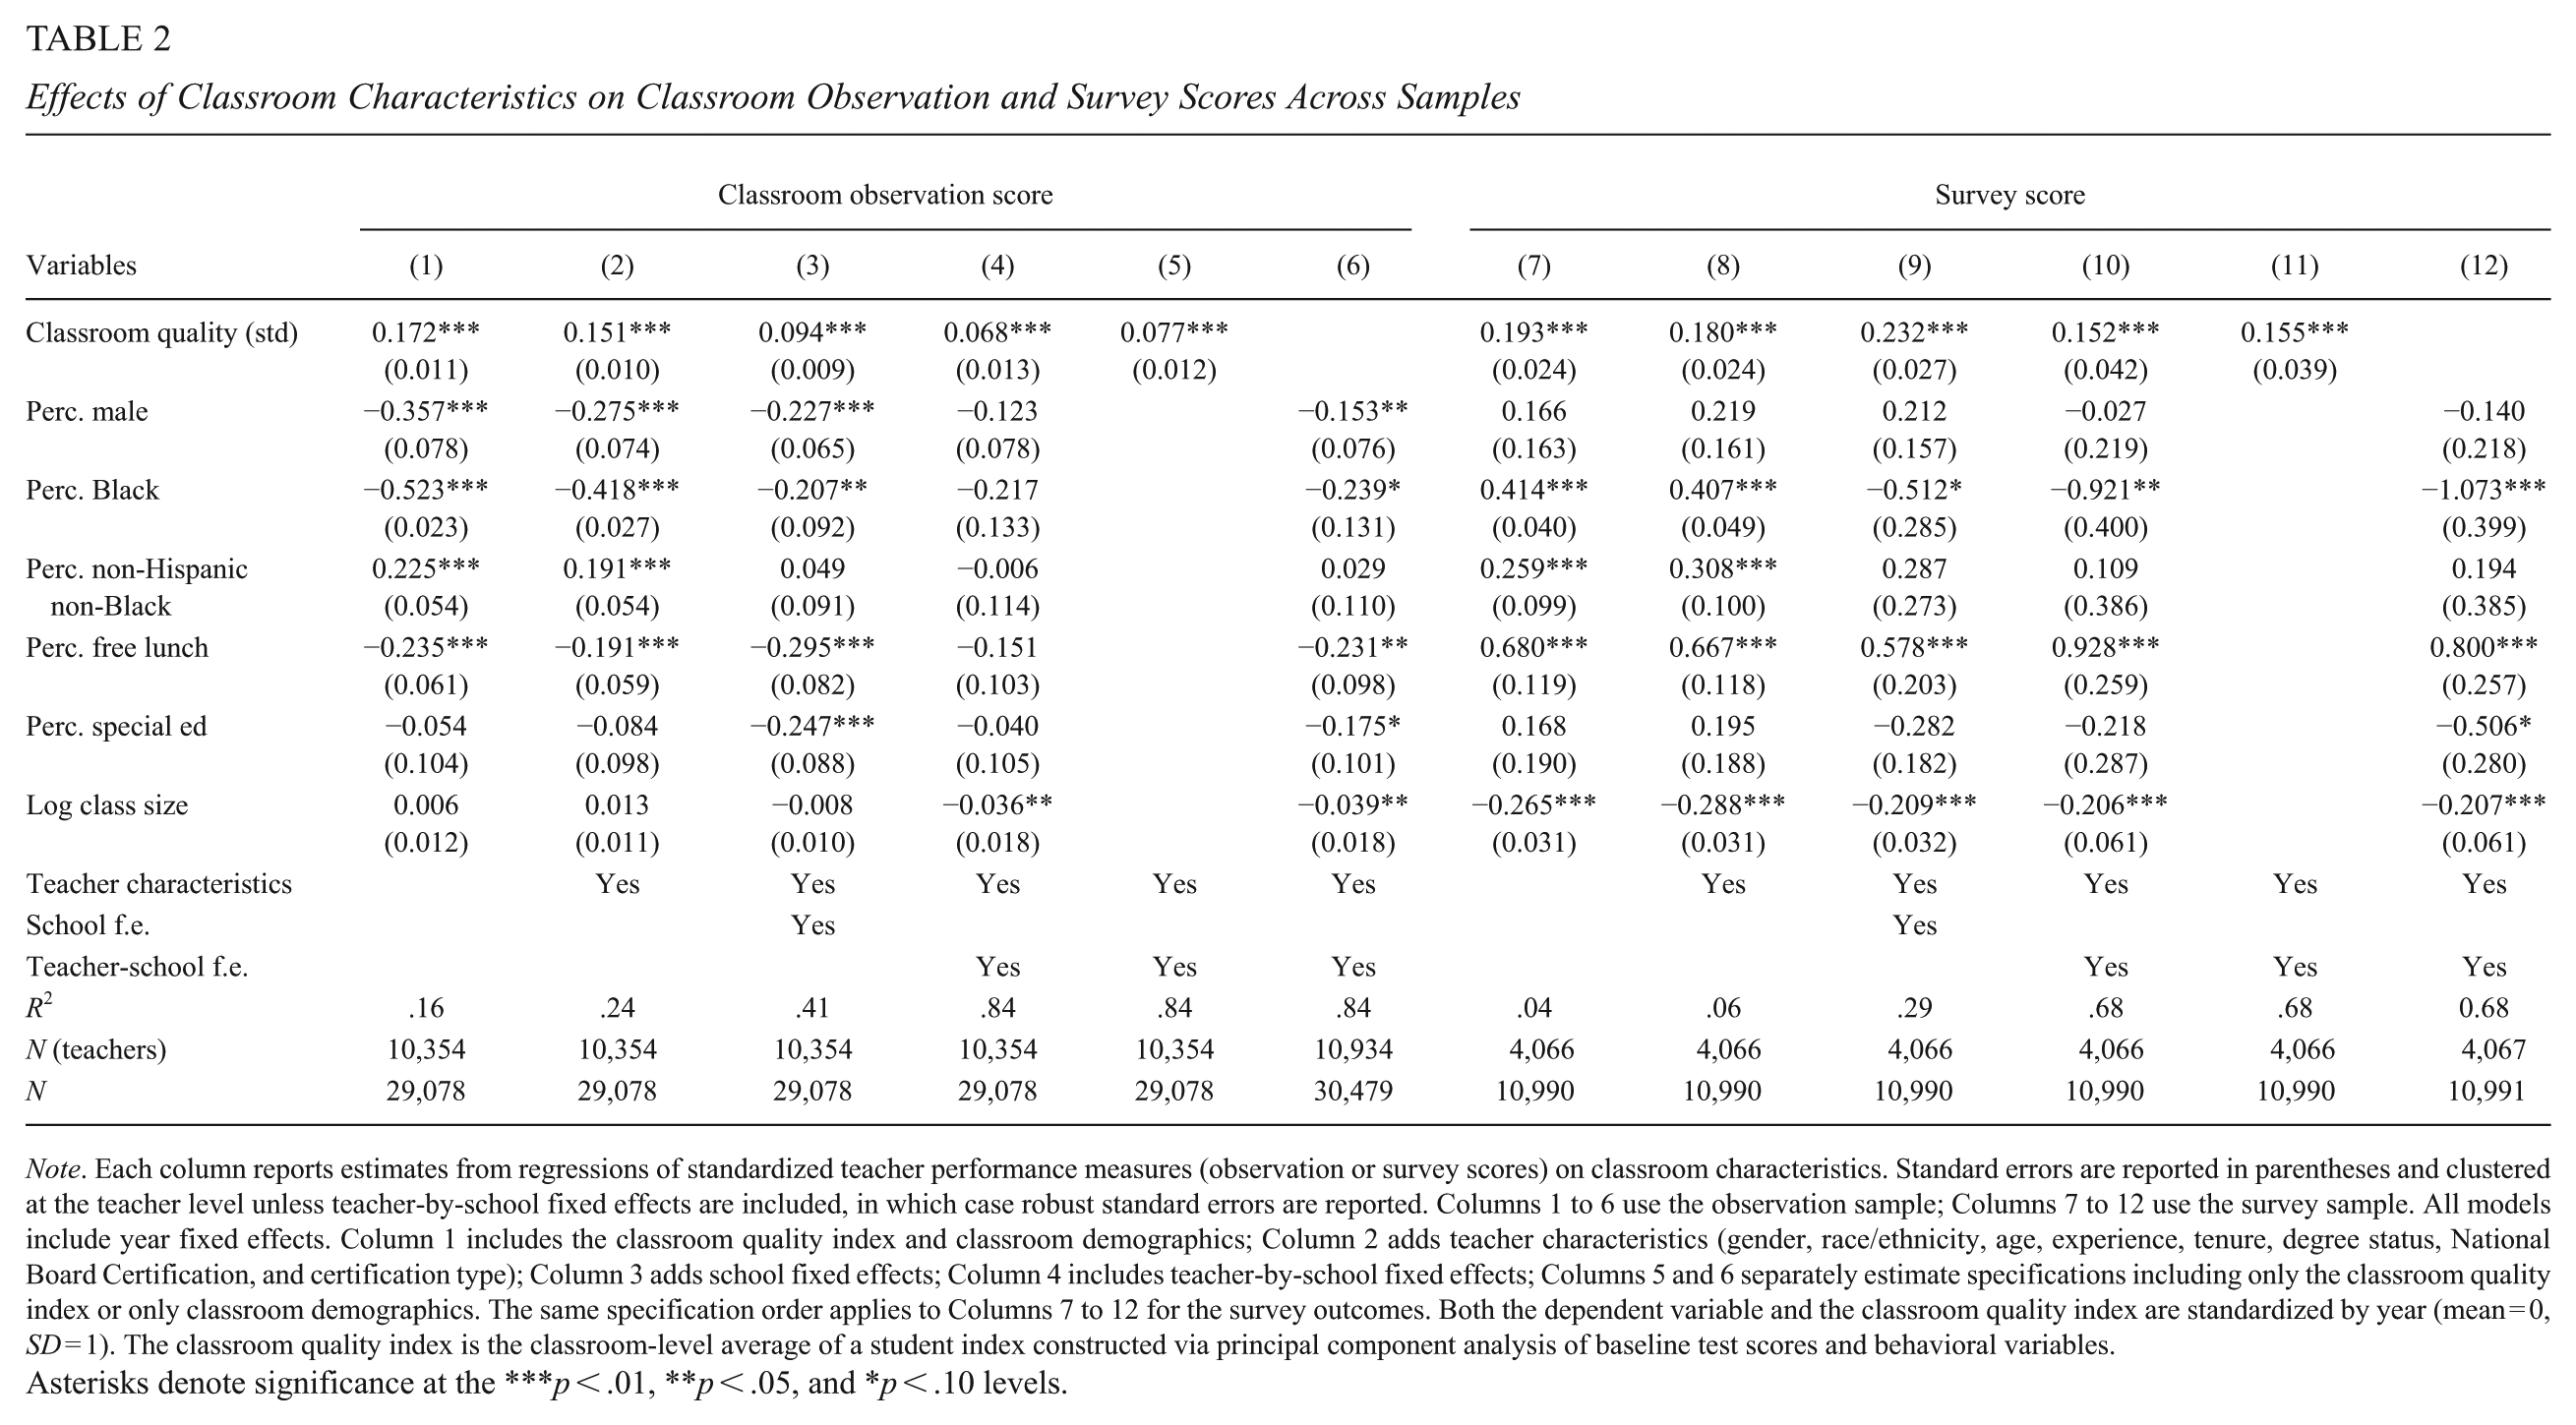
Note. Each column reports estimates from regressions of standardized teacher performance measures (observation or survey scores) on classroom characteristics. Standard errors are reported in parentheses and clustered at the teacher level unless teacher-by-school fixed effects are included, in which case robust standard errors are reported. Columns 1 to 6 use the observation sample; Columns 7 to 12 use the survey sample. All models include year fixed effects. Column 1 includes the classroom quality index and classroom demographics; Column 2 adds teacher characteristics (gender, race/ethnicity, age, experience, tenure, degree status, National Board Certification, and certification type); Column 3 adds school fixed effects; Column 4 includes teacher-by-school fixed effects; Columns 5 and 6 separately estimate specifications including only the classroom quality index or only classroom demographics. The same specification order applies to Columns 7 to 12 for the survey outcomes. Both the dependent variable and the classroom quality index are standardized by year (mean = 0, SD = 1). The classroom quality index is the classroom-level average of a student index constructed via principal component analysis of baseline test scores and behavioral variables.
Asterisks denote significance at the ***p < .01, **p < .05, and *p < .10 levels.
Column 4 shows our preferred specification, which includes teacher-by-school fixed effects to isolate the effect of year-to-year changes in a teacher’s classroom assignment within a given school. In this specification, a 1 SD increase in the classroom quality index is associated with a 0.068 SD increase in observation scores. On the other hand, demographic coefficients become statistically indistinguishable from zero; the one exception is class size, which becomes negatively significant, though the magnitude is small (a 10% increase in class size is associated with a 0.004 SD reduction in ratings). We note the large increase in the R2 from .20 to .80 once teacher-by-school fixed effects are included; it is consistent with substantial persistent, time-invariant differences across teachers explaining most variation in ratings.
To probe the mechanism, Columns 5 and 6 estimate the models with the classroom quality index alone and demographics alone while retaining the teacher-by-school fixed effects. The classroom quality effect remains stable at 0.077 SD per 1 SD increase. When the quality index is omitted, some demographic variables appear significant; once the index is included, those effects largely attenuate. This pattern suggests that baseline achievement and behavior, rather than demographics per se, drives most of the link between classroom composition and observation ratings. 8
We confirm this interpretation in Supplemental Appendix Table A7, which replaces the classroom quality index with the full vector of student achievement and behavioral characteristics. Without teacher-by-school fixed effects, nearly all characteristics are statistically significant (Column 1). With teacher-by-school fixed effects, however, only baseline test scores, GPA, and attendance rate remain significant predictors (Column 2), while most demographic variables do not. In terms of magnitude, a 1 SD increase in average baseline test scores and GPA is associated with a 0.04 and 0.03 SD increase in classroom observation scores, respectively. Similarly, a 1 SD increase in prior-year average attendance rates is associated with a 0.02 SD increase in observation scores. Other behavioral measures are less precisely estimated: the share of students who were suspended is negatively related to observation scores, while the share of repeaters is positively related, though both coefficients are imprecise. In contrast, classroom demographic composition—including gender, race/ethnicity, socioeconomic status, and special education status—has effects that are statistically indistinguishable from zero at conventional levels, with the exception of class size, which has a small negative effect. Overall, these results indicate that prior achievement and attendance are the primary drivers of the classroom composition effect, supporting our use of a composite index to summarize these dimensions and reduce dimensionality in the main analysis.
Do these effects operate across all domains of the observation rubric? We disaggregate the analysis by the four domains that comprise the observation score in Supplemental Appendix Table A8. The classroom quality index is a consistent and positive predictor of ratings across all domains. The effects are not only largest for in-classroom domains—Classroom Environment (0.09 SD) and Instruction (0.07 SD)—but also spill over to out-of-classroom domains like Planning and Preparation (0.05 SD) and Professional Responsibilities (0.05 SD). These spillovers may arise if a single evaluator’s bias persists across all domains or if genuine teacher performance improvements, boosted by a higher-achieving class, extend beyond direct instruction. Consistent with the main results, most demographic characteristics are not robust predictors of domain scores; one exception is that higher Black student share is associated with slightly lower Classroom Environment (−0.03 SD per 10 p.p.) and Instruction (–0.02 SD per 10 p.p.) ratings.
Effects of Classroom Characteristics on Student Survey Reports
We next examine the influence of classroom context on student survey reports. Because surveys are fielded in grades 6–12 for middle grade English, math, and science teachers, we first replicate the observation score analysis on the survey sample (Supplemental Appendix Table A9). For this sample, the classroom quality effect on observation scores is larger. Our preferred specification implies that a 1 SD increase in classroom quality raises observation ratings by about 0.13 SD, and classroom demographics are not statistically significant.
Table 2 (Columns 7–12) presents the main results for student survey scores. In our preferred specification with teacher-by-school fixed effects (Column 10), a 1 SD increase in the classroom quality index is associated with a 0.15 SD increase in survey scores. This effect is robust to the inclusion or exclusion of demographic controls and is similar in magnitude to the effect on observation scores for this same middle-school subsample, suggesting that teacher performance ratings are more sensitive to classroom quality in middle grades than in elementary grades.
Contrary to the findings for observation scores, some demographic characteristics remain significant predictors of student survey reports even after controlling for the classroom quality index. Specifically, a 10 percentage point increase in the share of Black students is associated with a 0.09 SD decrease in survey scores, while a similar increase in the share of FRPL-eligible students is associated with a 0.09 SD increase. Larger classes are associated with lower ratings, with the magnitude of this effect being larger for surveys than for observations. Supplemental Appendix Table A7 (Columns 5–8), which replaces the classroom quality index with the full vector of student achievement and behavioral characteristics, indicates that average baseline test scores and the share of students suspended in the prior year appear to drive much of the classroom quality index effect on survey outcomes.
Do these patterns hold across survey domains? Supplemental Appendix Table A10 disaggregates these findings by the seven domains of the student survey. The classroom quality index is positively associated with scores on all domains except for Academic Engagement, whose impact is positive but imprecise. Demographics also show domain-specific effects; for example, the share of Black students is negatively associated with several domains, while the share of FRPL-eligible students is positively associated with all domains. Class size negatively affects all domains. Notably, student reports on Classroom Disruptions are sensitive to a wide range of classroom characteristics. These results suggest that student perceptions are not immune to idiosyncratic changes in classroom composition.
Heterogeneity of Classroom Effects by Teacher Characteristics
To explore whether these effects are stable across different types of teachers, we test for heterogeneity by teacher demographics and prior effectiveness. All models use our preferred specification (classroom demographics, teacher covariates, and teacher-by-school fixed effects).
Table 3 reports results separately by teacher gender and race/ethnicity (Columns 1–6). The positive effect of the classroom quality index on observation scores (Panel A) is present and statistically significant for most subgroups, with point estimates ranging from 0.07 to 0.10 SD. For Hispanic teachers, the effect is smaller and imprecise; however, we cannot reject equality of effects across groups. For student survey scores (Panel B), the effect of classroom quality is also consistently positive (0.15–0.22 SD), though the estimate for Black teachers is smaller and not statistically significant.
Heterogeneity: Effects of Classroom Characteristics on Classroom Observation and Survey Scores across Teacher Subsamples
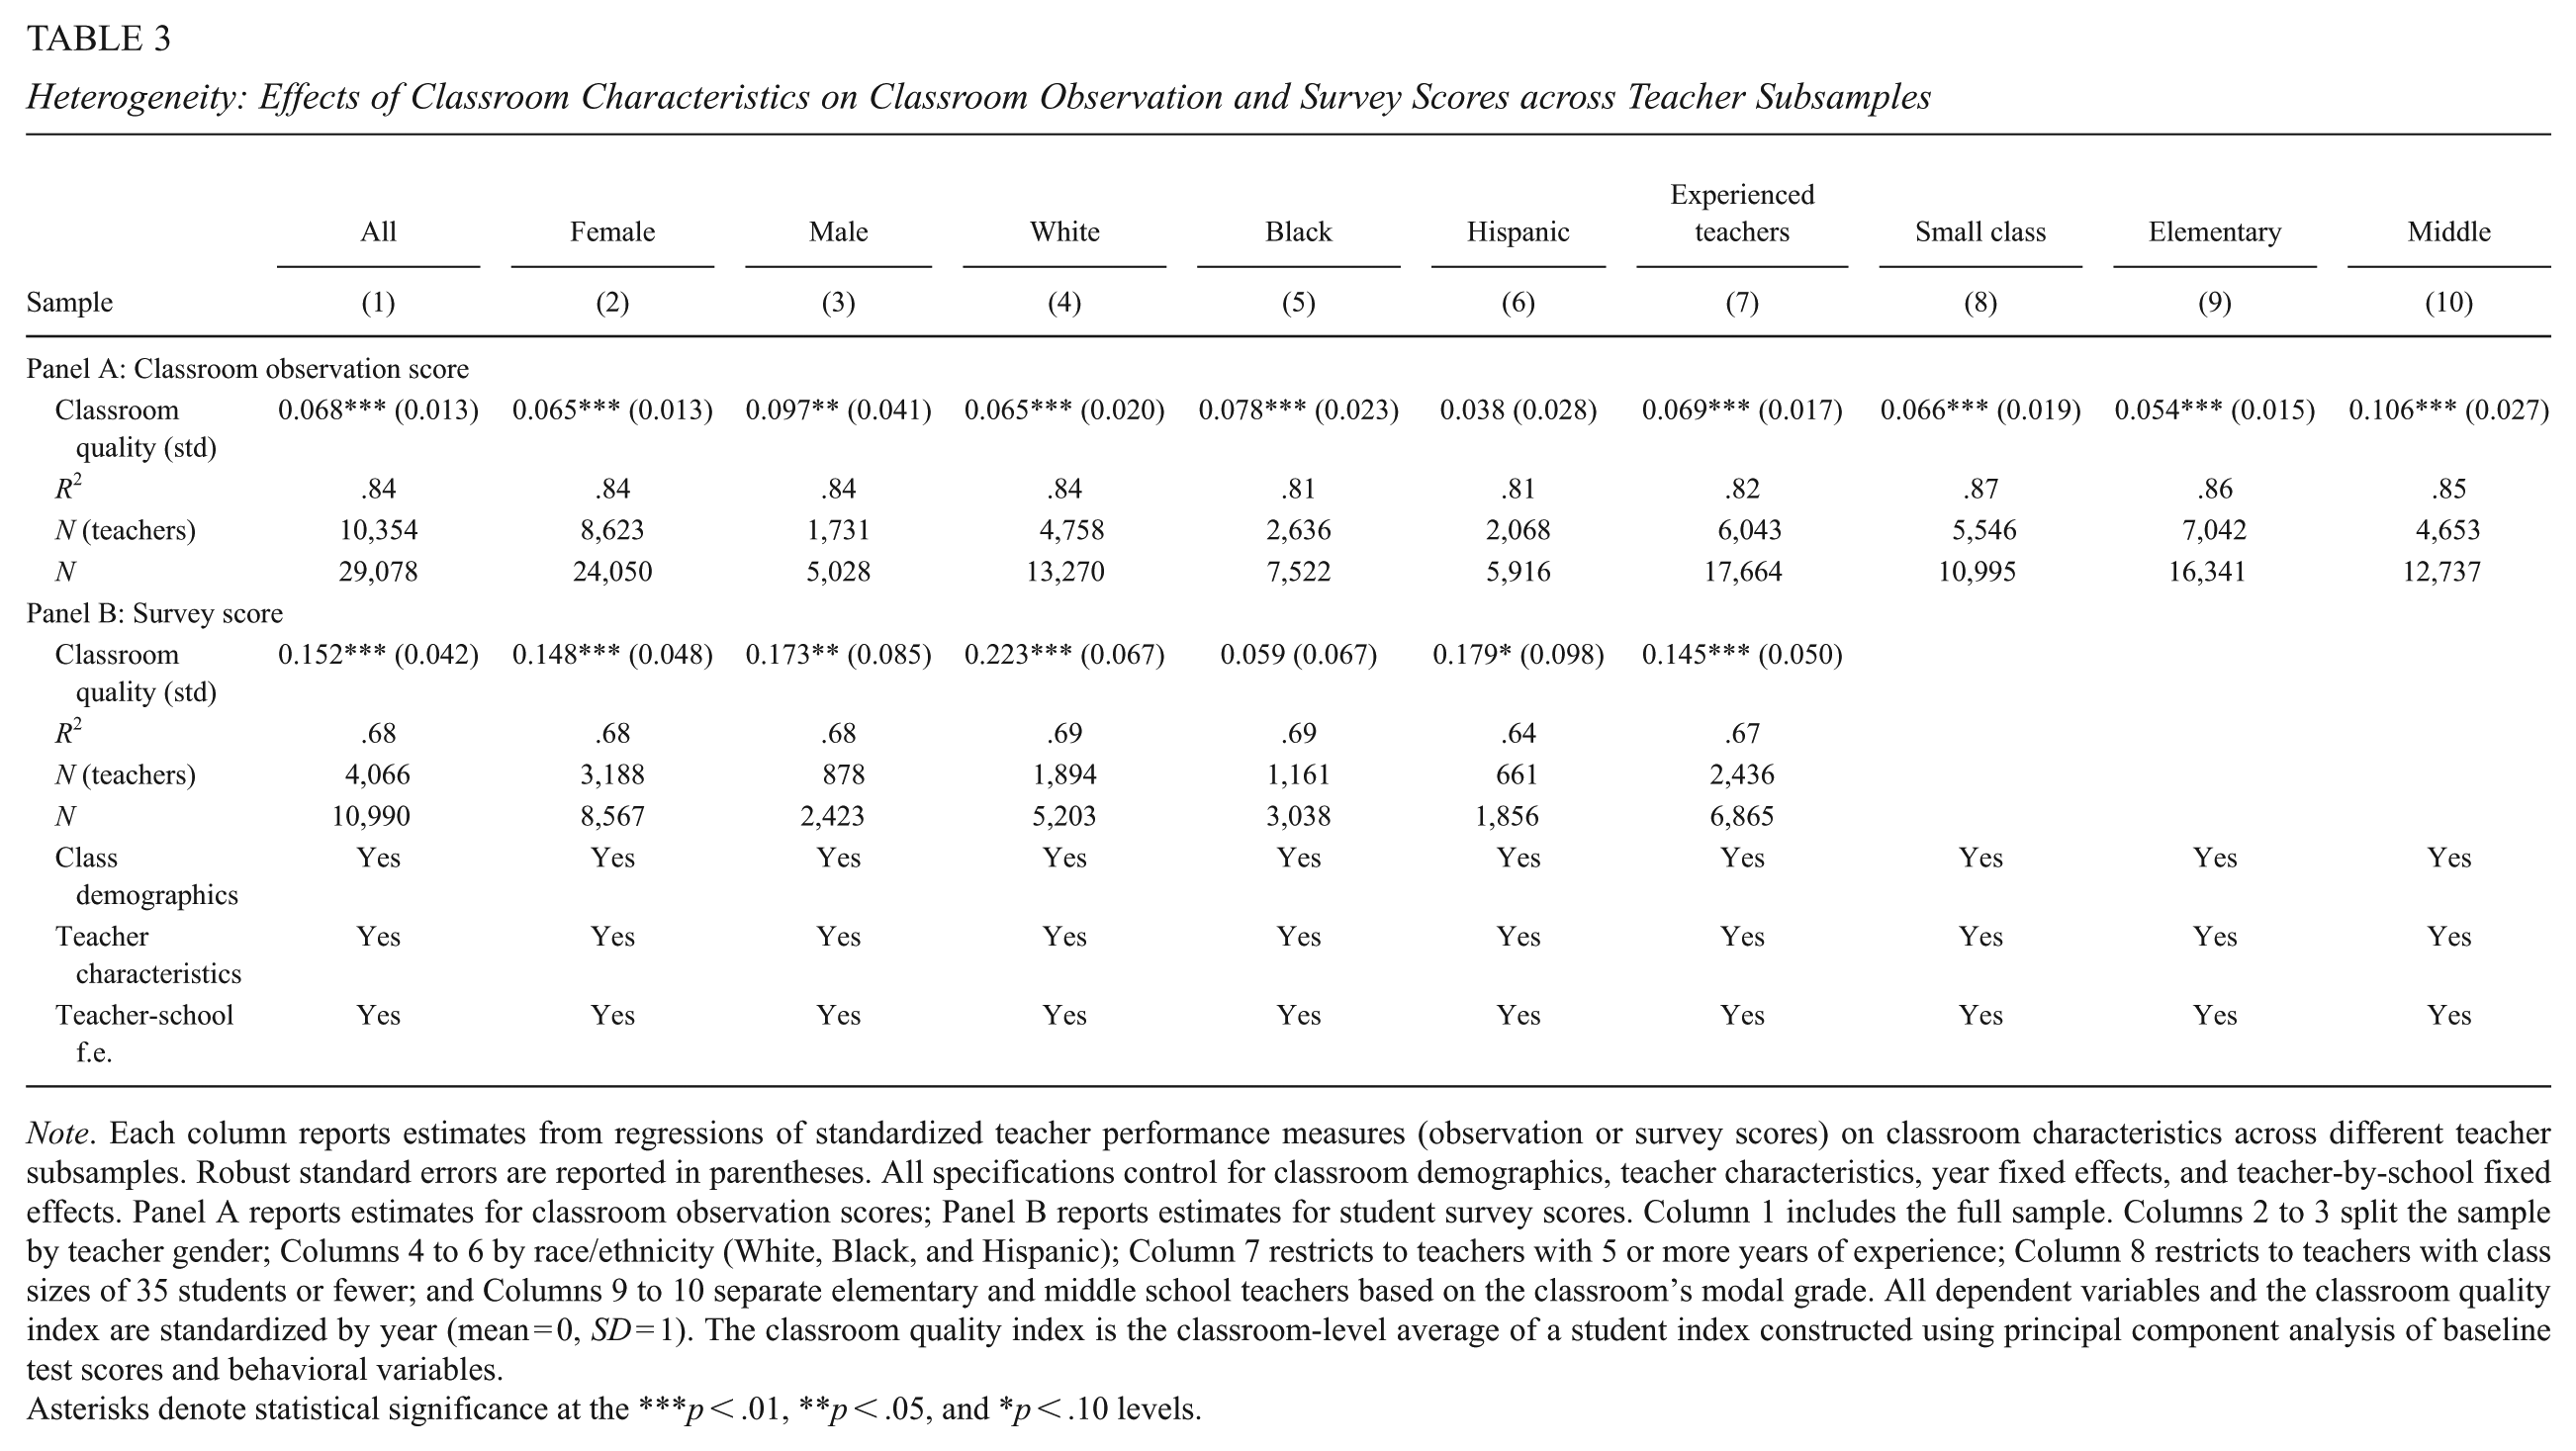
Note. Each column reports estimates from regressions of standardized teacher performance measures (observation or survey scores) on classroom characteristics across different teacher subsamples. Robust standard errors are reported in parentheses. All specifications control for classroom demographics, teacher characteristics, year fixed effects, and teacher-by-school fixed effects. Panel A reports estimates for classroom observation scores; Panel B reports estimates for student survey scores. Column 1 includes the full sample. Columns 2 to 3 split the sample by teacher gender; Columns 4 to 6 by race/ethnicity (White, Black, and Hispanic); Column 7 restricts to teachers with 5 or more years of experience; Column 8 restricts to teachers with class sizes of 35 students or fewer; and Columns 9 to 10 separate elementary and middle school teachers based on the classroom’s modal grade. All dependent variables and the classroom quality index are standardized by year (mean = 0, SD = 1). The classroom quality index is the classroom-level average of a student index constructed using principal component analysis of baseline test scores and behavioral variables.
Asterisks denote statistical significance at the ***p < .01, **p < .05, and *p < .10 levels.
Table 4 presents heterogeneity results by baseline teacher quality, measured by either prior-year observation score (Columns 1–3) or value-added (Columns 4–6). Panel A Columns 1 and 4 confirm the main findings for the subset of teachers with available prior-year data: a 1 SD increase in classroom quality raises observation scores by about 0.05–0.06 SD, and this estimate is stable when controlling for baseline quality (Columns 2 and 5). To test whether higher-quality teachers benefit more from higher-achieving classrooms, we interact the classroom quality index with the baseline quality measures (Columns 3 and 6). For observation scores, the interaction with prior observation score is marginally significant (p < 0.10), but the interaction with prior value-added is not. For survey scores (Panel B), neither interaction term is statistically significant. Overall, we find little evidence that the effect of classroom quality differs systematically by teachers’ demographic characteristics or their prior performance. The positive classroom quality effect is broadly similar across teacher types.
Heterogeneity: Effects of Classroom Characteristics on Classroom Observation and Survey Scores by Baseline Teacher Quality
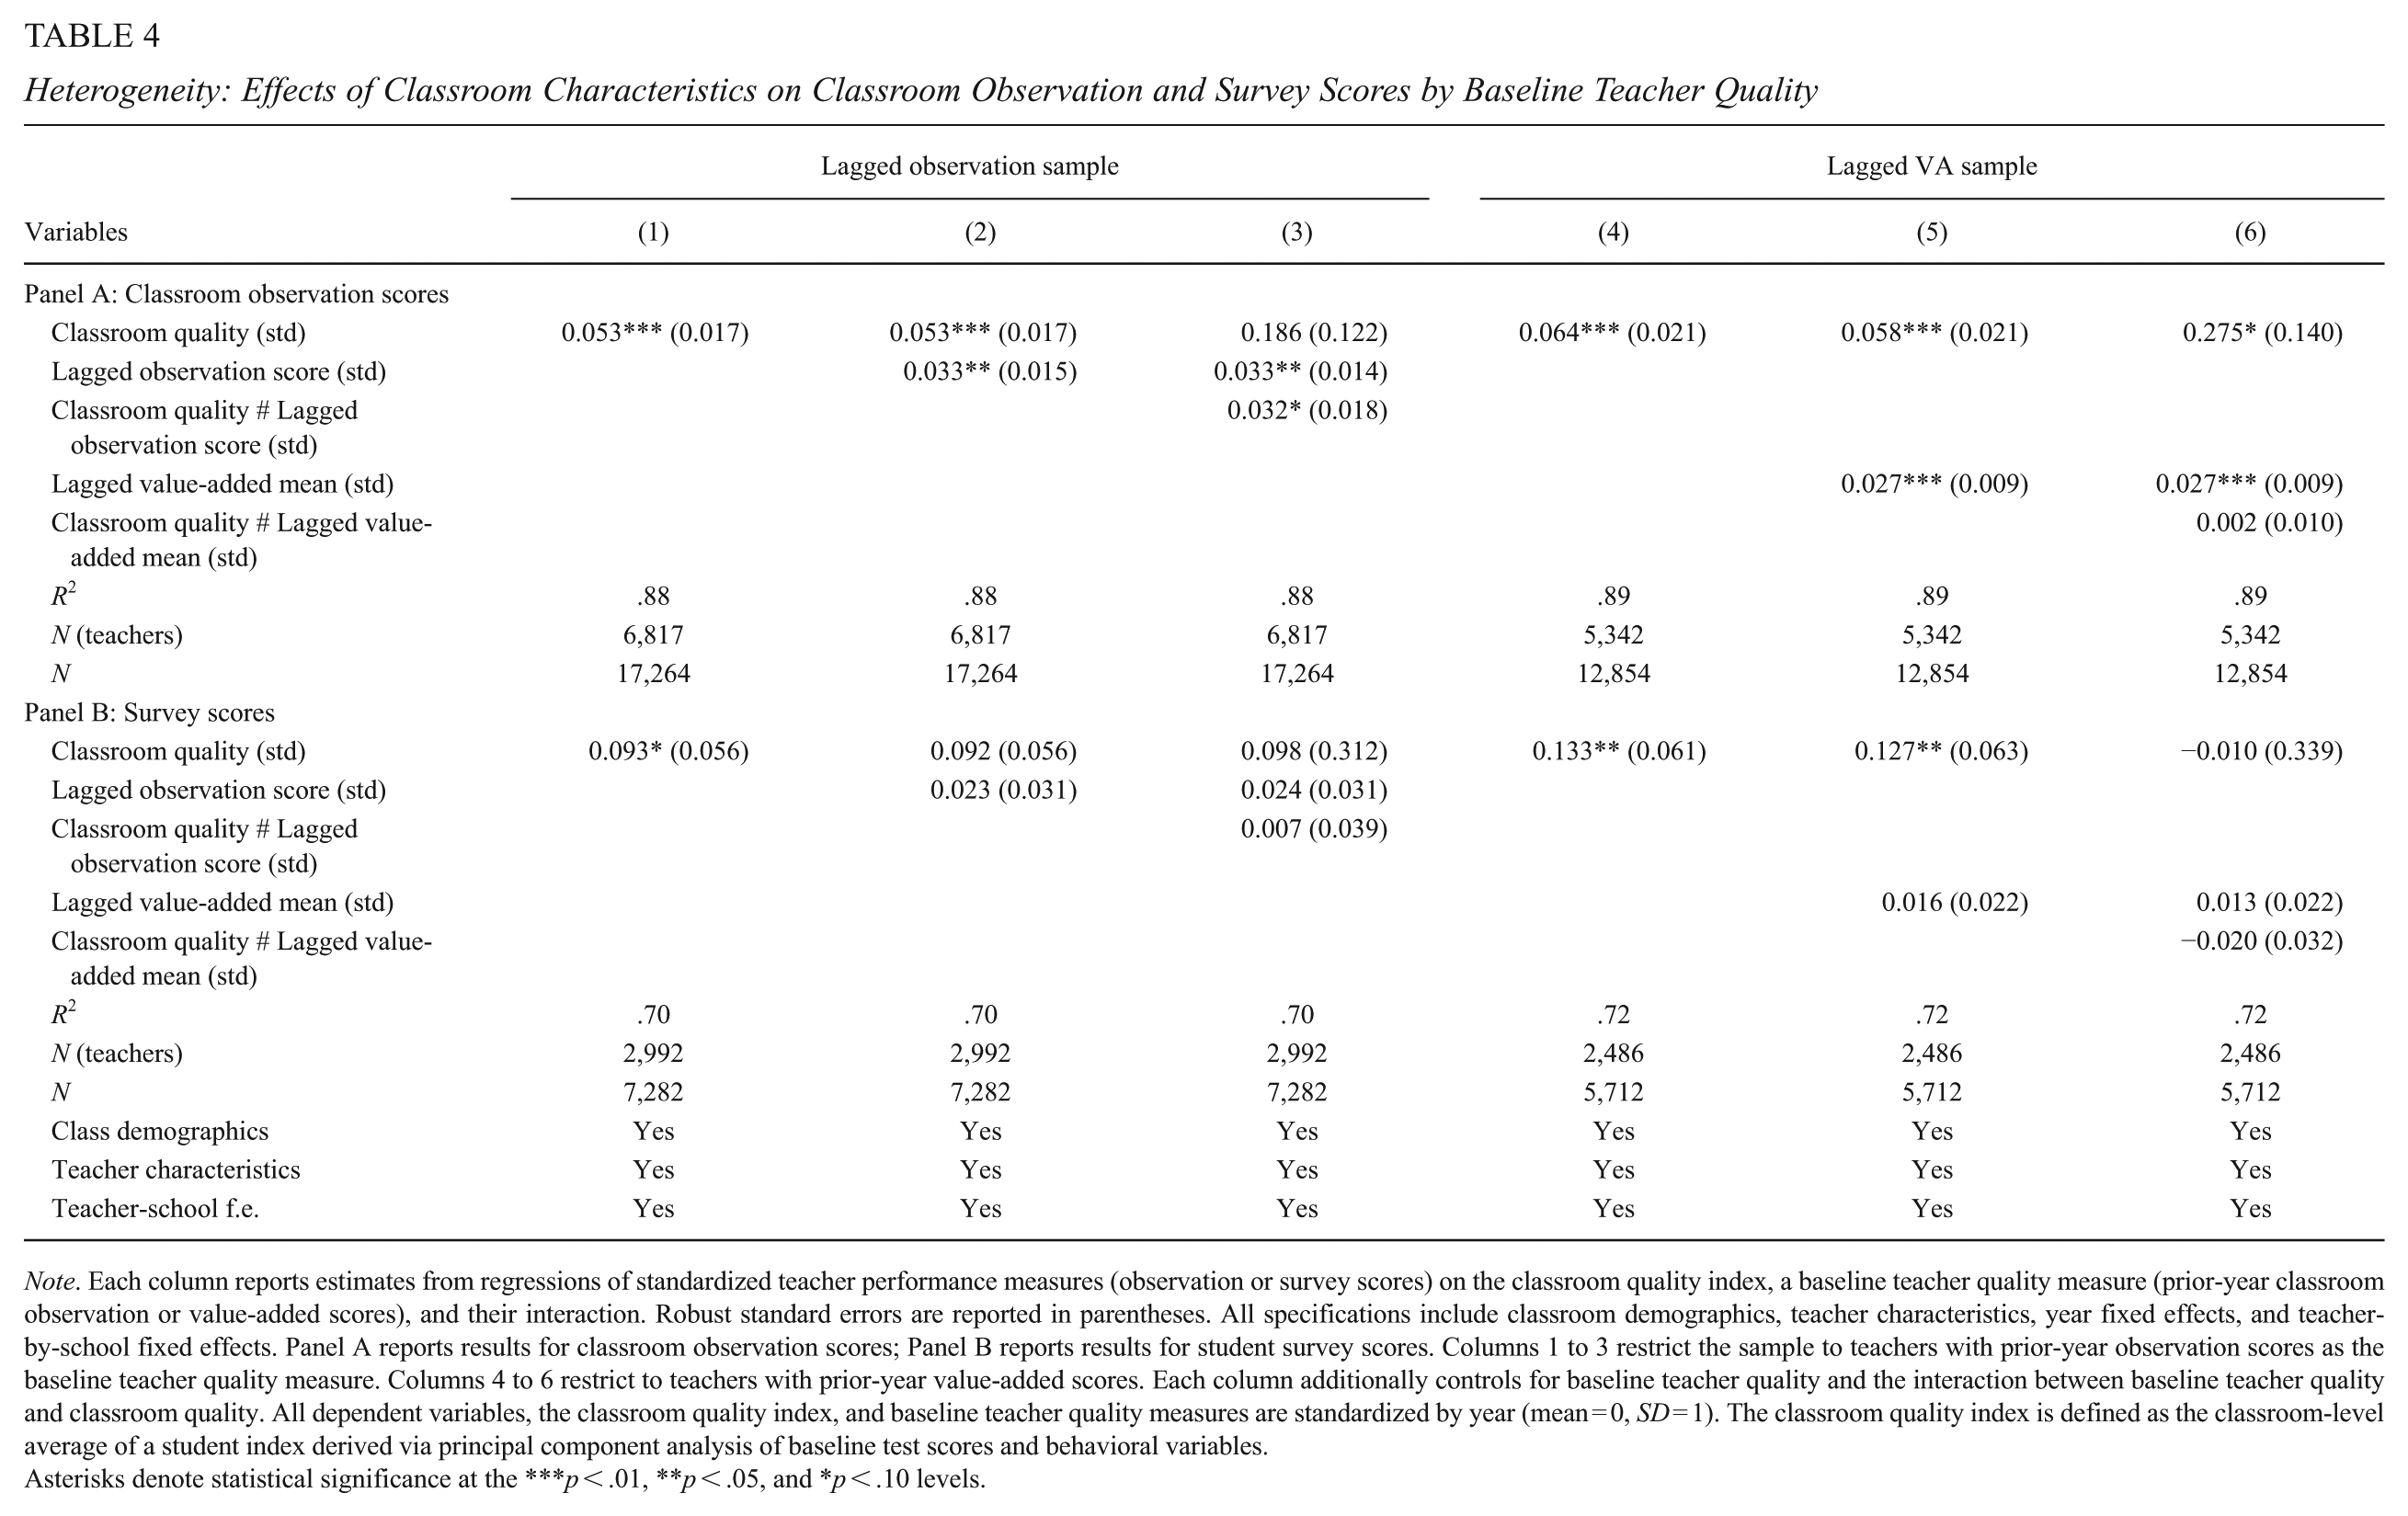
Note. Each column reports estimates from regressions of standardized teacher performance measures (observation or survey scores) on the classroom quality index, a baseline teacher quality measure (prior-year classroom observation or value-added scores), and their interaction. Robust standard errors are reported in parentheses. All specifications include classroom demographics, teacher characteristics, year fixed effects, and teacher-by-school fixed effects. Panel A reports results for classroom observation scores; Panel B reports results for student survey scores. Columns 1 to 3 restrict the sample to teachers with prior-year observation scores as the baseline teacher quality measure. Columns 4 to 6 restrict to teachers with prior-year value-added scores. Each column additionally controls for baseline teacher quality and the interaction between baseline teacher quality and classroom quality. All dependent variables, the classroom quality index, and baseline teacher quality measures are standardized by year (mean = 0, SD = 1). The classroom quality index is defined as the classroom-level average of a student index derived via principal component analysis of baseline test scores and behavioral variables.
Asterisks denote statistical significance at the ***p < .01, **p < .05, and *p < .10 levels.
Robustness Checks
We conduct two main robustness checks to address potential threats to validity. First, a potential concern is dynamic sorting, whereby our results are driven by a spurious correlation between classroom assignments and unobserved, time-varying teacher skill. For example, teachers who are improving might be systematically assigned higher-achieving students. Our main specification already controls for experience (and experience squared), and Table 4 shows the results are robust to controlling for prior-year effectiveness. To further address this, we restrict the sample to experienced teachers (5+ years), whose effectiveness is likely more stable (Rockoff, 2004). As shown in Table 4, Column 7, the classroom quality effect remains similar in magnitude for this group for both observation and survey scores. This suggests our findings are not primarily driven by the sorting of teachers on unobserved gains in effectiveness.
Second, for teachers with multiple class sections, our pooled classroom roster may introduce measurement error. The characteristics of the pooled roster may not perfectly match those of the specific classroom section that was observed. To mitigate this, we restrict the analysis to two subsamples where measurement error is less likely: teachers with small class sizes (
Plausibility of Exogenous Variation
We assess Assumption 1, that within-teacher changes in classroom composition are as good as random with respect to time-varying determinants of teacher quality, using placebo tests. If classroom shocks are exogenous, the classroom quality index should not predict past or future performance once teacher fixed effects are included.
Table 5 reports regressions of teacher performance on the current classroom quality index, replacing the outcome with lagged (
Exogeneity Checks: Placebo Tests for the Effects of Classroom Characteristics on Prior and Future-Year Observation and Survey Scores
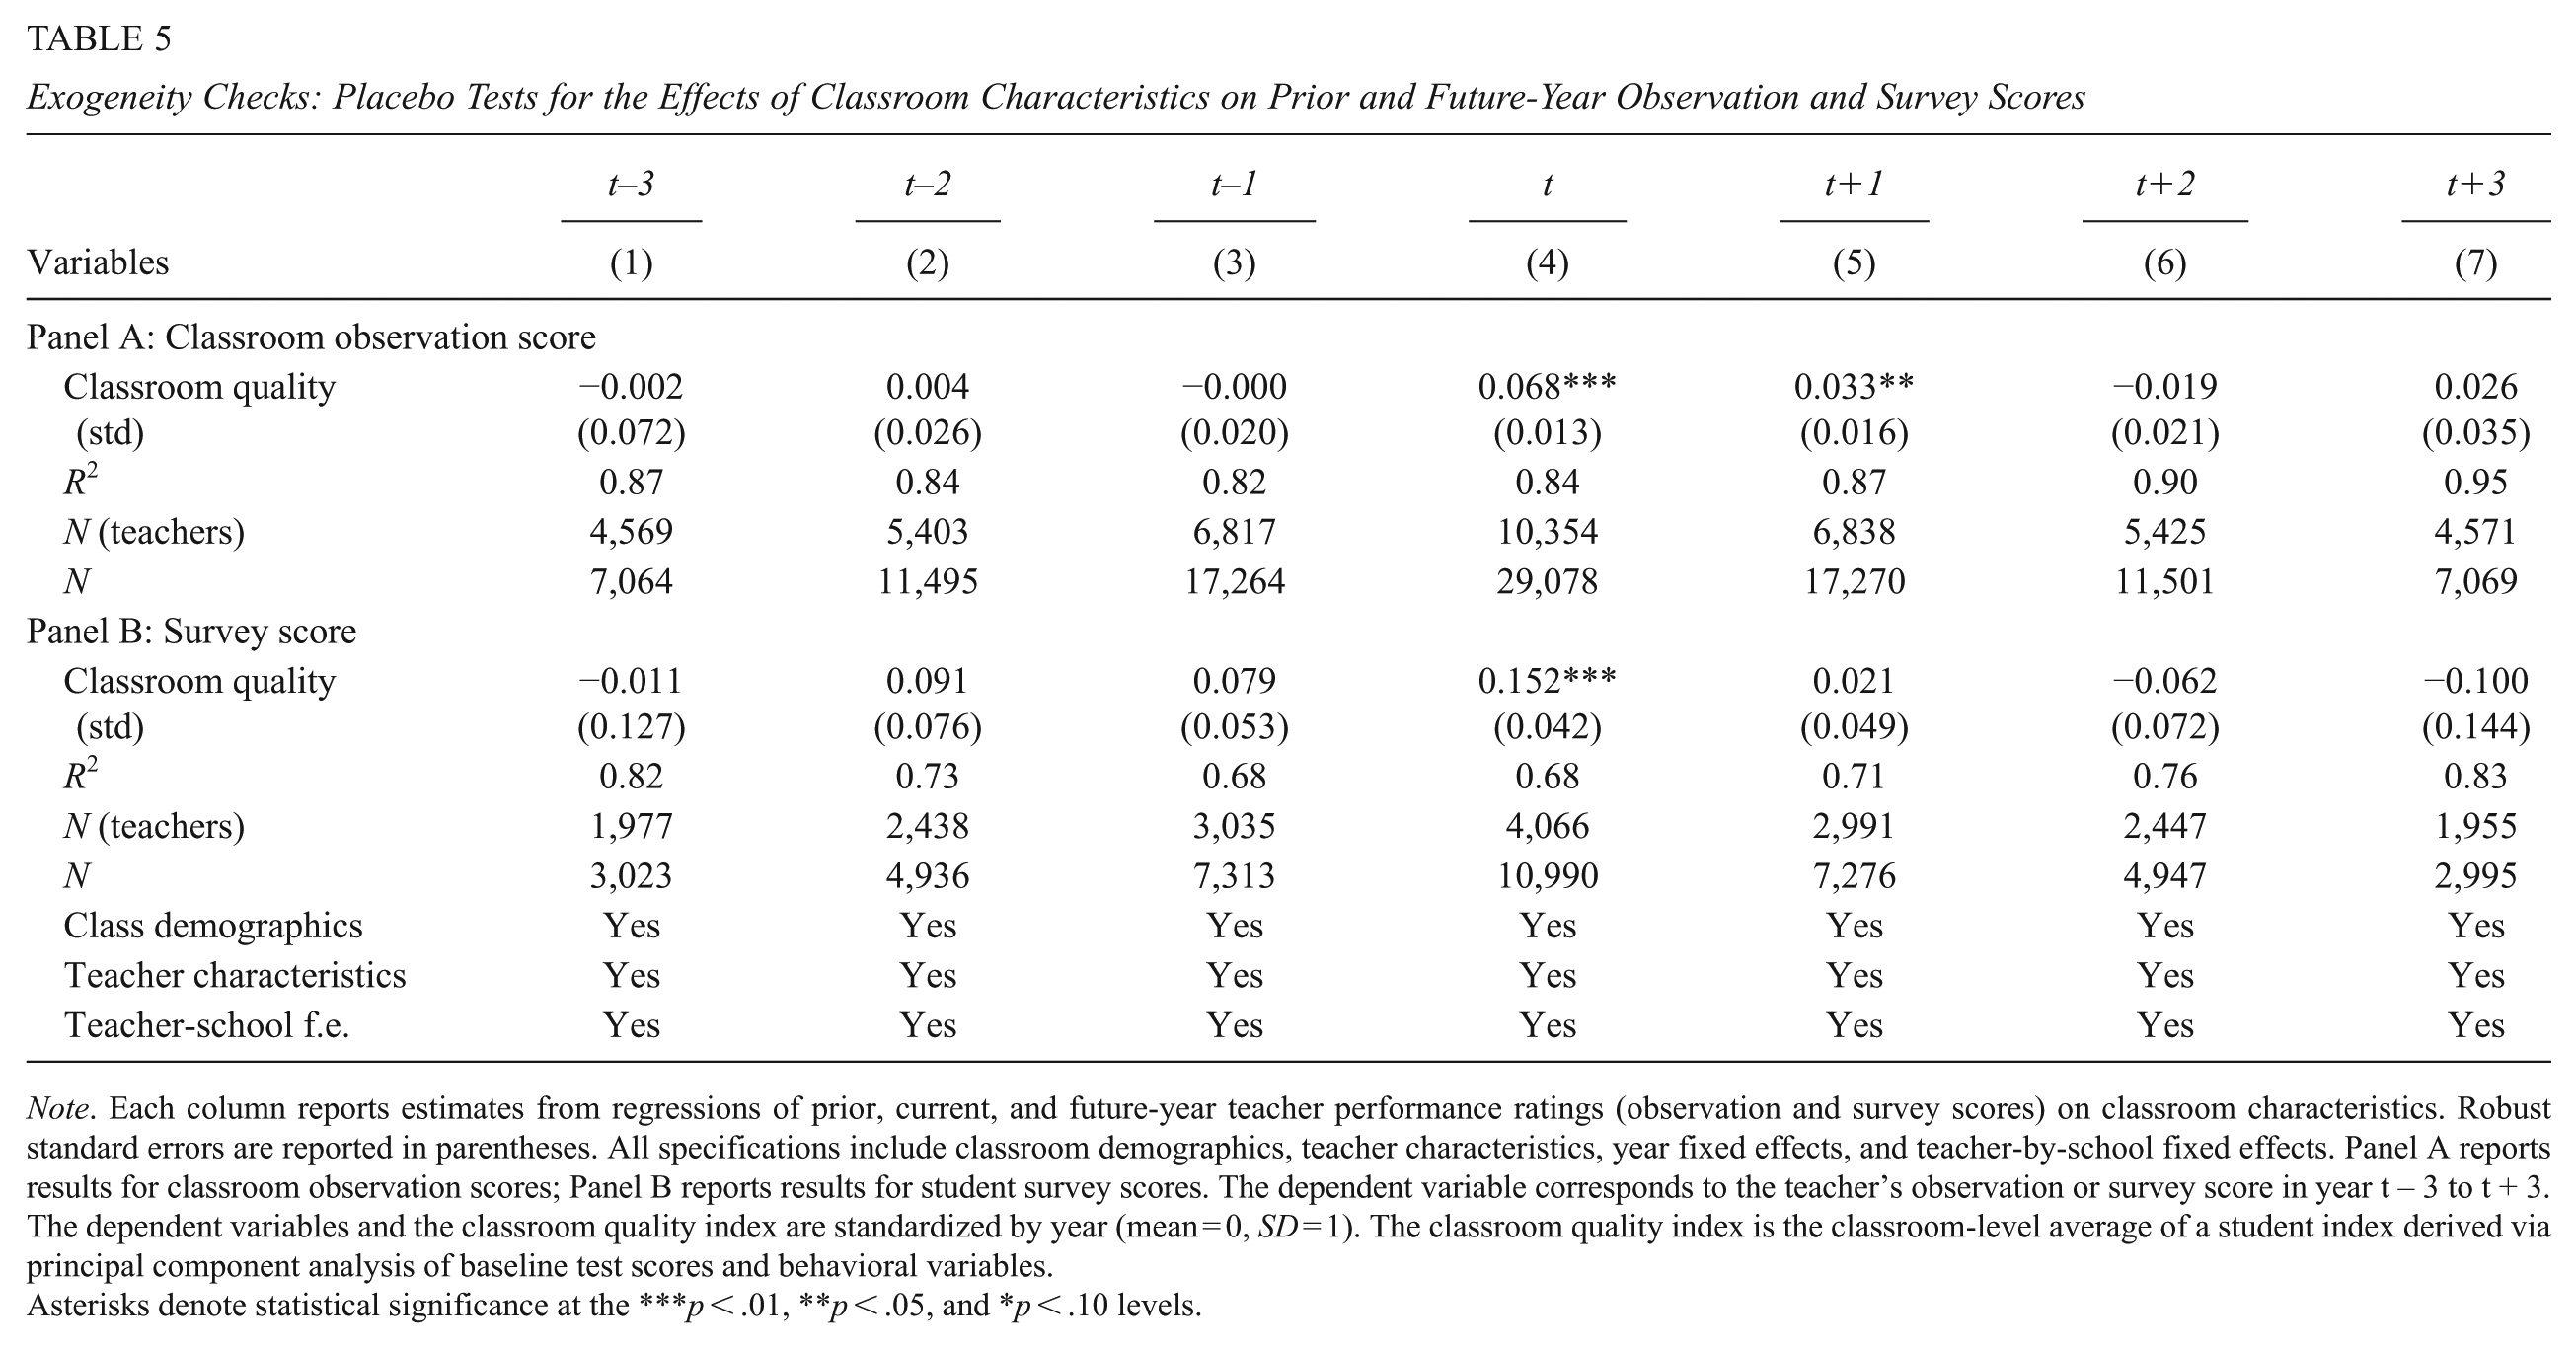
Note. Each column reports estimates from regressions of prior, current, and future-year teacher performance ratings (observation and survey scores) on classroom characteristics. Robust standard errors are reported in parentheses. All specifications include classroom demographics, teacher characteristics, year fixed effects, and teacher-by-school fixed effects. Panel A reports results for classroom observation scores; Panel B reports results for student survey scores. The dependent variable corresponds to the teacher’s observation or survey score in year t – 3 to t + 3. The dependent variables and the classroom quality index are standardized by year (mean = 0, SD = 1). The classroom quality index is the classroom-level average of a student index derived via principal component analysis of baseline test scores and behavioral variables.
Asterisks denote statistical significance at the ***p < .01, **p < .05, and *p < .10 levels.
We further test for correlated shocks by examining whether changes in the classroom quality index are associated with changes in other classroom demographics (Supplemental Appendix Table A11). Without fixed effects, demographic shares (e.g., male, Black, FRPL, and special education) strongly predict lagged, current, and future classroom quality (Columns 1, 3, and 5). With teacher fixed effects (Columns 2, 4, and 6), contemporaneous correlations remain as one would expect—higher-achieving classes are, in the same year, associated with fewer male, Black, FRPL, and special education students and more non-Black non-Hispanic students (Column 4)—but these relationships largely disappear in lagged and future years, with the exception of special education at
Exploring Mechanisms: Student–Teacher Interaction Versus Evaluator Bias
Having established that classroom composition influences teacher ratings, we now explore the underlying mechanisms. Classroom effects on teacher performance ratings could generate from at least two channels. First, evaluator bias: raters may (consciously or not) attribute favorable classroom behaviors or achievement to the teacher, inflating scores when students are easier to teach. Second, student–teacher interaction: classroom composition may influence actual teaching practice (e.g., pacing, classroom management, and differentiation), thereby raising genuine performance. 9 Both mechanisms are consistent with prior work documenting sensitivity of classroom observation scores to incoming achievement and racial/ethnic composition (e.g., Campbell & Ronfeldt, 2018; Steinberg & Garrett, 2016; Whitehurst et al., 2014) and with evidence of disparate teacher impacts by student characteristics and student–teacher demographic match effects (e.g., Aucejo et al., 2022; Biasi et al., 2021; Dee, 2004, 2007; Delgado, 2025; Egalite et al., 2015; Gershenson et al., 2022; Loeb et al., 2014).
In our conceptual model, consider observed teacher practice

If shifts
We implement two empirical tests. First, heterogeneity by baseline teacher quality. If student–teacher interaction (i.e., match) is the primary channel, higher-quality teachers might benefit differentially when assigned higher-achieving classes. As mentioned before, in Table 4, the interaction terms between classroom quality and prior-year teacher effectiveness (measured by either observation scores or value-added) are consistently small and statistically indistinguishable from zero for both observation and survey scores. This suggests that teachers of all baseline effectiveness levels benefit similarly from being assigned a higher-achieving class, consistent with evaluator bias or with a broadly similar interaction effect across teachers rather than large, systematic amplification for higher-quality teachers.
Second, we examine teacher productivity measures based on student learning. If higher-achieving classrooms genuinely make teachers more effective, this enhanced productivity should translate into greater student test score growth. Conversely, if the effect on subjective ratings is driven by evaluator bias, there should be no corresponding positive effect on student-outcome-based measures.
We test this using two student-growth metrics: district-developed performance tasks (all subjects) and value-added (standardized English and math tests). Table 6 presents the results. While a 1 SD increase in the classroom quality index raises observation scores by 0.07–0.08 SD (Columns 1 and 4), the same change is associated with a statistically significant decrease in both performance task scores (Column 3) and value-added scores (Column 6). The negative relationship may arise because students with higher baseline achievement have less room to grow. Regardless of the reason, the key finding is the stark opposition: classroom characteristics that positively predict subjective performance ratings negatively predict objective measures of student learning. This result is difficult to reconcile with the student–teacher interaction hypothesis and points instead toward evaluator bias as the primary mechanism.
Effects of Classroom Characteristics on Teacher Productivity Measures
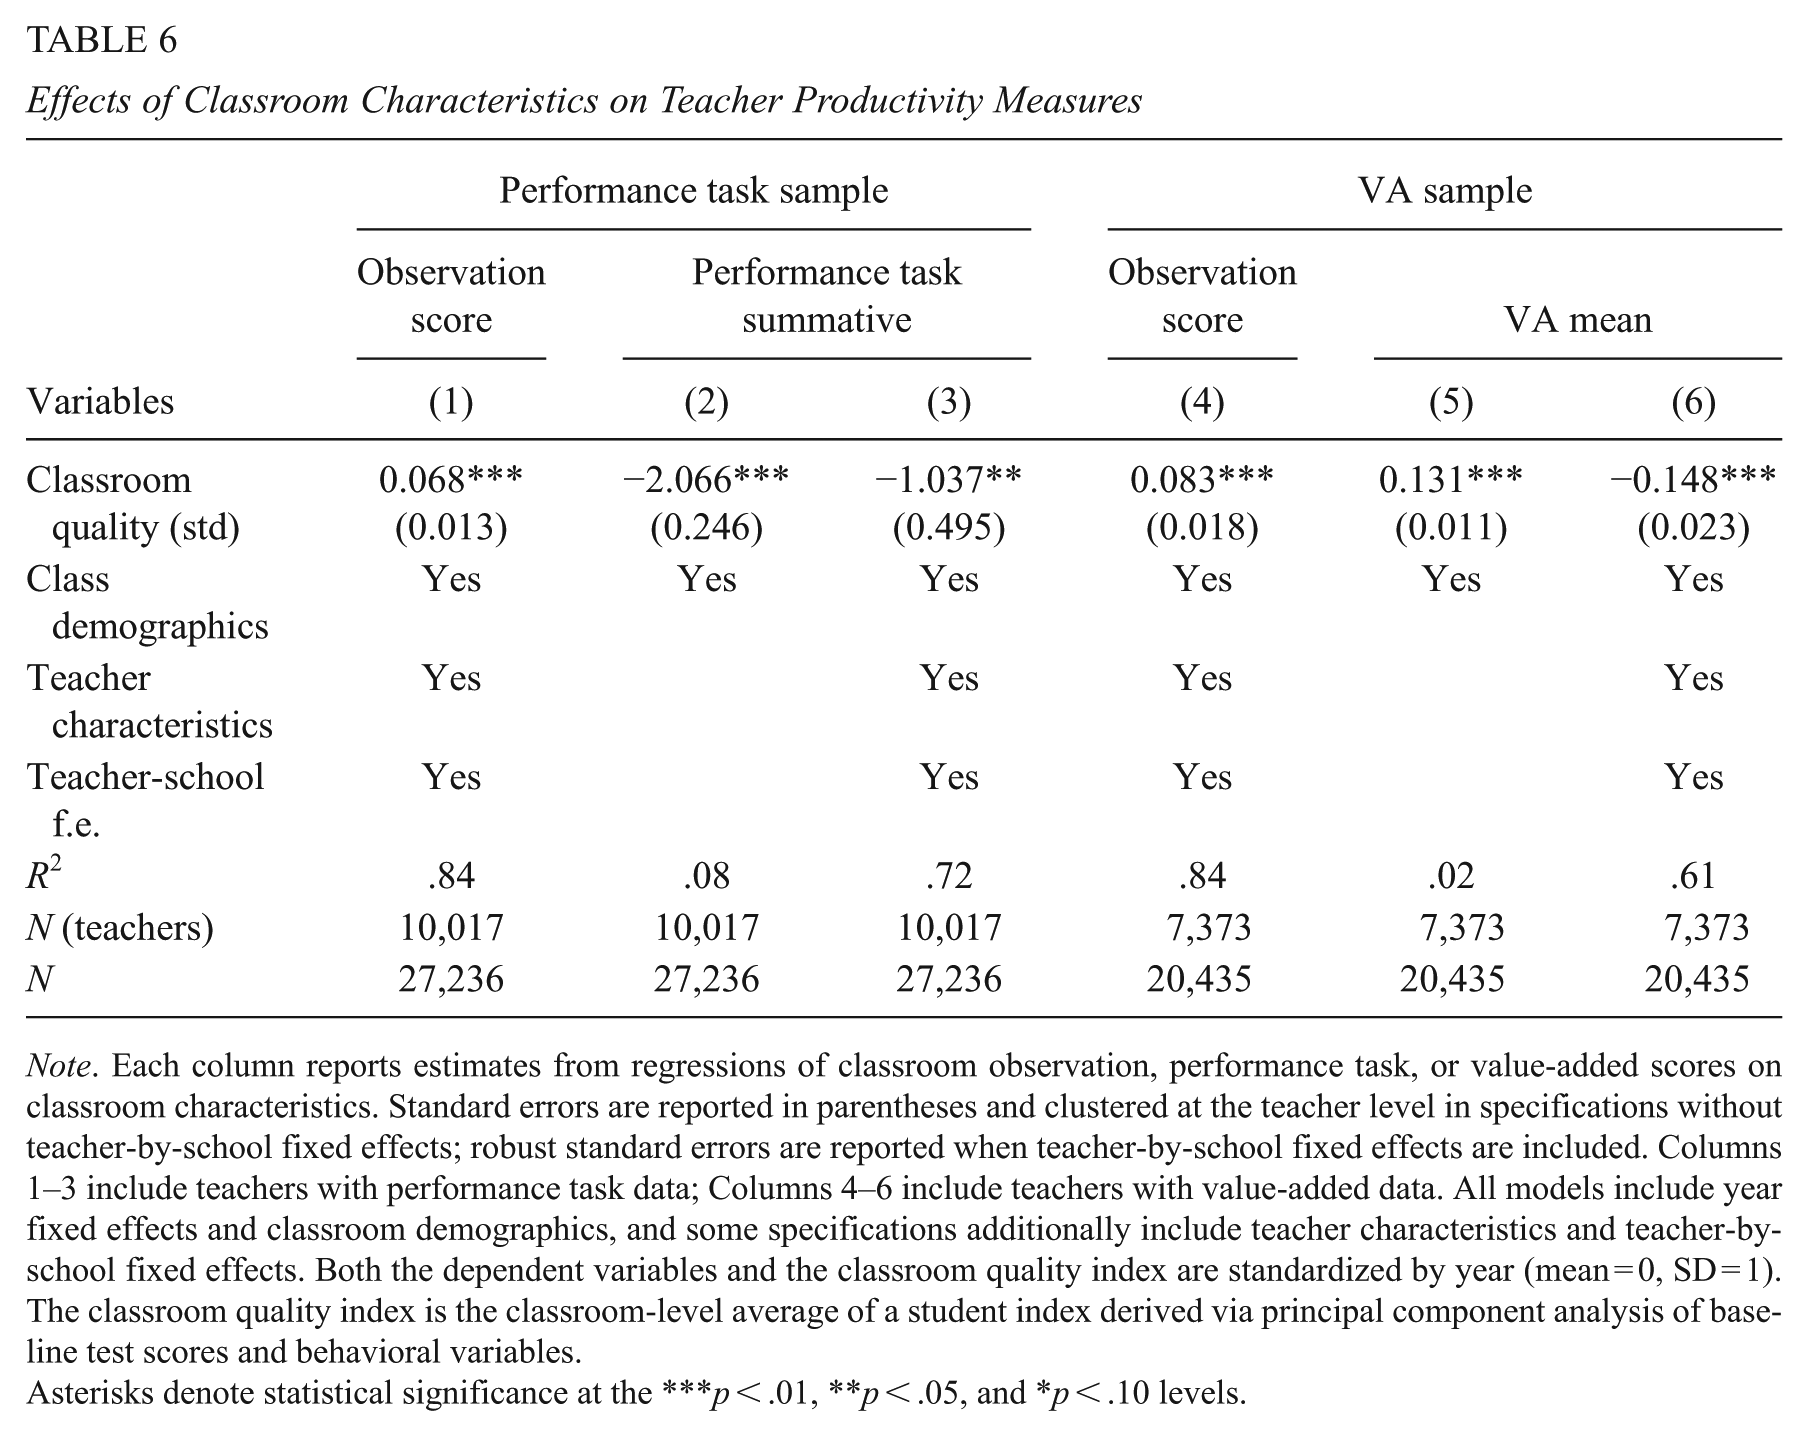
Note. Each column reports estimates from regressions of classroom observation, performance task, or value-added scores on classroom characteristics. Standard errors are reported in parentheses and clustered at the teacher level in specifications without teacher-by-school fixed effects; robust standard errors are reported when teacher-by-school fixed effects are included. Columns 1–3 include teachers with performance task data; Columns 4–6 include teachers with value-added data. All models include year fixed effects and classroom demographics, and some specifications additionally include teacher characteristics and teacher-by-school fixed effects. Both the dependent variables and the classroom quality index are standardized by year (mean = 0, SD = 1). The classroom quality index is the classroom-level average of a student index derived via principal component analysis of baseline test scores and behavioral variables.
Asterisks denote statistical significance at the ***p < .01, **p < .05, and *p < .10 levels.
In summary, our quasi-experimental results show that both evaluator and student ratings are positively influenced by the composition of the classroom, particularly the prior achievement and behavior of students. Our exogeneity tests suggest this relationship is plausibly causal. Furthermore, our exploration of mechanisms indicates that these effects are not reflected in outcome-based measures of teacher productivity, pointing to evaluator bias rather than genuine changes in teacher effectiveness as the likely driver. Given these findings, by accounting for the influence of classroom composition, educational systems can develop fairer and more accurate evaluation systems, better supporting teacher development and improving student outcomes. Strategies could include training evaluators, benchmarking teachers against those with similar classrooms, or applying statistical adjustments to performance ratings.
Policy Simulations
Classroom observation scores are a critical component of teacher evaluations, often carrying the most weight in personnel decisions. For example, in Washington, D.C. Public Schools (DCPS), observation scores account for 40%–65% of a teacher’s evaluation, while student surveys are weighted at 10% (District of Columbia Public Schools, 2022). In our context, observation scores account for a substantial 70% of the overall evaluation, and student surveys are currently excluded. Given our evidence that teachers assigned to classrooms with more disadvantaged students tend to receive lower observation scores, this section conducts a policy counterfactual to assess the impact of adjusting performance ratings for classroom composition. 10 We identify which teacher groups would benefit from a more equitable evaluation system.
Adjusting Teacher Performance Ratings for Classroom Composition
We investigate two approaches to mitigate the influence of classroom context on subjective performance measures.
Tournament-Style Adjustment
The first approach compares teachers only within groups of classrooms that share a similar composition, akin to establishing a tournament within more homogeneous contexts. Teachers are divided into two (below- and above-median) or three (low-, medium-, and high-index) groups based on the classroom quality index. A teacher’s adjusted rank is then determined by their performance within their composition-based peer group. This approach directly addresses sorting by comparing like-with-like.
Regression-Based Adjustment
The second approach is a regression-based adjustment similar to methods used for value-added modeling. ust as VAM adjusts student test scores for prior achievement and student demographics to isolate the teacher effect, we adjust observation scores by classroom quality index, thus increasing scores for teachers with more disadvantaged students and decreasing scores for those with more advantaged students.
We first estimate the influence of classroom characteristics on performance ratings by modifying Equation 4:

where

This residual
Figure 1 compares the distributions of unadjusted and adjusted scores. For classroom observation scores, the adjustment attenuates the relationship between test score quartiles and observation ratings (Panels A and B). After adjustment, teachers are more evenly distributed across observation score quartiles regardless of their students’ baseline achievement. For student surveys, the distribution remains largely unchanged (Panels C and D), as the unadjusted distribution was evenly distributed.
Properties of Regression-Adjusted Scores
The regression-based adjustment preserves the core properties of the ratings. The correlation between adjusted and unadjusted classroom observation scores is high
Who Would Benefit From Adjusting for Classroom Composition?
To evaluate the policy impact of adjusting scores, we rank all teachers based on their (1) unadjusted rating (baseline) and (2) adjusted rating (policy counterfactual). The change in ranking is calculated as the difference between the adjusted and unadjusted percentile ranks (a positive change indicates improvement). We also define two tail indicators: exiting the bottom 5%, an indicator equal to 1 if a teacher moves above the 5th percentile after adjustment, conditional on being below it before, and exiting the top 5%, an indicator equal to 1 if a teacher moves below the 95th percentile after adjustment, conditional on being above it before. We then regress these outcome variables on teacher characteristics.
Within-Group Tournament Policy
Columns 1–3 of Table 7 report the results for the two-group tournament (below vs. above-median classroom quality index). Black teachers experience an average ranking gain of 7.2 percentile points relative to White teachers, while Hispanic teachers gain about 2.1 points. Novice teachers also see a modest improvement (0.7 percentile points), as do male teachers (0.5) and teachers without National Board Certification (0.7). At the distribution’s lower tail, Black teachers are 7 percentage points more likely to move out of the bottom 5% after adjustment. The three-group tournament (low-, medium-, and high-quality classrooms; Columns 4–6) yields qualitatively similar results.
Teacher Characteristics and the Effects of Adjusting Observation Scores for Classroom Composition
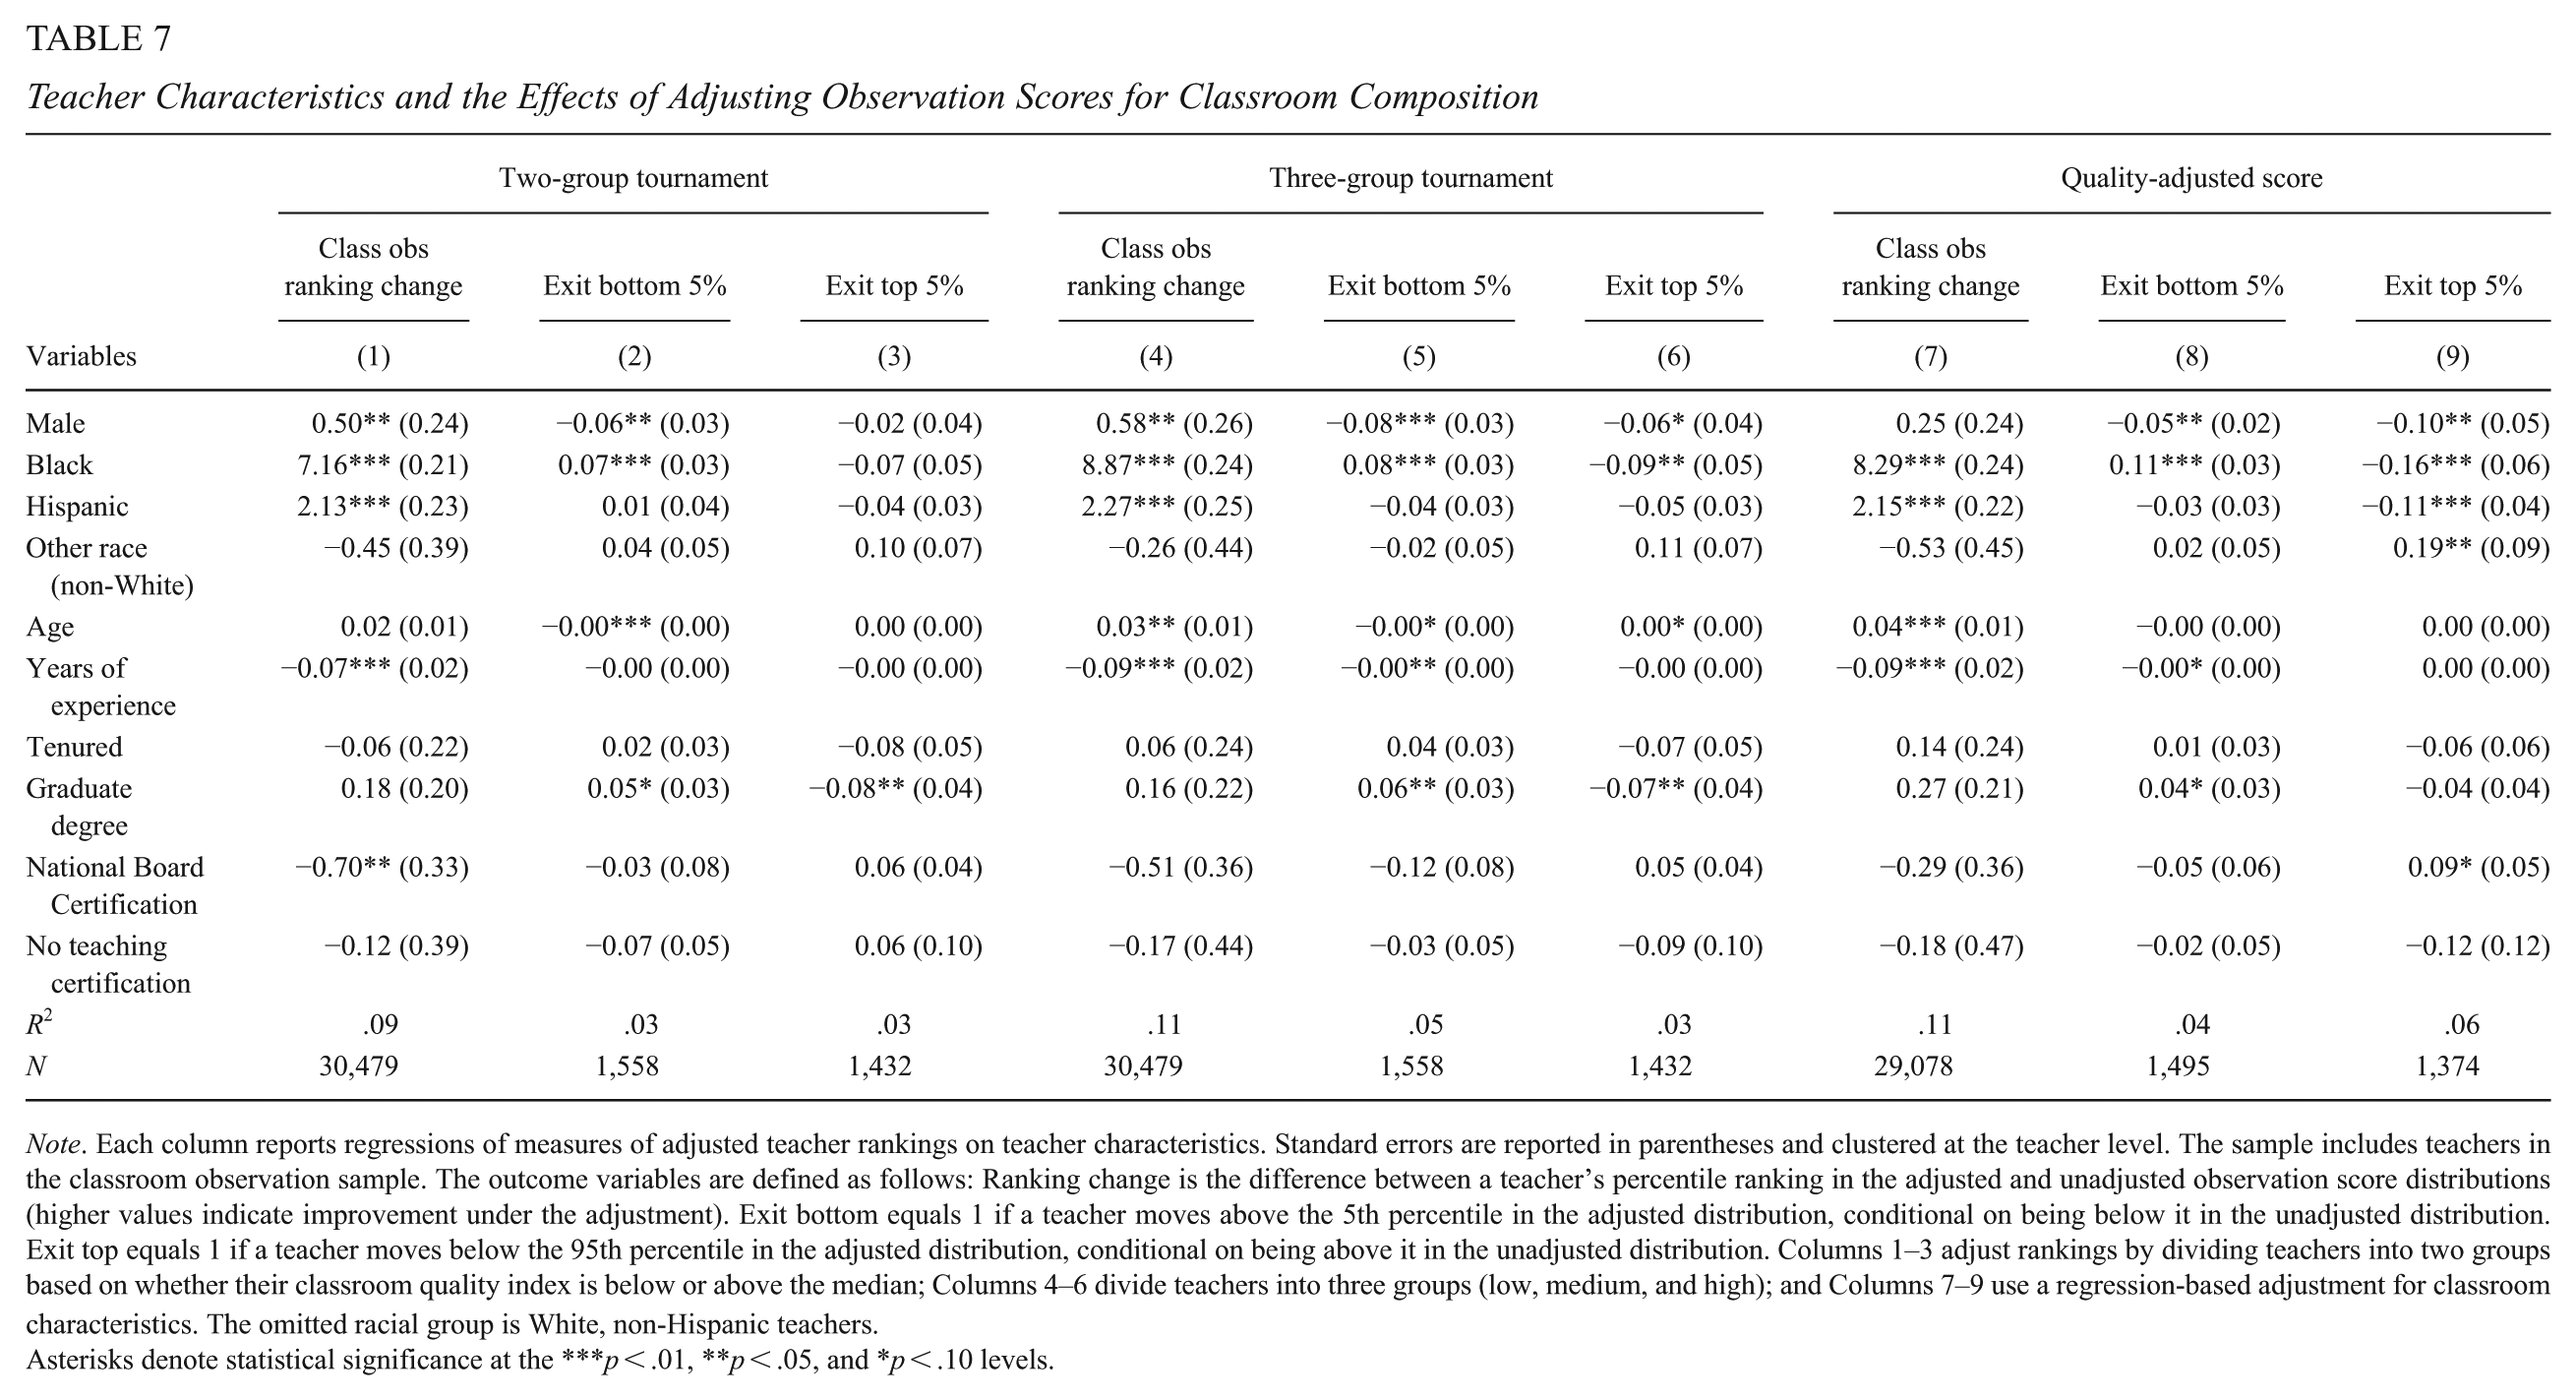
Note. Each column reports regressions of measures of adjusted teacher rankings on teacher characteristics. Standard errors are reported in parentheses and clustered at the teacher level. The sample includes teachers in the classroom observation sample. The outcome variables are defined as follows: Ranking change is the difference between a teacher’s percentile ranking in the adjusted and unadjusted observation score distributions (higher values indicate improvement under the adjustment). Exit bottom equals 1 if a teacher moves above the 5th percentile in the adjusted distribution, conditional on being below it in the unadjusted distribution. Exit top equals 1 if a teacher moves below the 95th percentile in the adjusted distribution, conditional on being above it in the unadjusted distribution. Columns 1–3 adjust rankings by dividing teachers into two groups based on whether their classroom quality index is below or above the median; Columns 4–6 divide teachers into three groups (low, medium, and high); and Columns 7–9 use a regression-based adjustment for classroom characteristics. The omitted racial group is White, non-Hispanic teachers.
Asterisks denote statistical significance at the ***p < .01, **p < .05, and *p < .10 levels.
For student surveys, adjusting student survey scores has a negligible impact (Supplemental Appendix Table A13). This is expected, as we previously established that survey scores were already equally distributed across classroom settings (Figure 1, Panel C). Black teachers experience a modest 0.2–0.6 percentile improvement, and Hispanic teachers at most 0.2 percentile points.
Regression-Based Adjustment Policy
Columns 7–9 of Table 7 implement the regression-based adjustment (Equation 6). Under this approach, Black teachers experience the largest gains: an average improvement of 8.3 percentile points, an 11 percentage-point higher probability of exiting the bottom 5%, and a 16 percentage-point higher likelihood of remaining in the top 5%. Hispanic and novice teachers also benefit, though to a smaller extent.
Discussion and Conclusions
This article provides new evidence on the effect of classroom composition on subjective teacher performance measures, specifically rubric-based classroom observation scores and student survey ratings, using panel data from CPS. School districts rely on these measures to inform high-stakes personnel decisions.
Our findings show that teachers receive significantly higher observation and survey ratings in years when they teach higher-achieving, better-behaved students, even when the same teacher remains in the same school. In contrast, most demographic characteristics, such as student race or low-income status, have null or inconsistent effects. These patterns persist across multiple specifications, placebo tests, and robustness checks, suggesting that the results are not driven by teacher sorting or persistent differences in teacher ability.
Taken together, these findings imply that current evaluation systems may partially conflate teaching effectiveness with the composition of students in a teacher’s classroom. Evaluators appear to attribute some portion of student readiness or behavior to teacher skill, potentially rewarding teachers who teach more advantaged students and penalizing those who work with underserved populations. This distortion has important implications for both efficiency and equity in teacher evaluation systems.
From an efficiency standpoint, performance-based personnel decisions may misidentify effective teachers if ratings partly reflect the students they teach rather than their actual practice. Teachers assigned to challenging classrooms could be unfairly labeled as underperforming, discouraging them from remaining in or transferring to schools with higher concentrations of disadvantaged students. Such misclassification could unintentionally exacerbate turnover in precisely the schools most in need of experienced teachers. 11 Nevertheless, even without direct dismissal, such negative evaluations may still carry significant professional and psychological consequences, affecting access to mentoring, development plans, and perceptions of competence.
From an equity standpoint, our policy simulations show that adjusting observation scores for classroom composition would notably improve the relative rankings of Black teachers—by roughly eight percentile points on average—and modestly improve those of Hispanic and novice teachers. Because Black teachers are more likely to teach lower-achieving and higher-need students, unadjusted observation scores systematically disadvantage them. An adjustment for classroom characteristics could reduce this inequity, raising fairness in evaluation outcomes without substantially diminishing the reliability or predictive validity of the ratings.
Nevertheless, adjustments must be applied with care. If more effective teachers tend to sort into higher-achieving classrooms, part of the observed classroom-quality premium may reflect genuine differences in performance rather than evaluator bias. In that case, mechanically adjusting scores could over-correct, masking true variation in teaching effectiveness. The appropriate balance depends on the underlying mechanism—evaluator bias versus student-teacher interaction—and on the objectives of the evaluation system.
More broadly, these findings underscore the difficulty of designing evaluation systems that isolate teaching quality from contextual factors. While much of the prior debate has focused on potential bias in value-added or student-growth measures, our results indicate that subjective observation-based measures are also sensitive to classroom composition. Adjusting observation ratings for classroom composition—or designing evaluations that explicitly control for it—can improve fairness, particularly for teachers serving historically underserved students. By ensuring that evaluation systems measure teaching skill rather than classroom assignment, districts can make more equitable and accurate personnel decisions, support teacher development, and ultimately improve outcomes for all students.
Supplemental Material
sj-docx-1-epa-10.3102_01623737261449250 – Supplemental material for Classroom Composition Affects Teacher Performance Ratings
Supplemental material, sj-docx-1-epa-10.3102_01623737261449250 for Classroom Composition Affects Teacher Performance Ratings by William Delgado and Lauren Sartain in Educational Evaluation and Policy Analysis
Footnotes
Acknowledgements
The authors are extremely grateful to Andrew Zou for outstanding research assistance in early versions of the article. The authors also thank Elaine Allensworth, John Q. Easton, the staff at the UChicago Consortium on School Research, and the staff at Chicago Public Schools, particularly the Talent Office, for helping them use the administrative data and better understand the policy context. The authors are extremely grateful to Seth Zimmerman, Dan Black, Damon Jones, Stephen Raudenbush, and Susan E. Mayer for helpful comments and numerous conversations; Josh Goodman, Marcus Winters, Andrew Bacher-Hicks, Olivia Chi, Kirsten Slungaard Mumma, Alexis Orellana, and colleagues and students at Boston University Wheelock College of Education and Human Development for comments and conversations; seminar participants at AEFP, SREE, the Economics of Racism Seminar, and the Northeastern Economics of Education Seminar; and anonymous referees for comments (any errors are authors’ own).
Declaration of Conflicting Interests
The authors declared no potential conflicts of interest with respect to the research, authorship, and/or publication of this article.
Funding
The authors disclosed receipt of the following financial support for the research, authorship, and/or publication of this article: The authors gratefully acknowledge funding for this research from the Spencer Foundation (Award #201700055).

Notes
Authors
References
Supplementary Material
Please find the following supplemental material available below.
For Open Access articles published under a Creative Commons License, all supplemental material carries the same license as the article it is associated with.
For non-Open Access articles published, all supplemental material carries a non-exclusive license, and permission requests for re-use of supplemental material or any part of supplemental material shall be sent directly to the copyright owner as specified in the copyright notice associated with the article.
