






Abstract
The high price of college attendance remains a barrier to success for students from low- and moderate-income families. In response, institutions have introduced microgrants—small, off-cycle, need-based grants for undergraduates—to support student success. However, evidence on their effectiveness is limited. Using extensive administrative and survey data, we apply doubly robust quasi-experimental matching methods to estimate the relationships between microgrants and academic outcomes over 4 years. Findings indicate that grant recipients achieved higher grade point averages (GPAs), earned more credits, had better retention rates, and graduated at higher rates than their observably similar peers. These findings have important implications for equity efforts in the current sociopolitical context, as students from historically underserved groups were more likely to receive microgrants despite their universal design.
Keywords
Introduction
The high price of college attendance remains a barrier to academic attainment for students from low- and moderate-income families (Goldrick-Rab, 2016; Granville et al., 2025; Ziol-Guest & Lee, 2016). Traditional need-based grant aid improves academic attainment (LaSota et al., 2024; Nguyen et al., 2019), but the financial aid system leaves students with considerable unmet financial need (Walizer, 2018). Moreover, a substantial share of families are financially precarious, living on the margins, and unable to weather an unexpected financial expense (Federal Reserve, 2024). At the same time, colleges and universities are facing increased financial and political pressure to improve student retention and completion rates (Ortagus et al., 2020).
In response, colleges and universities have expanded offerings of need-based grants administered outside of the traditional financial aid packaging cycle (Stein & Butler, 2024). Over half of higher education institutions disburse some form of emergency, retention, or completion grants to help students meet unexpected expenses or make ends meet (Kruger et al., 2016), and the federal government expanded these resources during the COVID-19 pandemic (Bell et al., 2023). These relatively small, no-strings-attached grants are often worth $2,500 or less. Collectively, the goal of these “microgrants,” as we refer to them in this paper, is to help students fund their basic living and educational expenses so they can remain enrolled in college and earn a degree.
Microgrants are used in various fields and contexts, including international and community development. Though there is no single agreed-upon definition, the idea is to provide a small amount of money for a limited period to help individuals leverage it into a self-sustaining income-generating project (Chivers et al., 2023). In higher education, in addition to holistic student success supports, institutions invest a relatively small amount of money to help students persist and graduate (Akers, 2025). With a credential in hand, they are more likely to be employed, earn a higher wage, enjoy better health, and participate in civic and community life (Hout, 2012; Webber, 2022). Therefore, we expect that students from low-income families will be especially likely to benefit from additional monetary resources (Goldrick-Rab, 2016).
An emerging body of research on the efficacy of microgrants is promising, though findings are mixed (Akers, 2025). Some reports show impressive gains (Center for Higher Education Policy and Practice, 2023; Rossman et al., 2022; Western Governors University, 2023), but efforts to scale have struggled to replicate early success, likely due to differences in program implementation (Goldrick-Rab et al., 2023). Prior research has focused on open- and broad-access colleges, where postsecondary microgrants originated 2 decades ago (Geckeler et al., 2008). These types of institutions and microgrants, in particular, disproportionately serve students from low-income families, first-generation college students, and Students of Color, who are more likely to have limited financial resources. However, as students across all sectors of higher education struggle with unmet financial need and financial emergencies (Walizer, 2018), microgrant programs have expanded beyond their original context. To date, only one study has considered off-cycle aid at a moderately selective institution: Curs et al. (2024) examined the impact of a one-time university bill waiver ranging from $10 to $4,000 for Pell Grant-eligible students at the University of Missouri. Using a quasi-experimental matching design and administrative records, they compared the outcomes of students who received a bill waiver with those of similar students who did not. The study reported a 5.3 percentage point increase in graduation rates, though details about program implementation remain unclear; the authors note they “do not know if students were notified of the financial relief awards or what those notifications may have said” (Curs et al., 2024, p. 21), and it is unclear whether the one-time effort will be institutionalized.
Our study builds upon these findings by drawing on the institutional context of a moderately selective public research university with a relatively high 4-year graduation rate (i.e., over 55%). Using quasi-experimental methods, we leverage extensive administrative and survey data that allow for the examination of microgrants on students’ academic achievement and attainment outcomes over 4 years. Importantly, we assess all the university’s microgrant programs jointly to strengthen our confidence that results are not confounded by additional program use, and we consider heterogeneous outcomes by individual subgroups and award amount.
Program Implementation
In addition to providing comprehensive academic support services, the university has coordinated microgrant programs for emergency, retention, and completion. Students must complete a short online application requesting an emergency grant, while the retention and completion grants are administered without an application at the discretion of the Office of Financial Aid (i.e., usually via one-on-one advising appointments or, when funds allow, through an administrative review and automatic disbursal to outstanding university bills). All students are eligible for at least one microgrant, but low-income, racially minoritized, and first-generation college students are more likely to utilize this campus resource. Students typically use microgrants for educational expenses, basic needs, and healthcare. The programs have slightly different criteria, and staff work closely to identify the best microgrant option for each student in need. Referrals across microgrant programs are common and occur for multiple reasons. When students are eligible for multiple programs, staff use the most restrictive funds first (e.g., completion grant) to help ensure that they can serve the most students through the more flexible funds (e.g., emergency grant). If students are not eligible for a particular program (e.g., a completion grant), staff connect them to another microgrant program for which they are eligible (e.g., an emergency grant). When the federal government provided additional financial resources via the Higher Education Emergency Relief Fund (HEERF; Bell et al., 2023), those funds were distributed by the same university staff using very similar protocols as the existing institutional microgrant funds. Importantly, all the microgrant programs have the same goal: to provide students in need with relatively small, anytime financial grants so that they can persist in college and earn a degree. Staff flexibly utilize all microgrants at their disposal to help the greatest number of students. Thus, it is essential to consider these programs jointly. Additional program information can be found in the Supplemental Appendix.
Methods
The primary sample includes undergraduates who initially enrolled at a large, Midwestern research university from Fall 2018 (i.e., the first semester the microgrants existed in their current form) to Spring 2020, enabling us to examine 4-year graduation. Additional outcome variables were retention to the following year, annual credits earned, and annual grade point average (GPA). Treatment was defined as receipt of emergency, retention, completion, or HEERF microgrants within each academic year, with median awards of $2,000 (year 1) and $1,500 (years 2 and 3). Analyses were conducted separately by year because students who persist in college are different from those who do not, and students must be enrolled to be eligible for a microgrant. Students were included in the analysis for a given year if they were enrolled for at least one semester and if they had not received a microgrant previously. The analyses examined 7,802 first-year, 6,053 second-year, and 4,252 third-year students; there was not a sufficient sample size to consider fourth-year students.
Numerous covariates upon college entry were obtained from institutional records, including demographics (i.e., race/ethnicity, sex, first-generation college student status, rural background, in-state residence, cohort year), prior academic performance (i.e., high school GPA, ACT/SAT standardized test score, prior math coursework, university honors placement), and financial circumstances (expected family contribution [EFC] and unmet financial gap). Due to extensive missing data of key covariates for transfer and international students, the analysis excludes these groups. In addition, a required comprehensive survey of incoming students administered during weeks 3 to 6 of the first semester yielded extensive variables, including adjustment to college (i.e., belonging, co-curricular involvement, time spent socializing, homesickness, communication with family), early academic behaviors (i.e., time spent studying and preparing for class, class attendance, communication with instructors), socioeconomic indicators (i.e., subjective social class background, confidence to pay for tuition, time spent working on and off campus), and additional psychosocial factors (i.e., grit, academic self-efficacy, mental health, stress management, adverse life events, future enrollment plans, college satisfaction). Many of these survey-based measures consist of multi-item scales. Descriptive statistics for key variables are shown in Table 1, with additional information on survey covariates in Supplemental Appendix Table A1.
Descriptive Statistics.
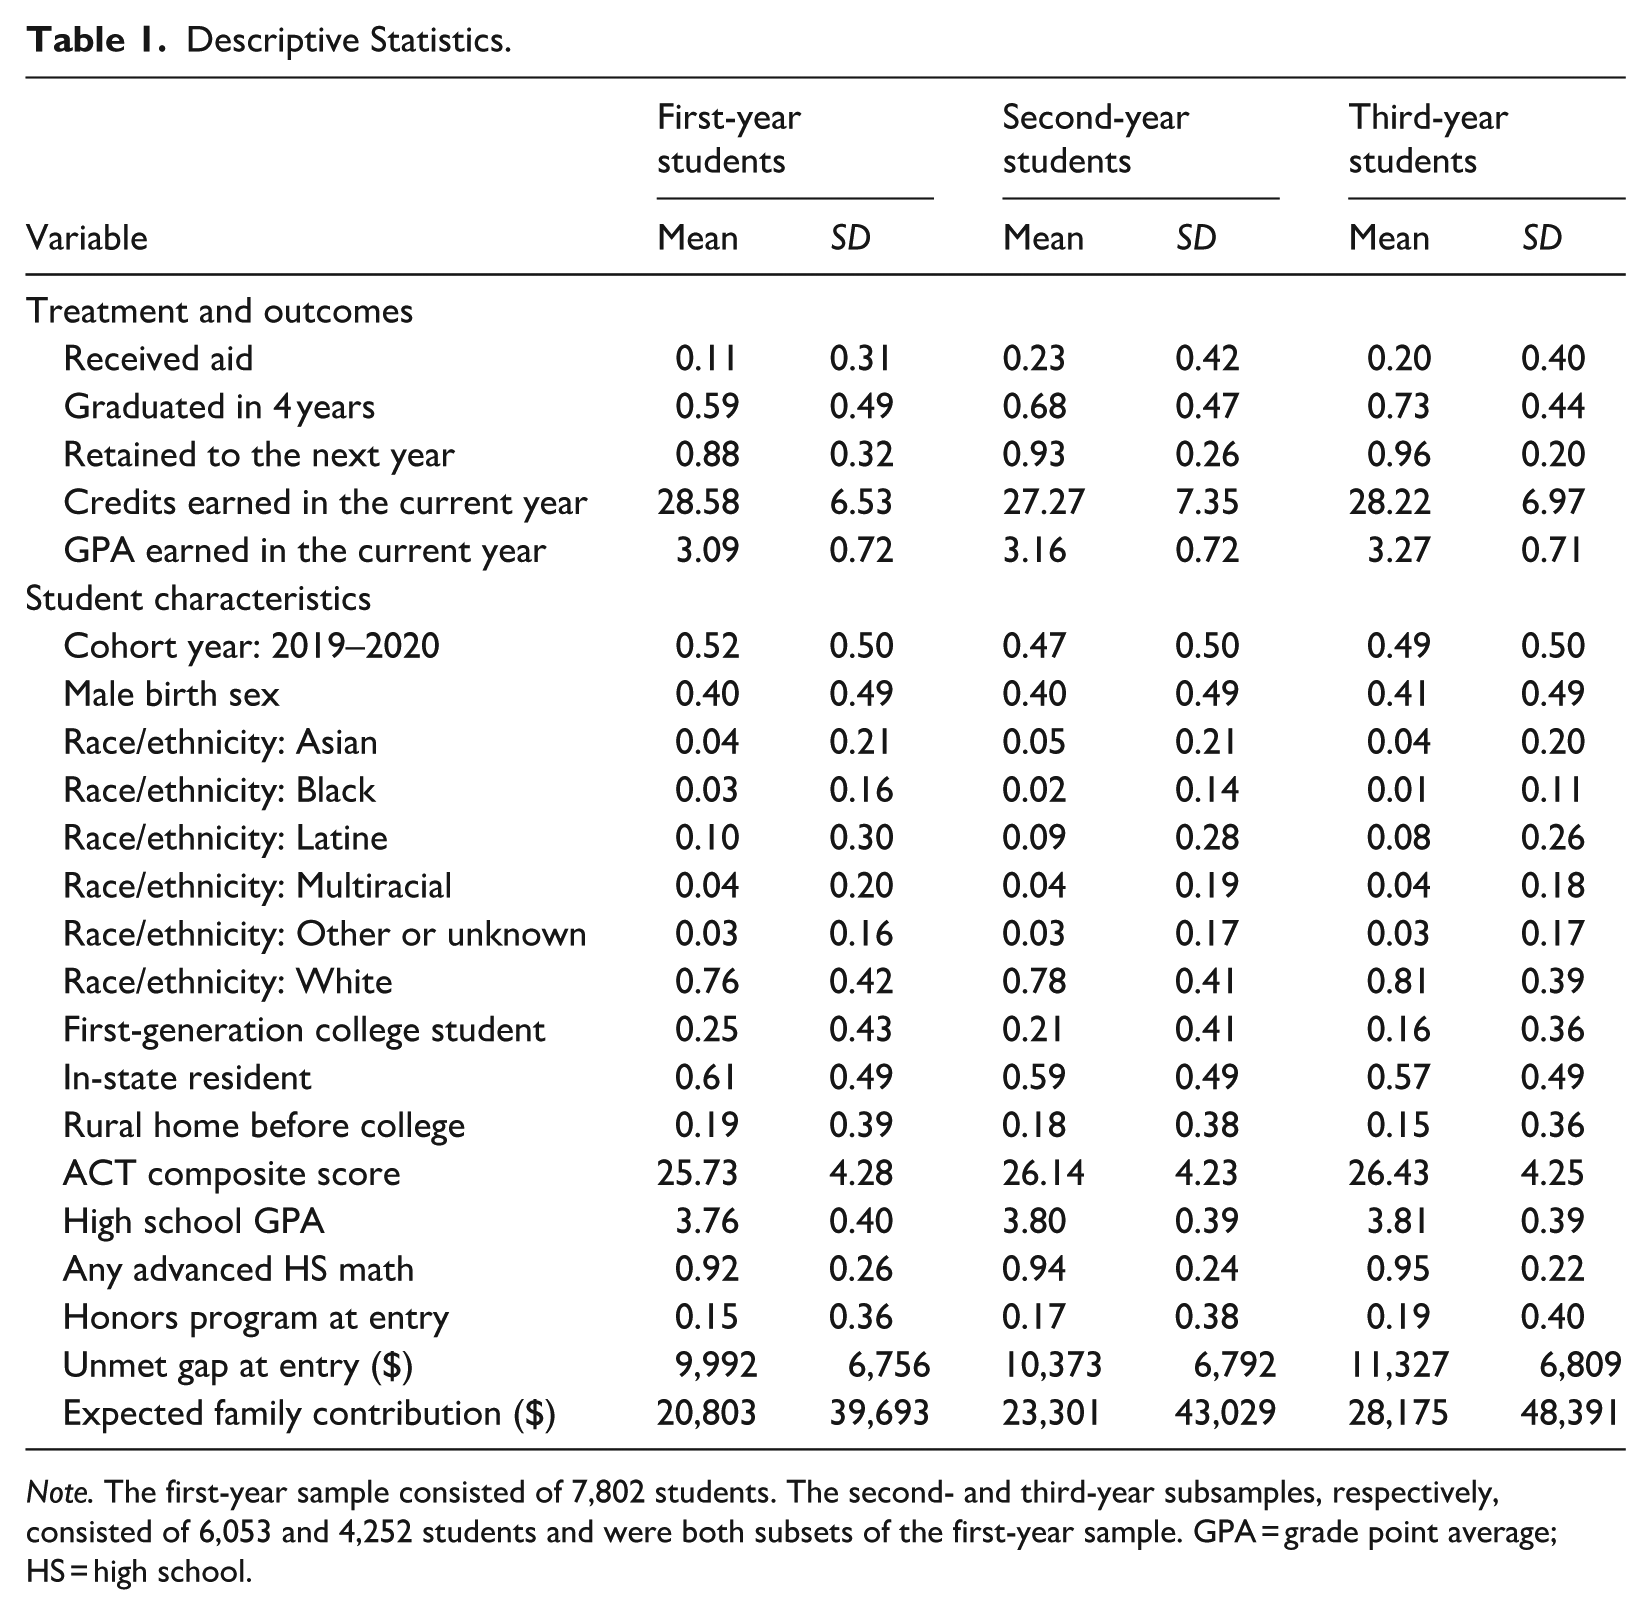
Note. The first-year sample consisted of 7,802 students. The second- and third-year subsamples, respectively, consisted of 6,053 and 4,252 students and were both subsets of the first-year sample. GPA = grade point average; HS = high school.
Doubly robust propensity score analyses were used to examine the average treatment effect on the treated (ATT) for receiving a microgrant on college success outcomes; doubly robust approaches have the benefit of providing multiple opportunities to minimize selection bias. This paper used optimal full matching, since it involves a combination—and therefore utilizes the respective strengths—of matching, subclassification, and weighting (see Austin & Stuart, 2015; Hansen & Klopfer, 2006). For instance, optimal full matching retains all observations within each analysis, it does not place large weights on any single observation (thereby avoiding undue influence of a particular participant), and it uses all 41 covariates for both creating the propensity score and predicting the outcome. Additional robustness analyses showed that the findings were similar across several different types of doubly robust propensity score analyses (e.g., augmented inverse probability weighting). Sensitivity analyses showed that the findings were consistent across different model specifications (e.g., including EFC, unmet gap, and prior GPA at college entry vs. the year of the analysis; using different cutoffs for subgroup analyses examining EFC, unmet gap, and grant amount).
The covariate balance for each sample is shown in Supplemental Appendix Table A2. After implementing optimal full matching, the treatment and comparison groups are quite similar; out of 138 comparisons, the means of only one covariate in the second-year sample and six in the third-year sample were more than 0.10 standard deviations apart. No covariate differed by more than 0.15 standard deviations after balancing, which provides confidence that any observed difference between groups is attributable to the microgrant award. Additional sensitivity analyses using Robustness of Inference to Replacement estimates are detailed in the Supplemental Appendix and support this conclusion (Frank et al., 2013, 2021).
In addition to analyses of the full sample within each year, heterogeneity analyses examined the same relationships for several subgroups: by race/ethnicity, sex, and first-generation college student status, along with groups divided by median EFC, median unmet gap, and median amount of the grant award. Post hoc tests examined whether these relationships differed significantly across key subgroups of interest. See Supplemental Appendix for additional methodological details.
Limitations
As with all research, some limitations should be noted. First, this study did not use an experimental design, limiting causal inference. However, the extensive set of high-quality covariates helps mitigate selection bias; we include a wide array of predictors associated with receiving financial aid and/or college success outcomes (see Fong et al., 2017; Mayhew et al., 2016; Robbins et al., 2004; Schneider & Preckel, 2017). This approach—in which several covariates are used to assess each of various relevant sets of constructs (i.e., financial and socioeconomic factors, prior academic performance, academic behaviors, college adjustment, additional psychosocial factors, and demographics)—can substantially reduce or even completely eliminate selection bias (Steiner et al., 2010, 2015). Second, as a single-institution study that excludes transfer and international students, the findings may have limited generalizability. Third, because multiple microgrant programs were analyzed together, differences by grant type could not be examined.
Results and Discussion
Table 2 contains the results of the primary analyses. Relative to students who do not receive a microgrant, students have a greater likelihood of 4-year graduation if they receive this aid during their first year (6.5 percentage points), second year (10.3 percentage points), or third year (10.8 percentage points; p < .01). The effect sizes for receiving a microgrant are nearly as large in each of the 3 years when predicting retention to the subsequent year (6.2, 8.0, and 9.1 percentage points, respectively; p < .001). Microgrants are also positively associated with credits earned within the current year when these are received in the first year (1.3 additional credits), second year (2.7 credits), or third year (3.2 credits; p < .001). Receiving a microgrant in the first year does not significantly predict GPA during that year, but significant and positive results are observed for receiving a microgrant in the second year (0.12 GPA points) and third year (0.14 GPA points; p < .001). Although these GPA increases are modest, they may help some students avoid placement onto academic probation, which can have substantial negative effects on retention (Sneyers & De Witte, 2018) and graduation (Bowman & Fenton-Miller, 2025).
Estimated ATT for All Outcomes.
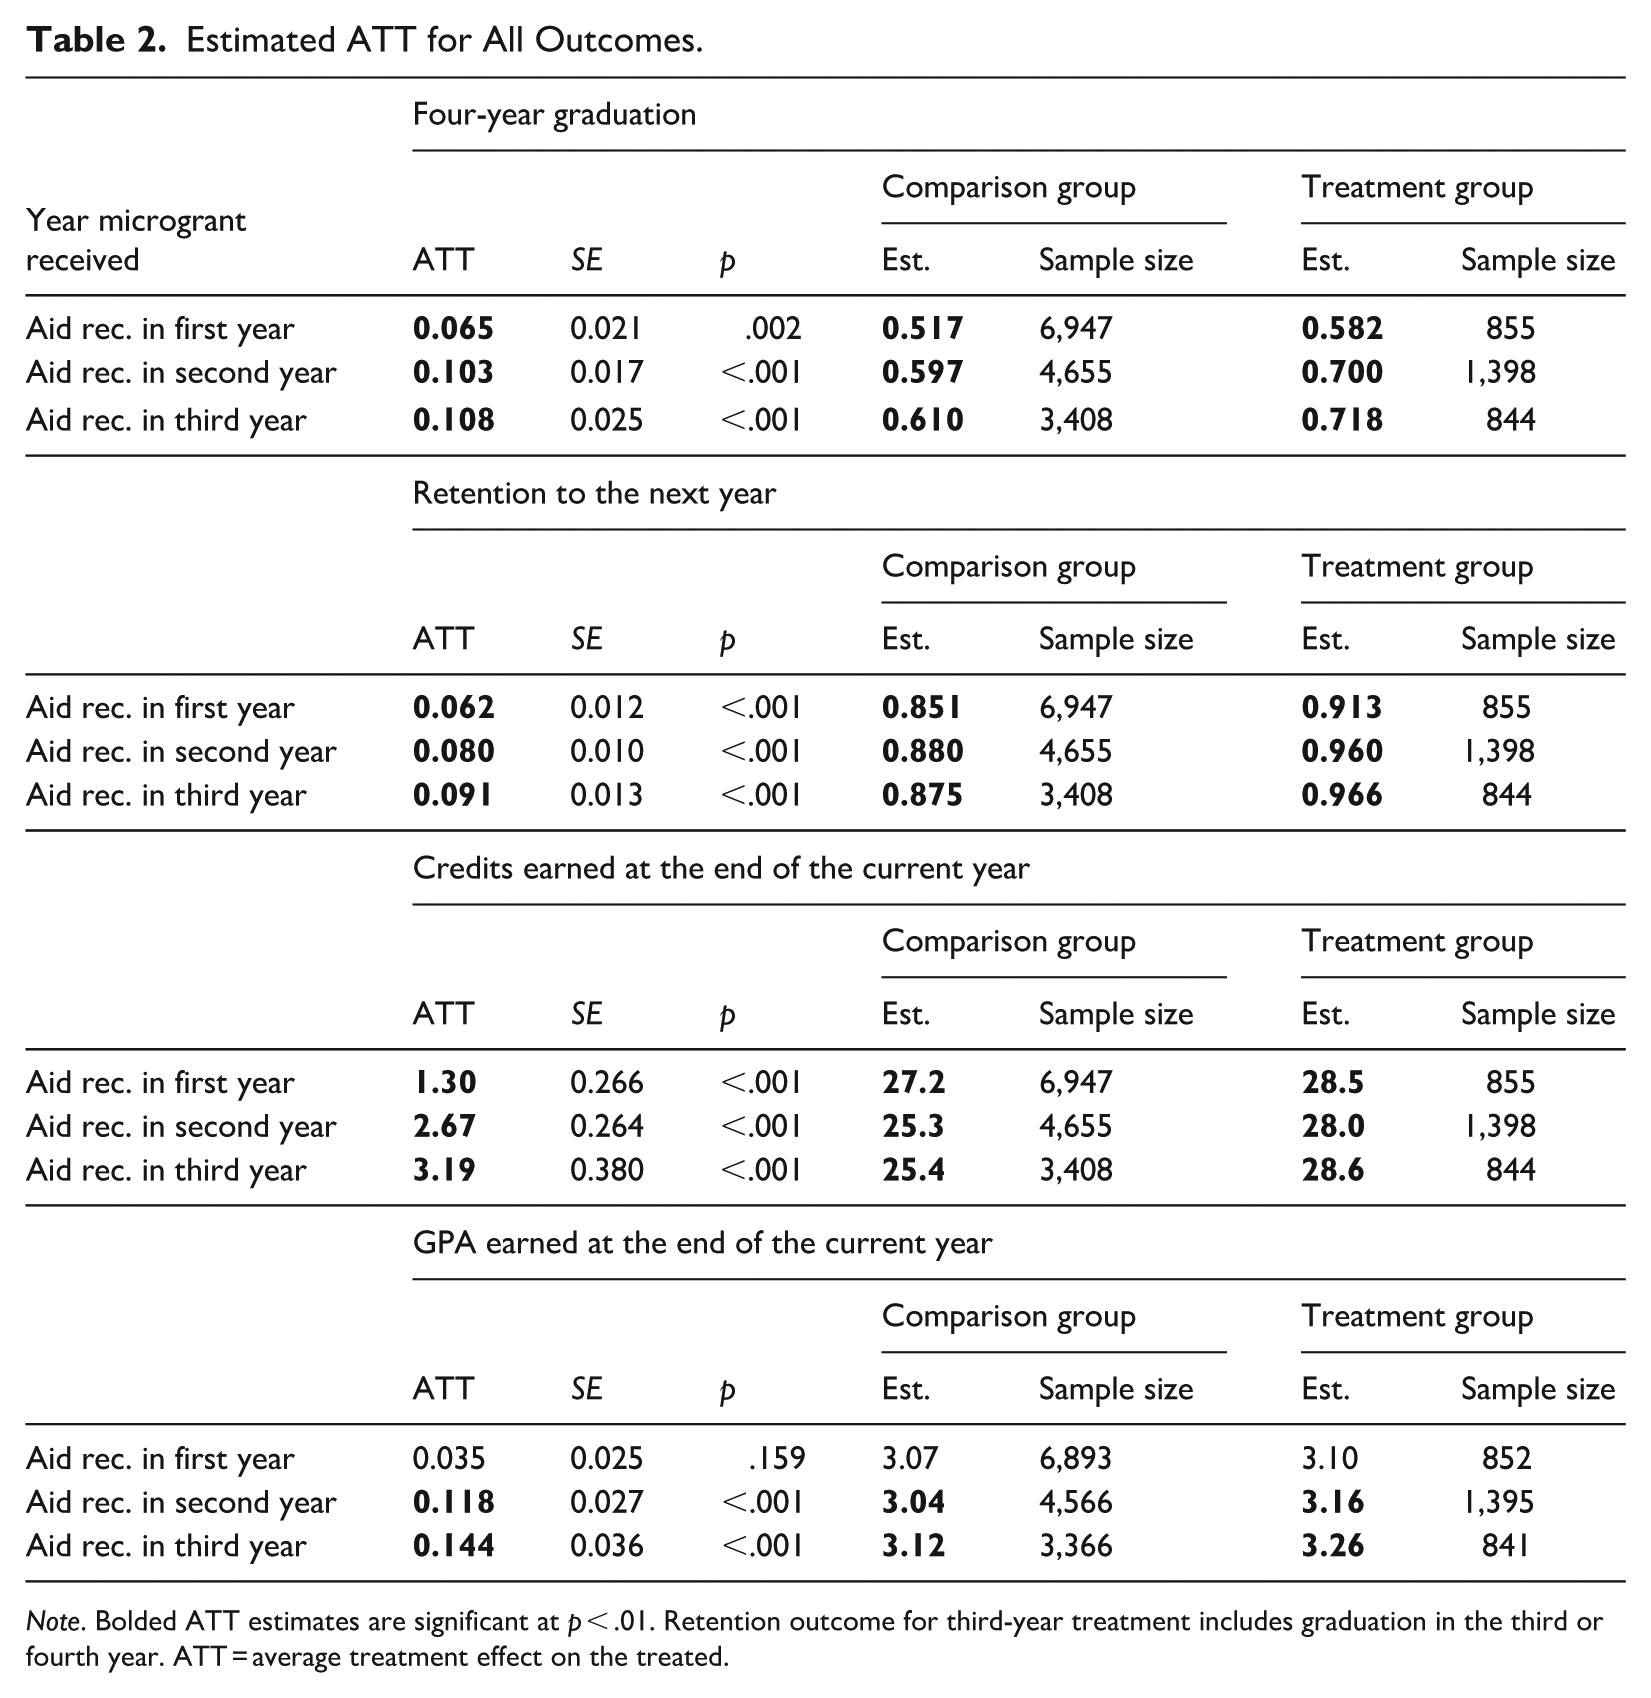
Note. Bolded ATT estimates are significant at p < .01. Retention outcome for third-year treatment includes graduation in the third or fourth year. ATT = average treatment effect on the treated.
The non-trivial magnitude of these retention and graduation effects is worth noting and is consistent with some prior research on this topic (Rossman et al., 2022; Western Governors University, 2023), even though the students in this sample had higher levels of academic preparation than in previous studies. Moreover, the effect sizes for retention are nearly as large as those for graduation, which suggests that microgrants primarily operate by helping students maintain short-term enrollment, which then ultimately leads to 4-year graduation. This finding is consistent with the larger philosophy of microgrants across various contexts (Chivers et al., 2023), and it illustrates how helping university students make ends meet during emergencies or tough financial times may promote college attainment and long-term success. That said, future research is needed to explore results for predicting time-to-degree.
Table 3 provides details of the analyses stratified by EFC. Subgroup analyses indicate that microgrant aid was especially helpful for returning students from low- and moderate-income families, as evidenced by findings for students below the median EFC. These students exhibit larger positive relationships for retention, credits earned, and GPA (p < .05). However, heterogeneous impacts on 4-year graduation were inconsistent across aid years.
Subgroup Analyses Stratified by Median Expected Family Contribution.
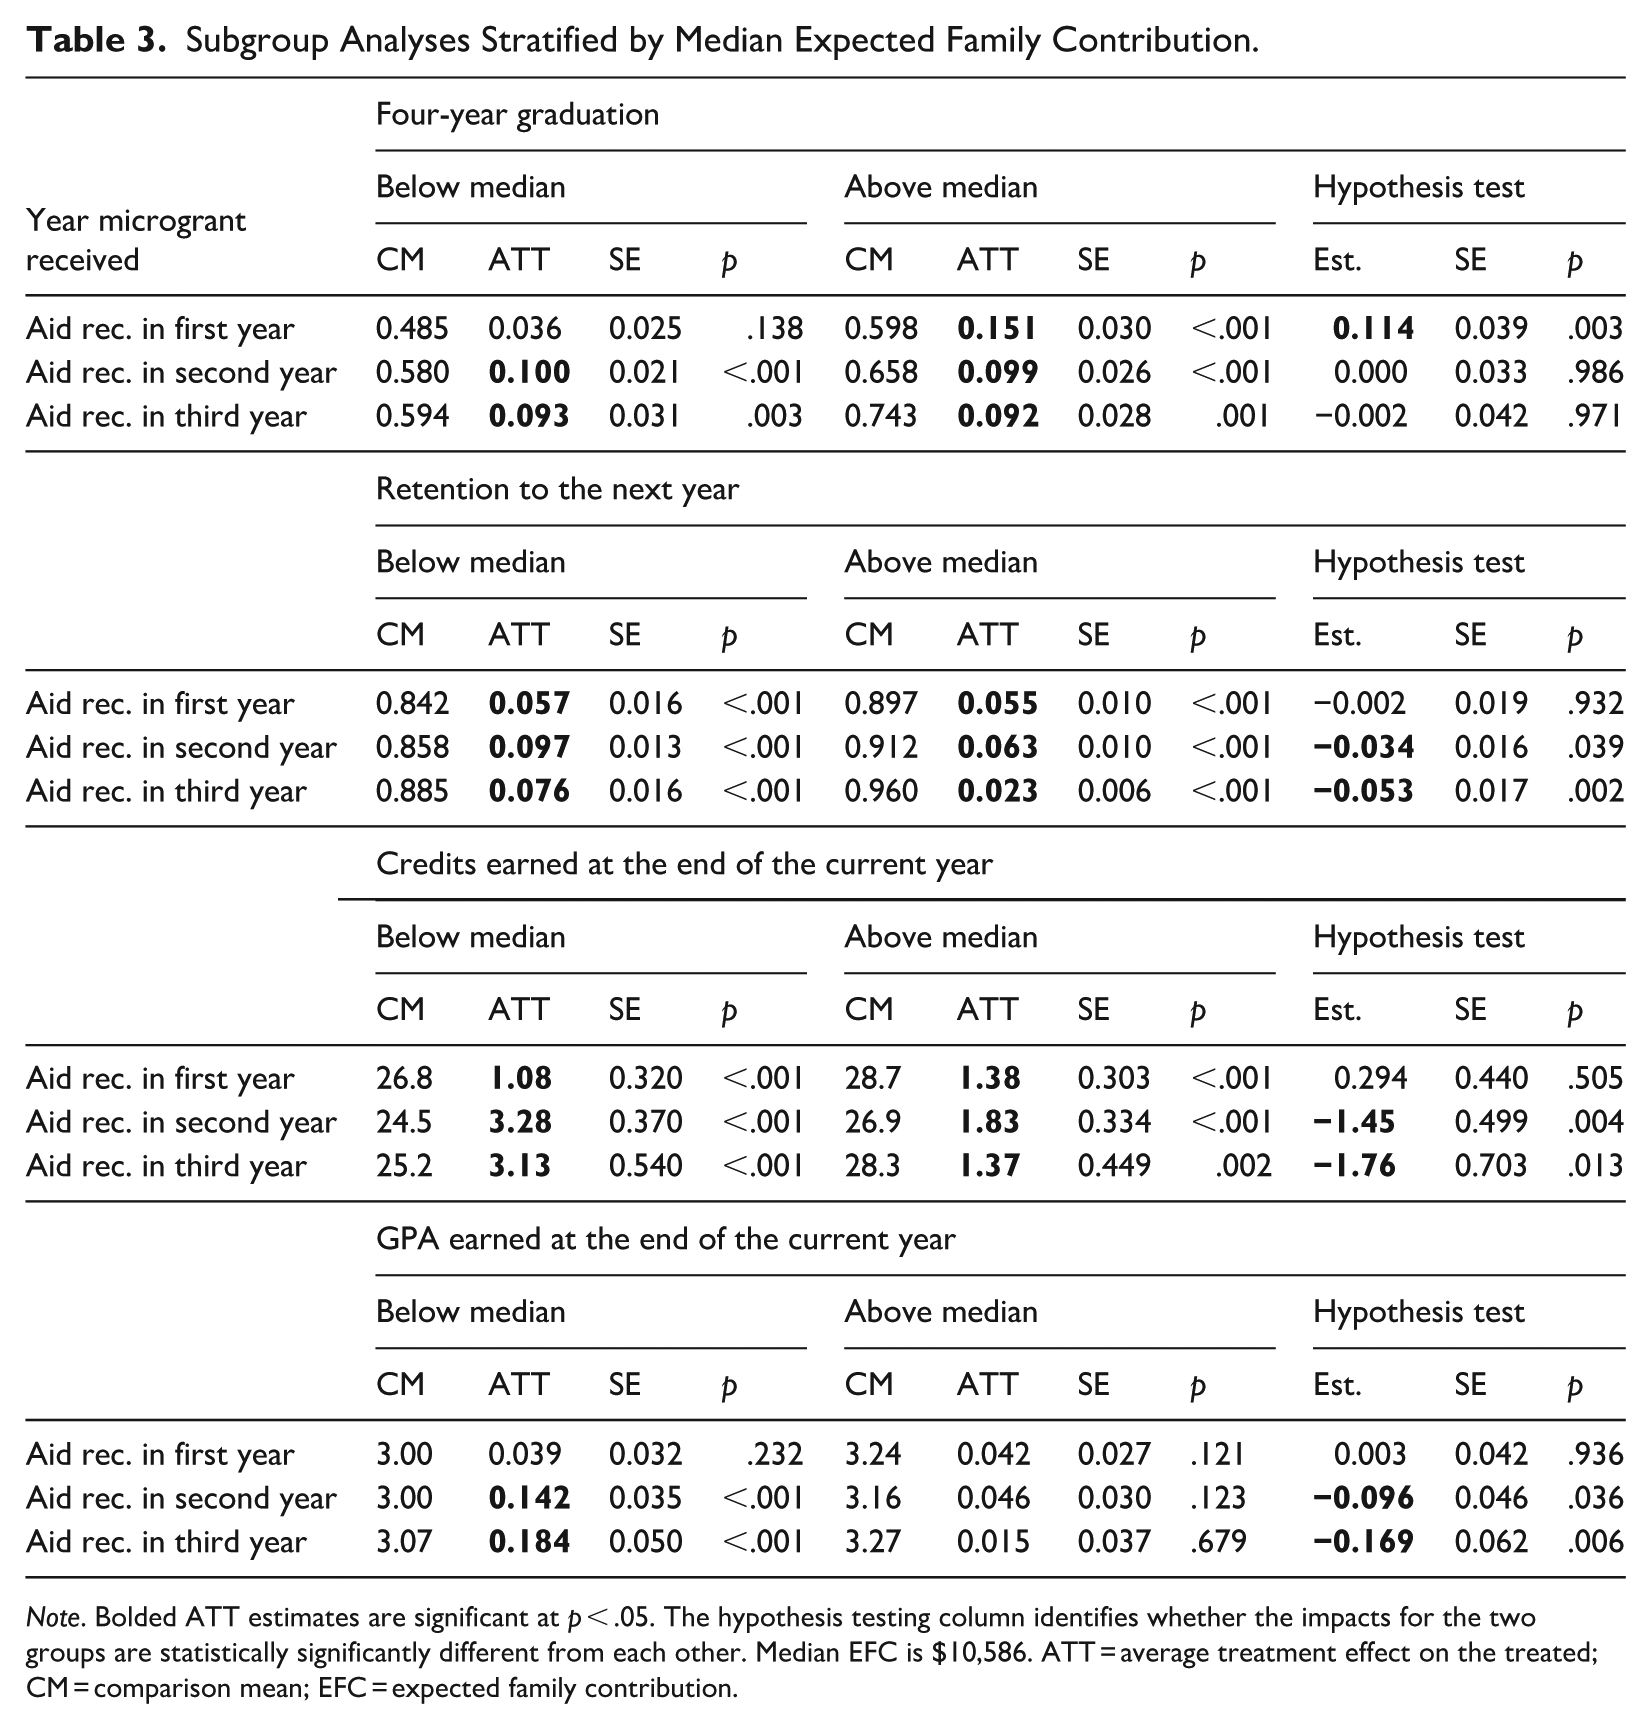
Note. Bolded ATT estimates are significant at p < .05. The hypothesis testing column identifies whether the impacts for the two groups are statistically significantly different from each other. Median EFC is $10,586. ATT = average treatment effect on the treated; CM = comparison mean; EFC = expected family contribution.
Overall, results are generally similar regardless of race/ethnicity, sex, first-generation college student status, unmet gap, and the amount of aid received (see Supplemental Appendix Tables A3–A7). Perhaps surprisingly, the effect sizes were similar in magnitude for smaller versus larger microgrants. That said, it is important to note that the size of these grants was based, in part, on the amount of money requested or the amount of student need. Thus, a lack of disparate findings does not imply that additional aid is unhelpful; instead, it may suggest that practitioners were successful in identifying how much each student needed, and they allocated resources accordingly. Such tailored approaches may therefore be quite useful for promoting college success while also using limited funding judiciously.
Conclusion
Our study extends the literature on microgrants in general, and higher education specifically, by using extensive administrative and survey data to inform a quasi-experimental examination of microgrants among students attending a moderately selective public research university. The findings indicate that microgrants are positively related to college grades, credits earned, retention, and 4-year graduation. While microgrants have long been associated with open- and broad-access colleges (Geckeler et al., 2008), our study demonstrates that, in light of students’ ongoing financial struggles (Federal Reserve, 2024; Granville et al., 2025; Walizer, 2018), such interventions are also relevant and seemingly efficacious within a more privileged and well-resourced institutional context. As funding for higher education institutions and students becomes increasingly uncertain, microgrants appear to be an effective and efficient use of limited resources.
Because racially minoritized, low-income, and first-generation college students were notably more likely to receive this funding than were students from more privileged backgrounds, these microgrants promoted equity in desired outcomes simply through the ways in which this aid was distributed (see Supplemental Appendix for details). Moreover, as the observed relationships were stronger among students from low- and moderate-income families, microgrants may also promote equity through differential impacts, likely because finances represent a key barrier to their success. Within an era of increased austerity and accountability (Ortagus et al., 2020) and in which explicit consideration of student identity within financial aid is challenged from a legal perspective (U.S. Department of Education, 2025), microgrants may therefore be especially fruitful for narrowing long-standing equity gaps in higher education.
Supplemental Material
sj-pdf-1-epa-10.3102_01623737261462496 – Supplemental material for Promoting Academic Success Through University Microgrants for Students
Supplemental material, sj-pdf-1-epa-10.3102_01623737261462496 for Promoting Academic Success Through University Microgrants for Students by Katharine M. Broton, Solomon Fenton-Miller and Nicholas A. Bowman in Educational Evaluation and Policy Analysis
Footnotes
Acknowledgements
We thank our university partners whose collaboration and support were essential to this research.

Funding
The authors disclosed receipt of the following financial support for the research, authorship, and/or publication of this article: This research was sponsored by the University of Iowa P3 Program in Support of Strategic Priorities with additional support from the Center for Research on Undergraduate Education (CRUE).
Declaration of Conflicting Interests
The authors declared no potential conflicts of interest with respect to the research, authorship, and/or publication of this article.
Supplemental Material
Supplemental material for this article is available online.
Author Biographies
References
Supplementary Material
Please find the following supplemental material available below.
For Open Access articles published under a Creative Commons License, all supplemental material carries the same license as the article it is associated with.
For non-Open Access articles published, all supplemental material carries a non-exclusive license, and permission requests for re-use of supplemental material or any part of supplemental material shall be sent directly to the copyright owner as specified in the copyright notice associated with the article.
