
Abstract
A bivariate lognormal model for the distribution of the response times on a test by a pair of test takers is presented. As the model has parameters for the item effects on the response times, its correlation parameter automatically corrects for the spuriousness in the observed correlation between the response times of different test takers because of variation in the time intensities of the items. This feature suggests using the model in a routine check of response-time patterns for possible collusion between test takers using an estimate of the correlation parameter or a statistical test of a hypothesis about it. Closed-form expressions for the maximum-likelihood estimations of the model parameters and a Lagrange multiplier test for the correlation parameter are presented. As in any type of statistical decision making, results from such procedures should be corroborated by evidence from other sources, for example, results from a response-based analysis or observations during the test session. The effectiveness of the model in removing the spuriousness from correlated response times is illustrated using empirical response-time data.
One of the increasing concerns of producers and consumers of test scores is fraudulent behavior during the test. Such behavior is more likely to be observed when the test takers' stakes are high, such as in admission, licensing, and certification testing. A simple form of cheating is one test taker attempting to copy the answers from another. This may happen without the source noticing. The classical form of this type of cheating is one test taker peeking at another’s answer sheet. A more modern form arises when computerized tests are administered in a regular classroom setting. Computer screens now have such a high resolution that, unless special arrangements are made, students can easily read the screens of others a few rows in front of them.
Test takers may also plan to collude during the test. A classical form of collusion is the signaling of question and answer numbers between test takers using a prearranged code (e.g., number of silent finger taps). More advanced communication is possible in the form of electronic transmission of data. One obvious instance is communication between test takers through a local network or over the internet when their PCs have not been locked down properly. However, more sophisticated forms have now become possible as a result of the rapid miniaturization of electronic devices. For instance, some digital pens now look like regular pens and automatically record handwritten responses or notes. The author would not be surprised if soon test takers would be caught transmitting such information wirelessly to others.
The traditional weapon of the testing industry against collusion is analysis of the agreement between the response patterns of the suspected test takers. The key quantity in all current statistics for detecting answer copying on multiple-choice items—traditionally one of the item formats most vulnerable to cheating—is the number of matching alternatives between test takers (Angoff, 1974; Frary, Tideman, & Watts, 1977; Holland, 1996; Lewis & Thayer, 1998; Sotaridona & Meijer, 2002, 2003; Sotaridona, van der Linden, & Meijer, 2006; van der Linden & Sotaridona, 2004, 2006; Wollack, 1997; Wollack & Cohen, 1998). However, these statistics differ in more or less subtle aspects. For example, some of them ignore matching correct alternatives, the idea being that a string of them may also be indicative of high-ability test takers who worked independently, whereas a string of matching incorrect alternatives is much less likely to occur under normal circumstances. Another difference resides in the null distributions postulated for these statistics. Some of them make an appeal to large-sample normality after some form of standardization, whereas others model the process of answer copying and derive the test statistic from the model.
It is not our intention to review these tests of answer copying or advocate a position with respect to the different assumptions underlying them. Readers interested in our view should refer to the introductory section of van der Linden and Sotaridona (2006). Instead, the goal of this research was to find an alternative method of detecting collusion between test takers based on their response times (RTs). RTs are a valuable extra source of information about the behavior of test takers during the test. For example, they have the advantage of being continuous rather than dichotomous and are therefore more informative about the size of possible aberrances than responses.
An even more attractive feature of RTs is that their use is not restricted to any specific response format. Particularly, it does not suppose the multiple-choice format for which the statistical tests above were developed. In fact, the more complicated the response format, the more informative the RTs. This point can be illustrated by the constructed-response format, for which we could not only analyze the total RT but also the time elapsed, for example, until a specific concept was introduced or a necessary tool was used. Of course, it will be more difficult to automate RT analyses, the closer we get to the level of the full set of time stamps in the test takers' logfiles. However, the possibilities are seemingly endless.
Finally, because the focus is no longer on responses, we avoid the statistical subtleties involved in the decision on what information the statistical test should condition: the number of incorrect alternatives by the source, his or her entire pattern of incorrect alternatives, or even the two full patterns of responses for the pair of test takers (Lewis, 2006). Such decisions become especially difficult when it is impossible to identify one test taker as the source and the other as the copier.
However, RT-based procedures for detecting collusion may seem to have disadvantages. Clearly, they can only be applied to tests administered in a computerized mode. However, we believe this to be a short-term disadvantage. Computerized testing offers numerous improvements over paper-and-pencil testing, such as the use of innovative item types, immediate scoring, and adaptive item selection. We therefore expect it soon to be the standard mode of testing. Because collusion is only possible when items between test takers are the same, this type of cheating is not a serious danger to adaptive testing, though. For RT-based procedures to detect aberrances more typical of adaptive testing, such as memorization and preknowledge of some of the items, see van der Linden and Guo (2008).
A more serious disadvantage may be test takers becoming aware of the fact that their RTs are checked and trying to fake realistic RTs to hide their collusion. However, we expect this to be too difficult for them, especially because they have to do this in real time. The expected RTs on the items in a typical operational test easily differ by a factor 5–8. For test takers trying to hide their collusion, it would be quite a challenge to find out what their patterns should be on a set of test items they have not seen before while keeping an eye on the clock, still solving the items, and avoiding running out of time. A more effective strategy for them might be to plan ahead. One possibility that has come to the author’s mind is an odd-even strategy, in which one test taker works on the odd and the other on the even items and they periodically exchange the answers. Such strategies may not be detected by the statistics presented in this manuscript but would always leave a trail of RTs that could be picked up by supplemental analyses. In fact, this particular trail would immediately be flagged by the procedure for the detection of aberrances in individual RT patterns in van der Linden and Guo (2008).
As any other area of statistical decision making, detection of collusion between test takers is prone to Type 1 and Type 2 errors—here: the errors of false accusations of cheating and incorrect assumptions of regular behavior. The former hurt innocent test takers; the latter are unfair to fellow test takers, especially if they are competing with the cheaters for scarce positions. In addition, cheating always undermines the credibility of the testing program.
The question of how to balance these errors is a policy issue that transcends the statistical aspects of the problem. But whatever the policy, it is always beneficial to take steps to reduce the likelihood of both types of errors to the maximum extent possible. One important step is to conduct response-based and RT-based procedures independently, and then check whether their conclusions agree. In addition, the decisions should be corroborated by additional observations (e.g., reports by proctors and analyses of logfiles). In the absence of such evidence, a practical approach already followed by some test organizations is to suspend the decision and invite the suspects to take the test again under controlled conditions.
RT Models
The analog of a string of matching responses between two test takers is a string of correlating RTs. The detection of such strings should be based on a statistical model for RT distributions under regular test behavior; otherwise, we might easily make wrong inferences. For example, as already indicated, RT distributions on test items depend heavily on their labor or time intensity. Because of this, the RTs of different test takers on the same set of test items always show a tendency to correlate, simply because of the variation in the time intensity from one item to the next. Likewise, test takers vary in the speed at which they operate. Ignoring this factor might lead to the confusion of speed with collusion as the cause of similar RTs. For empirical examples of spurious relations in patterns of observed RTs, see van der Linden (in press) and van der Linden and Guo (2008).
A model that does take item and person effects into account is the lognormal RT model
(van der Linden, 2006).
The core of the model is an equation that defines the speed of labor by a test taker on
an item. Let 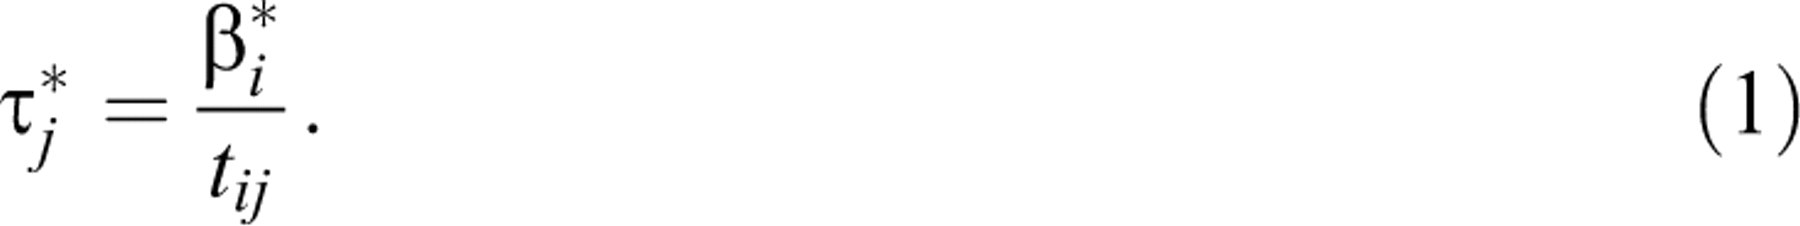 This definition follows the format of any definition of speed as
the rate of change of some substantive measure with respect to time. For example, the
well-known definition of the speed of motion of a body from physics has the same form as
Equation 1
but with the amount of labor in the numerator replaced by the distance traveled. For
more on this fundamental equation of RT modeling, see van der Linden (in press).
This definition follows the format of any definition of speed as
the rate of change of some substantive measure with respect to time. For example, the
well-known definition of the speed of motion of a body from physics has the same form as
Equation 1
but with the amount of labor in the numerator replaced by the distance traveled. For
more on this fundamental equation of RT modeling, see van der Linden (in press).
Observe that Equation
1 is equivalent
to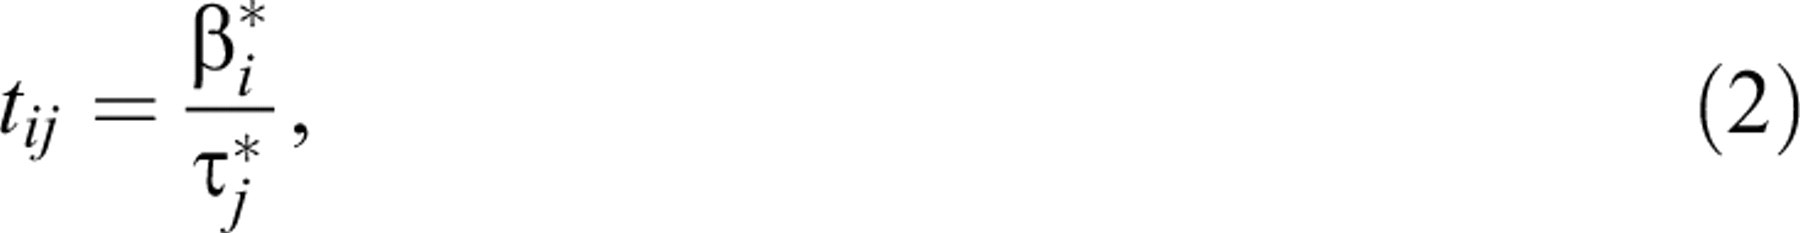
which shows that the equation actually decomposes one (known) RT into two (unknown)
effects for the person and the item. The lognormal model follows from Equation 2 in two
obvious steps: (a) a logarithmic transformation of the RTs to remove the typical
skewness from their distributions and (b) the addition of an item-specific random term
to allow for the randomness of RTs. The result
is
where β
i
and τ
j
are now parameters for the item and person effects on a logarithmic scale and α
i
can be interpreted as an item discrimination parameter. Equivalently,
Tij
follows a lognormal distribution with density,

where  for the population of test takers on which the items are calibrated.
For statistical issues related to parameter estimation and model validation, which can be performed efficiently by embedding the model in a hierarchical framework along with a regular response model, see Fox, Klein Entink, and van der Linden (2007); Klein Entink, Fox, and van der Linden (2009); and van der Linden (2006, 2007). A review of empirical applications of the model is given in van der Linden (2009).
To analyze the RTs of pairs of test takers for possible collusion when their regular
behavior can be assumed to follow the lognormal model in Equation 4, we
need an extension of the model for the joint distribution of their RTs on a fixed
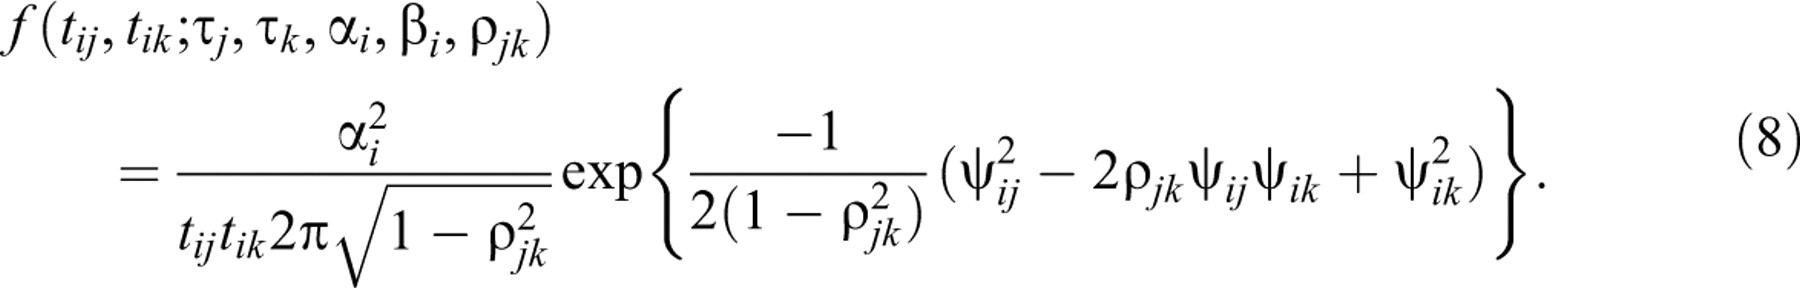
item. Obviously, for a pair of test takers (j, k), the bivariate
generalization of Equation 3 for the distribution of 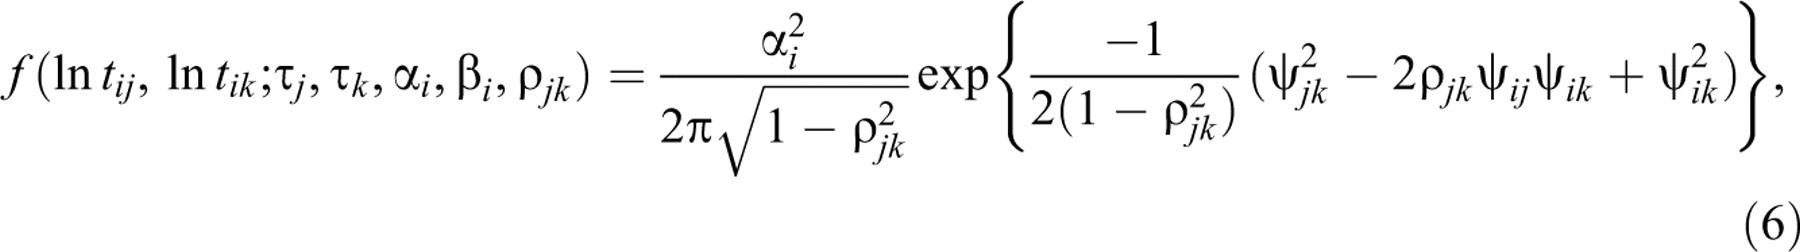 where
where
 Equivalently (Tij, Tik
) has a bivariate lognormal density
Equivalently (Tij, Tik
) has a bivariate lognormal density
 Factor
Note that ρ jk is a parameter for the degree to which the RTs by two fixed test takers agree. It is thus independent of the RTs of any of the other test takers. This fact is important because several of the statistical tests for matching alternatives on multiple-choice tests referred to earlier are population dependent and lead to different decisions when the same pair of test takers would be included in different populations. In addition, note that ρ jk is the correlation between ψ ij and ψ ik in Equation 7. Because the impact of the identifiability restriction in Equation 5 on β i and τ j on ψ ij cancels, the use of the population mean in Equation 5 does not make any of the inferences about ρ jk population dependent.
Another important feature of the model is its automatic correction of ρ
jk
for the time intensities β
i
of the items. As a result, ρ
jk
is insensitive to spuriousness in the observed correlation between the
logtimes of two test takers because of the variation in the time intensity between
the items. The model also allows us to compare the speed τ
j
of different test takers. This is important because one would expect test
takers who collude to work at approximately at the same speed. Although there may be
several other reasons why test takers have similar speed, this expectation makes
It is assumed that the items have been calibrated with enough precision before their
operational use and that we can therefore treat their parameters as known. Thus, for
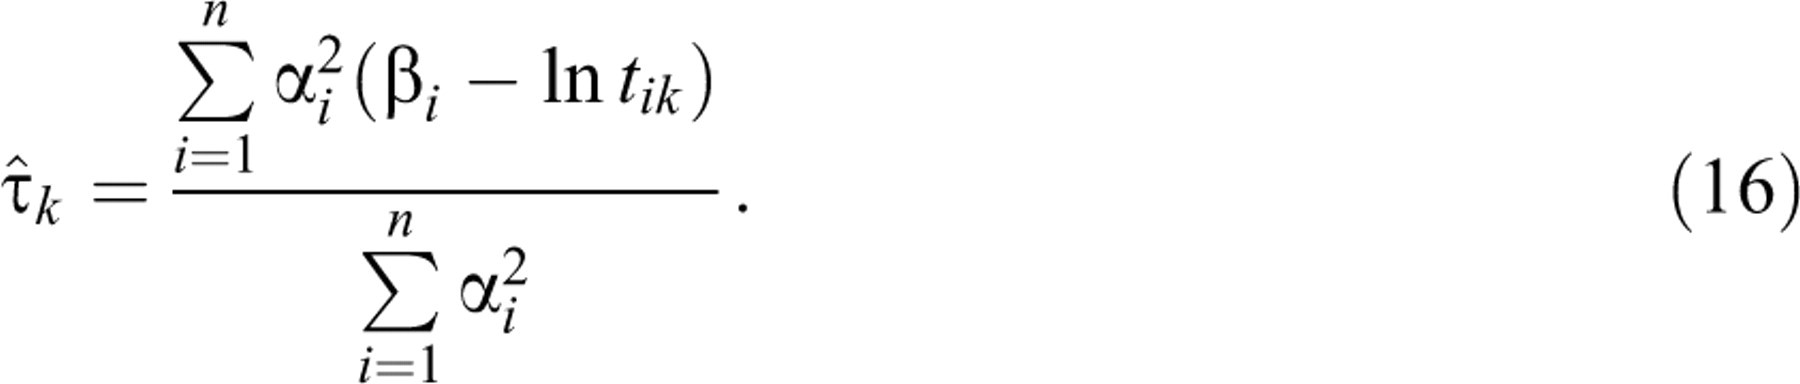
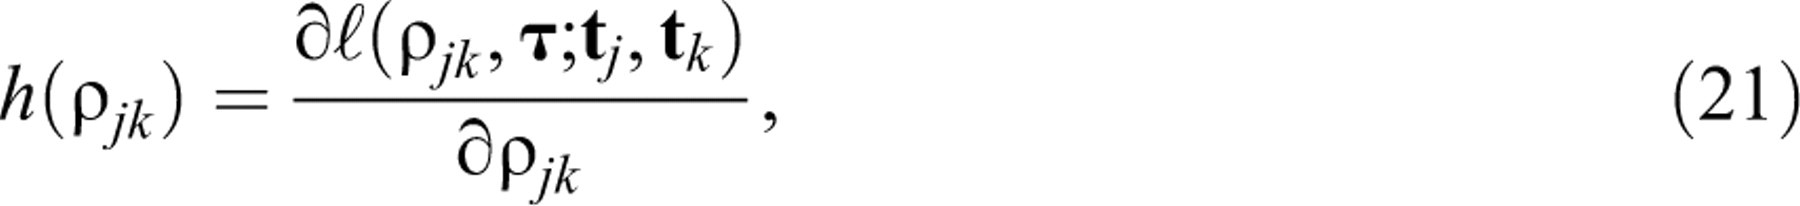
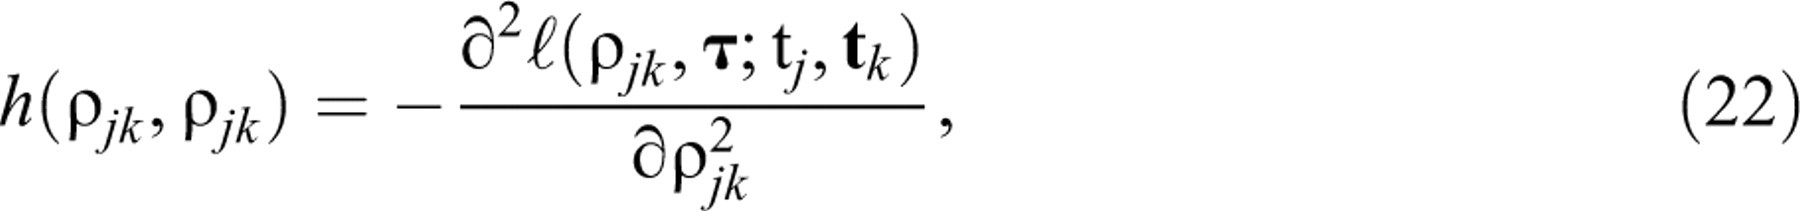
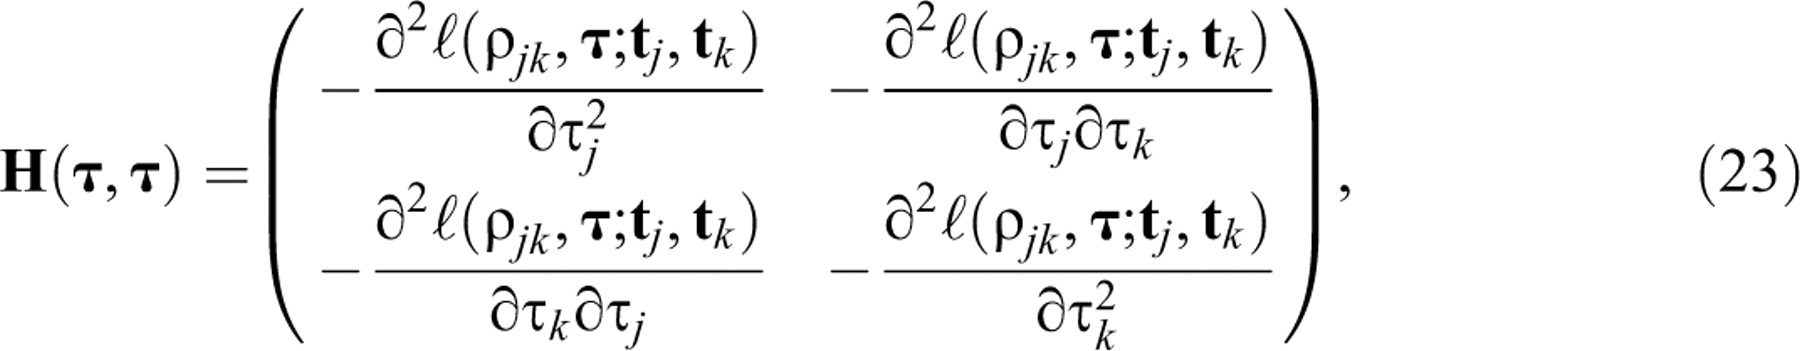
test takers j and k on items 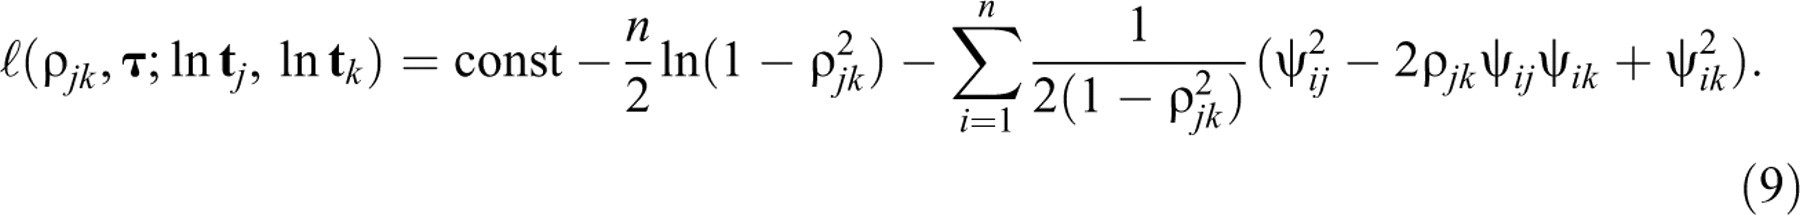 From Equation 9, using the first-order derivatives in Equations A1,
A2, and
A3 in the
appendix, the likelihood
equations for
From Equation 9, using the first-order derivatives in Equations A1,
A2, and
A3 in the
appendix, the likelihood
equations for 

 The first two equations yield

 Note the symmetry between Equations 13 and 14. Hence, they
only hold when the two sums are equal to 0 or
Note the symmetry between Equations 13 and 14. Hence, they
only hold when the two sums are equal to 0 or 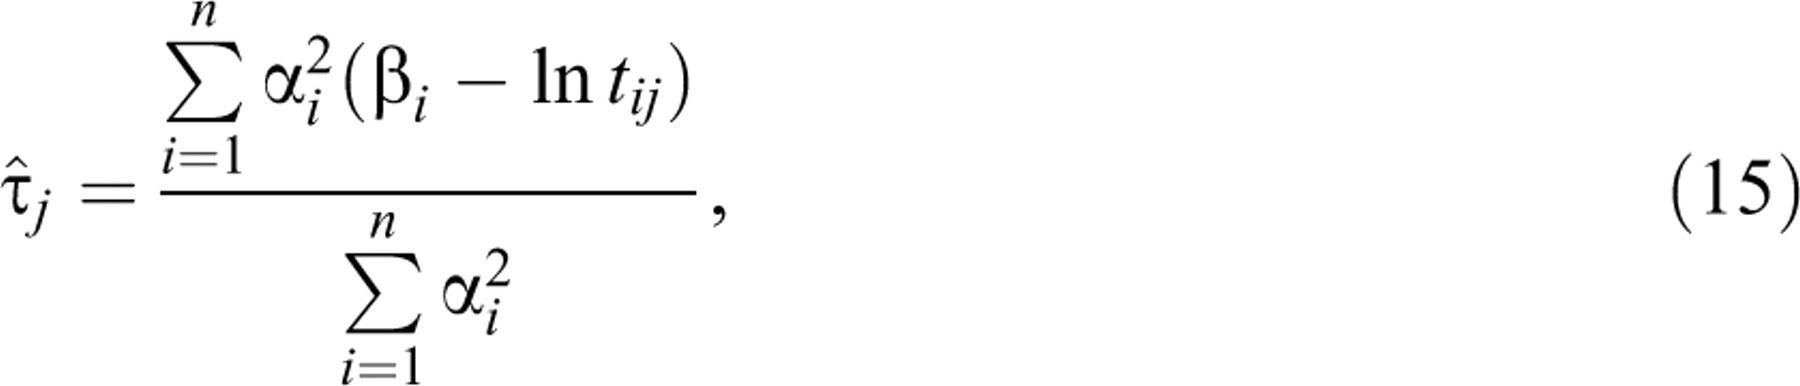
 The second condition can be ignored because the interest is in a
nondegenerate bivariate distribution. In addition,
The second condition can be ignored because the interest is in a
nondegenerate bivariate distribution. In addition,
Following an argument in Lehmann
(1999, ex. 7.5.4), the solution of Equation 12 is
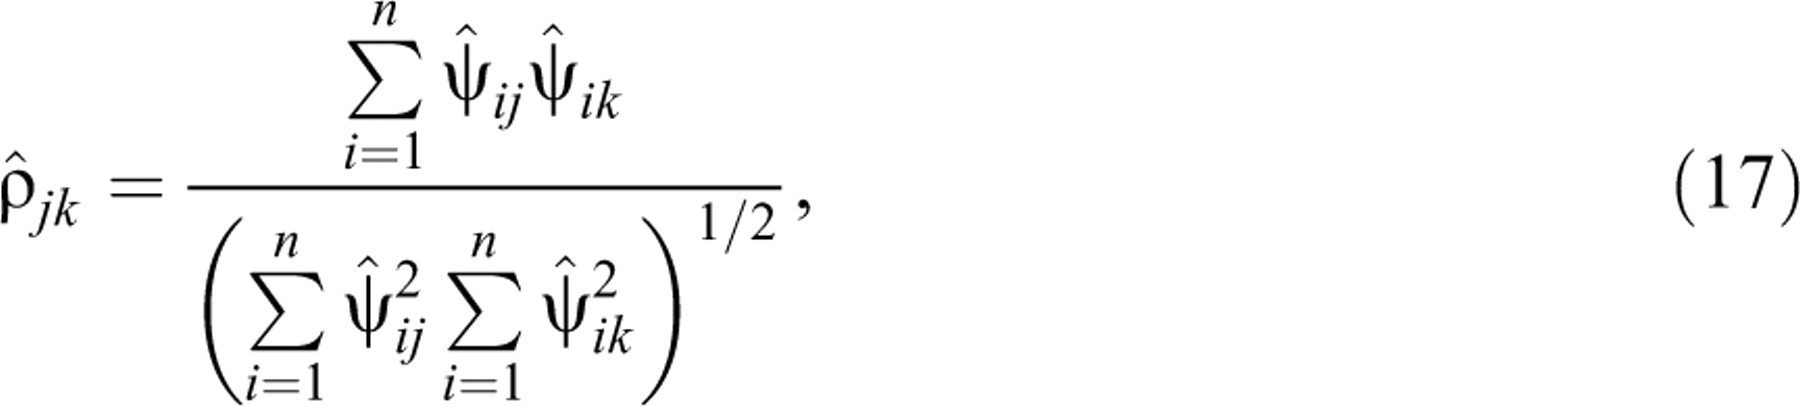 where
where
The maximum-likelihood estimator (MLE) of
In a routine screening of test data, we could not only calculate the MLE of
We discuss the test of
 against
 This test has the advantage of a statistic that reduces to a simple
expression and allows us to directly follow the argument on which it is based. The
generalization to a test of the more general hypothesis
This test has the advantage of a statistic that reduces to a simple
expression and allows us to directly follow the argument on which it is based. The
generalization to a test of the more general hypothesis
The proposed test is a Lagrange multiplier (LM) test. For a general introduction to this type of test and a discussion of their favorable statistical properties, the reader is referred to Lehmann (1999, sect. 7.7) or Silvey (1975, sect. 7.4). The use of LM tests for the diagnosis of violations of various IRT models has been popularized by recent work by Glas and his associates (e.g., Glas, 1999; Glas & Dagohoy, 2007; Glas & Suárez Falcón, 2003; van der Linden & Glas, in press). A practical feature of LM tests is that their statistics have to be evaluated only at the MLEs of the parameters in the null model and more complicated computation of any of the estimates of the alternative parameters is avoided.
The statistic for the LM test of Equation 18 against Equation 19 with
unknown parameters  where
where
 and
and
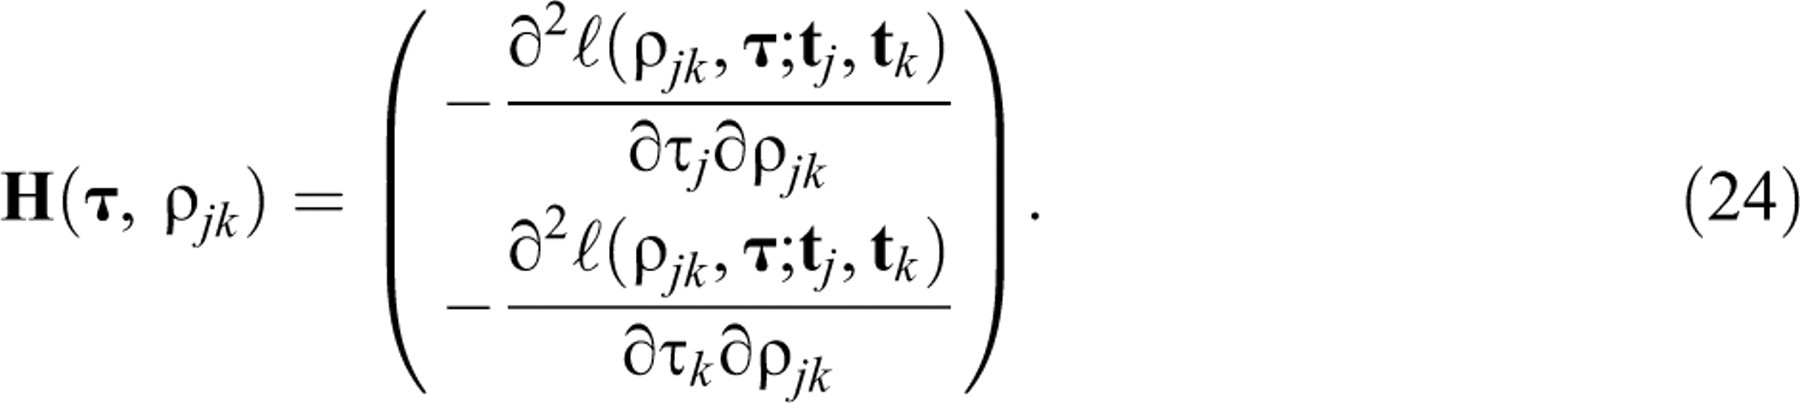
All necessary derivatives are given in the appendix. Observe that they are for the full
log-likelihood function in Equation 9; that is, under the
alternative bivariate lognormal model. However, when calculating Equation 20, the
derivatives need to be evaluated not only at the MLEs of 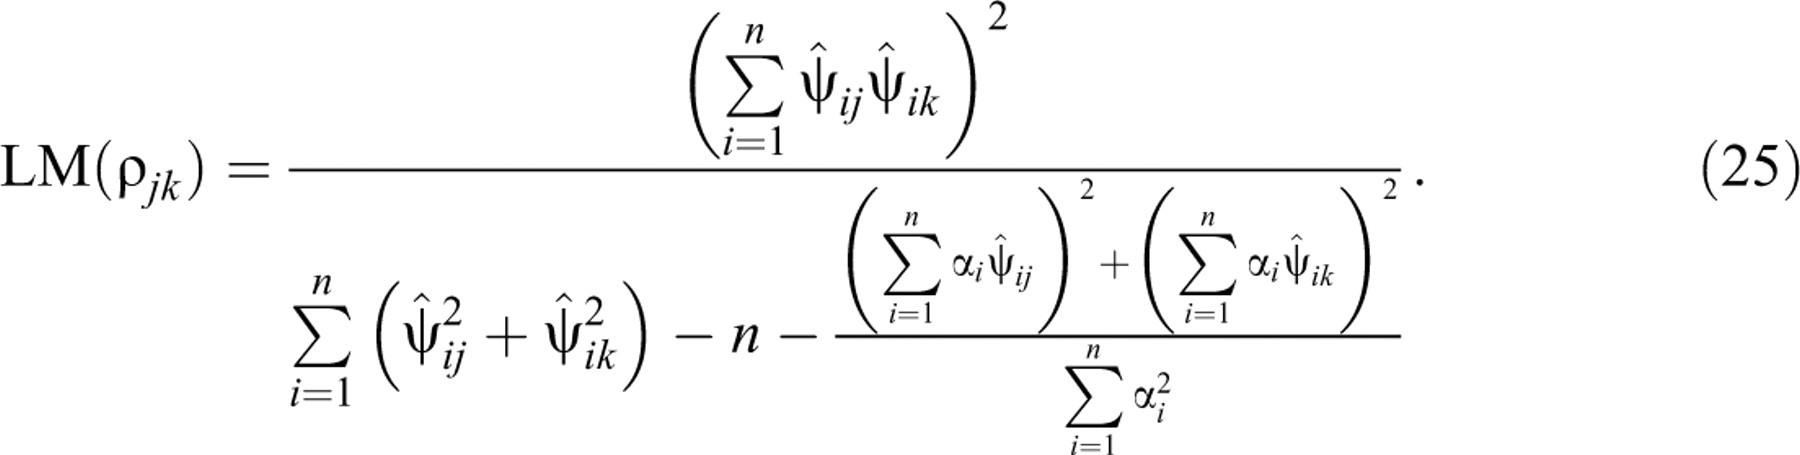 It is interesting to note the presence of the same key quantity in the
numerators of LM
It is interesting to note the presence of the same key quantity in the
numerators of LM
The effectiveness of the bivariate RT model in avoiding erroneous conclusions about collusion between test takers likely to arise when the inference is based on direct analyses of the RTs without any formal model is illustrated for a small sample of test takers from an administration of the Natural World Assessment (NAW-8) test in a study by Wise, Kong, and Pastor (2007). The NAW-8 is a test of quantitative and scientific reasoning proficiencies for college students. In an earlier study, we calibrated the same items under the lognormal RT model in Equation 4 and obtained excellent fit of the model to the items (Klein Entink et al., 2009).
In the Wise et al. (2007)
administration of the NAW-8, the students served as participants in a experiment and had
no stakes whatsoever in the test. Attempts to detect collusion between them would
therefore be bound to fail. In fact, Wise et al. conducted their study to show the
possibilities of using RTs for the detection of test takers with motivation problems.
However, the goal of our current use of the data set is only to exemplify the proposed
procedures for a few typical RT patterns. In particular, we wanted to show how focus on
the estimation of correlation parameter
We analyzed the first 10 pairs of participants in the data set. The results for the
three pairs of participants in Tables 1 and 2
were picked because they nicely illustrate the points we wanted to make with this
example. The estimates of the time intensity and discrimination parameters of the items
and the RTs of the participants in the example are shown in Table 1. The estimates of the item parameters
were obtained from the full data set for 386 test takers using the identifiability
restriction in Equation 5. Hence, the MLEs of the speed parameters of the six participants
in the first row of Table 2,
which were calculated directly from the logRTs and the
Response Times (RTs) and Estimated Residual logRTs for Three Pair of
Participants
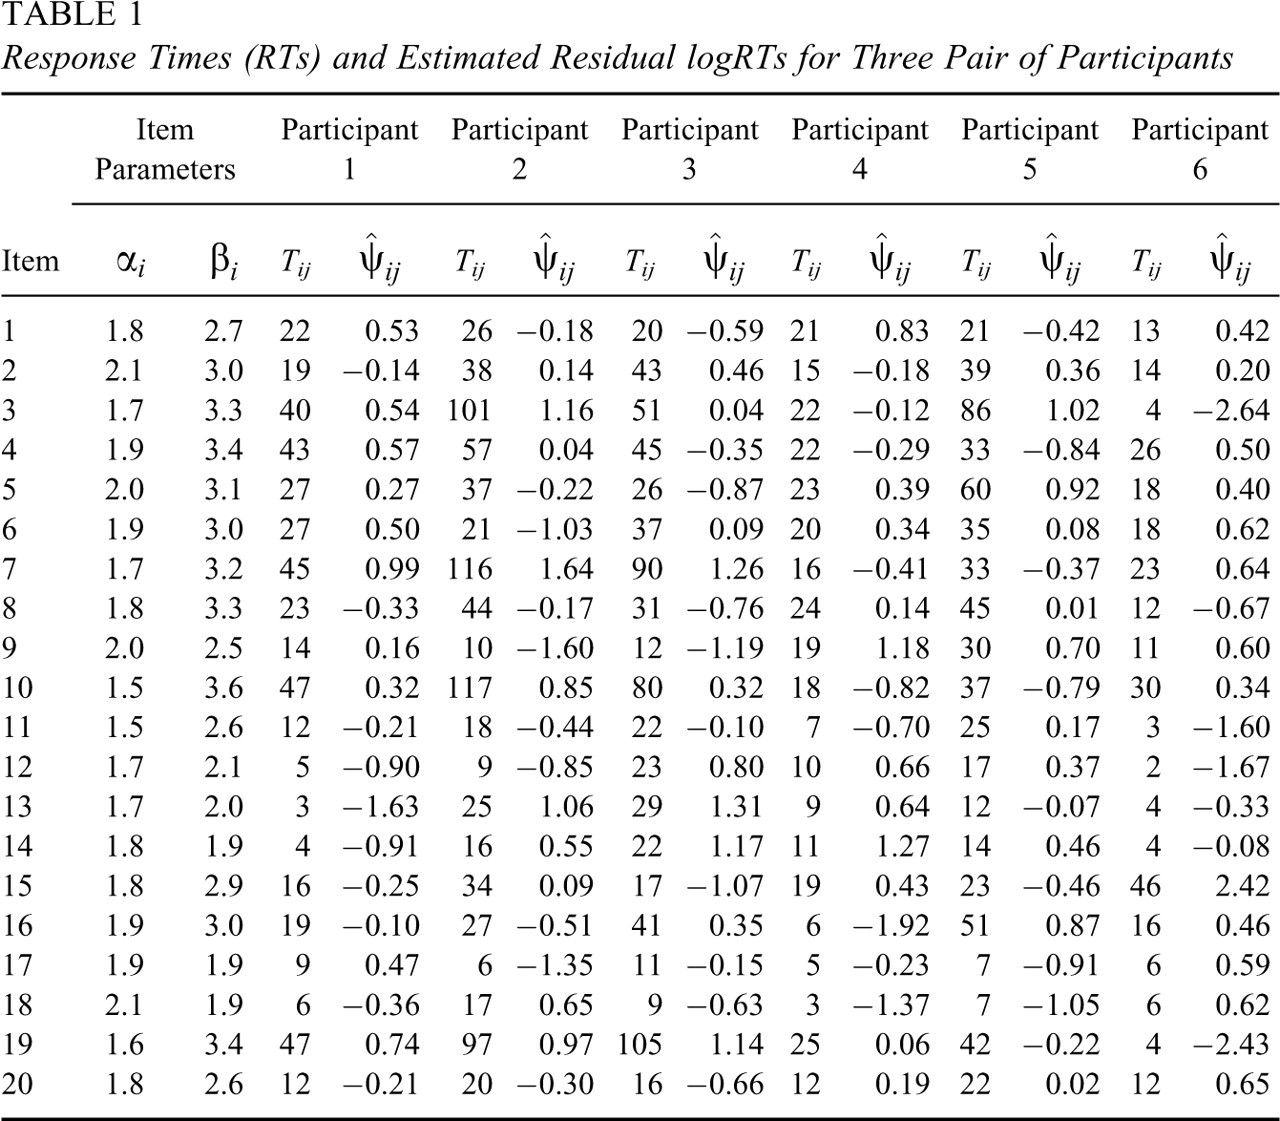
Response Times (RTs) and Estimated Residual logRTs for Three Pair of Participants
Estimated Speed Parameters, Estimated Correlations, and Lagrange Multiplier (LM) Statistics for Three Pair of Participants
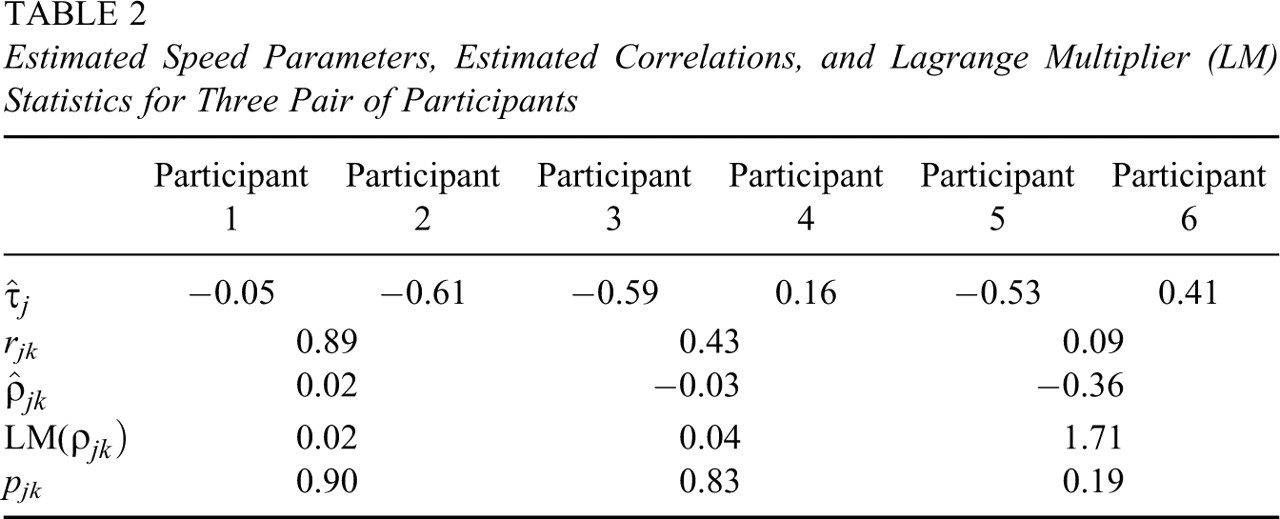
A naive analysis of the agreement between the RTs of two test takers would focus on the
Pearson correlation
However, the estimates of correlation parameter
LM tests are optimal in several ways. For instance, they are known to be locally most powerful, consistent, and asymptotically equivalent to the better-known likelihood-ratio and Wald tests. The power of LM tests has been studied empirically for several applications in response modeling in the papers by Glas and his associates referred to earlier. To demonstrate the power of the current test, a simulation study was done for the items in the same NAW-8 test as in the previous section.
The power function of the test is the probability of rejecting the null hypothesis as a
function of the true value of the parameters of interest,  where
where
Clearly, the power increases with the number of common items for the two test takers. We
therefore simulated RTs under the bivariate lognormal model in Equation 8 for
pairs of test takers on the first
The resulting estimates of the power functions are given in Figure 1 . As expected, each of the curves
increased with the true value of
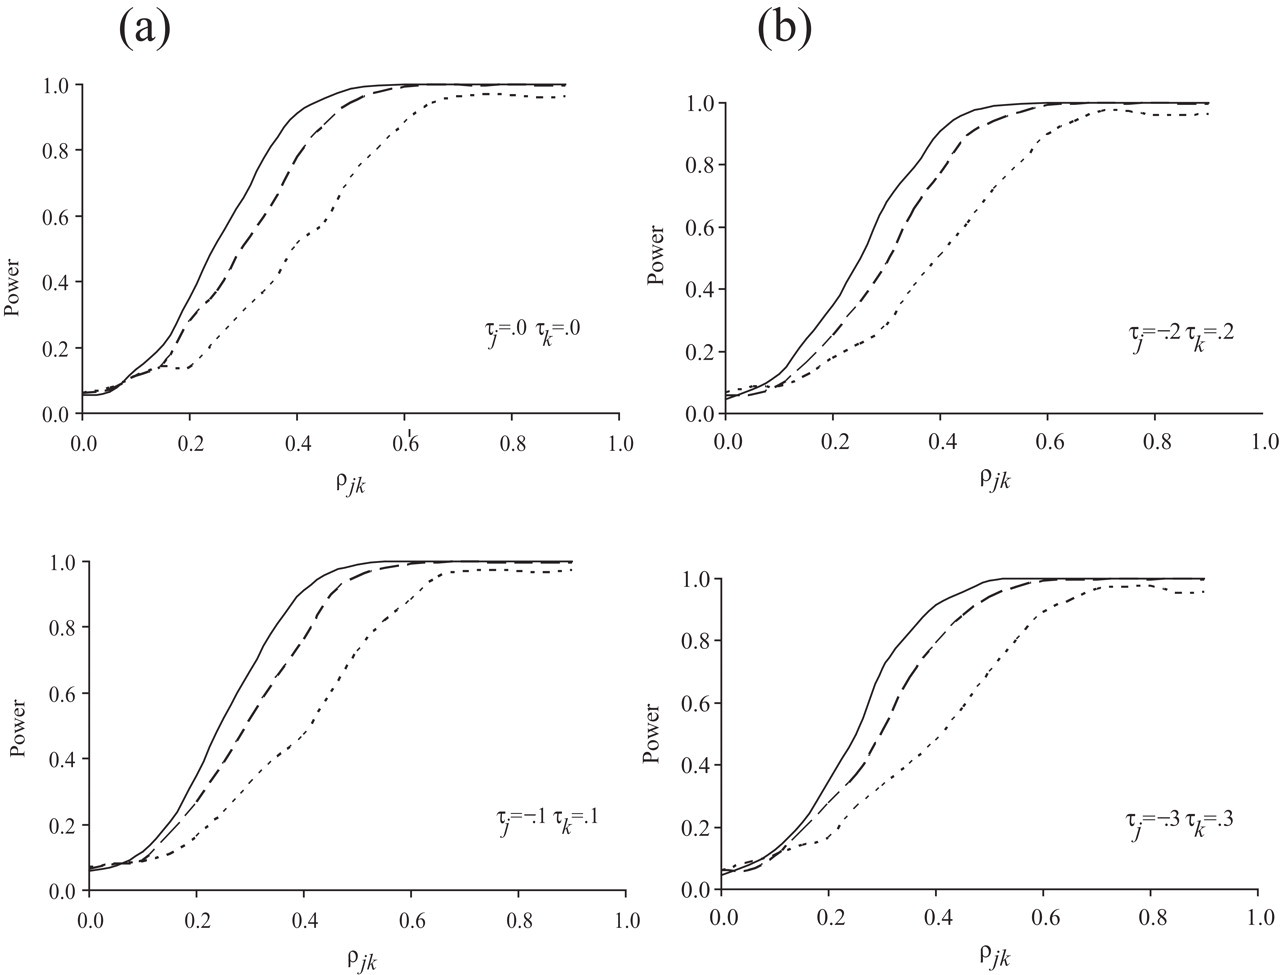
Estimated power functions of the Lagrange multiplier test of Equation
18 against Equation 19 for test lengths of
n=20 (dotted curve), 40 (dashed curve), and 60 (solid curve)
and combinations of speed parameters
Just as for any other powerful statistical test, when using the proposed test in this article we should be aware of a possible embarrassment involved in having too much power. For instance, if for a test of n=40 items the interest is not in detecting any correlations smaller than .6, it might be prudent to use the generalization of the test in the appendix, say, for c=.4.
The main point in this article is that RTs offer valuable information about the test takers' behavior during a test, which can be profitably used to check data sets for suspicious agreement between the RT patterns of different test takers. However, to prevent capitalization on spurious relations, the RTs should be analyzed under a model for their joint distribution for the test takers.
The bivariate lognormal model proposed in this article captures the two main sources of spuriousness: the effects of the differences in time intensity between the items and the speed at which the test takers operate during the test. The first type of effect leads to correlation between the observed RTs that should not be confused with actual collusion between test takers. The first two pairs of participants in Table 2 illustrated this point. The second type leads to additional similarity between RTs when two test takers happen to work at approximately the same speed. For example, the agreement between the general level of the RTs between Participants 2, 3, and 5 is due to their generally working slowly on the test and does not point at any coordination between their behavior.
A third type of quantity that should always be checked, especially when the value of
The examples also show how easy it is to conduct the proposed analysis. All relevant quantities have simple closed-form expressions that follow immediately from the item parameters and the RTs by the test takers. The only extra requirement is the calibration of the items under the RT model. However, this is also easily performed as part of the regular calibration of the test items (van der Linden, 2006).
Footnotes
Notes
Appendix
The necessary derivatives of the full log likelihood under the bivariate lognormal model in Equation 9 are given in the following two sections.