
Abstract
Multidimensional Item Response Theory (MIRT) has been proposed as a means to model the relation between examinee abilities and test responses. Three recent articles proved that when MIRT is used in ability estimation, an examinee’s score could theoretically decrease due to a correct answer or increase due to an incorrect answer. The current article examines the extent to which such “paradoxical results” can arise in practice. In an operational test designed to measure two dimensions, a substantial percentage of paradoxical results occurred when using a MIRT model with a prior correlation of 0 between abilities. Assuming a positive correlation between abilities reduced the prevalence of paradoxical results but did not eliminate them entirely. Associated issues in test fairness are discussed.
Keywords
Introduction
Multidimensional Item Response Theory (MIRT) is a framework for modeling examinee behavior using two or more latent dimensions of ability (Ackerman, 1996; Reckase, 1985). This framework is considered to be more realistic than its unidimensional counterpart, when performance is a function of multiple underlying traits. Another advantage of MIRT is that its models estimate ability along each dimension simultaneously, thus providing diagnostic information about several subscales in a single test.
Although MIRT is a relatively new development in the field of psychometrics, it has received considerable attention in the literature. Reckase (1997) provided a historical account, describing its relation to other tools (in particular, factor analysis and unidimensional IRT), giving examples of its applicability in practical problems, and suggesting topics for future work. There have been a number of recent articles on MIRT, including the study of its applications to longitudinal data (te Marvelde, Glas, Van Landeghem, & Van Damme, 2006) and subscale proficiency estimation (Yao & Boughton, 2007). The combination of MIRT and computerized adaptive testing has been researched by Finkelman, Nering, and Roussos (2009), Luecht (1996), Segall (1996, 2000), van der Linden (1999), and Veldkamp and van der Linden (2002).
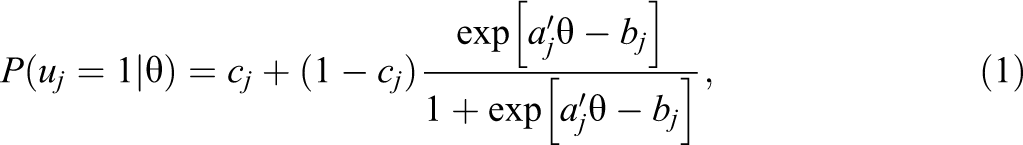
Hooker, Finkelman, and Schwartzman (2009) demonstrated a paradoxical property of MIRT models: when these models are used in ability estimation, it may be possible for an examinee to receive a higher score or classification by answering an item incorrectly than by answering it correctly, holding all other responses constant. In this situation, it could theoretically be beneficial for an examinee to deliberately give incorrect responses. This property can result in reported scores that appear contradictory and may be difficult to justify from the perspective of test fairness. Such paradoxical results do not occur in corresponding unidimensional models (2-parameter logistic [2PL], 3-parameter logistic [3PL], and normal ogive), where it is possible to obtain a higher score with fewer correct answers, but changing any individual answer from incorrect to correct will always increase the score.
Hooker et al. (2009), Hooker and Finkelman (2010), and Hooker (in press) explored paradoxical results theoretically and derived a set of sufficient conditions for them to occur. However, these articles did not indicate how often paradoxical results should be expected to arise in practice or how much they affect ability estimates when they do arise. As a result, practitioners do not currently know whether MIRT’s paradoxical property is largely theoretical or is a realistic concern for live tests. Our purpose here is to address this open question by investigating the prevalence and magnitude of paradoxical results in a real-data analysis. The analysis focuses on research questions that are covered less extensively by the theory of Hooker et al. (2009), namely, (a) the impact of paradoxical results alongside a MIRT model containing a guessing parameter and (b) the degree to which such results are avoided by increasing the prior correlation between dimensions. Hooker and Finkelman (2010) did study the latter of these questions but only for the special case of item bundles (testlets).
The article begins with a brief description of two MIRT models: the multidimensional 3-parameter logistic (M3PL) and the closely related multidimensional normal ogive model. We present a toy example to illustrate how paradoxical results can occur in the M3PL model and discuss related issues concerning test fairness. We then evaluate the prevalence and magnitude of paradoxical results in an operational data set, followed by concluding remarks.
The M 3 PL and Multidimensional Normal Ogive Models
Let

To provide scores to examinees, an ability estimate must be specified alongside the chosen model. Although the maximum likelihood estimate (MLE) of ability may be used in MIRT (van der Linden, 1999), Bayesian methods are commonly used to take advantage of the correlation between dimensions in the population of interest (Segall, 2000). The expected a posteriori (EAP) estimate is one such method; this estimate is denoted Individual elements are calculated by

An Example of the Paradox
This section provides a numerical example that demonstrates the existence of paradoxical results in the M3PL model. Unlike the real-data analysis appearing in a later section, our current example is designed only to motivate the general problem. As such, it is based on a short test and involves items whose discrimination parameters may be unrealistic. In both the numerical example and the real-data analysis, we have made use of EAP estimates, where the necessary integrals have been estimated by Gauss-Hermite quadrature to ensure that our results are not due to failures in optimization or to Monte Carlo integration.
Suppose two examinees, Examinee A and Examinee B, are both administered the same six two-dimensional items following the M3PL model; Examinee A’s response pattern is
To understand how such a result is possible, consider Table 1, which shows hypothetical M3PL parameters of the six items taken by the two examinees. If a bivariate standard normal prior distribution with zero correlation is assumed on θ, then the EAP after 5 items is (.11, −.08) for both examinees. Now observe that although Item 6 carries almost no discriminating power along Dimension 1, it is highly discriminating along Dimension 2 and has a greater difficulty parameter than the previous five items. Examinee A’s correct response to Item 6 thus indicates that he or she possesses a high ability along Dimension 2 and we adjust his or her estimate of ability in Dimension 2 upward in light of this new evidence. Given a higher estimate along Dimension 2, however, the previous incorrect answers to Items 2 and 4 can only be accounted for by reducing the ability on Dimension 1. The updated ability estimate reflects this new information.
Multidimensional 3-Parameter Logistic (M3PL) Item Parameters of the Illustrative Example
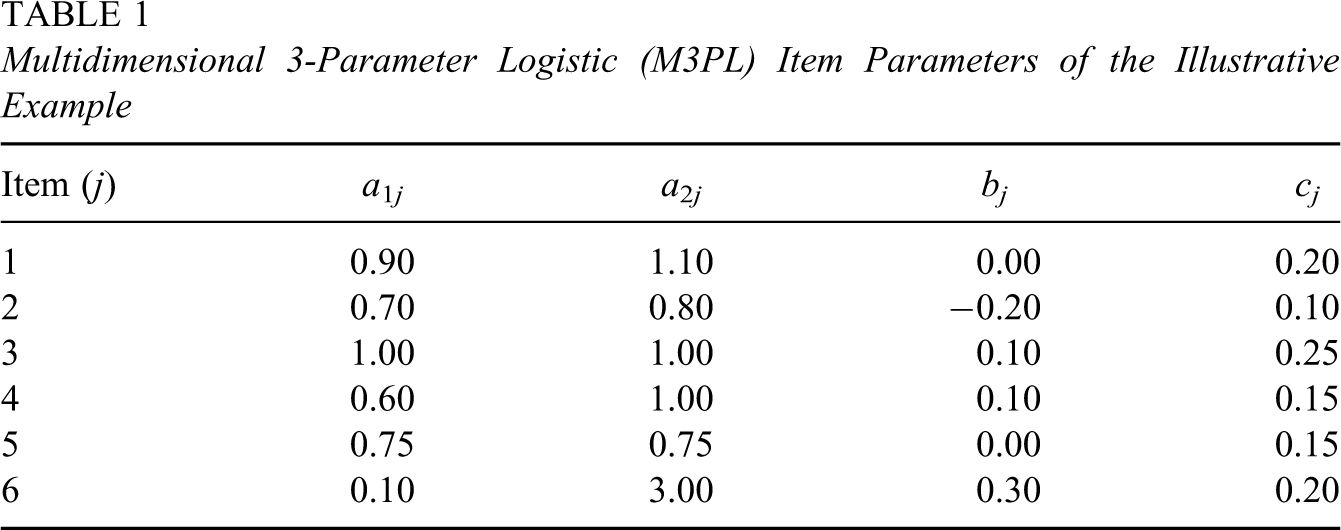
In other words, the correct response to Item 6 suggests that Examinee A’s acumen in Dimension 2 is strong. His or her two wrong answers to relatively easy items have come in spite of this Dimension 2 acumen, implying that he or she had a weaker ability in Dimension 1 than previously estimated. Conversely, Examinee B’s EAP estimate decreases along Dimension 2 after an incorrect response to Item 6. To explain his or her three correct responses to the first 5 items, however, the decrease along Dimension 2 is compensated by an increase along Dimension 1. The above motivation is borne out by actual computation of ability estimates: after the sixth and final item has been scored, the EAP estimate for Examinee A is (.00, .32), that of Examinee B is (.24, −.56), and thus the former examinee is estimated to have lower ability along Dimension 1 than the latter.
To examine this phenomenon from a geometric perspective, observe that after 5 items, the posterior density of θ is proportional to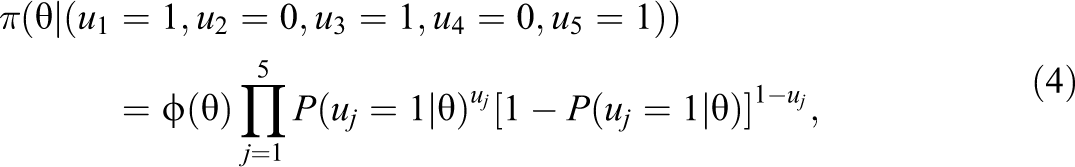
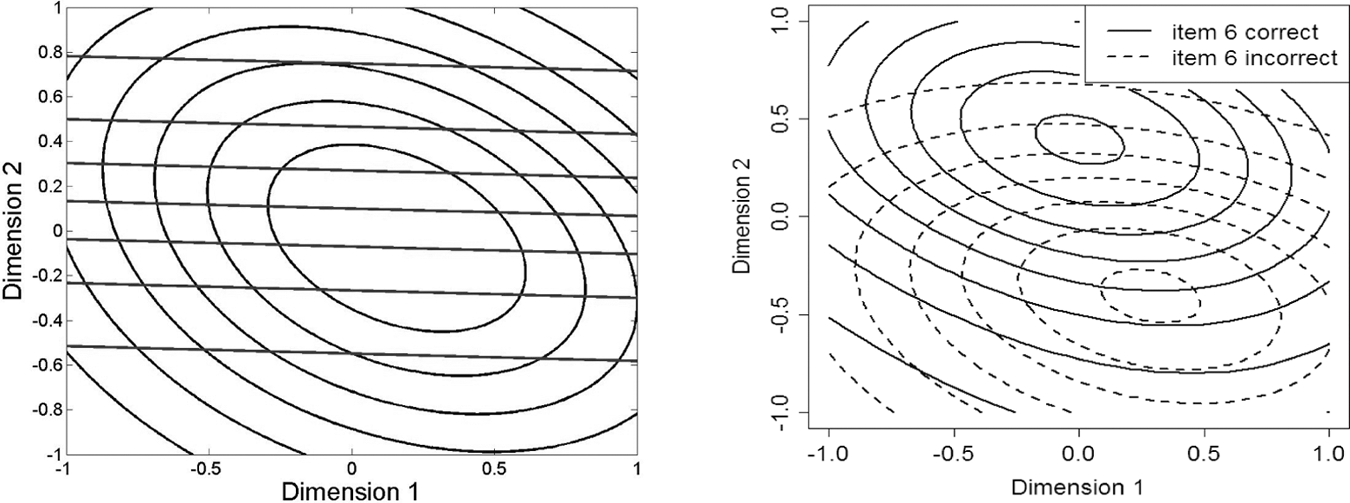
Left: contours of the posterior density after the first five items in Table 1 (curved lines) and the probability of answering the sixth correctly (straight lines). A correct answer increases the estimate along Dimension 2 but decreases the estimate along Dimension 1. Right: contours of the posterior densities after Item 6 is answered correctly (solid) and incorrectly (dashed).
How might this property result in a higher classification for Examinee B than Examinee A? Consider the multiple hurdle rule (Segall, 2000), where an examinee is required to exceed a threshold along every dimension to pass the test. In the example above, a correct response may actually push a particular examinee below the threshold on some dimension. For instance, if the test used the multiple hurdle rule and set its respective cuts at (.10, −.60), then Examinee B would pass but Examinee A would fail. Thus, it would be to Examinee A’s advantage to have given a deliberately incorrect response to Item 6.
Unexpected outcomes may also arise when reporting a single composite score that is derived from a linear combination of estimated traits. In particular, when a correct response results in the estimate of one dimension to increase and the other to decrease, the net effect may be for an incorrect response to produce a larger composite score. This phenomenon is most likely to occur when one dimension is given more weight than the other, or in the extreme case, when one dimension is considered a “nuisance” ability that is given zero weight in the composite. If Dimension 2 were considered a nuisance ability in the example above, or if the composite score gave enough weight to dimension 1, then Examinee B would again receive a greater score than Examinee A. See van der Linden (1999) for a description of composite scoring in MIRT; see Veldkamp and van der Linden (2002) for a review of nuisance abilities.
Our example may be unrealistic in some circumstances due to its use of a prior distribution in which the abilities are uncorrelated. In particular, because examinees who perform well in one subject area often tend to perform well in other subject areas, a positive prior correlation may be more realistic in operational settings. Therefore, we conducted a sensitivity analysis to investigate how the choice of prior correlation affects the existence and magnitude of the paradox in this example. It was expected that a positive correlation would lead to greater concordance of ability estimates between dimensions (Segall, 2000) and consequently an attenuation of paradoxical results. As shown in Figure 2, this is exactly what occurred: by increasing the correlation, the magnitude of the paradox steadily decreased until it ceased to exist by a correlation value of .35. Thus, the prior correlation between dimensions can be an important factor in the study of paradoxical results, especially in short tests where the prior distribution is more influential. The use of a high correlation comes with a trade-off: As the prior correlation increases, the diagnostic power of having multiple dimensions is reduced. In our particular example, assuming a correlation close to one resulted in each examinee’s Dimension 1 and Dimension 2 estimates to become essentially identical; this can be seen in the convergences that occur at the right-hand edge of Figure 2. All EAP estimates in Figure 2 were calculated from a 200-point uniformly spaced quadrature lattice on the range (−5,5) in each dimension.
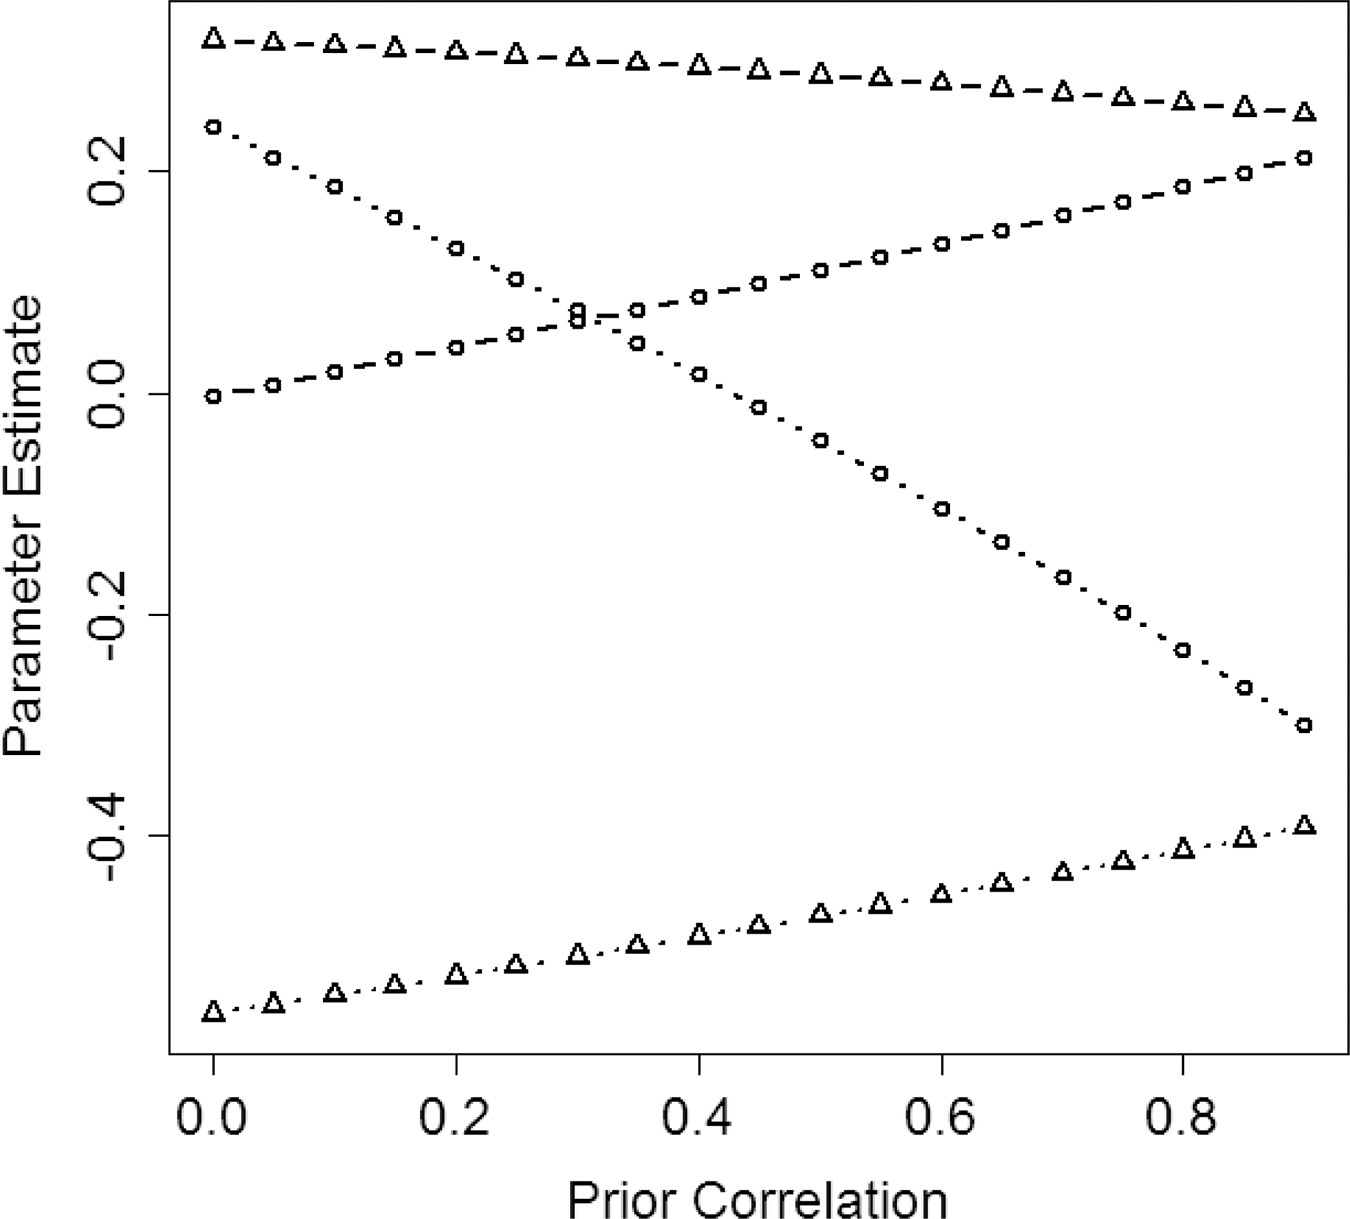
EAP estimates of ability as the prior correlation is increased from 0 to 0.9 in the 6-item numerical example. Circles represent ability Dimension 1, triangles Dimension 2. Dashed lines represent Examinee A, dotted lines Examinee B. A paradoxical result occurs on Dimension 1 for all correlations in which the dotted circles are above the dashed circles. EAP = expected a posteriori.
The above example shows that the M3PL model violates what may be considered a fundamental axiom of test fairness: A correct response should never be to the detriment of an examinee. Such a violation could be difficult to explain to the public in a high-stakes setting, and the fairness of the assessment could justifiably be called into question. For the purpose of illustration, our example involved an unusually short test and hypothetical item parameters; the prevalence of paradoxical results in real data is investigated in the next section.
It should be noted that the paradoxical property described above is not unique to MIRT. The “multiple-choice model” (Thissen & Steinberg, 1984, 1997), which was based on the work of Bock (1972) and Samejima (1968, 1979), may also result in an increased ability estimate after an incorrect response (Thissen & Steinberg, 1997). This is because the multiple-choice model uses separate probabilities (trace lines) for each multiple-choice option, and the probability of endorsing an incorrect option is not constrained to decrease as ability increases, leading to similar phenomena as described above. The M3PL’s paradoxical results are perhaps more surprising because its modeled probability of an incorrect response is always decreasing in each θ i , assuming positive item discrimination values and holding other abilities constant.
The existence of paradoxical results is also closely related to that of suppression in multiple linear regression. A traditional example of suppression involves two covariates that are positively correlated with a dependent variable, such that a univariate regression of the dependent variable on either covariate will yield a positive slope, but one of the slopes becomes negative when both are included in a multivariate regression (see Cohen & Cohen, 1983). The same phenomenon can also occur in generalized linear models similar to those used in MIRT. Paradoxical results arise for mathematical reasons akin to suppression (see Hooker et al., 2009, for example). However, they differ from it in that rather being associated with the inclusion of a new covariate (in this case, a new ability dimension), they involve the effect of changing the response to an individual item.
Method
The previous section provided motivation and a numerical example of a paradoxical property that is observed in the M3PL model. We now turn to practical consequences of this property. In particular, we describe the degree to which paradoxical results arose in the scoring of a real test for which a multidimensional framework was appropriate.
The operational data set consisted of 7,500 Grade 5 students who were part of an English Language Learners (ELL) program. The test of 72 dichotomously scored items was designed to measure two dimensions: a joint Reading/Writing dimension and a Listening dimension. Both of these dimensions were considered to be important constructs; that is, neither was a “nuisance” parameter in the sense of Veldkamp and van der Linden (2002). To separate the estimation of item and ability parameters, the M3PL model was first fitted to 5,000 “training” students who were chosen at random; EAP ability estimates were then calculated for the remaining set of 2,500 “test” students who were not used in the fitting of item parameters. The prevalence and magnitude of paradoxical results were analyzed on both the training and the test sets; because results were similar, only analysis of the test data is presented here.
To fit the M3PL model, a two-stage process was used. First, the guessing parameter of each item was estimated using the software PARDUX (Burket, 1991). The item discriminations and difficulty parameters were then estimated via an exploratory factor analysis using TESTFACT (Bock et al., 1999), with guessing parameters fixed at the values obtained by PARDUX. TESTFACT uses a multidimensional normal ogive model to estimate model parameters; this model is very close to the M3PL model when the discrimination parameters are scaled by 1.7. To examine the consequence of using an M3PL model for ability estimation, we reran the experiments below using a multidimensional normal ogive model and found no qualitative difference between the two. Five items were removed due to negative estimated discrimination values; the analysis provided herein is based on the remaining 67 items, all of which loaded positively along both dimensions. The resulting discrimination parameters are plotted in Figure 3.
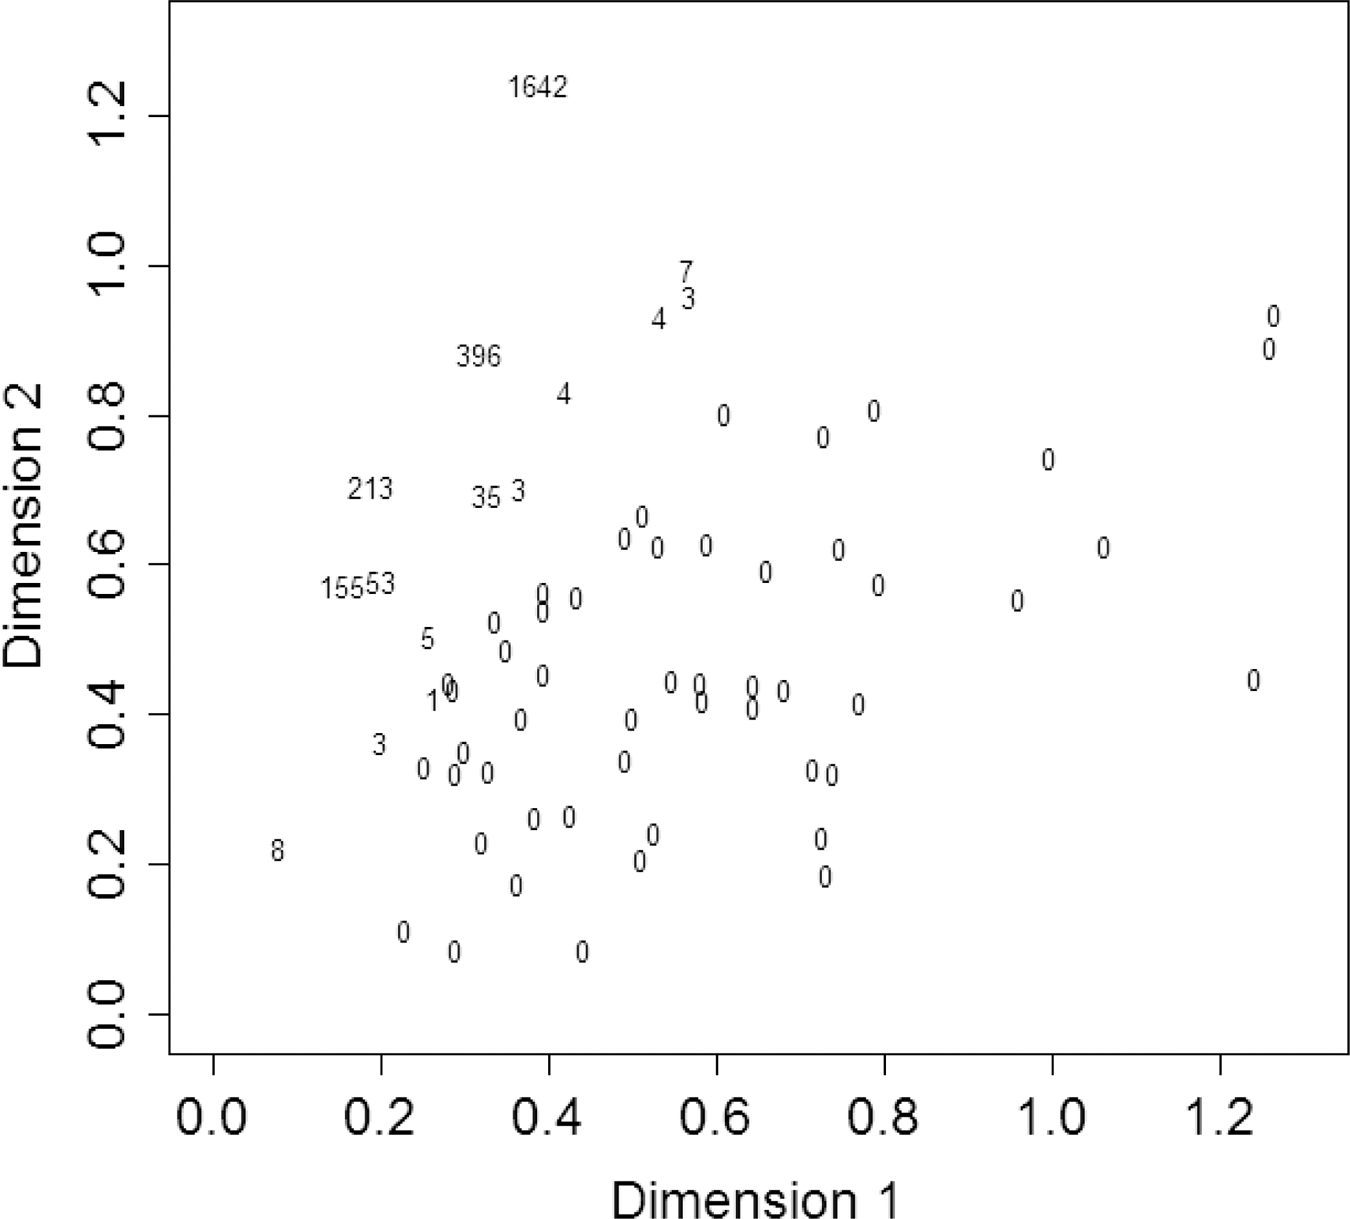
Item discrimination parameters for a 67-item test estimated from operational data. Points are labeled with the number of students for whom a paradoxical result occurred, that is, for whom the ability estimate on Dimension 1 increased by changing the item response from correct to incorrect. These results are most prevalent for those items that have highest relative discrimination on Dimension 2.
To analyze the prevalence of paradoxical results, we sought to calculate how much we could increase each student’s ability estimate along a specified dimension by changing a subset of his or her correct responses to incorrect. Due to the computational complexity of this problem, we did not find the global maximum of such “paradoxical improvement;” instead, an approximation was obtained through the following algorithm: Determine whether changing any of the student’s correct responses to an incorrect response would result in an increase of the ability estimate along dimension i. If so, let j
(1) denote the index of the item resulting in the largest magnitude of increase when the response is changed from correct to incorrect. For the purposes of the investigation, update the student’s answers so that his or her response to item j
(1) is incorrect and update his or her ability estimate according to this change. Repeat Steps 1–3 using the updated responses and ability estimates until no further increases of the ability estimate can be found.
The magnitude of paradoxical improvement along dimension i was defined as
For ability estimation, we used the EAP to investigate the sensitivity of our results to the choice of prior correlation between dimensions. The EAP was calculated using a product of 20-point Gauss-Hermite quadrature rules. To experiment with alternative prior covariance structures, the quadrature rule was taken with respect to diagonal axes in the directions (1,1) and (1,−1), enabling the investigation of the sensitivity to the prior distribution as described above. The three prior distributions used were all bivariate standard normal, with correlation values 0, .4, and .8. These priors were achieved by elongating the quadrature rule along the (1,1) axis and shrinking along the (−1,1) axis by appropriate amounts. As in our numerical example, we expected that under positive correlation, the two dimensions would borrow strength from one another, thereby producing a lower proportion of paradoxical results.
We note that the above definition of paradoxical improvement—the increase of an ability estimate by substituting incorrect responses for correct ones—is only one manner in which paradoxical results can occur. A student may also exhibit “paradoxical decline,” whereby his or her ability estimate decreases by substituting correct answers for incorrect ones. In this study, we report only paradoxical improvement for purposes of brevity and because students are more likely to focus on how their reported scores could have been higher, rather than lower. If we included both paradoxical improvement and paradoxical decline in the definition of what constitutes a paradoxical result, the prevalence of such results could only increase.
Results
Reading/Writing
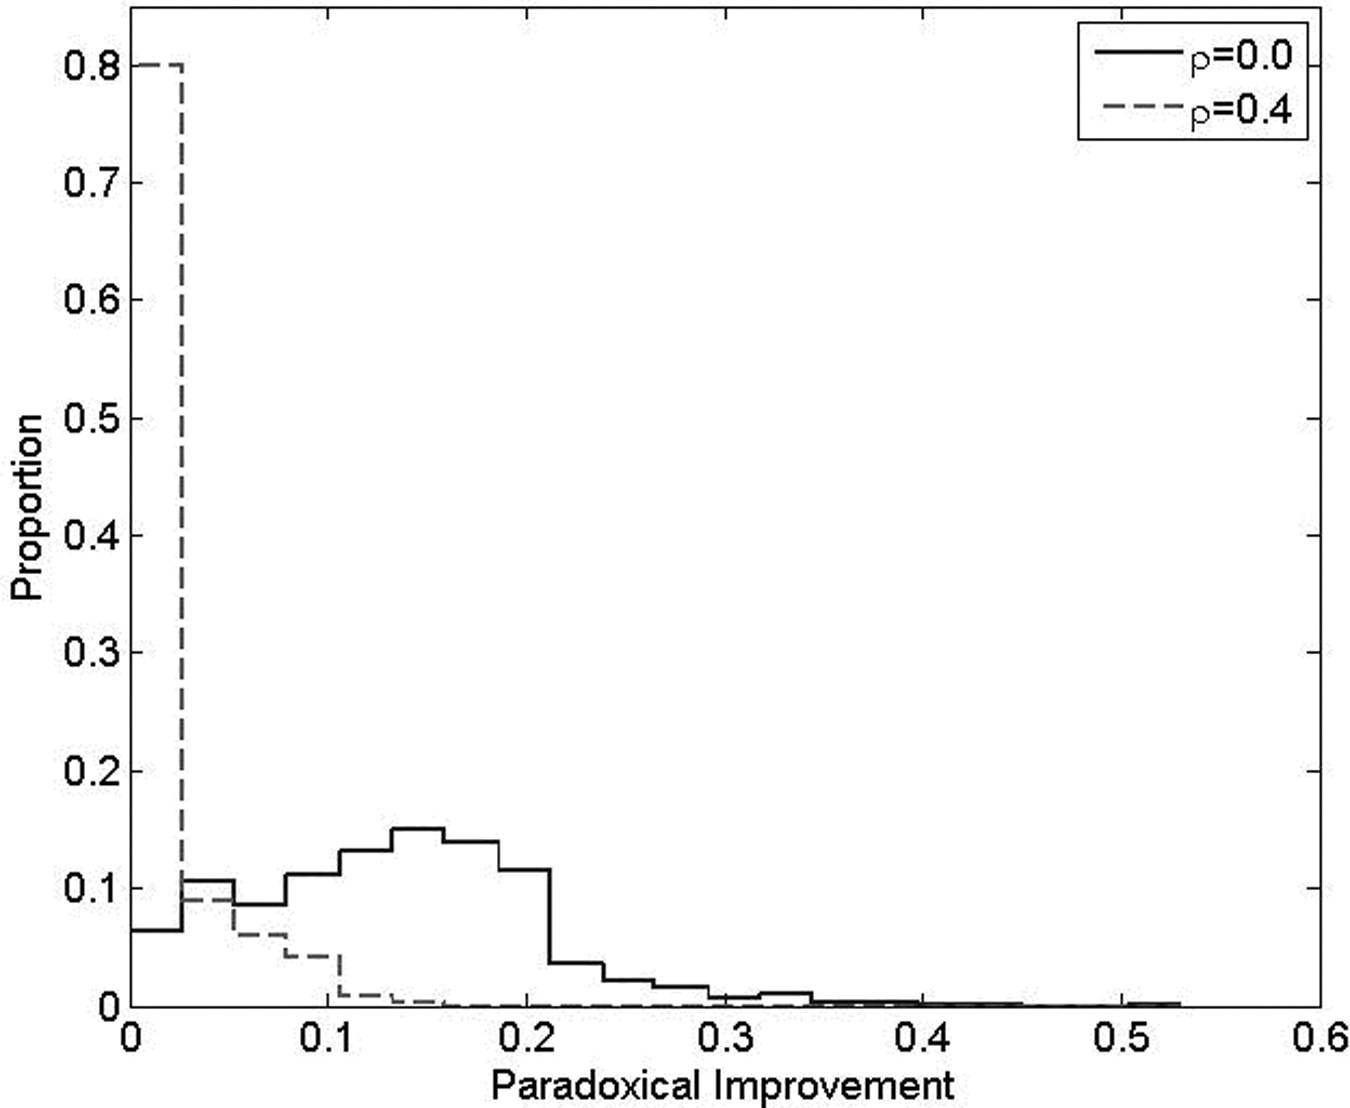
We first examined how much paradoxical improvement could be achieved for each student along the Reading/Writing dimension, using the iterative algorithm described in the previous section. Figure 4 displays histograms of
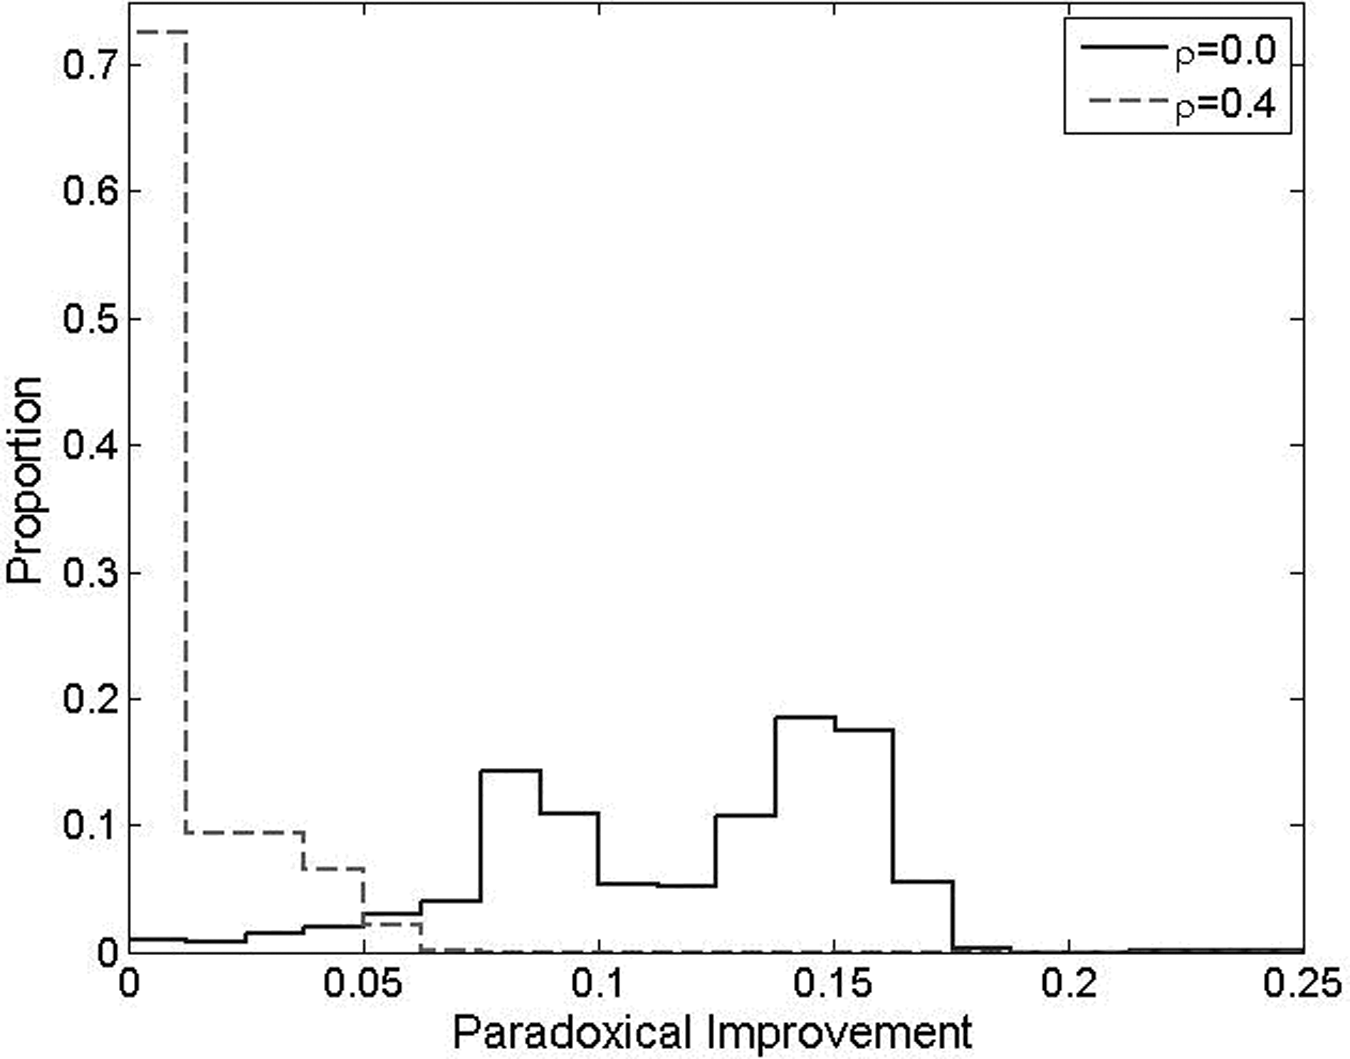
Histograms of paradoxical improvement obtained from a greedy algorithm on real data, Grade 5 ELL students. Correctly answered items were examined for improvements in EAP estimates along the Reading/Writing dimension, if the answers were made incorrect. Solid line: assuming prior correlation of 0; dashed: prior correlation of .4. Results corresponding to a correlation of .8 do not appear; under this condition, all students exhibited zero or small paradoxical improvement. EAP = expected a posteriori; ELL = English Language Learners.
To understand which items were most associated with paradoxical results, we labeled each of the items in Figure 3 with the number of students for whom it would produce paradoxical improvement at a correlation of 0. Consistent with our expectations, the items that most often produced paradoxical improvement in Reading/Writing were those that placed greatest relative weight on Listening. This would seem to suggest that practitioners could avoid paradoxical results using items with high relative discrimination on Reading/Writing. Such a strategy would not be successful, however, if MLEs are used in ability estimation: Hooker et al. (2009) demonstrated that the item with smallest relative loading on the dimension of interest will always cause the MLE to behave paradoxically, even if the item still loads primarily on that dimension. Additionally, when EAP ability estimates are used, paradoxical results can be guaranteed for items whose relative loading exceeds a threshold that depends on the prior and the other items in the test.
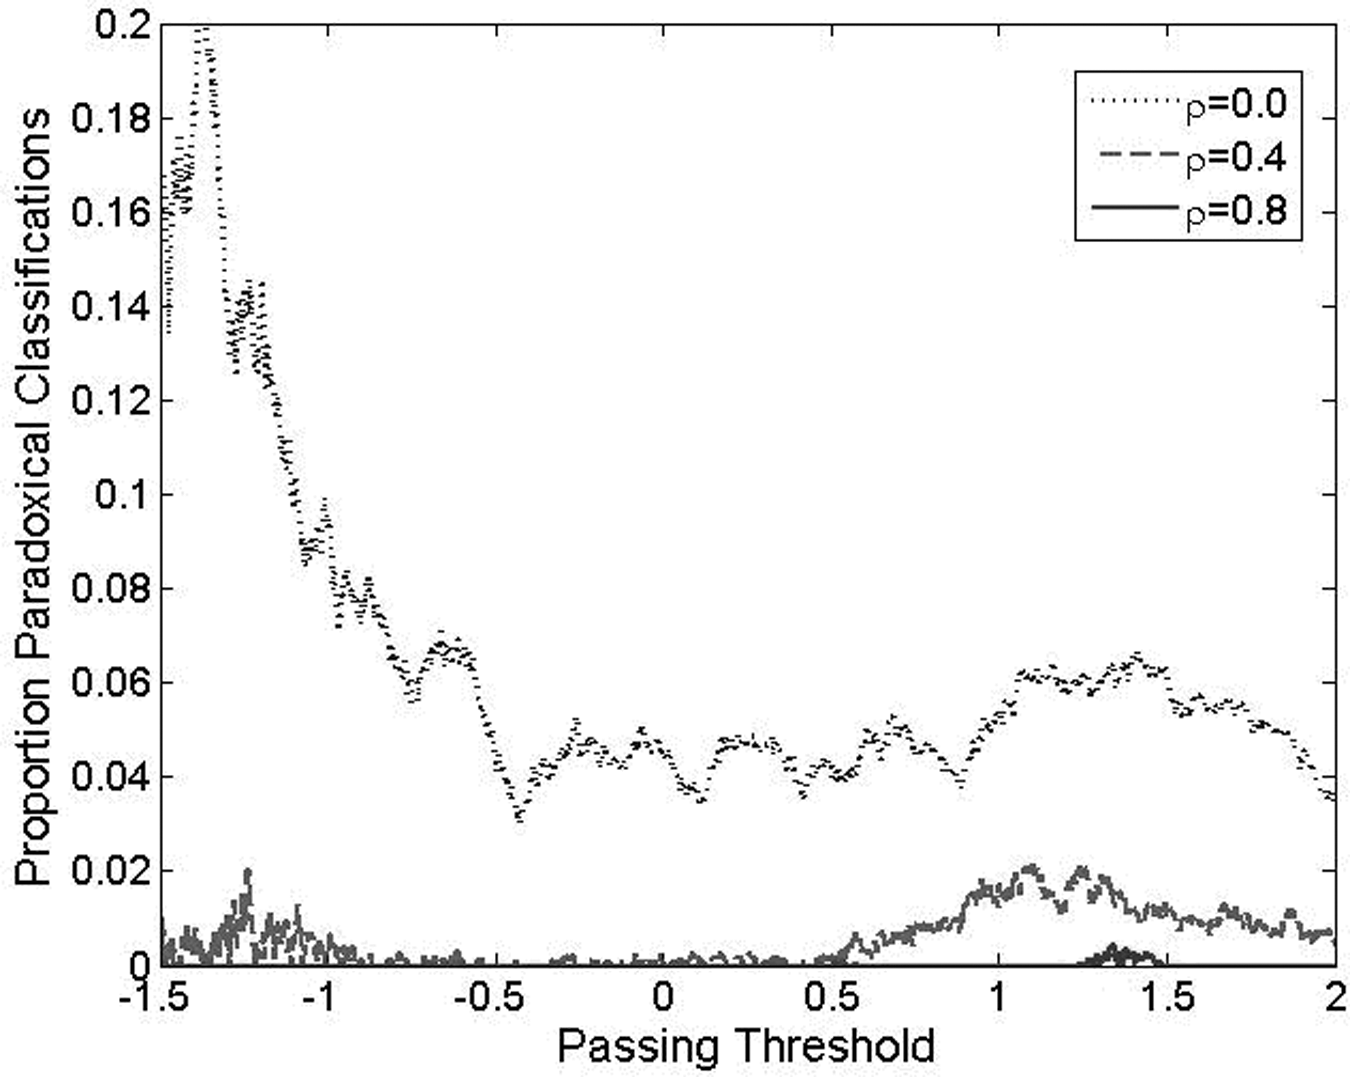
In addition to studying the magnitude of increase associated with paradoxical results, we investigated whether such an increase could affect classification decisions of students. Suppose students are to be classified into one of two mutually exclusive performance levels along the Reading/Writing dimension. Letting
Figure 5 plots the proportion of failing students with paradoxical classifications against the hypothetical cut point
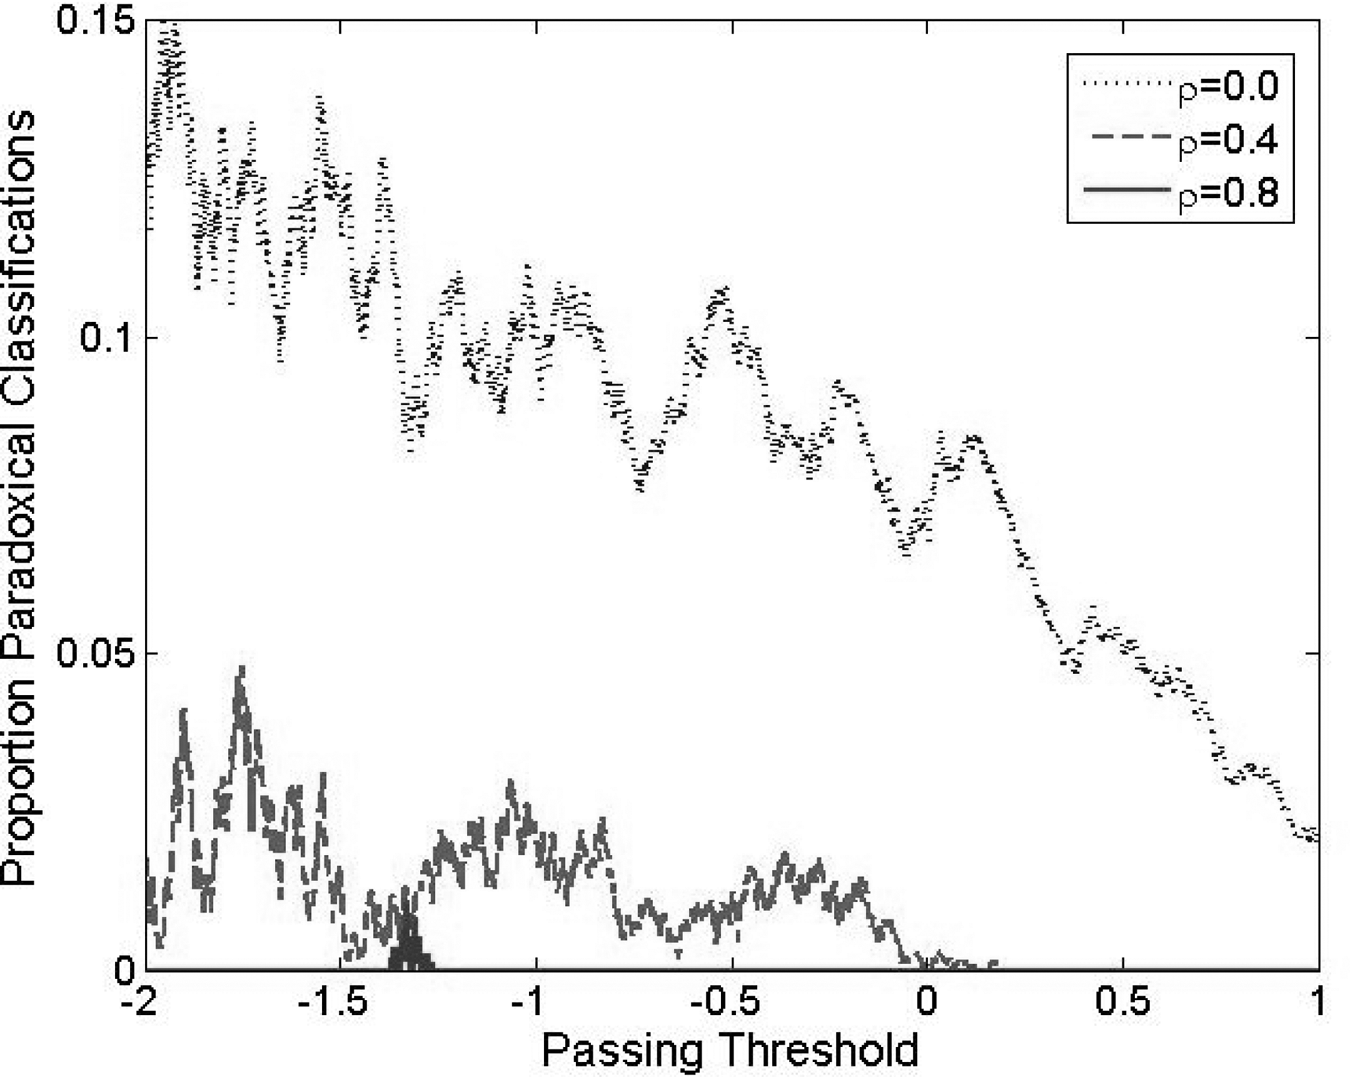
Proportion of failing Grade 5 ELL students who would have passed Reading/Writing, if they had gotten more items wrong, plotted against hypothetical passing thresholds for the Reading/Writing dimension. Dotted line: assuming prior correlation of 0; dashed: prior correlation .4; solid: .8. ELL = English Language Learners.
Listening
Figure 6 is an analogue to Figure 4 for the Listening dimension: It displays histograms of
Histograms of paradoxical improvement obtained from a greedy algorithm on real data, Grade 5 ELL students. Correctly answered items were examined for improvements in EAP estimates along the Listening dimension, if the answers were made incorrect. Solid line: assuming prior correlation of 0; dashed: prior correlation of .4. Results corresponding to a correlation of .8 do not appear; under this condition, all students exhibited zero or small paradoxical improvement. EAP = expected a posteriori; ELL = English Language Learners.
We next return to the effects of paradoxical improvement on pass/fail decisions. Analogous to Reading/Writing, we define a paradoxical classification in Listening as the joint event that
Proportion of failing Grade 5 ELL students who would have passed Listening, if they had gotten more items wrong, plotted against hypothetical passing thresholds for the Listening dimension. Dotted line: assuming prior correlation of 0.0; dashed: prior correlation .4; and solid: .8. ELL = English Language Learners.
Summary and Discussion
Hooker et al. (2009), Hooker and Finkelman (2010), and Hooker (in press) investigated a paradoxical property of MIRT scoring, namely, that examinees may see their scores increase due to an incorrect response or decrease due to a correct response. This property arises from the simultaneous measurement of multiple traits. Aside from models that use separate trace lines for each answer choice, unidimensional models do not give rise to paradoxical results except under very unusual conditions, such as a negative discrimination parameter. Readers may note that in unidimensional IRT, an ability estimate need not be increasing in the raw number of items answered correctly: For instance, when pattern scoring is used alongside the 2PL model, an examinee who correctly answers 10 low-discrimination items may receive a lower score or classification than an examinee who correctly answers 9 high-discrimination items. However, we emphasize that such a scenario is distinct from the M3PL’s paradoxical property discussed herein. Indeed, in the unidimensional case, scores and classifications are generally increasing in responses to individual items: Changing an answer from incorrect to correct will always be beneficial to the examinee. This is not the case in MIRT, leading to the situation that it may theoretically be in an examinee’s best interest to deliberately give a wrong answer. Such a phenomenon is directly observable: Two examinees comparing answers may find that one has demonstrably done as well or better on every item and yet garnered a lower score.
Hooker et al. (2009), Hooker, Finkelman (2010), and Hooker (in press) were theoretical in nature; the current study provided motivation as to why paradoxical results occur and examined their prevalence and magnitude in operational data, particularly in scenarios outside the assumptions of the above papers. Specifically, we first presented a worked example in which two examinees displayed the same response pattern except for one item; the examinee answering this item incorrectly could receive a higher score or classification than the one answering it correctly. Second, we assessed the extent of paradoxical results using an operational data set. At a correlation of 0, nonnegligible paradoxical improvement was observed for most students. A significant proportion of students could receive failing marks in either dimension due to their correct responses to certain items; the same students could potentially pass the test if they instead answered those items incorrectly. Such problems were by and large ameliorated when assuming a correlation value of .4 or .8; however, there still existed students with paradoxical classifications at both of these values. Hence, even when practitioners can safely assume moderate-to-high correlation between traits, the paradox described in this article is an issue for the M3PL model. We also note that as tests become longer, the regulatory effect of the prior diminishes, increasing the potential for paradoxical results even at high correlation.
In light of these findings, practitioners may hesitate to use the M3PL in some high-stakes settings. At the very least, examinees exhibiting paradoxical improvement in a high-stakes test should be flagged so that an informed policy decision can be made about their scores and classification statuses. However, users of the M3PL for diagnostic (low-stakes) purposes may be undeterred by its paradoxical results, since issues of fairness are less of a concern in such contexts.
One limitation of the study is that we have only considered items that load onto both dimensions. In many applications, the practitioner may assume that the items exhibit simple structure, that is, that each item loads onto exactly one dimension. In this special case, MIRT is not subject to paradoxical results if the model is two-dimensional or if the abilities are assumed to be uncorrelated. However, Hooker (in press) proved the surprising result that when three or more dimensions are used, paradoxical results can occur when the abilities are assumed to exhibit positive correlation.
The current article has focused on a paradoxical property of the M3PL and multidimensional normal ogive models. Although the specific study of these models is certainly worthwhile in itself, it is natural to ask whether the paradox arises in other settings. Statistical theory (Hooker et al., 2009) has proven its existence in non-compensatory MIRT; real-data analysis should also be performed for this set of models. Additionally, empirical research should be conducted for the case of three or more dimensions, including a sensitivity analysis of how the prevalence and magnitude are influenced by imposing different prior correlation matrices. Finally, sound policies should be established to handle paradoxical results as they arise in practical applications of MIRT. All of these topics will be addressed in future work.
Footnotes
Acknowledgements
The authors would like to thank Keith Boughton and Lihua Yao for their helpful comments. Additionally, we are grateful to the Editor and an anonymous reviewer for their suggested improvements to an early draft of the paper.