






Abstract
This study proposes a residual-based item parameter drift (RIPD) detection framework for computerized adaptive testing (CAT). Introducing three statistics (RIPD R , RIPD S , and RIPD RS ), the framework detects drift by comparing focal group responses to synthetic drift-free reference responses generated without item recalibration. Three simulation studies evaluated the RIPD framework under curriculum-related drift and item compromise scenarios. Results indicated that RIPD R and RIPD RS consistently outperformed the pseudo-count D2 method, demonstrating robust false positive control and detection power, particularly with sufficiently large reference groups and a longer test length. While RIPD S was critical for detecting nonuniform drift, it exhibited inflated false positive rates under severe contamination. Overall, the findings support RIPD as a practical and scalable method for post-administration IPD detection in CAT.
Keywords
1. Introduction
1.1. Theoretical Background
In item response theory (IRT) models, it is assumed that the probability of correctly answering a given item remains invariant across test occasions for examinees with identical proficiency levels, particularly for dichotomously scored items (e.g., 0 = incorrect, 1 = correct). However, various factors such as exposure to test content, instructional shifts, or significant socio-cultural events may alter response patterns, leading to deviations from expectations based on the originally estimated item parameters. Such deviations are formally recognized as item parameter drift (IPD). Conceptually, IPD can be viewed as a special case of differential item functioning (DIF) across time (Lord, 1980). Therefore, IPD refers to systematic changes in the statistical characteristics of test items, including difficulty, discrimination, or guessing parameters, over time or across multiple test administrations (Han & Guo, 2011; Zhang, 2014).
The presence of IPD can deteriorate scoring accuracy and pose serious threats to test validity and reliability. In computerized adaptive testing (CAT), where item difficulties are tailored dynamically to each examinee’s ability level, the occurrence of IPD in operational items that have been previously calibrated and are used for scoring can be particularly detrimental compared to in conventional nonadaptive testing. This elevated impact stems from the fact that fewer items are typically administered per examinee in CAT, making the parameter invariance of each item critical for maintaining scoring precision (Kang & Chang, 2016; Zwick et al., 1994). Furthermore, because item selection is adaptively driven by interim ability estimates, the administration of items exhibiting IPD, particularly in the early stages of the test, can lead to biased ability estimates, resulting in suboptimal item selection and further degrading the precision and validity of test scores. Therefore, developing reliable and efficient methods for detecting IPD on operational items is essential for ensuring the quality and integrity of CAT.
Han and Guo (2011) identified three primary sources of IPD. First, security breaches may result in compromised or leaked test items, typically affecting a subset of test-takers who have prior access to the item content. Most testing programs actively monitor and investigate potentially compromised items to maintain test security and remove them from the item pool as needed. Second, significant historical or socio-cultural events, such as national elections or highly publicized news, can increase test-takers’ familiarity with certain item content, rendering some items unexpectedly easier. Items sensitive to such external events are generally identified and excluded during item pool construction in CAT. As such, the overall impact of this type of IPD is usually limited in practice.
The third source, involving exam practice effects and curriculum changes, can exert a more systematic influence on IPD. For instance, repeated exposure to practice tests may improve test-taking strategies without reflecting actual growth in the construct being measured. Similarly, updates to curricula can alter instructional emphasis, making certain items more accessible to test-takers exposed to the revised content. The extent of IPD from this third source can vary among test-takers depending on their level of exposure and engagement with the updated instructional content or practices (Bock et al., 1988; Cook et al., 1988; Kang & Chang, 2016).
Commonly used approaches for detecting IPD, primarily developed for linear tests, typically involve comparing two sets of item parameter estimates or item response functions (IRFs) across groups: one based on the originally calibrated item parameters in the item bank and the other based on recalibrated parameters from new data (e.g., Lord, 1980; Wells et al., 2014). However, recalibration in CAT faces inherent methodological hurdles due to the adaptive nature of data collection (Cappaert et al., 2018; Kang & Chang, 2016). In CAT, operational items are adaptively administered to examinees within a restricted ability range tailored to the item’s difficulty, leading to substantial missing data and sparse response matrices. This data structure creates fundamental issues for recalibration. First, item parameter estimation, particularly for the IRT three-parameter logistic model (3PLM), is often computationally unstable because the adaptive algorithm prevents collecting data on low-ability examinees correctly guessing difficult items (Glas, 2010). Second, highly optimized adaptive designs can violate the ignorability assumptions of missing data mechanisms, potentially causing parameter estimates to become biased (Glas, 2010). Finally, the restriction of the ability range in operational data hinders accurate recovery of discrimination and difficulty parameters, often necessitating costly embedded field testing designs to ensure stability (Ito & Sykes, 1994; Lim & Han, 2022). Consequently, recalibration-based approaches are often impractical for routine IPD detection in CAT.
Several methods have been proposed to monitor IPD on operational items in CAT without requiring item recalibration. For instance, Zhang (2014) and Zhang and Li (2016) introduced sequential monitoring procedures based on classical test theory (CTT) and IRT, respectively, to assess parameter drift in real-time. Kang and Chang (2016) proposed a method using informational distance and divergence measures to detect drift in multidimensional CAT. Additionally, Cappaert et al. (2018) suggested a pseudo-count D2 method that adjusts for the sparse data inherent in adaptive testing. However, these methods are not without limitations. Sequential monitoring procedures typically require establishing optimal design parameters (e.g., moving window sizes, cutoffs for hypothesis testing) tailored to specific item pools prior to implementation, which can be operationally complex or, worse, inapplicable. Furthermore, certain statistics lack known asymptotic distributions (e.g., Cappaert et al., 2018; Kang & Chang, 2016), necessitating bootstrap procedures to establish critical values for hypothesis testing.
More recently, Lim et al. (2022) and Lim and Choe (2023) introduced a residual-based differential item functioning (RDIF) detection framework grounded in IRT, which offers several appealing features for application in CAT. First, unlike traditional nonparametric DIF detection methods, such as Mantel–Haenszel (Holland & Thayer, 1988) and SIBTEST (Shealy & Stout, 1993), the RDIF framework does not require matching variables such as observed total scores or ability bins. Second, it does not rely on item recalibration in CAT, as the originally estimated item parameters can be directly used for residual-based DIF analyses. Although Lim et al. (2022) applied the RDIF framework using parameters estimated from pooled data of reference and focal groups based on linear test forms, this step is unnecessary in CAT if pre-calibrated item parameters are available. Since operational CAT items are typically calibrated during development using representative samples of the test population, these stored parameters can be used as fixed values in RDIF-based analyses, eliminating the need for recalibration in adaptive environments. These characteristics make the RDIF framework computationally efficient and scalable, even in large-scale CAT programs.
As noted by Lord (1980) and Veerkamp and Glas (2000), IPD may be viewed as a special case of DIF, as both involve evaluating whether item response behavior differs between two groups—typically a new sample of examinees compared against a historical reference group. From this perspective, the RDIF framework offers a theoretically grounded and practically feasible foundation for detecting IPD in CAT, particularly in retrospective testing contexts where recalibration is impractical or infeasible.
Building on this rationale, the present study proposes a new procedure for detecting IPD in CAT by adapting the RDIF framework. The proposed method provides a practical alternative to existing approaches, as it eliminates the need for item recalibration and employs test statistics with known asymptotic sampling distributions, enabling formal hypothesis testing without relying on bootstrapping. Specifically, the procedure is designed for retrospective detection of IPD after CAT administrations have been completed. While real-time IPD monitoring, such as the sequential procedures proposed by Zhang (2014) and Zhang and Li (2016), remains important for test security and score validity, retrospective IPD analysis also plays a critical role in ongoing test maintenance and quality assurance.
In many (if not most) large-scale CAT programs, test delivery may occur continuously throughout the year, while item pool management is typically organized into discrete operational cycles for development, calibration, replenishment, and planned rotation. This cycle-based organization creates a natural unit for evaluating item parameter stability because gradual security breaches, practice effects, or curriculum shifts often accumulate over the cycle and may not be identifiable through fragmentary real-time monitoring alone, particularly when a substantial portion of the operational pool changes with rotation. Once a cycle closes, psychometricians can leverage the complete aggregated response record from that cycle to conduct a comprehensive assessment of item behavior under actual operational conditions. Retrospective IPD analysis, therefore, becomes a core component of routine pool maintenance. It maximizes statistical power, yields more stable, interpretable, and actionable evidence, and provides a coherent cycle-level snapshot of how the pool performed for the operational population. Furthermore, it provides the necessary evidence for high-stakes decisions, such as rescoring examinees to ensure fairness, thereby securing the long-term validity and health of the CAT program.
In the remainder of this article, we first provide a brief overview of existing approaches for detecting IPD in CAT environments, followed by a review of the pseudo-count D2 method (Cappaert et al., 2018), which serves as a benchmark for evaluating the performance of the proposed procedure. We then introduce the new residual-based IPD (RIPD) detection framework, which builds upon the RDIF methodology. A series of simulation studies is conducted to examine the statistical performance of the RIPD procedure, including Type I error control and detection power. The article concludes with a discussion of the findings and implications, along with suggestions for future research.
1.2. IPD Detection Approaches in CAT
Zhang (2014) and Zhang and Li (2016) proposed sequential procedures based on CTT and IRT, respectively, to monitor IPD in real time during CAT administrations. Both methods detect IPD on CAT pool items by computing standardized statistics that compare observed performance in a recent moving sample to expected performance under the assumption that the item remains uncompromised. If the statistic exceeds a pre-specified cutoff, the item is flagged as potentially compromised. To implement these procedures, two key parameters, namely the moving sample size and the cutoff value, must be predetermined through simulation studies tailored to the specific CAT environment. This requirement poses practical challenges when adapting these procedures for retrospective IPD analysis. According to Zhang and Li (2016), determining optimal cutoff values and moving sample sizes depends heavily on the assumed prevalence of drifted items in the item pool. Since the actual proportion of drifted items is unknown a priori in empirical settings, accurately establishing these parameters for retrospective use could be difficult.
Lee and Qian (2022) extended these sequential procedures by proposing a hybrid threshold approach, employing item-level local thresholds in the early monitoring stages and a global threshold at the final decision stage. This hybrid method improves detection power, particularly under gradual item compromise scenarios. Nevertheless, their approach still requires prior simulation studies to determine appropriate thresholds and remains primarily oriented toward real-time monitoring.
Kang and Chang (2016) proposed nonparametric approaches for detecting IPD in multidimensional CAT by comparing observed and reference multidimensional IRFs using informational distance and divergence measures. While their methods avoid item recalibration and are applicable to multidimensional IRT settings, they lack known asymptotic sampling distributions for the drift statistics, necessitating bootstrap procedures to determine appropriate cutoff values. Furthermore, these approaches were developed exclusively for multidimensional models, thereby limiting their applicability in CAT administrations based on unidimensional IRT models.
Cappaert et al. (2018) proposed several CAT-adjusted D2-based approaches for retrospective IPD detection, among which the pseudo-count D2 method, built on Stone’s (2000) pseudo-count framework, demonstrated superior detection power while maintaining acceptable Type I error rates. This method outperformed the traditional D2 approach by accounting for the actual ability distributions of examinees in CAT. However, a primary limitation is its reliance on bootstrap procedures to establish cutoff values. Specifically, selecting an appropriate set of unaffected items for baseline comparisons can be challenging, and variability in item response counts across the CAT item pool complicates the identification of optimal empirical distributions for determining critical thresholds.
In this study, the pseudo-count D2 method is used as a benchmark to evaluate the performance of the newly proposed RIPD detection procedures, as it is suitable for retrospective IPD analysis after CAT administrations have concluded. The details of the pseudo-count D2 method are briefly reviewed in the following section.
2. Method
2.1. Pseudo-Count D2 Method
The pseudo-count D2 method (Cappaert et al., 2018) is an adaptation of the traditional D2 statistic designed specifically for CAT environments, in which item exposure is conditional on the examinee’s ability. Unlike the traditional D2 statistic (e.g., Wells et al., 2014), which utilizes observed responses at discrete ability levels, the pseudo-count D2 distributes each examinee’s response contribution across multiple ability points based on posterior probabilities.
Let X be the binary response of an examinee to an item, where

where θ denotes the examinee’s ability parameter, and
Given the IRT model, the posterior probabilities for examinees’ ability levels are estimated. For each examinee, we define a set of K quadrature points (

where
For a given item m, the pseudo-count

where
Then, the pseudo-proportion for correct responses at each ability level

where
Finally, the pseudo-count D2 statistic is computed as:

where
2.2. Residual-Based IPD Detection Framework
To detect IPD in CAT, we adapt the RDIF detection framework proposed by Lim et al. (2022) and Lim and Choe (2023), resulting in a new RIPD detection framework. This new framework incorporates three statistics: RIPD R , RIPD S , and RIPD RS , which directly correspond to RDIF R , RDIF S , and RDIF RS , respectively, as defined in the RDIF framework. Because the computation of RIPD statistics mirrors that of the original RDIF framework, we briefly review the derivation of the RDIF statistics below, which serve as the basis of the RIPD methodology.
Derivation of RDIF Statistics
The RDIF statistics are based on item score residuals, defined as the difference between observed responses and model-predicted probabilities under an IRT model. In this framework, item parameters, denoted as
For a specific item (recall that the item superscript is omitted for simplicity), let

The first statistic, RDIF R , is designed to effectively detect uniform DIF by comparing the mean raw residuals between the two groups as:

Under the null hypothesis H0 of no DIF, the expectation and variance of RDIF R are given by:


The second statistic, RDIF S , is primarily devised to detect nonuniform DIF by comparing the mean squared residuals between the two groups:

Under H0, the expectation and variance of RDIF S are:


Given that the observed item responses are independent but not identically distributed (due to varying response probabilities conditional on examinees’ distinct ability levels) in the IRT models, the null distributions of RDIF R and RDIF S asymptotically follow normal distributions via Lyapunov’s central limit theorem (Billingsley, 1995):

Accordingly, both statistics allow for standard Z-tests to assess the statistical significance of DIF using their respective null distributions.
Although RDIF R and RDIF S are each tailored to be effective in detecting uniform and nonuniform DIF, respectively, applying both statistics independently may raise concerns about inflated family-wise Type I error due to multiple testing on a single item (i.e., conducting two separate tests for the same item). To address this, a joint statistic known as RDIF RS was developed to identify both types of DIF within a unified single-test framework.
Let

where

The covariance term

Using these quantities, the RDIF RS statistic is constructed as a Wald-type test statistic:

which follows an asymptotic
Procedure for Applying the RIPD Framework in CAT
The RIPD framework incorporates three parallel statistics, RIPD R , RIPD S , and RIPD RS , each corresponding to the three RDIF statistics: RDIF R , RDIF S , and RDIF RS . Each of these is computed using procedures analogous to those in the RDIF framework but adapted for use in CAT environments. To ensure valid detection of IPD in this context, the following conditions need to be satisfied. First, the reference group data correspond to a baseline sample in which no IPD is assumed to be present. This group provides the expected response behavior under invariant item parameters. Second, the focal group data refer to the new group of test-takers whose responses are analyzed to assess whether IPD has occurred on operational items in the CAT pool. Third, in contrast to RDIF, which requires a single item calibration based on pooled data from both groups when pre-calibrated item parameters are unavailable as originally proposed by Lim et al. (2022), the RIPD framework avoids recalibration. Instead, it uses the original item parameters from the CAT pool, which are assumed to be unaffected by IPD, for computing residuals. The procedure for obtaining the reference and focal group data, along with the specific steps for implementing the RIPD approach in CAT, is described in the following section.
The procedure for implementing the RIPD framework in CAT consists of three main steps:
Focal group response collection: Administer a CAT using the operational item pool to the target (i.e., new) group of examinees whose responses are to be evaluated for potential IPD. For each examinee, retain their
Reference group simulation: Conduct a CAT simulation using the same item pool and algorithmic settings as in Step 1. Importantly, use the identical
Computation of RIPD statistics with purification: Compute the RIPD
R
, RIPD
S
, and RIPD
RS
statistics using the same computational procedures as for the RDIF statistics. Note that the RIPD approach uses the original item parameters from the CAT pool without recalibration. Crucially, an iterative purification procedure is integrated into this step to mitigate the negative effect of drifted items on the accuracy of
As the presence of drifted items can bias ability estimates—similar to the effects of DIF items—and thereby inflate Type I error rates, the iterative purification procedure is essential in Step 3. Adapted from the method suggested by Lim et al. (2022), the procedure involves the following steps for each RIPD statistic: (a) using a chosen RIPD statistic (e.g., RIPD R ), identify and flag the item with the most statistically significant statistic (e.g., the smallest p-value) as a potential IPD item from the CAT pool; (b) re-estimate examinee abilities excluding the flagged item from the pool; and (c) recompute the chosen RIPD statistic values based on the updated ability estimates for the remaining items. This process continues until no additional items are flagged or a predetermined iteration limit (e.g., 80) is reached.
The core assumption of this procedure is that the synthetic reference group yields response patterns that closely align with the expected behavior of examinees under the original item parameters, thereby serving as a baseline for evaluating item fit. In contrast, the focal group may exhibit systematic deviations from these expectations if IPD has occurred. Consequently, the RIPD statistics capture discrepancies in residuals between the two groups, mirroring the RDIF logic in a CAT-compatible context.
Accordingly, each RIPD statistic is expected to perform analogously to its RDIF counterpart. Specifically, RIPD R is most effective when the IRFs for the focal and reference groups differ primarily in location (i.e., shifts in item difficulty); RIPD S is particularly suited for detecting non-parallel differences in IRFs (i.e., ability-by-group interactions); and RIPD RS is flexible in capturing both types of deviations under various IPD conditions. Building on these properties, we adapted the decision logic proposed by Lim et al. (2022, p. 20) to diagnose the nature of drift. Specifically, if an item is flagged significantly by RIPD R (and potentially RIPD RS ) but not RIPD S , it indicates uniform drift. Conversely, if an item is flagged by RIPD S (and potentially RIPD RS ) but not RIPD R , it suggests nonuniform drift. Items flagged by all statistics or by RIPD RS alone are likely to exhibit mixed drift.
This approach offers several key advantages. First, it eliminates the need for item recalibration, thereby enhancing practicality and efficiency in operational CAT settings. Second, the RIPD framework employs statistics with known asymptotic distributions, allowing for immediate hypothesis testing without the need to pre-estimate the extent of drifted items in the pool. Finally, matching the ability distributions between the focal and reference groups helps control for ability-related confounds, allowing any systematic differences in item residuals to be attributed to IPD.
It is worth noting that Step 2 of the RIPD procedure, which involves simulating the reference group, offers flexibility in determining the sample size of the reference group, as it is based entirely on simulated responses. Specifically, the
3. Simulation Study
Three simulation studies were conducted to evaluate the performance of the proposed RIPD detection framework for identifying IPD on operational items in CAT. The first study assessed the Type I error rates of the RIPD statistics under H0 of no drift. The second and third studies examined the power of the RIPD framework: the second focused on IPD arising from curriculum changes or practice effects, while the third addressed IPD caused by item compromise, such as prior exposure due to security breaches. For benchmarking purposes, the pseudo-count D2 method (Cappaert et al., 2018) was included in all conditions for comparison.
3.1. CAT Settings
A CAT item pool consisting of 360 items from a retired large-scale standardized assessment was used for the simulation studies. All items were calibrated using the 3PLM. Table 1 summarizes the descriptive statistics of the item parameter estimates in the CAT pool.
Descriptive Statistics of Item Parameters in the CAT Pool.
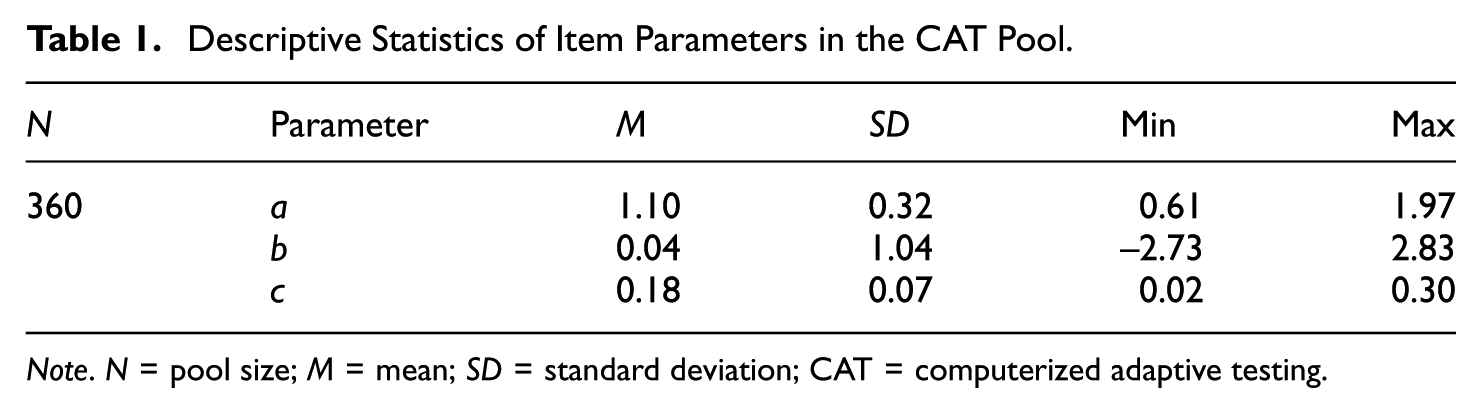
Note. N = pool size; M = mean; SD = standard deviation; CAT = computerized adaptive testing.
Each CAT was administered with two test lengths of 20 and 30 items. Item selection during a test was guided by the maximum Fisher information criterion, ensuring that items were adaptively chosen to maximize information at the interim
Each examinee’s initial ability value was randomly drawn from a uniform distribution between −1 and 1 to prevent excessive exposure of specific starting items, which typically occurs when all examinees begin with a fixed value (e.g.,
No additional constraints, such as content balancing, were applied. This design allowed the evaluation of the RIPD framework in a maximally adaptive CAT environment, where detection is expected to be more challenging. If the RIPD procedure proves effective under these conditions, it would perform as well or better in operational CAT environments where adaptivity is moderated by additional constraints. For each simulated condition, CAT was administered to 3,000 focal group examinees whose true abilities were randomly drawn from N(0, 1).
3.2. Simulation Design
To evaluate the performance of the RIPD framework under various conditions with two test lengths (20 and 30 items), IPD was systematically introduced into a subset of items in the CAT pool. Following empirical findings that overexposed items are more likely to exhibit parameter drift (Kang & Chang, 2016; Zhang, 2014), drifted items were selected from the most frequently administered items under a no-IPD (null) condition. Specifically, based on a preliminary CAT simulation with a test length of 30 items consisting of 30 replications with no drift, 90 items (25% of the pool) with the highest average exposure frequencies were identified as key items. These items, with average exposure counts ranging from 427 to 713 per item, were designated as candidates for drift manipulation. From this pool, IPD was introduced by randomly selecting 0% (0 items), 5% (18 items), 10% (36 items), or 15% (54 items) of the key items, representing increasing levels of item pool contamination.
Two distinct sources of IPD were considered: curriculum/practice-related drift and item compromise due to security breaches. For the former, item parameters were systematically adjusted to reflect plausible instructional or practice effects. The direction of drift was set to make affected items less discriminating or less difficult, reflecting patterns observed under instructional exposure and item familiarity across test administrations (e.g., Kang & Chang, 2016; Veerkamp & Glas, 2000). In the first two conditions, either the a-parameter or the b-parameter alone was reduced by 0.3 or 0.5 from its original value. In the third condition, both the a- and b-parameters were simultaneously reduced (i.e., mixed drift) by the same constants (i.e., 0.3 or 0.5). The two magnitudes of 0.3 and 0.5 represent small and moderate levels of drift, consistent with prior IPD simulation studies (e.g., Kang & Chang, 2016). To simulate varying degrees of examinee exposure to the updated curriculum or practice effects, drifted items were administered to 20%, 40%, and 100% of the focal group (i.e., 600, 1,200, and 3,000 examinees).
For the latter case of drift due to item compromise, the c-parameters of the affected items were manipulated to 0.7 or 0.9 to simulate the model-based responses where examinees would have a substantially high probability of answering the item correctly regardless of their ability levels if the answer itself was already memorized. These parameter settings align with prior research modeling aberrant response behavior; for instance, Zhang and Li (2016) and Sinharay (2017) utilized response probabilities of .67 and .90, respectively, to simulate examinee performance on compromised items. These conditions reflect scenarios involving test security breaches, in which test-takers may have prior knowledge of certain items. Because such breaches are typically limited in scope, only two exposure levels were considered: 20% and 40% of the focal group (i.e., 600 and 1,200 examinees).
Notably, the partial exposure rates (20% and 40%) were selected to reflect the continuous nature of operational CAT, in which drift occurs during a testing window and affects a subset of examinees, for example, due to inconsistent instructional exposure or a mid-window security breach. For curriculum/practice-related drift, we additionally included the 100% exposure condition to represent full penetration of the drift mechanism and to provide an upper bound on detection power under the worst-case scenario of full contamination.
To examine the impact of reference group size on the performance of the RIPD statistics, the synthetic reference group was systematically varied in size. Specifically, the
3.3. Bootstrap Procedure for the Pseudo-Count D2
Since the pseudo-count D2 statistic lacks a known asymptotic distribution, a bootstrap resampling procedure was employed to derive empirical critical values for statistical testing. For each replication in every simulation condition, 10,000 bootstrap samples were generated with replacement from the set of items presumed unaffected by IPD within the CAT pool. For each bootstrap sample, the pseudo-count D2 statistic was computed, and the 100(1 −α)th percentile (e.g., α = .05) was extracted. The final critical value was defined as the average of these percentiles across the 10,000 samples. Because the empirical distribution of the statistic depends on specific test conditions, such as item parameters, examinee ability distributions, and sample sizes, a unique critical value was computed for each replication rather than relying on a fixed threshold (Cappaert et al., 2018; Wells et al., 2014).
A key challenge in this bootstrap procedure is that, in CAT environments, items receive varying numbers of responses, making it difficult to apply a consistent minimum response count for selecting stable reference items. To determine an appropriate threshold for constructing the empirical distribution of the pseudo-count D2 statistic, preliminary simulations were conducted using minimum response counts of 100, 150, 200, 250, and 300 across all simulated conditions used in this study. A threshold of 300 was selected for its superior performance, yielding the highest power while maintaining appropriate Type I error control. Although higher thresholds could be considered, they substantially reduced the number of eligible items in some conditions, sometimes to fewer than 100, potentially compromising bootstrap reliability. Prior research recommends a minimum of 100 observations for stable inference in bootstrap-based procedures (Efron & Tibshirani, 1993; Nevitt & Hancock, 2001; Rosa & Kocianova, 2023).
3.4. Analysis and Performance Evaluation
As detailed earlier, the performance of the RIPD framework was evaluated with the purification procedure applied, set to a maximum of 80 iterations. For consistency, a comparable purification procedure was also implemented for the pseudo-count D2 method. This involved iteratively removing the item with the largest pseudo-count D2 value from the pool and recalculating the statistics at each step based on the remaining items, subject to the same 80-iteration limit.
For each simulated condition, 30 independent replications were conducted to ensure stable estimates of detection performance, which aligns with previous studies (e.g., Zhang & Li, 2016). In each replication, the performance of the RIPD approaches and the pseudo-count D2 method was evaluated based on the 90 pre-identified key items. Detection accuracy was assessed using Type I error (or false positive) rates and statistical power.
In the Type I error study, in which no drifted items were included in the pool, Type I error rates were computed as the proportion of items incorrectly flagged as exhibiting IPD. In the two power studies, where a subset of the key items was manipulated to exhibit parameter drift, power was computed as the proportion of truly drifted items correctly identified as such. In addition, false-positive (FP) rates were recorded to monitor potential inflation of Type I error among non-drifted items within the key set. All detection rates were averaged across the studied items and the 30 replications. A nominal significance level of α = .05 was used in all hypothesis tests.
All CAT simulations and subsequent statistical analyses were conducted using custom code developed in the R programming language (R Core Team, 2025). The illustrative simulation code and associated datasets used in this study are available via an OSF link: https://osf.io/sk4f6/files/osfstorage?view_only=cb2f163f21b24e409ac3c8920447e45f.
4. Results
The results are organized into three subsections. The first subsection reports the Type I error rates of all detection methods under the null condition (i.e., no drifted items). The second and third subsections present detection power and FP rates under two different IPD scenarios: (a) drift due to curriculum changes or practice effects and (b) drift due to item compromise, such as prior exposure through security breaches. Note that for clarity and space considerations, the results for the reference group condition of 3F were omitted across all three studies (see Supplemental Appendix A for results including the 3F reference group conditions). These results do not materially affect the interpretation of the overall findings. Furthermore, all reported results in this section are based on the IPD detection methods utilizing the purification procedure.
4.1. Type I Error Study
To evaluate the Type I error control of the detection methods, CAT simulations were first conducted under the null condition where no items in the pool exhibited parameter drift. Across 30 replications, the 90 key items used for IPD evaluation were well-represented, with observed exposure frequencies ranging from 286 to 627 (mean (M) = 456.0, standard deviation (SD) = 103.6) for the 20-item conditions and from 419 to 718 (M = 549.7, SD = 81.5) for the 30-item conditions.
Table 2 presents the Type I error rates for all detection methods, including RIPD R , RIPD S , RIPD RS , and the pseudo-count D2 statistic. Results are shown for three synthetic reference group sizes (1F, 5F, 8F) and for two test lengths of 20 and 30. Across all configurations, the Type I error rates remained close to or less than the nominal α = .05 level, indicating that all methods effectively controlled false positive rates. This held true regardless of test length and, for the RIPD statistics, across all reference group sizes.
Type I Error Rates Under the Null Conditions (No Drifted Items).
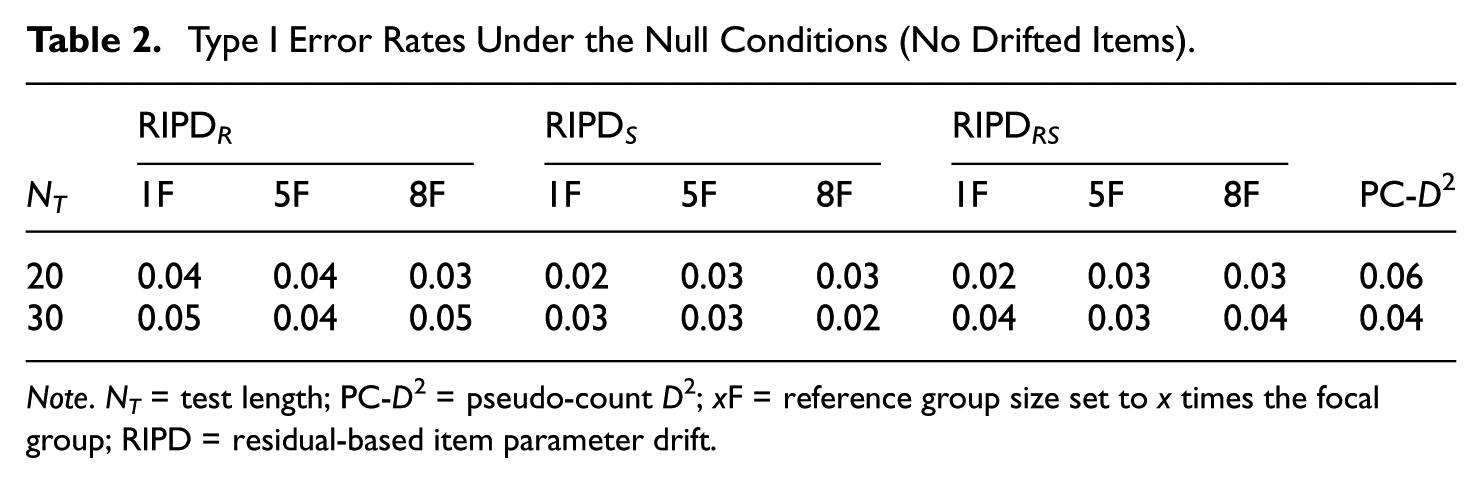
Note. N T = test length; PC-D2 = pseudo-count D2; xF = reference group size set to x times the focal group; RIPD = residual-based item parameter drift.
4.2. Power Study 1: IPD Due to Curriculum Change and Practice Effects
To evaluate the overall performance of the IPD detection methods under various curriculum- and practice-related drift conditions, Tables 3 and 4 summarize the marginal detection power and FP rates (with the latter presented in parentheses in Tables 3 through 9). Specifically, Table 3 highlights the impact of test length and the proportion of drifted items (IPD proportion) in the pool by marginalizing the results across all other factors (i.e., types of drifted item parameters, magnitude of drift, and examinees’ exposure rates to the drifted items). Conversely, Table 4 shifts the focus to the other simulated factors, displaying the marginal results by the drifted parameter types, magnitudes, and examinee exposure rates, averaged across test lengths and IPD proportions. Under the simulated conditions of Power Study 1, the 90 key items targeted for IPD evaluation exhibited exposure frequencies ranging from 189 to 688 (M = 455.3, SD = 104.6) for the 20-item conditions and from 305 to 735 (M = 548.9, SD = 82.7) for the 30-item conditions.
Marginal Power and False Positive Rates by Test Length and Proportion of Drifted Items Under Power Study 1.
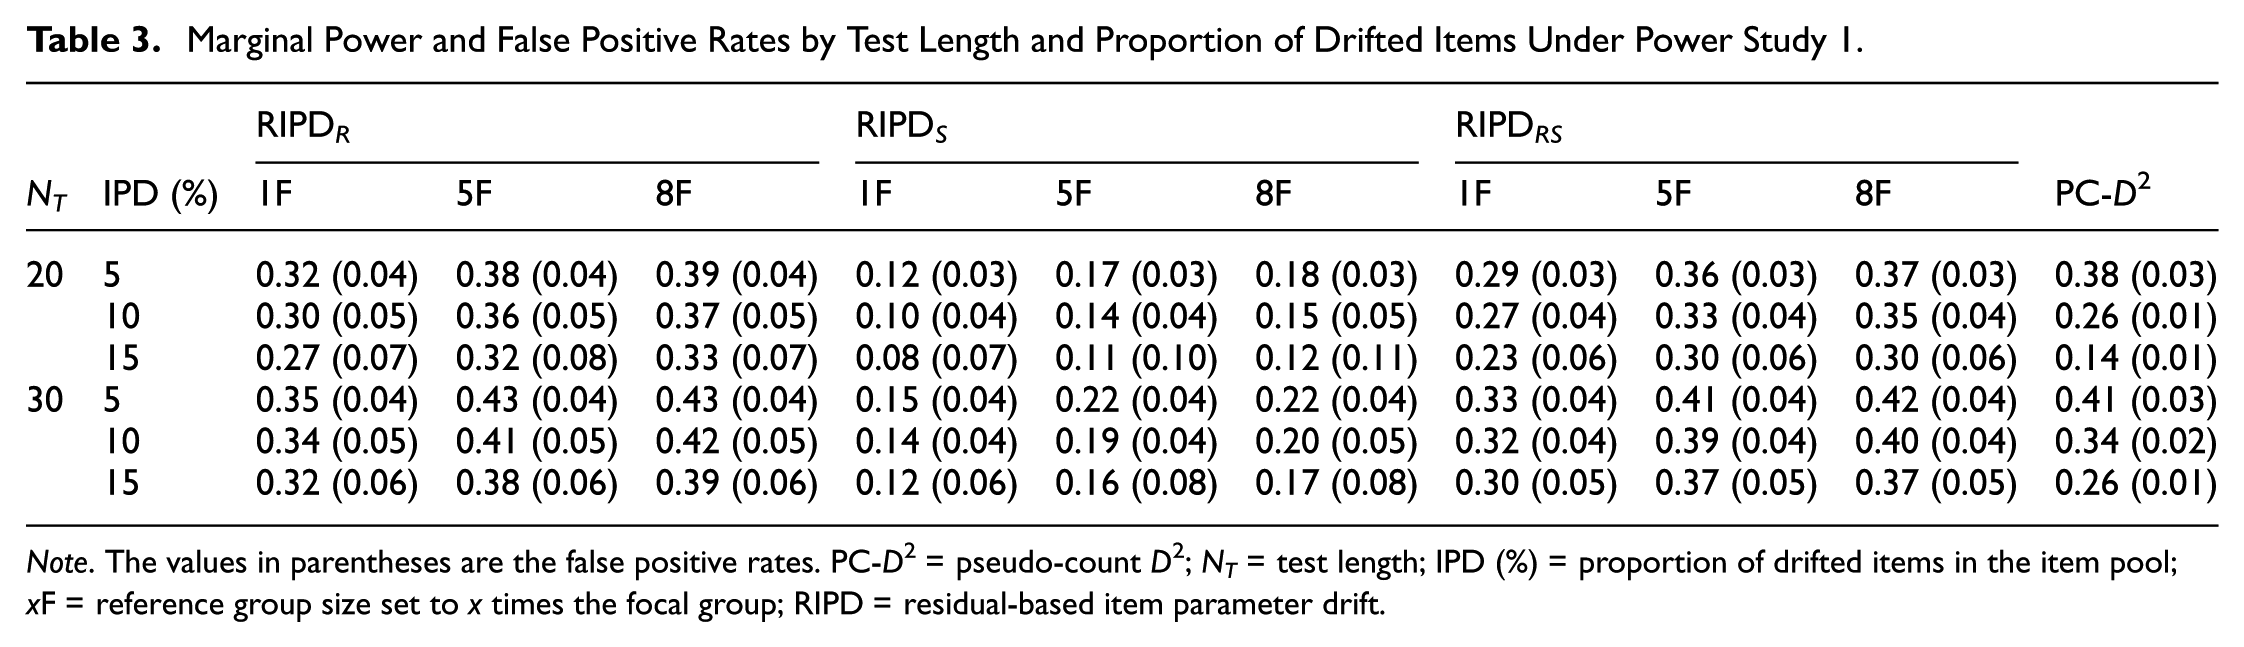
Note. The values in parentheses are the false positive rates. PC-D2 = pseudo-count D2; N T = test length; IPD (%) = proportion of drifted items in the item pool; xF = reference group size set to x times the focal group; RIPD = residual-based item parameter drift.
Marginal Power and False Positive Rates by Drifted Item Parameters and Proportion of Examinees Exposed to the Drifted Items Under Power Study 1.
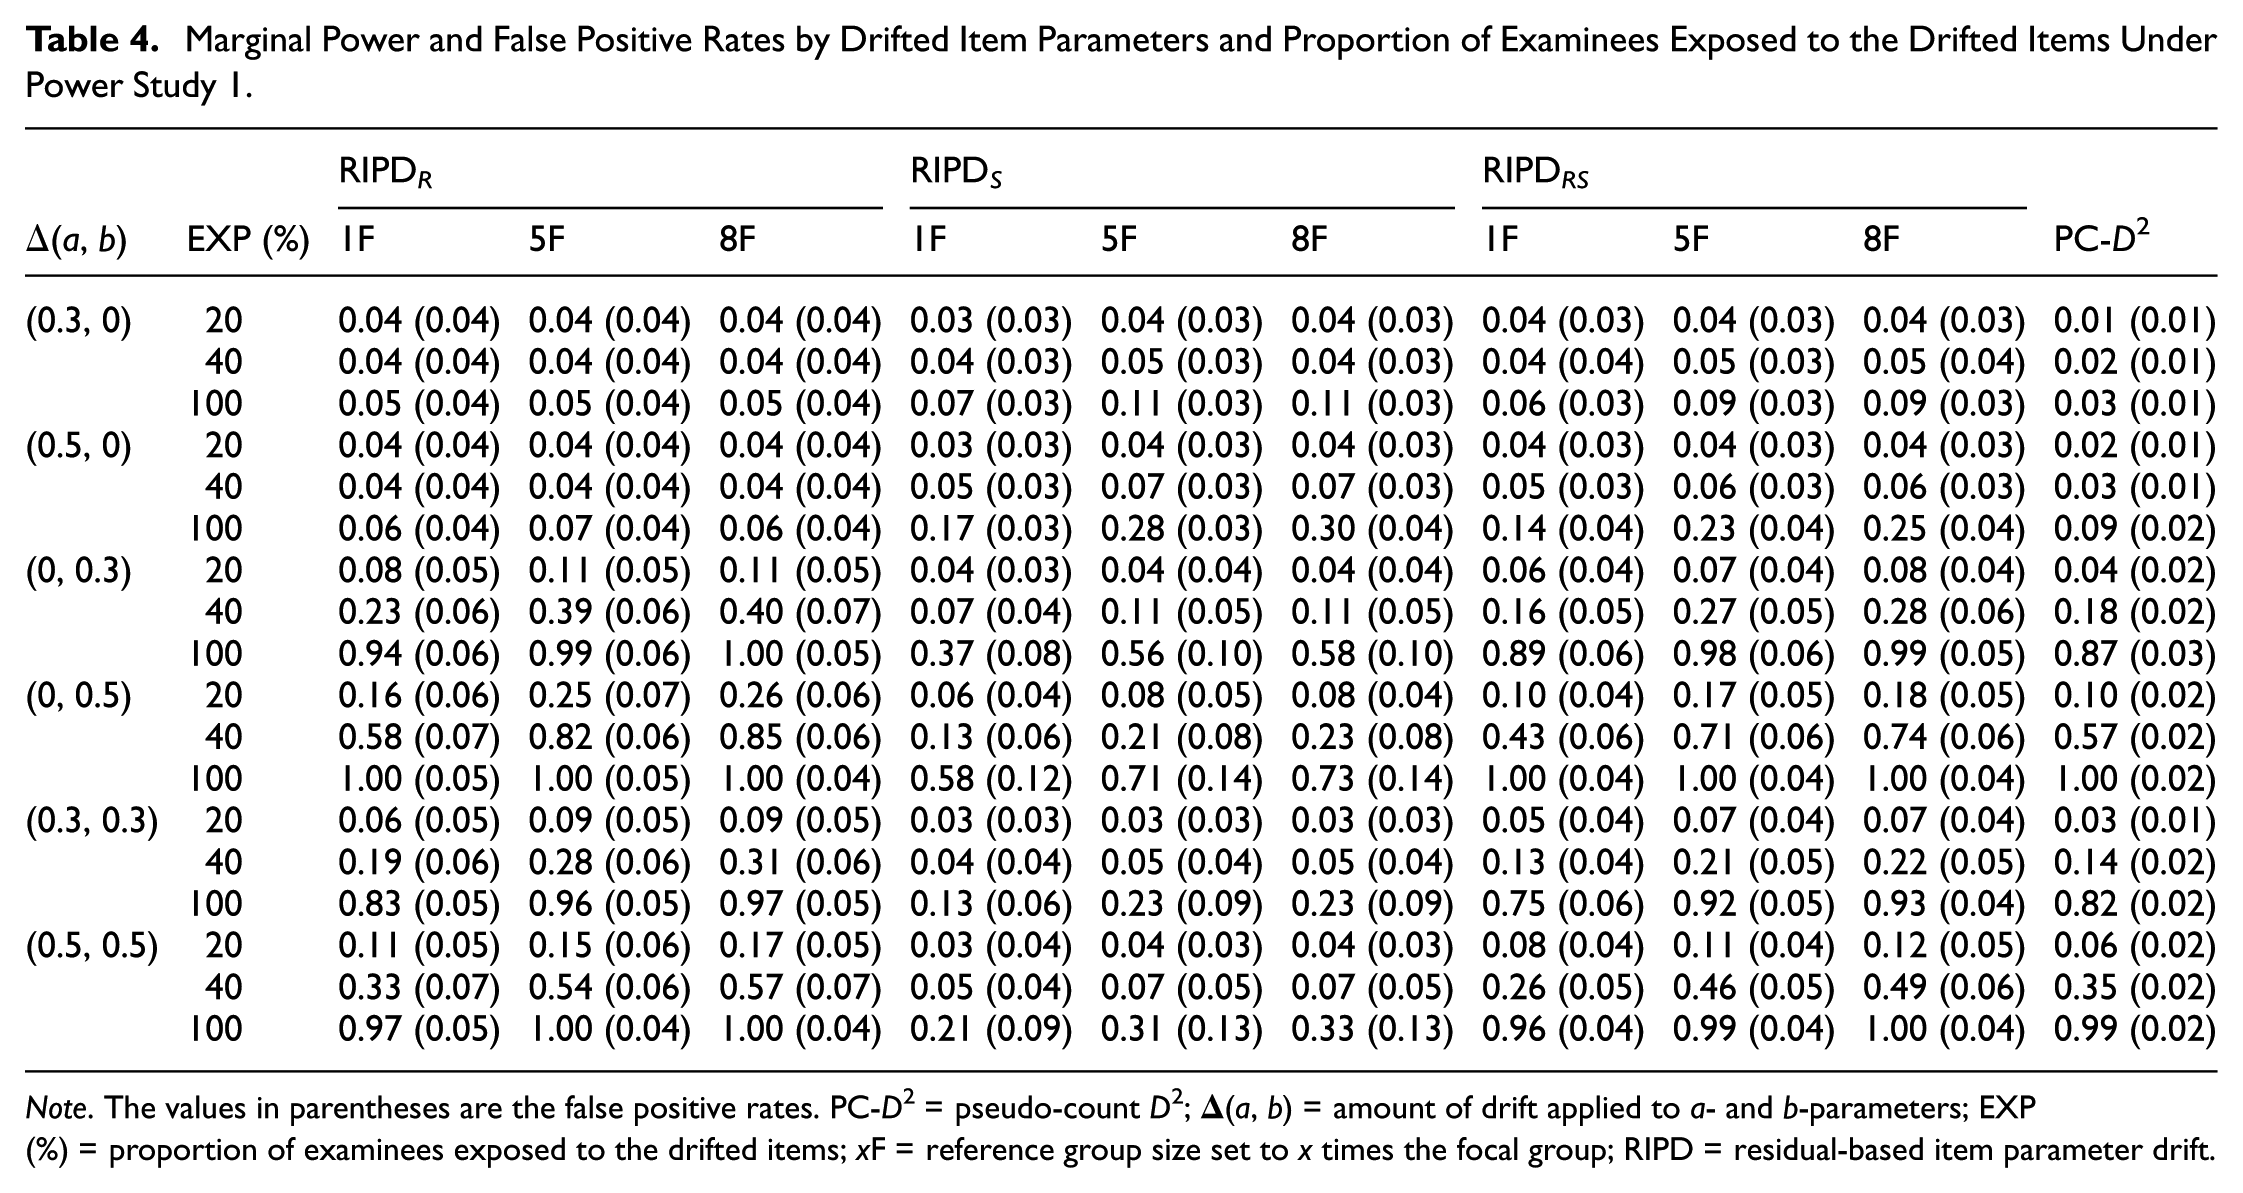
Note. The values in parentheses are the false positive rates. PC-D2 = pseudo-count D2;
Conditional Power and False Positive Rates for Pure a-Parameter Drift Under Power Study 1: 15% Drifted Items.
Note. The values in parentheses are the false positive rates. PC-D2 = pseudo-count D2; N
T
= test length; EXP (%) = proportion of examinees exposed to the drifted items; xF = reference group size set to x times the focal group;
Conditional Power and False Positive Rates for Pure b-Parameter Drift Under Power Study 1: 15% Drifted Items.
Note. The values in parentheses are the false positive rates. PC-D2 = pseudo-count D2; N
T
= test length; EXP (%) = proportion of examinees exposed to the drifted items; xF = reference group size set to x times the focal group;
Conditional Power and False Positive Rates for Mixed Drift Under Power Study 1: 15% Drifted Items.
Note. The values in parentheses are the false positive rates. PC-D2 = pseudo-count D2; N
T
= test length; EXP (%) = proportion of examinees exposed to the drifted items; xF = reference group size set to x times the focal group;
Marginal Power and False Positive Rates by Test Length, Proportion of Drifted Items, and Size of Manipulated c-Parameters Under Power Study 2.
Note. The values in parentheses are the false positive rates. PC-D2 = pseudo-count D2; N T = test length; IPD (%) = proportion of drifted items in the item pool; xF = reference group size set to x times the focal group; RIPD = residual-based item parameter drift.
Conditional Power and False Positive Rates for the Manipulated c-Parameter Drift Under Power Study 2: 15% Drifted Items.
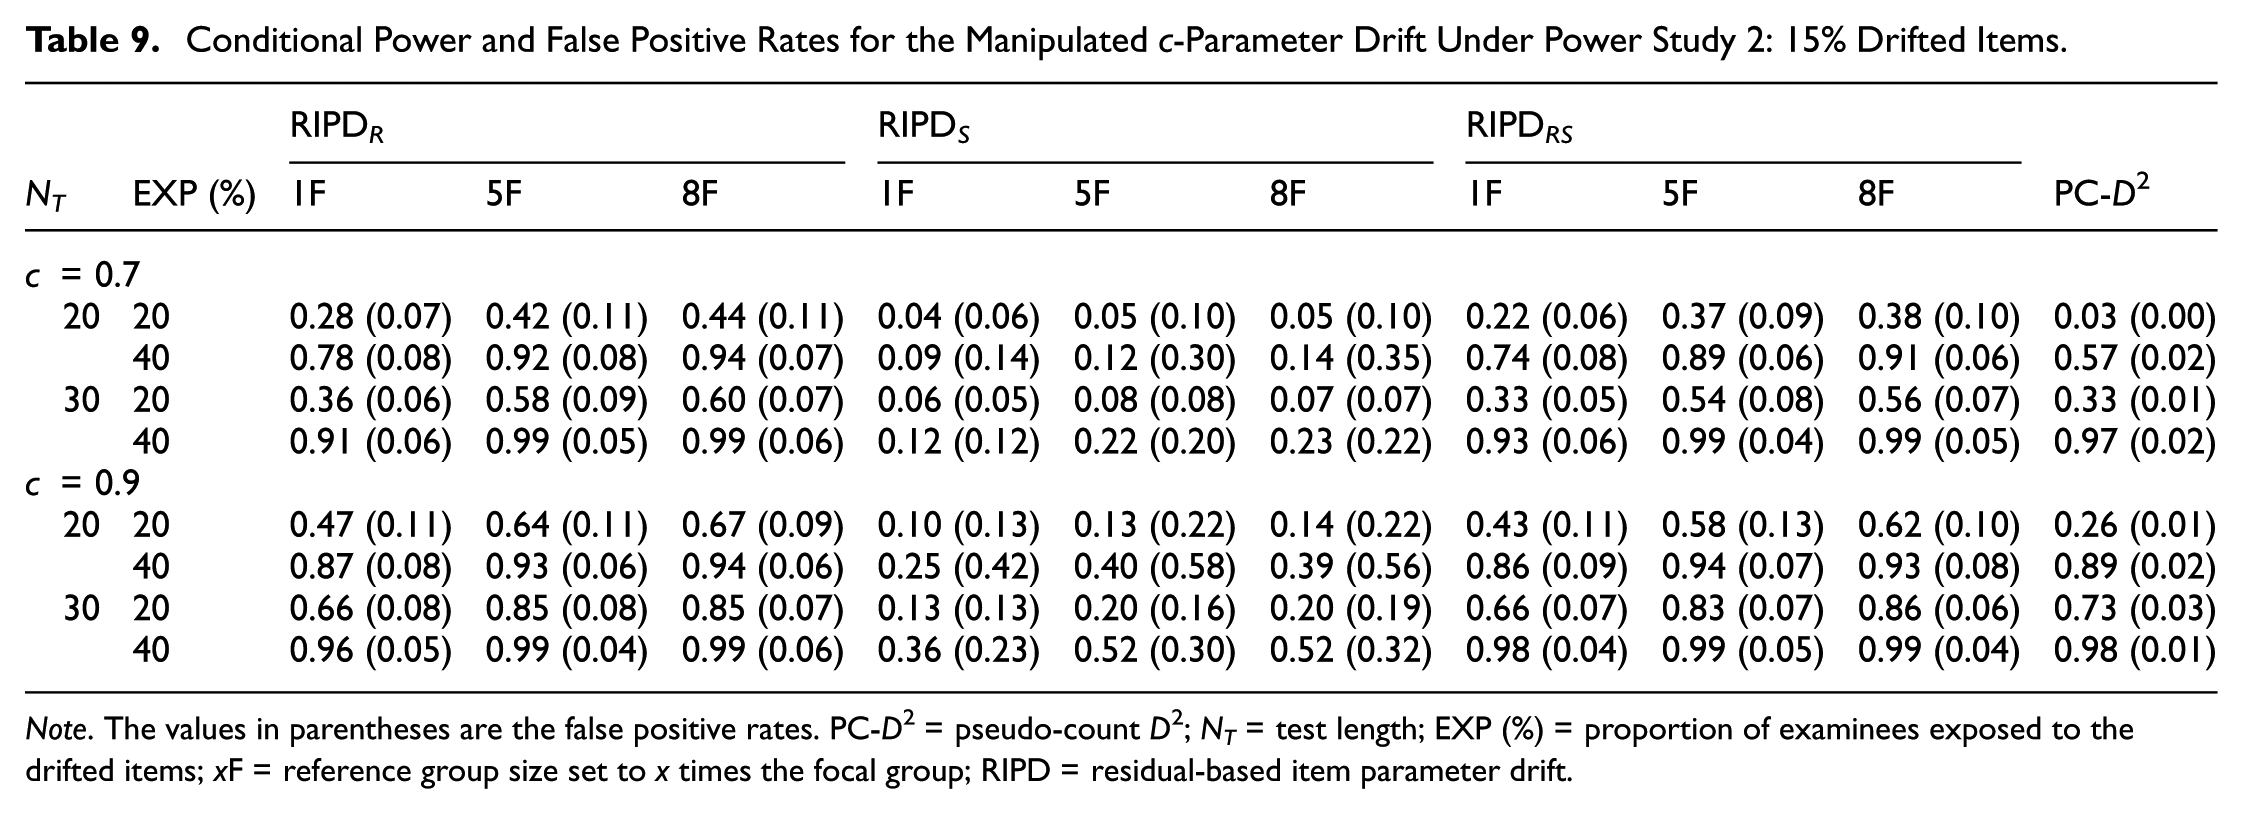
Note. The values in parentheses are the false positive rates. PC-D2 = pseudo-count D2; N T = test length; EXP (%) = proportion of examinees exposed to the drifted items; xF = reference group size set to x times the focal group; RIPD = residual-based item parameter drift.
As shown in Table 3, test length and the proportion of drifted items exhibited opposing effects on the overall detection accuracy. Holding other factors constant, an increase in test length from 20 to 30 items generally led to higher detection power and slightly lower FP rates for the RIPD framework. Conversely, as the IPD proportion in the pool increased from 5% to 15%, detection power slightly decreased while FP rates tended to increase across the methods.
For the majority of conditions, RIPD R , RIPD RS , and the pseudo-count D2 successfully controlled FP rates close to the nominal level of α = .05. However, the combination of a shorter test length and a higher IPD proportion negatively impacted detection accuracy. Specifically, under the most severe condition (N T = 20 and IPD (%) = 15), RIPD R exhibited slightly inflated FP rates (approximately 0.07) across all synthetic reference group sizes. The performance of RIPD S was even more adversely affected in this condition, with FP rates inflating to a range of 0.07 to 0.11. This deterioration is likely due to the heightened contamination of the ability estimates; when the test is short and a large portion of the pool is contaminated by the drifted items, the purification process struggles more to recover the true ability scale.
Comparing the statistics within the RIPD framework, RIPD R and RIPD RS maintained robust marginal power across conditions, whereas RIPD S yielded noticeably lower overall power. Regarding the synthetic reference group size, increasing the size from 1F to 5F and 8F consistently improved the detection power of the RIPD statistics. However, the marginal power gains visibly diminished beyond 5F, suggesting that a reference group size of 5 to 8 times the focal group could be practically optimal. Importantly, when a sufficiently large reference group (i.e., 5F or 8F) was utilized, RIPD R and RIPD RS generally outperformed the benchmark pseudo-count D2 method in terms of marginal detection power.
As shown in Table 4, the detection power of the methods was highly sensitive to both the proportion of examinees exposed to the drifted items and the magnitude of the drift, particularly under pure b-parameter and mixed drift conditions. For these types of drift, power increased substantially as the exposure rate grew from 20% to 100% and the drift magnitude increased from 0.3 to 0.5. For instance, under the conditions of 20% exposure, power remained relatively low across all methods regardless of other factors. Conversely, under moderate drift of the b-parameter alone or mixed drift with 100% exposure, all methods except RIPD S achieved power levels near 1.00. However, this pronounced sensitivity to exposure rate and drift magnitude was largely absent under pure a-parameter drift conditions.
The relative performance of the RIPD statistics varied distinctly depending on the type of drifted parameter. In terms of detection power, RIPD
R
and RIPD
RS
demonstrated excellent performance in detecting pure b-parameter drift and mixed drift, especially when the examinees’ exposure rate to the drifted items was high (e.g., improving substantially as the exposure rate increased from 40% to 100%). In contrast, detecting pure a-parameter drift proved to be inherently more difficult, resulting in generally lower detection power across all methods. For pure a-parameter drift, RIPD
R
and the pseudo-count D2 largely failed to detect the deviations. However, RIPD
S
stood out by exhibiting the highest sensitivity to these deviations, capturing the differences in the mean squared residuals between the reference and focal groups. Specifically, when the magnitude of pure a-parameter drift was moderate (
Importantly, however, RIPD S exhibited noticeably inflated FP rates under specific conditions. While RIPD S showed well-controlled FP rates under pure a-parameter drift, its FP rates became inflated (often exceeding 0.10) under pure b-parameter and mixed drift conditions as the examinees’ exposure rate increased, particularly at the 100% exposure level. In contrast, the other methods generally maintained well-regulated FP rates under the same conditions. Finally, consistent with the findings from Table 3, increasing the synthetic reference group size improved detection power, with marginal gains diminishing beyond 5F. Furthermore, when a sufficiently large reference group (i.e., 5F or 8F) was utilized, RIPD R and RIPD RS generally outperformed the pseudo-count D2 method, particularly in detecting pure b-parameter and mixed drifts.
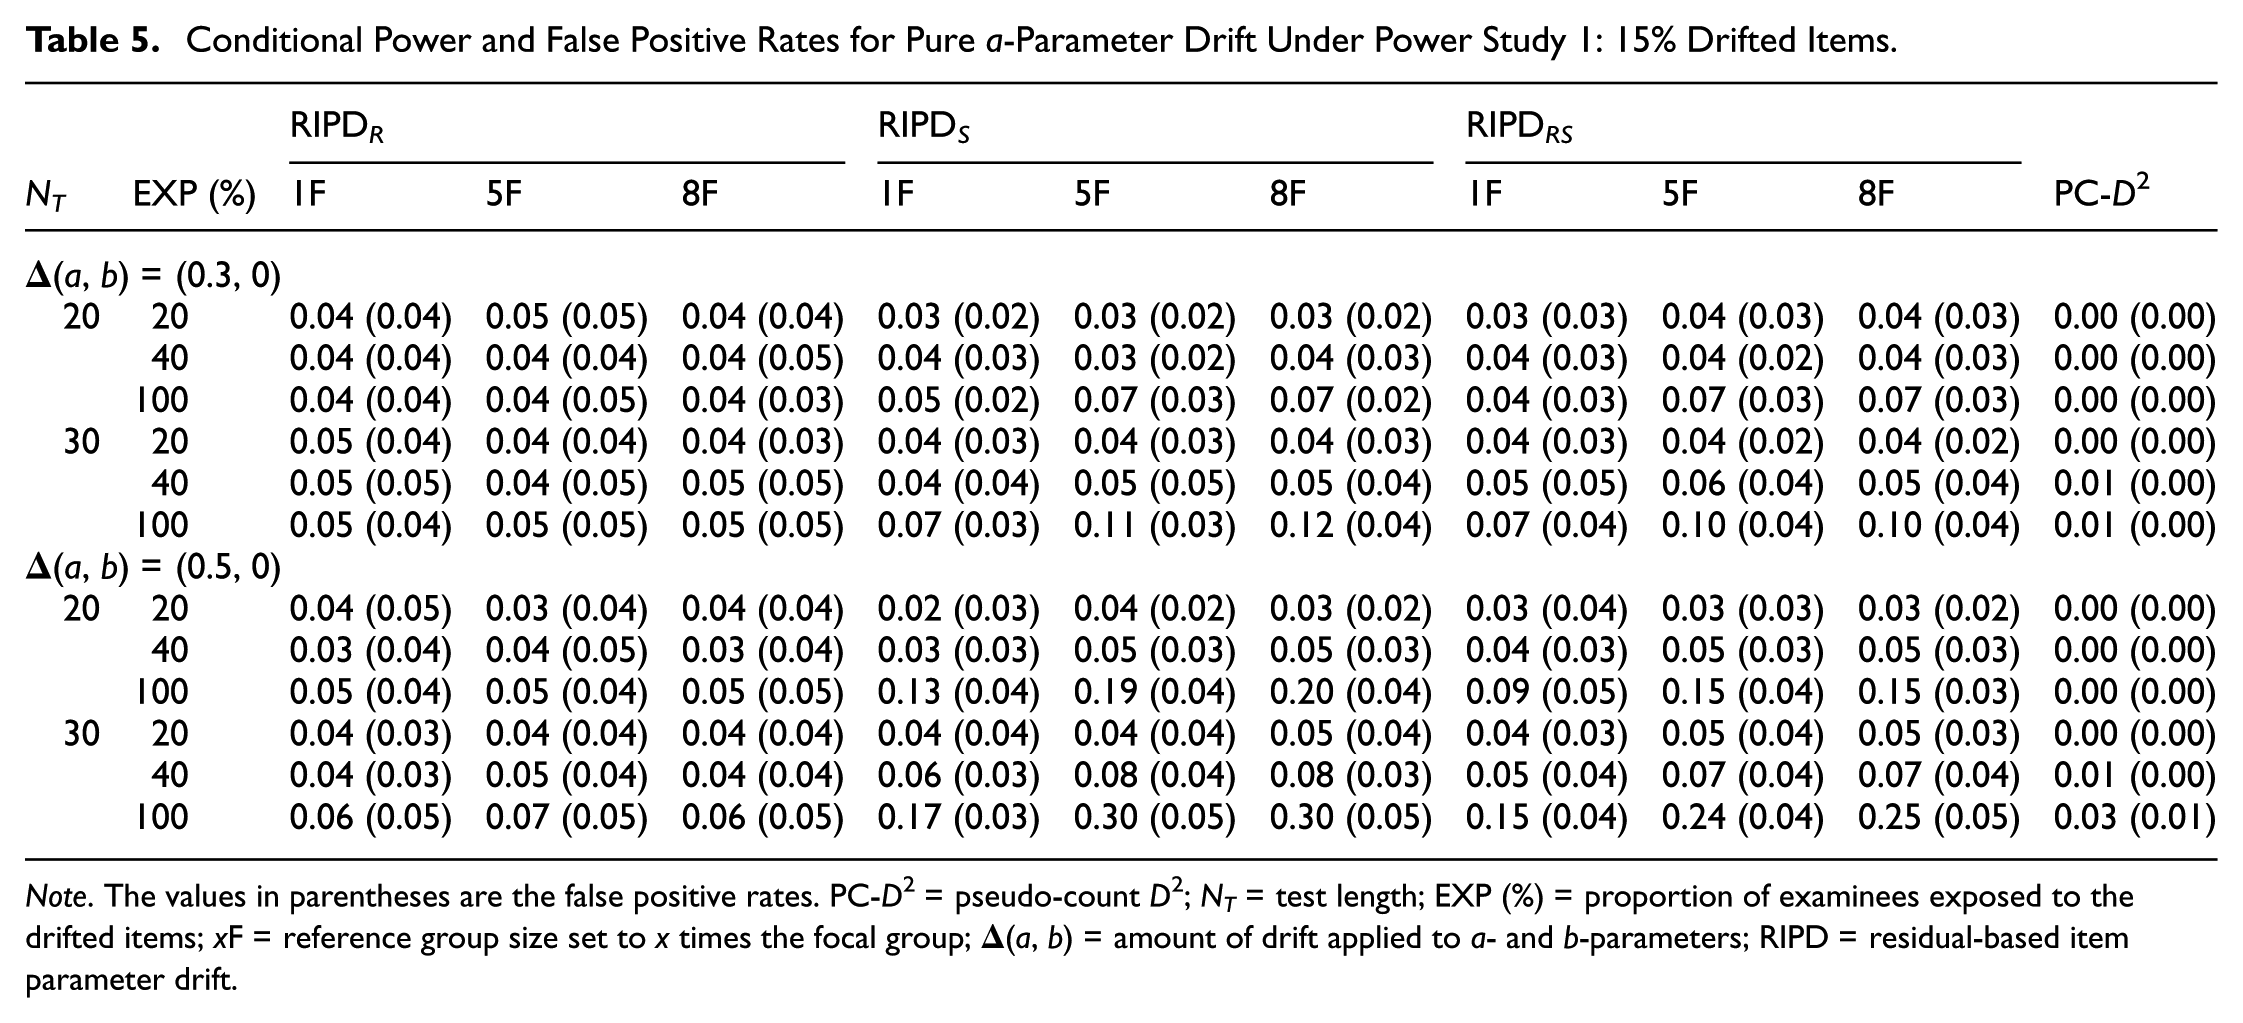
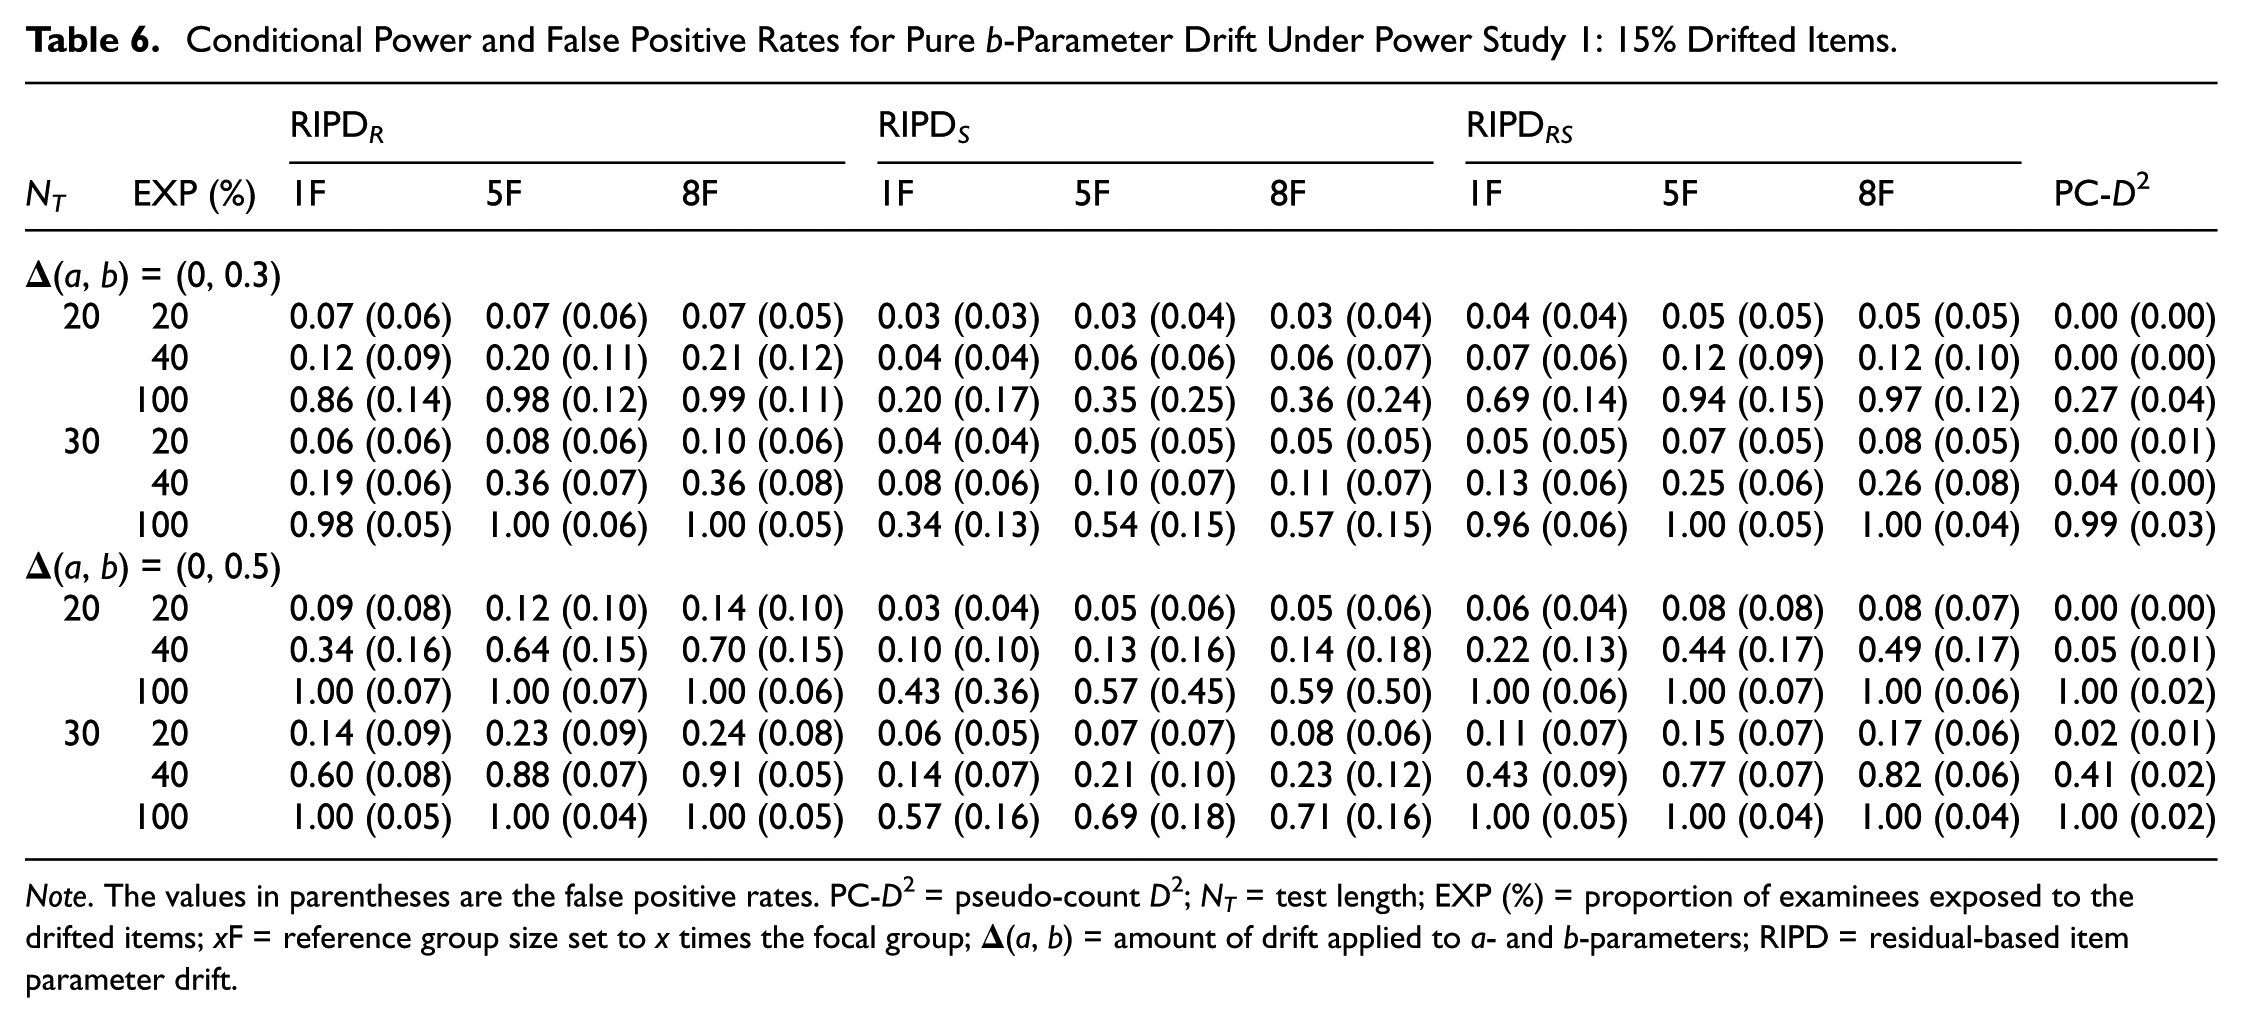
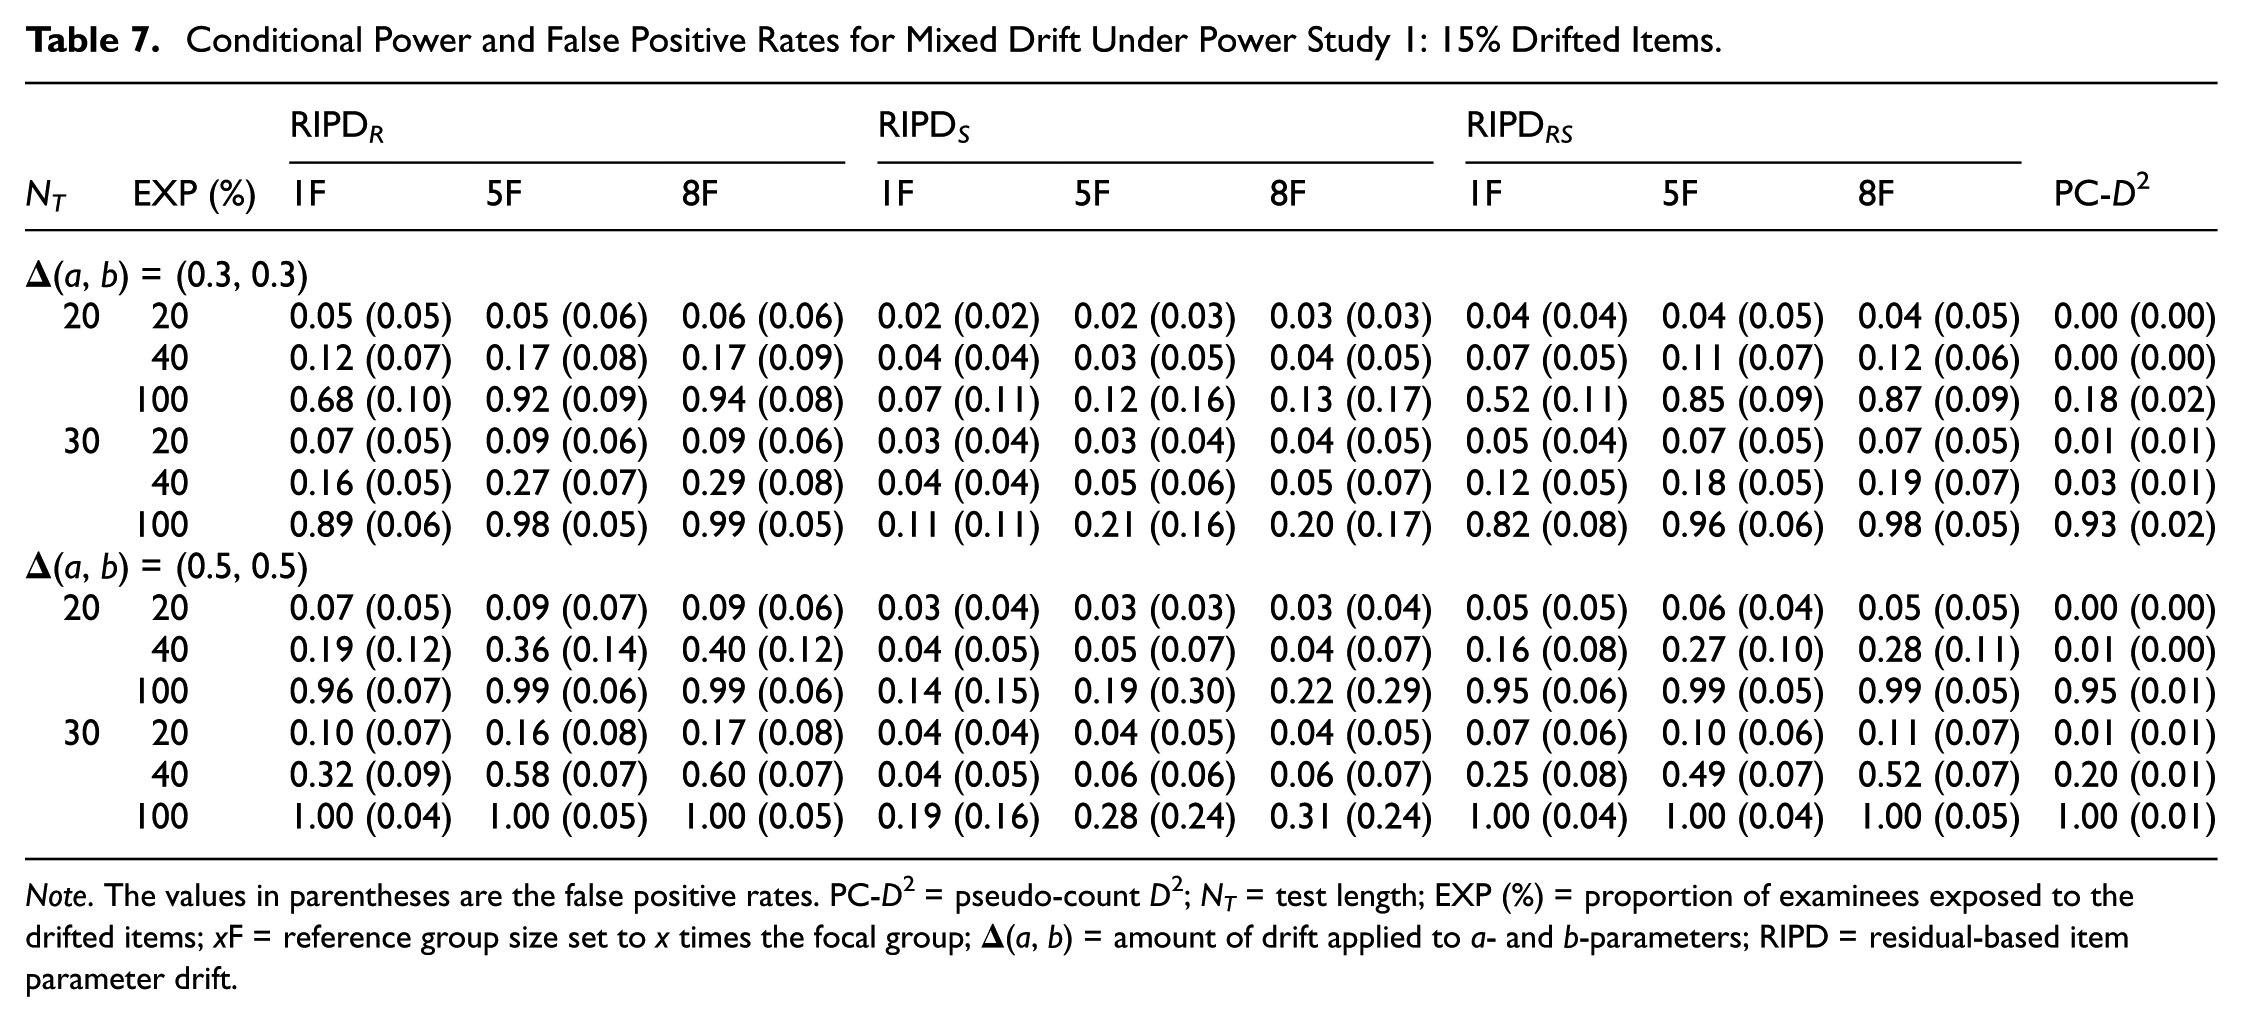
To further elucidate the specific behaviors of the IPD detection methods across different types of drifted parameters, Tables 5 through 7 detail the conditional power and FP rates specifically for the most severely contaminated condition (i.e., a 15% IPD proportion) under pure a-parameter, pure b-parameter, and mixed drift scenarios, respectively (see Tables A2 through A10 in Supplemental Appendix A for complete results, including the 5% and 10% IPD proportions and the 3F conditions).
For pure a-parameter drift (Table 5), detection power across all methods was generally quite low regardless of all other simulated factors. This was particularly evident when the test length was short (N
T
= 20), and the drift magnitude was small (
Despite the inherent difficulty of detecting pure a-parameter drift, RIPD S showed the highest relative power among the methods, closely followed by RIPD RS . Consistent with the patterns observed in Table 4, this superiority became more apparent as test length and drift magnitude increased, particularly at the 100% exposure rate. Finally, in terms of FP rates, all methods demonstrated well-regulated results, maintaining rates close to or less than the nominal 0.05 level across all conditions.
For the b-parameter alone and mixed drift conditions (Tables 6 and 7), the detection patterns were highly similar. The detrimental impact of severe pool contamination (i.e., 15% drifted items) was particularly evident under the shorter test length (N T = 20), leading to generally reduced detection power and inflated FP rates. Nevertheless, RIPD R and RIPD RS consistently demonstrated substantially higher power than the benchmark pseudo-count D2 method. The pseudo-count D2 method tightly controlled FP rates below 0.05 but suffered from extremely low power unless the examinee exposure rate reached 100%.
Interestingly, the methods exhibited distinctly divergent FP rate patterns depending on the examinees’ exposure rate to the drifted items and drift magnitude. Specifically, under small drift conditions (i.e.,
It is important to note that the elevated FP rates observed across the RIPD methods in Tables 6 and 7 are largely attributable to the severe 15% contamination condition. As shown in Tables A2 through A10 in Supplemental Appendix A, when the proportion of drifted items was smaller (i.e., 5% and 10%), all methods generally maintained well-regulated FP rates while yielding even higher detection power.
4.3. Power Study 2: IPD Due to Item Compromise
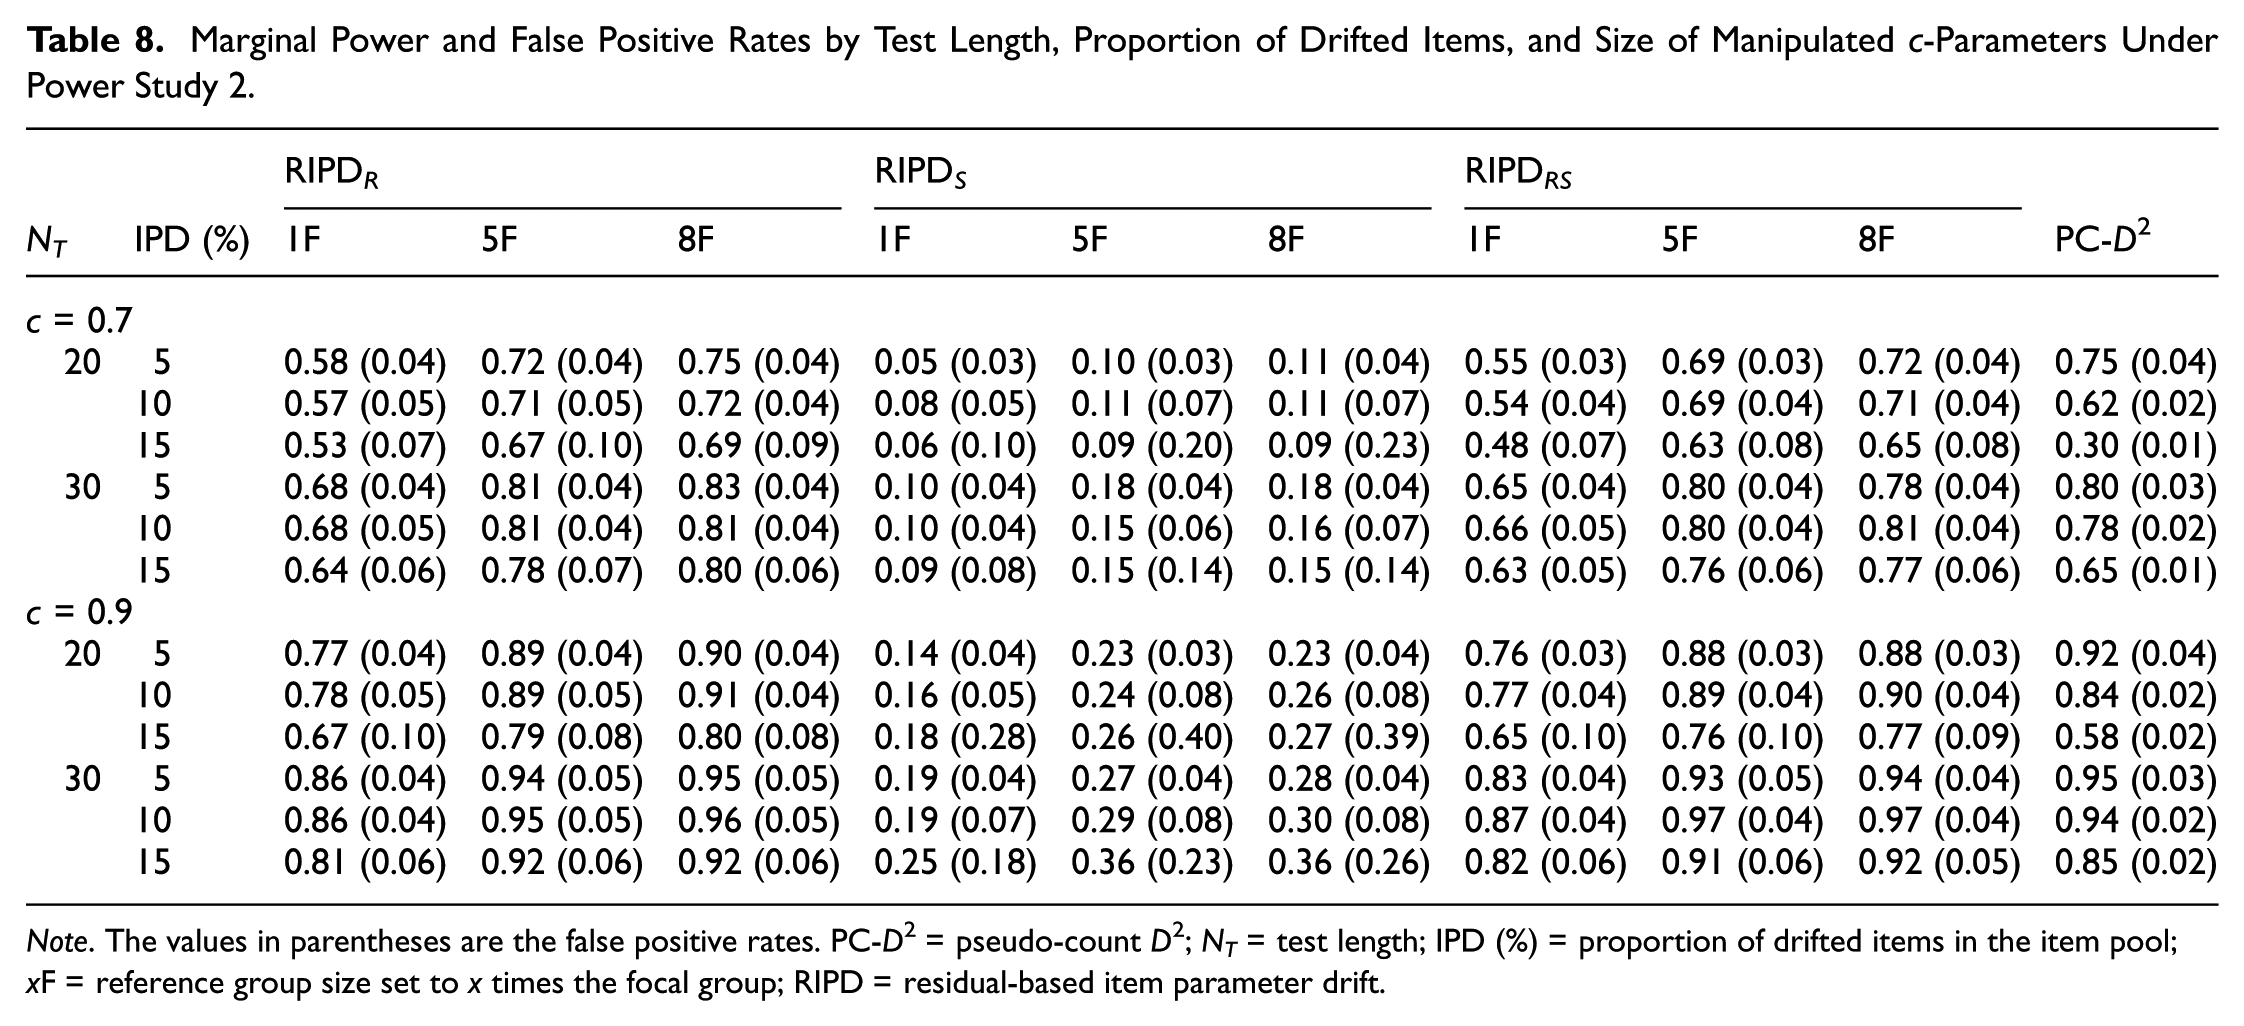
To evaluate detection performance under conditions resembling item compromise (e.g., security breaches), Table 8 summarizes the marginal detection power and FP rates, highlighting the impact of test length, the proportion of drifted items, and the size of manipulated c-parameters by marginalizing the results across the examinees’ exposure rate to the drifted items. Under the simulated conditions of Power Study 2, the 90 key items targeted for IPD evaluation exhibited exposure frequencies ranging from 230 to 680 (M = 453.8, SD = 105.7) for the 20-item conditions and from 360 to 725 (M = 548.2, SD = 83.0) for the 30-item conditions.
As presented in Table 8, the overall detection performance under item compromise conditions was systematically influenced by test length, the magnitude of the c-parameter, and the synthetic reference group size. Consistent with the findings from Power Study 1, increasing the test length from 20 to 30 items generally enhanced detection power while reducing FP rates across the RIPD statistics. Furthermore, the severity of the security breach significantly impacted detection rates; as the manipulated c-parameter increased from 0.7 to 0.9, all methods exhibited a substantial increase in marginal power. For example, under the condition of a 20-item test with a 5% IPD proportion, the power of RIPD R (with 8F) jumped from 0.75 to 0.90. Lastly, expanding the synthetic reference group size consistently improved detection power, with marginal gains visibly diminishing beyond 5F.
Regarding relative detection power, RIPD R and RIPD RS demonstrated highly robust performance across most conditions, particularly when a sufficiently large reference group (i.e., 5F or 8F) was utilized. This robust performance indicates that these methods are highly effective under severe item compromise conditions, demonstrating even greater responsiveness to c-parameter shifts than to the small-to-moderate a- and/or b-parameter drifts observed in Power Study 1. Under these conditions, they consistently outperformed the pseudo-count D2 method. The pseudo-count D2 method tightly controlled FP rates below 0.05 but suffered significant power drops under the shorter test length (N T = 20), higher IPD proportion in the pool (IPD (%) = 15), and less severe drift (c = .7). In contrast, RIPD S yielded noticeably lower marginal power across all conditions. This limited sensitivity suggests that RIPD S is inherently less effective in detecting drift due to item compromise.
In terms of FP rates, while all methods except RIPD S generally maintained well-regulated results under the 30-item test conditions, a combination of a shorter test length and a higher proportion of drifted items negatively impacted accuracy. Specifically, under the severe 15% IPD proportion condition, all RIPD statistics tended to produce somewhat inflated FP rates. This vulnerability was most pronounced for RIPD S ; similar to the patterns observed in Power Study 1, RIPD S exhibited severely inflated FP rates under the 15% IPD condition, peaking at 0.39 to 0.40 when combined with a large c-parameter shift (c = .9) and a short test length (N T = 20).
To further illustrate the detailed observations under the most severe pool contamination, Table 9 displays the conditional power and FP rates for the worst-case scenario (i.e., a 15% IPD proportion). These conditional results corroborate the marginal findings but also reveal distinctly divergent patterns depending on the examinees’ exposure rate to the drifted items. Specifically, as the exposure rate increased from 20% to 40%, RIPD R and RIPD RS demonstrated a dramatic surge in detection power, often reaching near-perfect rates (e.g., 0.94–0.99). However, their FP rates became somewhat inflated (e.g., up to 0.11) under the combination of a short test length (N T = 20), a low exposure rate (20%), and the c-parameter of 0.7. In contrast, the benchmark pseudo-count D2 method suffered from extremely low power (e.g., 0.03) under the combination of a short test length and a low exposure rate, highlighting the superior sensitivity of the RIPD framework in detecting early-stage item compromise.
Furthermore, the methods within the RIPD framework exhibited divergent FP rate trajectories as the exposure rate increased. Unlike RIPD R and RIPD RS , which generally showed a decreasing pattern of FP rates as the exposure rate increased—especially when the synthetic reference group size was expanded to 5F and 8F—RIPD S yielded a linearly increasing FP rate pattern. This vulnerability was most pronounced with the manipulated c-parameter of 0.9 and a short test length, where the FP rates for RIPD S became severely inflated, peaking at 0.56 to 0.58 when the exposure rate reached 40%. Overall, these results reaffirm that while RIPD R and RIPD RS are highly effective for identifying item compromise, RIPD S is not suitable for detecting this specific type of drift.
5. Discussion and Conclusions
5.1. Summary and Practical Implications
This study aimed to develop and evaluate a new RIPD detection framework tailored for CAT. Building on the RDIF methodology proposed by Lim et al. (2022) and Lim and Choe (2023), the RIPD framework introduces three statistics: RIPD R , RIPD S , and RIPD RS . These statistics assess item-level deviations in expected response behavior between a synthetic reference group and a new focal group, without requiring item recalibration. Designed for retrospective IPD detection after test administration, the new method employs synthetic reference groups generated via simulation using CAT response data from the focal group.
To evaluate the statistical performance of the RIPD framework, comprehensive simulation studies were conducted. The simulation results yielded several important findings regarding the performance of the proposed RIPD detection framework. First, the relative performance of the three RIPD statistics varied depending on the specific nature of the drift. RIPD R and RIPD RS consistently demonstrated strong detection performance across conditions involving uniform drift (or mixed drift dominated by b-parameter shifts), exhibiting high power. While they generally maintained well-controlled FP rates, it is important to note that their FP rates became somewhat inflated under the most severe pool contamination combined with a shorter test length.
On the other hand, RIPD S proved conceptually critical for detecting nonuniform drift, as RIPD R failed to detect deviations when drift occurred solely in the discrimination parameter because the raw residuals averaged out to zero. However, the practical utility of RIPD S was found to be somewhat limited. Although it relatively outperformed the other methods under pure a-parameter drift, its meaningful superiority only became apparent under high examinee exposure to the drifted items, whereas its power remained quite low under partial exposure scenarios. Furthermore, RIPD S exhibited a critical vulnerability: unlike RIPD R and RIPD RS , its FP rates increased monotonically with the examinees’ exposure rate, becoming severely inflated under the item compromise conditions.
These complementary strengths and limitations highlight the necessity of a comprehensive approach. Relying solely on RIPD S (or RIPD R ) risks missing uniform (or nonuniform) drift, with RIPD S additionally risking severely inflated false positives. In this context, RIPD RS offers the most practical solution for routine IPD monitoring where the true nature of drift is unknown a priori. As an omnibus test, RIPD RS serves as a safety net, maintaining robust detection power across both uniform and nonuniform drift scenarios. Furthermore, because RIPD RS is based on the bivariate normal distribution of RIPD R and RIPD S statistics (Lim et al., 2022), it captures the joint probability of deviations, potentially identifying drifted items that might fall into the elliptical rejection region even if they are not flagged by single statistics individually. Therefore, we recommend using RIPD RS as the primary flagging criterion to ensure broad sensitivity, while employing RIPD R and RIPD S as diagnostic tools to infer the specific nature of the drift.
Second, detection performance was highly sensitive to several simulated factors, including test length, the proportion of drifted items in the pool, examinees’ exposure rates to the drifted items, and the magnitude of drift parameters. Most notably, while the RIPD framework generally controlled FP rates well, these rates became somewhat inflated across all RIPD statistics under the most severe condition—specifically, a short test length combined with a high IPD proportion (i.e., 15%). This inflation can be attributed to the severe contamination of ability estimates. Because drift was manipulated on the 90 most frequently exposed items in our simulation, the likelihood of encountering drifted items was substantially high in such conditions. In fact, under the 20-item test condition with a 15% IPD proportion, there were numerous instances where examinees were administered 15 or more drifted items. Such heavy administration of compromised items severely biases ability estimates, making it exceedingly difficult for even the iterative purification procedure to adequately recover the true ability scale, ultimately leading to increased FPs.
To mitigate this risk and ensure optimal detection accuracy, we recommend a multi-tiered IPD monitoring strategy. Specifically, testing programs should employ real-time sequential detection procedures (e.g., Zhang, 2014; Zhang & Li, 2016) during active CAT administrations as an early warning system to promptly identify and suspend compromised items. By proactively filtering out drifted items in real time, the overall proportion of pool contamination can be kept at a manageable level. Subsequently, applying the retrospective RIPD framework to this pre-screened pool at the end of the testing window will maximize its detection efficacy and provide a rigorous, comprehensive cleaning of the item bank.
Furthermore, regarding the size of the synthetic reference group, our results showed that increasing the reference group size generally improved detection rates, but the marginal gains diminished beyond a certain point. Specifically, detection power tended to stabilize when the synthetic reference group was approximately 5 to 8 times larger than the focal group across most conditions. Given that generating synthetic data is computationally inexpensive, we suggest a practical guideline of using a reference group size of at least 8 to 10 times that of the focal group (e.g., 8F or 10F). Adopting such a fixed size (or selecting from a small set of pre-determined, sufficiently large sizes) from the outset can maximize detection reliability without the need for exhaustive preliminary simulations to find a specific optimal size for every administration, thereby enhancing operational efficiency.
While the pseudo-count D2 method showed robust performance overall, RIPD R and RIPD RS generally outperformed it when the synthetic reference group size was sufficiently large (e.g., 5F or greater). One important benefit of the RIPD framework is that each statistic has a known asymptotic distribution, allowing for formal hypothesis testing without the need for resampling. In contrast, the pseudo-count D2 method relies on a bootstrapping procedure to derive empirical critical values, a process that can be challenging in CAT settings due to difficulties in selecting unaffected items and determining appropriate response count thresholds. These advantages make the RIPD framework not only more powerful but also more practical for routine use in operational CAT programs.
5.2. Limitations and Future Research
Although the RIPD framework shows promise, it is not without limitations, as is the case with most statistical methodologies. One limitation involves the computational aspects of the framework, specifically its reliance on CAT simulations to generate synthetic reference groups and the iterative nature of the purification procedure. In practice, the use of simulated reference groups introduces a degree of stochastic variability across runs, and the purification process, while essential for accurate detection under severe drift, inevitably increases processing time. To empirically evaluate this burden, we measured the processing time under a computationally intensive scenario (e.g., 30 items, 10% IPD, 8F reference group). A complete analysis cycle with full iterative purification took approximately 66 minutes on a standard desktop computer. While not trivial, this duration is practically feasible for retrospective analysis. Furthermore, these computational challenges can be effectively mitigated without imposing a heavy operational burden. As indicated by our findings, increasing the size of the synthetic reference group significantly enhances the stability of detection outcomes. Therefore, rather than conducting exhaustive preliminary simulations to find an optimal size for every administration, we recommend adopting the practical guideline suggested earlier.
With such a sufficiently large reference sample, the sampling error associated with the simulated reference data becomes negligible. Consequently, even a single replication of the CAT simulation yields sufficiently stable detection results, thereby offsetting the time cost of purification demonstrated in the empirical feasibility analysis. However, to further ensure robustness while maintaining operational efficiency, we suggest performing a small number of replications (e.g., 5 runs) using the large reference group. Items flagged in the majority of these runs (e.g., 3 out of 5) can then be reliably identified as exhibiting parameter drift. This streamlined approach ensures robust decision-making while maintaining the computational feasibility required for routine monitoring.
Second, a significant limitation of the RIPD framework, inherent to internal scale-dependent methods, is its vulnerability to global shift. If a large majority of the item pool drifts systematically in the same direction (e.g., all items become easier), the ability estimates derived from the original parameters will absorb this drift, masking the discrepancies in residuals. While the iterative purification procedure effectively acts as a safeguard against this masking effect by progressively refining the ability scale, its capacity is not unlimited. As observed in our main CAT simulations, the RIPD framework maintained robust detection accuracy under small to moderate pool contamination (5% and 10%), and even under severe contamination (15% IPD) when the test was sufficiently long. However, when severe contamination was combined with a shorter test length, the method’s ability to adequately anchor the scale began to deteriorate, resulting in inflated FP rates. Naturally, if the proportion of drifted items were to increase further, approaching a pool-wide systemic shift, the RIPD framework would fail to detect the deviations entirely.
Therefore, while RIPD is well-suited for detecting localized drift in typical maintenance cycles, it is crucial to proactively keep pool contamination at a manageable level by employing the aforementioned real-time sequential monitoring procedures. Furthermore, if a pool-wide systemic shift is suspected (e.g., due to a major curriculum overhaul), practitioners should complement the framework with external remedies, such as monitoring population ability means over time or employing a set of secure external anchor items to verify scale invariance.
A third limitation is that the RIPD framework, as currently developed, is limited to retrospective IPD detection. While such analysis is essential for ongoing item pool maintenance, real-time IPD monitoring during live CAT sessions is equally important for promptly identifying and managing compromised or misfitting items. To enhance its practical utility, future research should explore sequential extensions of RIPD for real-time monitoring, similar to the procedures proposed by Zhang (2014) and Zhang and Li (2016). Such adaptations would support timely actions taken to ensure test security and real-time item quality control in operational CAT systems.
Fourth, the simulation studies were conducted primarily under the 3PLM to reflect realistic high-stakes testing conditions involving multiple-choice items. However, the applicability of the RIPD framework is not limited to the 3PLM. The RIPD statistics are derived from the RDIF framework, which has been shown to perform robustly across different unidimensional models, including the 2PLM and the graded response model (Lim & Choe, 2023; Lim et al., 2022; Lim & Malatesta, 2024). Therefore, the RIPD framework is theoretically adaptable to other unidimensional models, such as the 1PLM or 2PLM, as well as polytomous models, provided that the expected response probabilities can be computed. Future research could further empirically verify the performance of RIPD statistics under these alternative model specifications to broaden their application in various testing contexts.
Lastly, while the current study assessed the performance of the RIPD framework solely through simulation, the approach demonstrated strong potential as a practical and scalable solution for post-administration IPD monitoring. By eliminating the need for item recalibration and supporting formal hypothesis testing, it addresses critical operational challenges in CAT. With further empirical validation using real data from operational testing programs, the RIPD framework could be broadly implemented to ensure the ongoing validity and security of CAT systems.
Supplemental Material
sj-docx-1-jeb-10.3102_10769986261460852 – Supplemental material for IRT Residual-Based Approach to Detecting Item Parameter Drift in CAT
Supplemental material, sj-docx-1-jeb-10.3102_10769986261460852 for IRT Residual-Based Approach to Detecting Item Parameter Drift in CAT by Hwanggyu Lim and Kyung (Chris) T. Han in Journal of Educational and Behavioral Statistics
Footnotes

Funding
The authors received no financial support for the research, authorship, and/or publication of this article.
Declaration of Conflicting Interests
The authors declared no potential conflicts of interest with respect to the research, authorship, and/or publication of this article.
Supplemental Material
Supplemental material for this article is available online.
Author Biographies
References
Supplementary Material
Please find the following supplemental material available below.
For Open Access articles published under a Creative Commons License, all supplemental material carries the same license as the article it is associated with.
For non-Open Access articles published, all supplemental material carries a non-exclusive license, and permission requests for re-use of supplemental material or any part of supplemental material shall be sent directly to the copyright owner as specified in the copyright notice associated with the article.
