
Abstract
In AAL environments, a key issue is to know the location of a user in order to provide the required services quickly and efficiently. A good location system is the one that is able to locate an individual in the shortest time, with acceptable accuracy and spending the least resources as possible. In this context, it seems interesting to analyze in depth the existing location systems in order to optimize both their location procedures and the cost due to deployment. There are many ways to locate an individual indoors. This research is focused on Fingerprint based location procedure, making a comprehensive analysis of it, generating a broad and diverse set of assumptions and issues related to all the elements of the location process based on it. A tool called PosSimulator has been developed to help designers and AAL system evaluators choose the best deployment for a specific environment, taking into account the economic and installation cost and the position accuracy. PosSimulator has been designed regardless the technology used to acquire the information required to locate. It has been used in a test environment. There has been carried out an extensive battery of tests to extract answers or approaches to all the issues raised and research hypotheses, looking for clear trends in the accuracy of the location and observable connections among the various parameters in which the fingerprint based localization process is divided. For the test environment, it has been determined the best combination of all parameters.
Introduction
Information and Communication Technologies are used to improve the quality of people’s life. Nowadays, there is an increasing interest in systems able to determine the user’s location and provide services using such information. These are called LBS (Location Based Services). The characteristic that makes these systems different from others is that the information or interface presented to the user by the application is determined, generally, by the physical location of this one.
The core of LBS is the location in real time to provide basic services in AAL or Smart Buildings, such as care home health [25], building automation systems [10] or navigation indoor environments [8], etc.
For this reason, research in these systems and new methods of location has been increased considerably in the last years in order to provide better services.
Many technological fields have been studied and analyzed to provide to LBS the required location service. The use of ultrasound [22,23,28], infrared [2,11,27], radio [3–5,9,12,15,16,21] and mobile phone networks [26] in LBS has increased in the last decade.
In recent years, as a result of trying to reduce cost as much as possible, there is a special interest in LBS which use technological fields that do not require dedicated devices for the only purpose of location. The new trends in indoor location systems consist of taking advantage of wireless technologies widely used at homes and offices, such as WiFi technology [7], as well as low cost wireless nodes using Bluetooth [6] or ZigBee [17–20] technology, among others.
There are many techniques for indoor localization using wireless technology and they are classified according to many factors. The main factor considered in this classification is the measurement taken from the wireless signal and used to determine the location. The most important parameters or measurements are the signal propagation delay, the angle of arrival, the received signal strength and the link quality. The received signal strength is usually used to locate due to cost because it is a parameter that is always implemented in the wireless devices. Using it, the location can be determined by using distance-based methods or distance-free methods.
Location methods based on distance estimate the distance by using the received signal strength and trilateration from a set of reference points. This procedure is relatively complex and has some drawbacks caused by the weak correlation between signal strength and distance.
There are many subgroups among distance-free methods, which are all those ones in which the signal strength to distance correlation is not used. Among them, the method based on fingerprint or signal strength maps is widely used. This method is divided into two phases. The first one consists on storing in a database the signal strength map of different known locations in the environment where the LBS is going to operate in a future. Afterwards, in a second phase, this information is used to compare the actual signal strength, obtained in real time, with the ones stored in the database, so the closest, among other criteria, represents the actual location. This fingerprint method is the objective of our study.
In the literature there are many papers that analyze, design and/or implement systems based on fingerprints. This work focuses only on the fingerprint indoor localization process that is empirical and deterministic. It is empirical because the used samples are empirically collected; it is not a theoretical or simulated database through signal loss modeling or other similar methods. It is deterministic because location estimation is made without using probabilities, that is, the estimation is made only by the signal strength received, and no statistical algorithm is applied. As it is explained later, the study is easily expandable to others methods that are neither deterministic nor empirical.
There are many issues that arise when analyzing, designing and implementing an indoor location system: cost, implementation effort, installation and calibration time, reuse of pre-installed devices, location precision, and so on. The final objectives to be achieved in this research are:
Generate an efficient analysis tool that can be configured by the user to simulate the behavior of any indoor position system based on fingerprint method in an indoor environment. The tool should make easy to determine in the studied indoor environment which are the best parameters to be used, in order to get the optimal cost, time of deployment, installation, calibration and maximum precision in location. This tool also should be easily expandable, that is, new methods or algorithms could be included with no much effort.
Study deeply the fingerprint methods to determine trends, specific behaviors or relationships among the different parameters that appears in the method by using the developed tool. There will be some results that are specific of the particular indoor environment that is being tested but there will be other ones that are independent of it and they can be generalized to any environment.
This paper is structured in the following way: An overview of the indoor positioning method based on fingerprint is explained in Section 2. Section 3 is devoted to the developed tool, PosSimulator. The tests made are shown in Section 4. Finally, conclusions are established in Section 5.
Positioning process based on fingerprint algorithms
Received Signal Strength Indication (RSSI) fingerprint algorithms have become the most promising technique for indoor positioning systems (IPS). Nowadays, this one is the most widely used alternative due to its ease of deployment and low cost in comparison with other alternatives. In general, the results obtained using RSSI fingerprint algorithms are more accurate than ones obtained using path loss models.
A set of fixed nodes, called base stations, are required in these IPSs. Base stations are located on fixed points that are not necessarily known. The periodic messages sent by the base stations and the ones received by them can be used to measure the received signal power.
For example, access points in WiFi networks would be fixed nodes and whatever devices (laptop, smartphones, tablets, etc.), connected to the network, would be mobile nodes. In this case, the positioning could be carried out without additional hardware.
A Zigbee or IEEE 802.15.4 network could be used for positioning too, but in this case an additional network is required to collect data for later processing.
A typical environment for testing fingerprints based IPSs, e. g. ZigBee technology, is shown in Fig. 1. Black circles represent the coordinates of the points used as reference fingerprints. A database is generated including the values measured in these references. Fixed nodes are represented by red circles and mobile node carried by the user/target is shown as a “chip” icon.
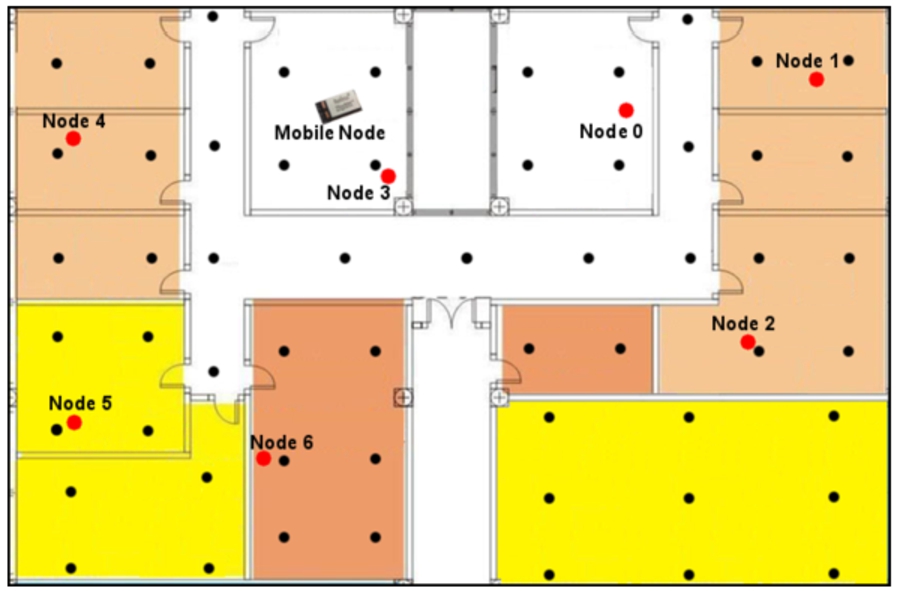
Basic Components in RSSI Fingerprint Indoor Positioning Systems (IPS).
In this figure only one mobile node is represented, but each user/target could carry additional mobile nodes resulting in an increased versatility and accuracy.
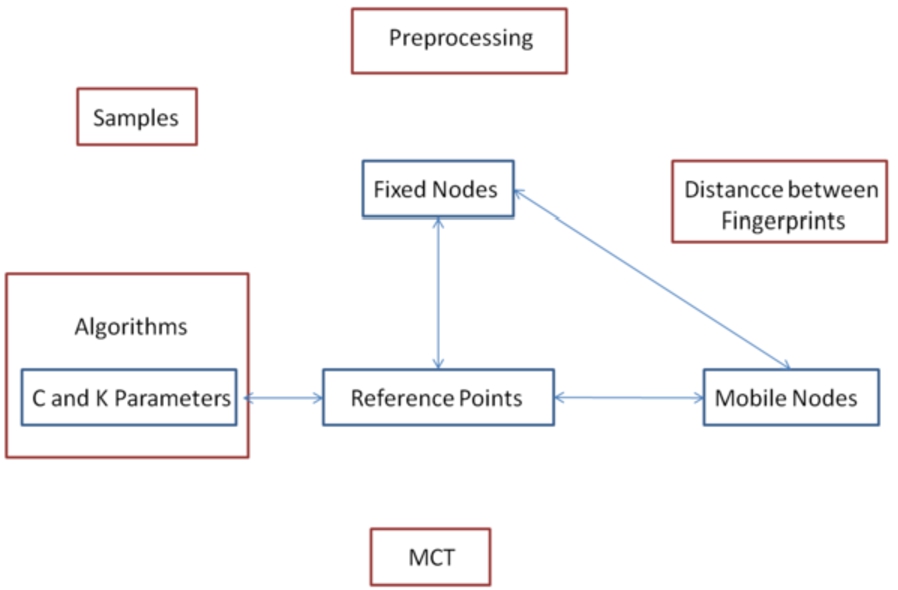
The basic architecture of an IPS based on fingerprints is shown in the Fig. 2.
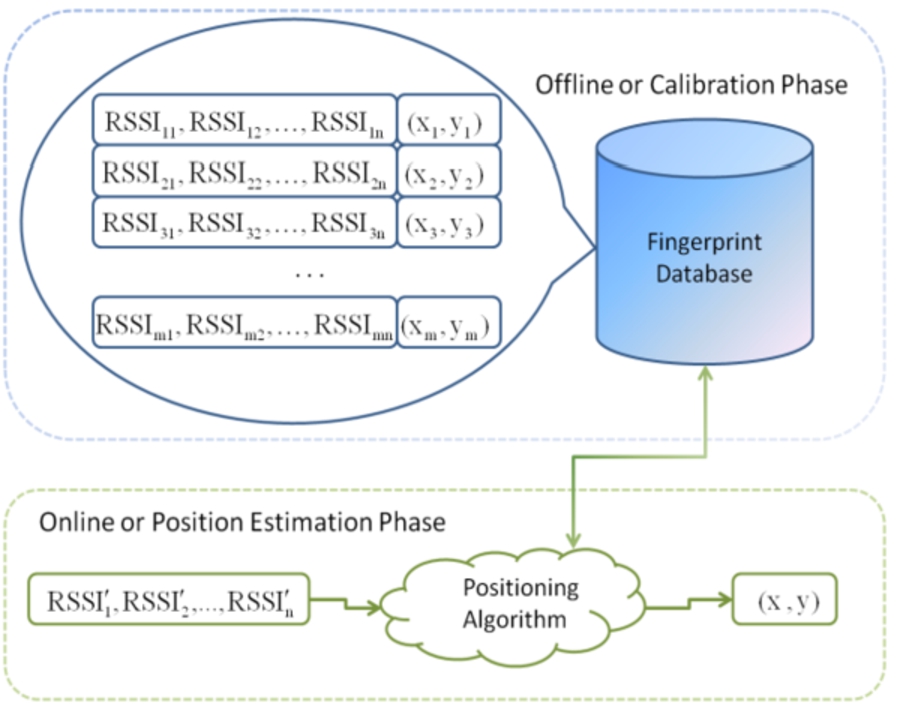
Fingerprint Localization Based Method Architecture.
RSSI fingerprint indoor positioning processing is composed of two phases: The offline phase to train or calibrate the system, and the online phase to estimate the position of the mobile nodes.
The offline phase (represented by the upper block in Fig. 2) aims to generate a reference fingerprints database. These references are measured in a set of selected points, called reference points or reference locations, with known coordinates. In this phase, empiric measurements are carried out. In this sense, a mobile node is placed on each reference point, l, the coordinates of this point are registered (
In the online phase (represented by the lower block in Fig. 2), the mobile node is located in an unknown position and a RSSI vector is acquired by the fixed nodes.
The values of the RSSI vector are compared to ones stored in the database. A method to identify similarities and differences between fingerprints is used. The location of the most similar fingerprint is estimated as position of the user. In the case of two or more fingerprints having similar results, one new point is calculated combining these results or one of them is selected by an algorithm.
The simplest way to generate the fingerprints database is using some of the typical Central Tendency Measures (CTMs), like arithmetic mean, median, or mode, of the sampled fingerprints acquired for each reference location. Each database input consists of a fingerprint and the coordinates of the fixed node location. RADAR [3,4] and Motetrack [15,16] are examples in which this database generation method is used.
Input data preprocessing
The above mentioned generation method is considered the first level of preprocessing. Various input data pre-processing methods can be found in the scientific bibliography. These methods are organized in different levels. The objective of them is to improve the accuracy of the positioning, and to achieve this goal they take into account some characteristics of the positioning environment.
For example, in [12], the redundant RSSI values in reference fingerprints are removed to improve the positioning accuracy. Authors reported that additional positioning data are not provided by redundant RSSI values. These values could be removed from reference fingerprints and are not used in the comparison with online fingerprints.
An additional preprocessing level is required when different mobile nodes are used to locate a user. This level could be combined with the before mentioned ones. In RADAR [3,4], the Best Fingerprint (BF) method is proposed, although it is not tested. BF method aims to avoid signal interferences caused by the user.
The fingerprint with the best RSSI values is selected from samples registered by mobile nodes. This task is carried out in both offline phase and online phase. The effect of user presence could be avoided when mobile nodes are distributed around the user.
Therefore, different preprocessing levels and pre-processing methods in each level could be included in the positioning process.
Fingerprints comparison methods
A classification of RSSI fingerprint IPSs can be done considering the method used to compare the received fingerprint from an unknown point with a set of reference fingerprints registered in reference points [3]. In this sense, deterministic and probabilistic comparison methods could be used.
In deterministic methods the location of the closest reference fingerprint is selected as the estimated position of the mobile node.
In probabilistic methods, like Bayes rule [14,24], a probability distribution of mobile node positioning is created. This distribution is used to estimate the probability that a mobile node is located on a point based on registered measurements.
Following, the most common deterministic comparison methods are presented:
Manhattan distance
The Manhattan distance, used in Motetrack [15,16] between a reference fingerprint and an estimated fingerprint is defined as:
Where n represents the number of fixed nodes;
Euclidean distance
The Euclidean distance, used in RADAR [3,4] is calculated using the following formula:
Where n represents the number of fixed nodes;
Positioning algorithms
KMLN or KNN algorithm
The K Nearest Neighbours (KNN) algorithm, also known as K Most Likely Neighbour (KMLN) [3,4], consists of selecting the K most appropriated locations, and calculating the centroid to estimate a new point or to select one of them based on some pre-set criteria. Also, a weighting of reference values could be done using the results of the comparison between fingerprints. So, the estimation could be based only on nearest reference fingerprints. In this case, the algorithms are called Weight-KMLN (WKMLN) or Weight-KNN (WKNN).
The accuracy of positioning is affected hardly by the value of K. A previous empiric study to determinate the K value obtaining the best location results should be done.
The selection of K references can be done in different ways based on methods used to compare the online fingerprint with stored ones.
There is a simplification of this algorithm, called Most Likely Neighbour (MLN), in which coordinates of the nearest reference is selected as the positioning estimation (K = 1). This alternative is a good option when database is big, and distances could be very small. However, this could yield a decreased accuracy when reference points are sufficiently distant.
RT algorithm
In general, good results are not obtained for a fixed or pre-set value of K, because there are situations in which only a few nearby points exist and too far points are included. The opposite situation is also possible, when there are a lot of nearby points and distances are very small resulting in an inappropriate point selection.
The Relative Threshold (RT) algorithm, presented in Motetrack [15,16], is used to select the nearest points. This algorithm defines a circle with centre in the nearest reference fingerprint to the target. The radium of the circle is set using a parameter, called C. All reference fingerprints that are inside of the circle are selected.
Let s be a target fingerprint, R a set of reference fingerprints, and
Once the most appropriate reference fingerprints are selected, the location estimation is finally done in the same way proposed in KMLN, for example calculating the centroid.
The value of C parameter must be calculated empirically in order to obtain a good estimation. A typical value can be between 1 and 2, depending on fingerprints database density.
The accuracy of the estimation obtained using RT algorithm is increased in relation to results of KMLN, because in RT algorithm, the number of references used to calculate the location depends on the spatial point density.
Estimation error calculation
Estimation error analysis can also be done in different ways. Euclidean distance between estimated coordinates and real coordinates is commonly used to calculate the accuracy of a single location. Percentiles could be used to analyse a set of locations.
Fingerprint ILS simulator (PosSimulator)
One of the main purposes of this research project is to implement and simulate a large number of variants of the indoor positioning process based on fingerprint algorithms. The aim of these simulations is to analyze which of these variants are more advantageous in terms of cost, location accuracy and location estimation time. A previous simulation research was done in [19]. This paper also presents an analysis of the behavior of an indoor position system based on fingerprints but not using PosSimulator. The previous system was adapted to be tested in a competition, called EvAAL [1] (Evaluating AAL Systems through Competitive Benchmarking), hold both in Madrid (tests) and Eindhoven (results). The objectives of this analysis was to determine the best algorithm and the best database generation that should have been applied in order to obtain the best results in the competition and to use them in other environments. But this previous studio doesn’t take care about the rest of parameters analyzed in this new research (Input data preprocessing, fingerprint comparison methods, estimation error calculation, number of reference points, number of fixed and mobile nodes, etc.).
A review of the related literature has provided a localization process based on RSSI fingerprints with a relatively wide set of parameters. These parameters make this process highly variable, thus sometimes it is referred as the localization process and sometimes as a set of different localization processes.
A parameter is defined as any element involved in the previously described localization process: algorithms, BD generation mechanisms, preprocessing, distance calculation, etc. and a value is defined as those that can be taken by each of the parameters: RT or KMLN; Arithmetic Mean, Median, or Mode; Best or Average Fingerprint; Manhattan or Euclidean…
The main idea is to carry out the simulation of the different variants of the fingerprint based positioning process to subsequently, by using an adequate data representation, be able to draw conclusions as clearly and simply as possible. The simulation is done by the implementation of a set of applications that encompass all the tasks needed to provide the required functionalities.
These applications have to cover the entire localization process, from collecting RSSI values to analyzing location results, passing through the automatic generation of fingerprint databases and track files. Besides, they have to be able to deal with a vast number of different cases produced by the use of multiple values for every parameter of the localization process.
Likewise, they should be able to present simulation results to the user in a clear, concise and effective manner. They also have to show those interesting facts from which the user can draw meaningful conclusions, as it might be, for example, the execution time of the simulation.
To achieve these goals, it is necessary to previously define and design a simulation system for the localization processes, analyzing each and every one of the required features and modeling its structure. This system must also have to be designed to easily accommodate new values for the existing parameters and for the new ones that could be added.
It is expected to implement a system capable of simulating the localization process and allowing the user to fully customize the process by modifying any of its parameters. The system has to be able to analyze the localization process in a global or specific way. The global analysis is used to determine the best combination of parameter values in terms of accuracy, cost, installation and calibration effort, etc. while the specific one is used for any environment which has particular limitations so that the most appropriate combination of parameter values is the one that best suits its characteristics.
System functionality
The simulation system (PosSimulator) requires as input data a set of RSSI samples. Data can be determined theoretically or can be manually collected through wireless networks deployed on the specific test environment. Some of the devices in the wireless networks, fixed nodes, have to measure the signal power that is received by one or more mobile devices that are to be located. These mobile devices are carried by a single user placed in specific points, specific directions and receiving messages from a set of fixed nodes at all times.
PosSimulator uses the set of RSSI samples collected in each points to automatically generate the fingerprint reference databases (DBs) and to create the tracking path that simulates a walk through the test environment. This tracking path and the fingerprint reference databases will be used during the simulation of the localization process also performed by PosSimulator.
PosSimulator must:
Generate automatically as many fingerprint databases as necessary.
Perform the input data preprocessings.
Create tracks in a simple way.
Carry out the simulation of the localization process.
Calculate the result of each one of the simulations.
Analyze and present the results of all simulations.
In the following points all the functionalities are detailed.
Database generation (first data preprocessing)
Fingerprint databases, as it has been already described, are structures that store all coordinates and directions for reference locations, along with their corresponding fingerprint references from a location test environment. They are extracted from sampled fingerprints by using any of the aforementioned CTMs. This is the named first input data preprocessing. The system will have as many databases as different combinations of the following variables:
CTMs: For this study, the CTMs of samples to be considered are as follows: Arithmetic Mean, Median, Mode, Mean of Squares and Square of Mean [19].
Input data: Different databases can be created based on the orientation of the user: North, Northeast, East, Southeast, South, Southwest, West and Northwest. The input data collected when the user is spinning is stored in an additional database.
Number of sampled fingerprints to be used: from one to the maximum number of fingerprints that have been taken for each reference point. This number will be used later to analyze the minimum number of samples than must be taken in order to achieve good simulation results.
Based on these variables it is possible to generate a broad set of fingerprint databases. The simulation system should provide the ability to generate all of them in the simplest way possible. So the simulation system of the localization processes should:
Make it easy to the user the task to generate new databases. This task can be done anytime except when a simulation is in progress. Generate all databases automatically, one for each combination of the aforementioned parameters, and store them for later use.
Additional data preprocessing
Once the fingerprints databases have been generated, using the samples and the different CTMs, these data could be preprocessed again before they are used as input for the localization algorithm. Those new level of preprocessing would consist of performing a series of calculations based on specific characteristics of the localization process. They have been named as second and third level of preprocessing.
The first level is composed by the CTMs calculations that is always performed automatically when the databases are created. The second level of preprocessing is composed of two calculations: The Best Fingerprint and Average Fingerprint. At last, in the third level of preprocessing, redundant RSSI values are eliminated, thus avoiding that similar RSSI values at different reference points diminish location accuracy.
These preprocessing are not mandatory for a basic fingerprint based localization process, although, in some cases, it improves the precision and decrease the runtime of the process. Besides, they are not the only possible ones and it is possible to add more preprocessing tasks to a level and new preprocessing levels to the system.
Tracking creation
A track is the simulation of a user having a walk in the test environment. The simulation system should be able to generate any track in a simple way making it easy to create as many of them as necessary. It is not allowed to create a track while a simulation is running. To create a track, the simulation system must:
Allow the user to select which reference points define the track and the order in which they will be covered during the walk simulation. Choose randomly a sampled fingerprint, for each selected point and each direction. A fingerprint for each direction is needed to simulate a user with various mobile devices, one for each direction. Store, in a structured way, the selected fingerprints along with the actual coordinates of the points to which they correspond. Thus, when the location is estimated, during the simulation online phase, this one can be compared with the real position.
Localization simulation
Regarding the simulation of the localization process, this is done for all the possible combinations of all the parameter values applicable to the test environment:
Databases types: based on the CTM, direction and number of samples, as it has been previously described above.
Number of reference points from the fingerprint reference database used during the simulation process.
Amount of fixed nodes used for the simulation.
Number of mobile devices. The existence of more than one mobile device in a user is simulated by using the sampled fingerprints taken in different directions. Therefore, mobile devices are identified by their direction.
Using of second and third levels of data preprocessing.
Algorithms for position estimation that will be used in the simulation (KMLN, RT) and the values of the parameters required for each algorithm (K and C).
Fingerprint comparison method used: Euclidean or Manhattan.
Track used for the simulation.
To achieve this goal, the simulation system must implement the following specific functions:
Allow the user to choose different values for the parameters in a versatile way. The system should easily allow the user to choose the number and type of databases, the localization points of the environment, the number fixed nodes and their location, the number of mobile devices in a user, the kind input data preprocessing, the algorithms used for position estimation and their parameters and the distance used for fingerprint comparison. All these values must be given for a specific simulation. Admit, where it is possible, to specify value ranges for the parameters. Thus, PosSimulator can simulate a set of combinations, not just one. Make the simulation for each and every one of the combinations that the user has configured in the system by using one tracking file as input data. A set of location estimations must be obtained as a result of each simulation and it has to be easily processed by the analysis functions. The resulting set of location estimations should present the combination of the values taken by the parameters used in the simulation and, for each fingerprint of the track, the actual and the estimated coordinates. The localization estimations must present the execution runtime of the simulation. This information must show which combination is the fastest to obtain the location estimations. The track used is the last one that has been generated. If the user wants to use a different one, it must be generated before running the simulation, and the previous one has to be removed.
Location results calculation
It’s necessary to evaluate the quality of the simulated location process. The evaluation is based on the location error made in the 75th percentile. Thus, it is necessary to:
Calculate the errors in the location estimations for all the fingerprints of the track for a particular simulation, using the Euclidean or the Manhattan distance between two points (the one selected by the user). Sort, from the lowest to the highest value, the errors made for a specific simulation and take the error value greater than 75% of all errors made.
Results analysis
Finally an analysis and the results of all simulations are carried out. If desired, it will be possible to use stored results from previous simulations. The simulation system must be capable of create a list of all the simulations carried out, sorted by the accuracy of the location measured by the error made in the 75th percentile. It is also possible to display, for each simulation, other information, such as errors in the 90th, 95th or 100th percentile, and the time to complete the simulation.
All these features that have been described are the ones to be implemented in order to achieve the pursued objectives. This makes it possible to complete the simulation of the location process and, finally, to observe which of the simulated combinations performed the best based on different criteria: precision (error in 75th percentile), calibration effort (number of reference points), cost (number of fixed and mobile devices), computational cost (execution time), etc. The entire process is shown in Fig. 3.
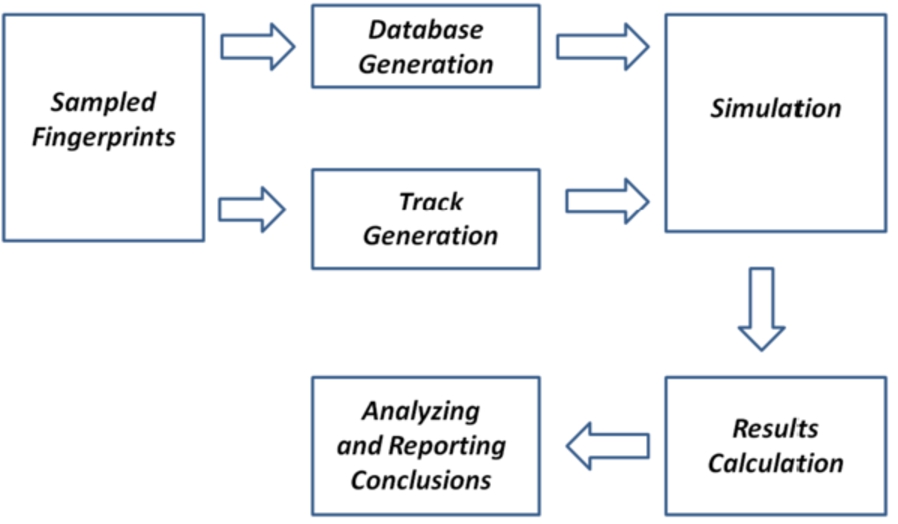
Location process and the most important features.
As previously mentioned, the simulation application requires an input file with fingerprint samples in a defined format.
This file can be empirically obtained from a network using wireless technology or theoretically generated by using a path loss model. In this work, it’s empirical.
This functionality is not included in the PosSimulator application. However a little discussion of the cost of sample measurement is done.
The cost of the measurement collection is result of the number of points, direction, samples and the time between samples the user needs to use in the localization simulation. i.e.: 100 points, 4 direction, 10 samples and 0.5 seconds each sample.
Time collecting samples:
Time changing the position:
PosSimulator can also be used to analyse the best values of those parameters in order to reduce the offline phase time.
The rest of the functionality (generation of fingerprint databases, tracking file generation, simulation and results) is performed through PosSimulator.
Generation of the fingerprint database
The generation of fingerprint databases is implemented as a function that is executed by the user. The user must select the number of sampled fingerprints for each reference point to be used for the generation and, subsequently, start the generation process (Fig. 4, zone 5). As mentioned above, this function generates, for the number of sampled fingerprints chosen, all databases corresponding to each CTM and direction, including the database with fingerprints taken while the user was spinning.
Each database is stored in a text file.
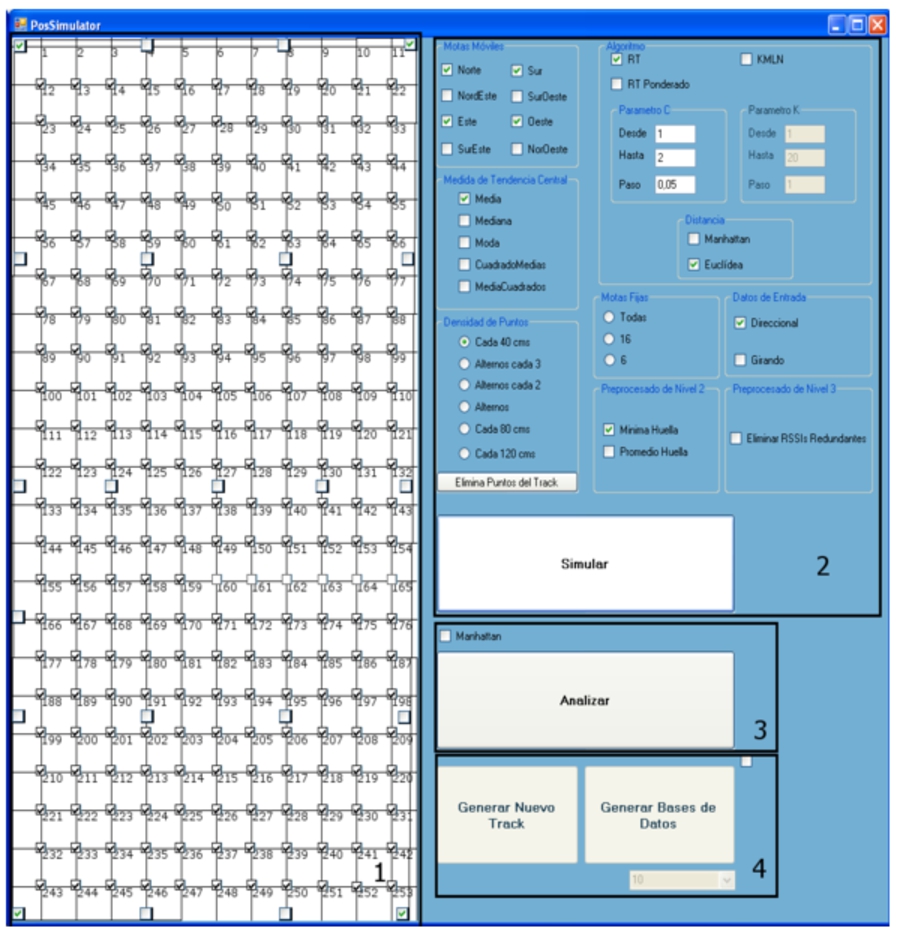
PosSimulator application interface.
Track file generation is implemented in PosSimulator application. As it is presented at Fig. 4, zone 1, there is an interface where is shown the plan of the test environment. This plan contains all reference points where samples are available.
To generate a track file, the function of generating a new track has to be activated (by pressing the button Generate New Track in Zone 4) and the hypothetical points where a user would walk are selected, one by one, in the plan shown in zone 1.
The coordinates of each selected point are stored in a single line of a text file. In the same line it is also stored a random sampled fingerprint from the selected point in all directions.
Finally, the direction that the user is facing to is stored when the next point is selected, because it is at that moment when the direction is known.
The value of the direction of the last fingerprint of the track is unknown. At the end of the track (by pressing the end of track button that will appear in the zone 4 when the tracking generation is active), the direction of the last point will be assigned to the direction of the previous point, because it is considered that the user does not change his orientation.
The track file created in this manner is used for the location process simulations, since this file contain all the information and fingerprints needed.
Simulator
The PosSimulator application implements simulations for a wide range of existing positioning processes. The user of the application has the possibility to select one or more positioning processes in a specific simulation. In other words, the application simulates the localization process using different combinations of parameters that the user has selected (Fig. 4, zone 2). Once the user has selected all parameter values and the simulation is launched, the system, autonomously, will simulate one by one, all possible combinations for the selected values.
The system creates an output text file for each different simulation, named specifically, in order to reflect the precise combination of parameter values used in the positioning process simulation.
This file stores, for each point of the track file, the estimated coordinates, calculated by the simulation process by using the track fingerprints, and the real coordinates of the point of the track, all in the same line. Thus, each line of this text file provides the required information to perform the comparison between the actual position and estimated one.
Analysis of results
The analysis of the results is presented by pressing the corresponding button (Fig. 4, zone 3). The analysis is made by going through each simulation output file (which, as already mentioned, corresponds to the positioning results for a combination of the values taken by the parameters of the localization process). Then, a list of the error made in each position is created by calculating the Euclidean distance between the estimated and actual coordinates. Alternatively, it is possible to use the Manhattan distance for the error calculation (Fig. 4, zone 3). The error list is sorted from lowest to highest value and the corresponding error values of the 75th, 90th, 95th and 100th percentile are extracted.
There is another list with a line per each output file of the simulation. That list, again, is sorted from lowest to highest error. Finally a file is written with the final results including the error for the 75th percentile of each simulation. This file also includes the errors for the 90th, 95th and 100th percentile.
Tests
After implementing the simulator of the fingerprint based location process which allows changing all parameters values within its valid range and getting results of localization from the input data, it has been concluded that there is a set of parameters that are independent of the other ones, and that there is another subset of parameters which depend on each other.
Hence, the tests made to determine the best value of each independent parameter, can be made using a particular combination of values of other parameters, without significant influence in the test results.
However, for a dependent parameter, the goodness of a particular value is affected by the value of other parameters, so the tests made to determine the best value should involve more than one parameter at the same time.
In Fig. 5 all parameters are shown. The possible dependence of those who, a priori, before testing, had a good chance of being dependent has been indicated with arrows and blue boxes. For the moment, the rest of the parameters (marked with red boxes) are considered independent ones.
Fingerprint based localization process parameters and possible dependencies.
Basically, a test is performed by executing the PosSimulator application and selecting one or some set of values for each parameter of the studied localization process.
The choice of the parameter values and the execution of the simulations will not be done at random, but rather they will be done reasonably, in order to resolve or clarify some question or hypothesis about the indoor localization process based on RSSI fingerprints.
First, it is necessary to define the test environment where the samples have been taken and how the track file has been created, indicating the points used and the generation method employed by the PosSimulator application.
Classroom G1.83 at the School of Computer Science Engineering, University of Seville, has been used as a test environment. The chosen room measures 4.54 m wide and 9.26 m length, fairly similar to the rooms used in reference works [5,21] to enable later comparison of the test results.
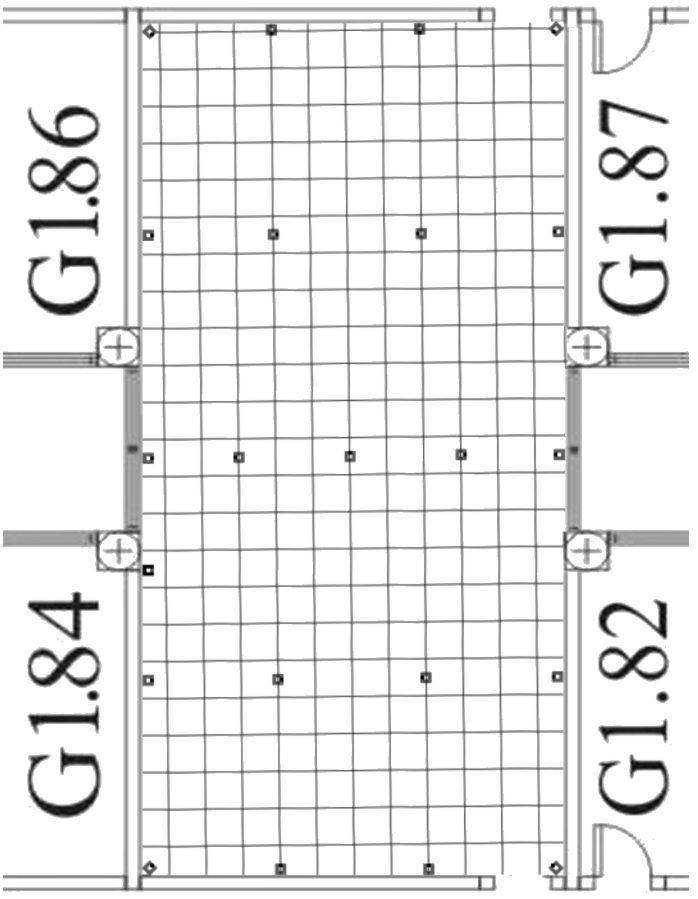
Plane with the fixed network nodes.
Due to its versatility and mobility, a ZigBee network has been deployed in the test environment. Messages sent in the Zigbee network will be used to get the fixed node RSSI information in the data collection process necessary to obtain the fingerprints. This procedure will not be explained here because it is beyond the scope of this paper.
Figure 6 shows the classroom, its immediate surroundings and the position of the fixed nodes of the network within the classroom. In the figure, nodes are represented by small squares, scattered around the test environment. The small black point that can be observed on each fixed node indicates antenna position.
A fairly large number of network fixed nodes have been uniformly distributed around the test environment. Thus, all kind of tests can be made later by selecting subsets of fixed nodes varying sizes and homogeneity.
The network has 22 fixed nodes. So many devices have been installed to match and even exceed, those used in the studies [5,21] where 18 of them were used, thus allowing the comparison between the theoretical results of those studies and the experimental ones presented in this study.
As already mentioned, this fairy large of nodes allows simulating different positioning environments, thereby determining which kind of scenario performs the best. Fixed nodes have been placed on the ground, as shown in Fig. 7. Even knowing the potential issues caused by interference and refraction phenomena associated with this location, it has been chosen to place them at that level because its handling is easier on the floor than, for example, in the ceiling. Also, this allows keeping a vertical distance of about 1.10 m between the fixed nodes and the mobile one, which is important in order to be able to compare results with studies [5,21].
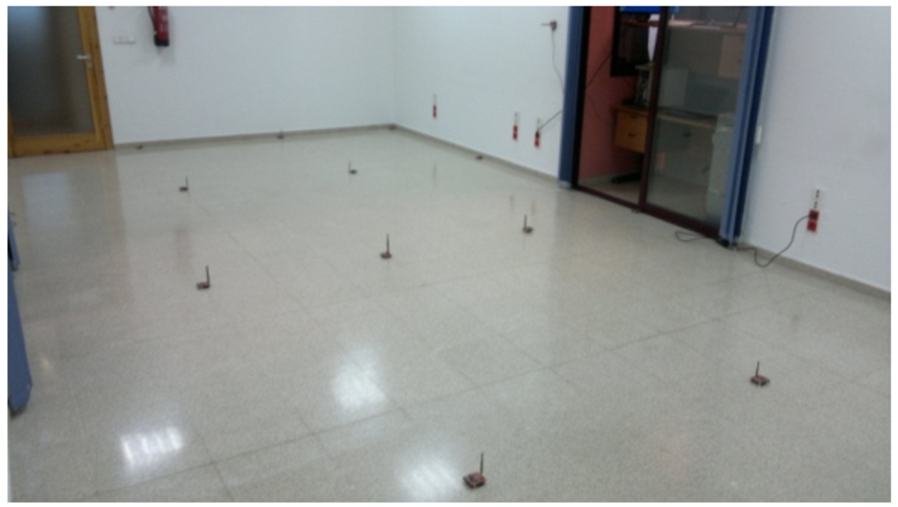
Placement of fixed nodes in the test environment.
Under normal conditions the room is arranged with chairs and tables, but these have been removed in order to resemble as much as possible the test environment used in [5,21]. Also, this configuration makes it easier to place fixed nodes, and facilitates collecting data from the right reference points, given their large number and close spacing.
Although in the works [5,21] which have served as the basis for designing the test environment it has been theoretically estimated one reference point every 3.10 centimeters, it is impossible to use that enormous number of reference points (about 136000) empirically.
In this study it has been considered that 40 cm is a suitable distance between reference points in order to allow a fairly large number of later tests, by choosing among all of them different sets of reference points. The floor is paved with square stabs, each measuring 40 cm by 40 cm, so one reference point has been placed on each corner of a slab. Figure 6 shows the arrangement of the floor slabs and, along with them, the reference points where the user must be placed in order to collect all the necessary fingerprint samples.
With the exception of the first row of points, too close to the wall, data were collected for a total of 235 reference points, taking samples with the user facing to eight different directions and also rotating. In total, on each reference point, 10 samples were taken for each direction and 20 samples rotating.
Sampling in eight different directions has been done to be able to simulate a user wearing eight mobile nodes, although with the same antenna, transceiver and parameters for sending and receiving [3,4].
There is a good amount of collected data, thus allowing a wide range of simulation possibilities, from simple to complex ones.
The mobile node has been placed on the user’s waist, attached to the front of his belt, about 1.10 meters over the ground, as shown in Fig. 8.
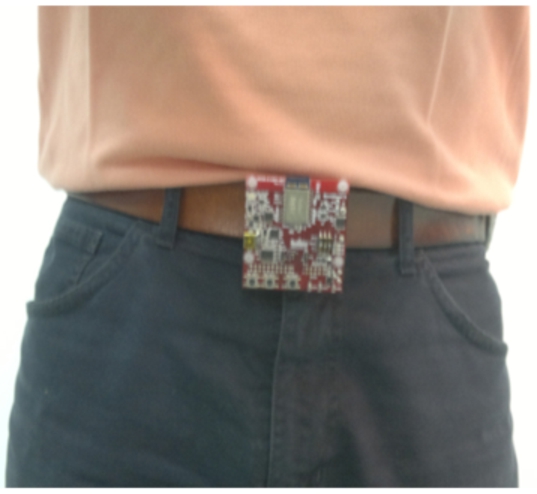
Mobile node attached to the user.
By using the PosSimulator application, a track file simulating a walk in the test environment has been created. Figure 9 shows the track, composed of 40 reference points, which is roughly equivalent to a walk of 40 steps through the room.
Notice that two consecutive points are spaced 40 or 56 cm apart, depending on if the movement is done vertically, horizontally or diagonally. This distance is about the size of a standard step.
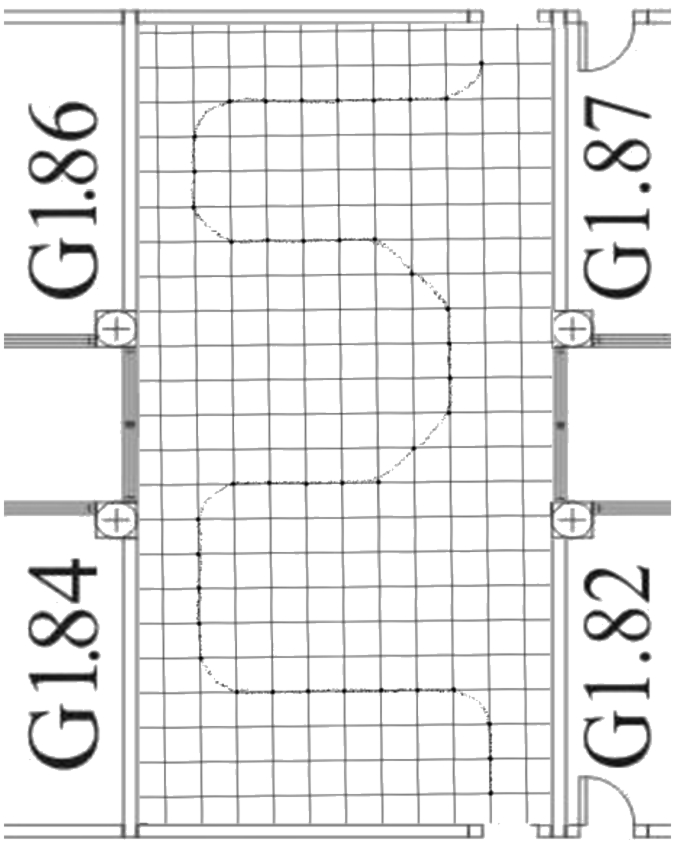
Representation of the walk through test environment stored in the track file.
The first step to carry out the test plan has been to formally define all those hypotheses and questions about indoor positioning systems based on fingerprints which have motivated this research.
These hypotheses or questions have arisen either from our own enquiries and concerns, or have been selected among the most interesting conclusions reached in other studies in order to corroborate or refute them.
Based on these hypotheses and questions, and in order to shed light on them, a battery of tests has been generated and conducted. These tests are consistent with those performed in the reviewed studies, especially those ones having common characteristics with our test environment, to enable later result comparison.
The goal of this set of tests is not to give precise results, or accurate upper or lower limits, but rather to find out trends in precision localization when different parameter values are modified.
The first set of tests has analyzed the majority of the parameters in an isolated manner. They will aim to conclude which values of the independent parameters are the best.
The second set of tests has analyzed the combinations of dependent parameters values in order to conclude which of these combinations will yield better results.
Results of these tests are shown in the results section where the best combination for the test environment is also determined.
Results
The results of the tests are shown in this paragraph depending on different criteria taking into account.
Regarding the independent parameters
Figure 10 shows that the best fingerprint preprocessing is Best Fingerprint (BF) which yields better results both in accuracy in localization and runtime. Eliminating redundant RSSI in the database reference fingerprint makes it worst the overall accuracy.
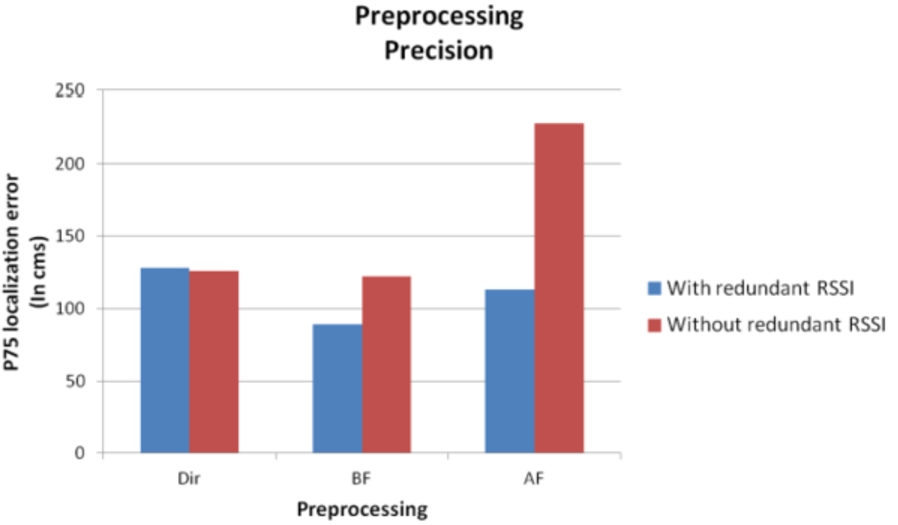
Location accuracy varying level 2 preprocessing.
As shown in Fig. 11, the CMT that give the best results is Mean, closely followed by the Median and Mode. Those using the square, as well as being more expensive at runtime, don’t yield improved results.
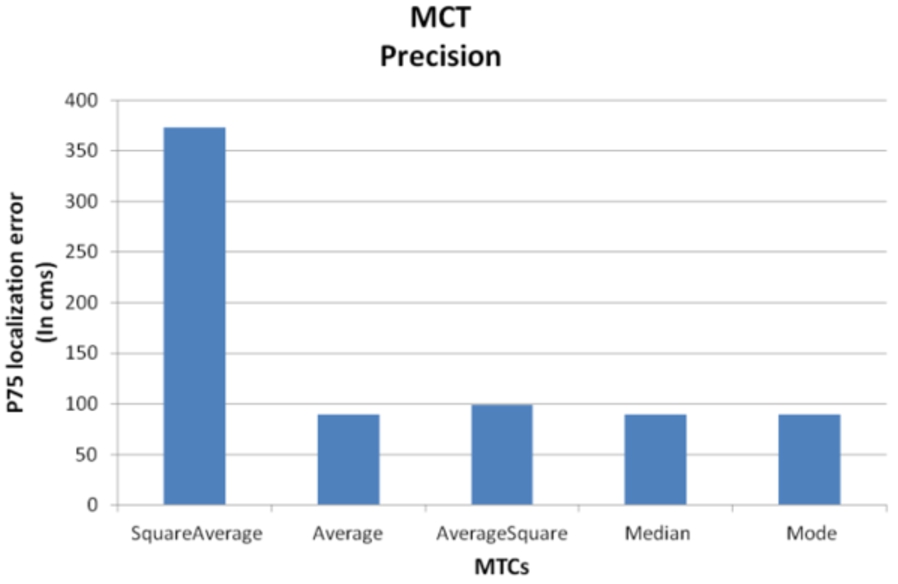
Location accuracy varying MCT.
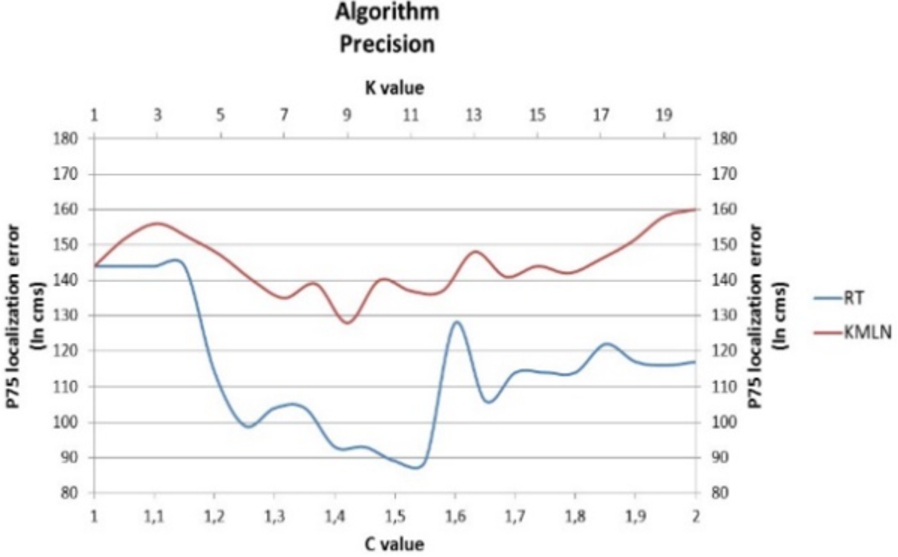
Location accuracy varying Algorithms and C and K values.
The best of the location algorithms studied is the RT algorithm (Fig. 12).
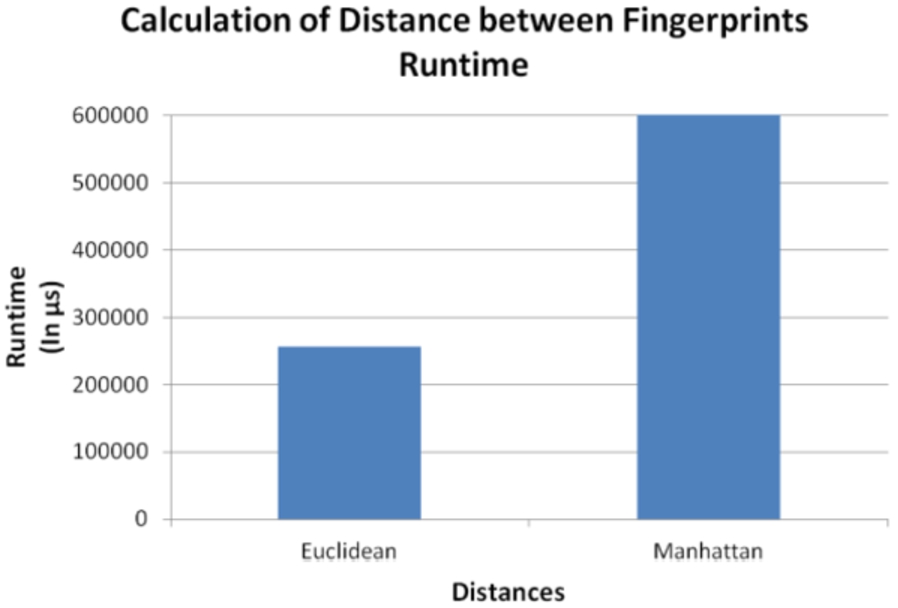
The best distance metric is the Euclidean. It has similar results to the Manhattan one, but it is better in terms of runtime. The difference is that the calculations are performed in Visual Basic, the chosen development tool. In this tool, calculating the absolute value consumes more time than calculating squares and square roots. Figure 13 shows the runtime taken in each one.
With 2 or 3 samples used for the generation of each database fingerprint it is enough if the samples are taken, taking into account the stability of RSSI (Fig. 14). This finding allows to carry out the data collection faster.
The location accuracy does not improve as the number of samples is increased.
Location accuracy varying distance between fingerprints.
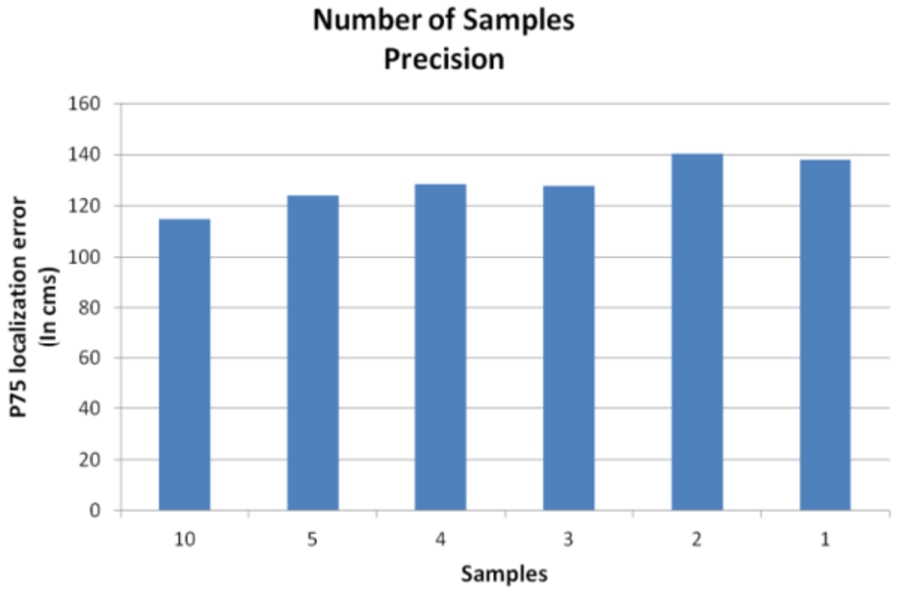
Location accuracy varying number of samples.
The location accuracy in an environment is proportional to the number of fixed nodes, this is an exponential proportionality. There exists a number of fixed nodes below which accuracy starts decrementing significantly (Fig. 15).
As well as the distribution of fixed nodes, a detailed study of the specifications and performance of the antennas is necessary in order to reach precise conclusions.
A homogeneous distribution of fixed nodes in the test environment throws, in general, better results in terms of accuracy in location, than a heterogeneous one.
The runtime of the localization process is proportional to the number of fixed nodes.
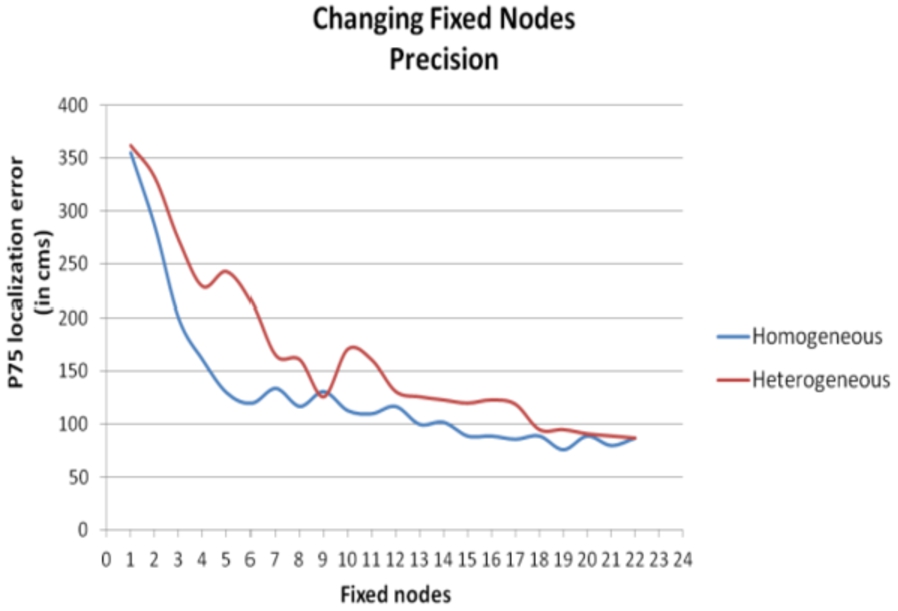
Location accuracy varying fixed nodes.
As shown in Fig. 16, the location accuracy in an environment is proportional to the number of mobile nodes, this proportionality is exponential, such that, in each case, exist a number of mobile nodes below them in which the accuracy decreases in exponential tendency.
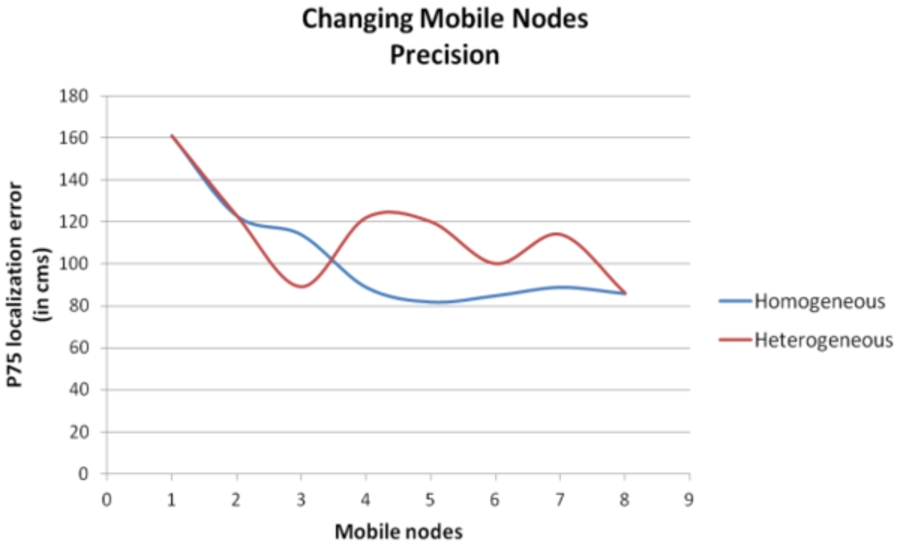
Location accuracy varying mobile nodes.
A homogeneous distribution of the mobile nodes in the test environment yields, in general better results in terms of accuracy in locating than a heterogeneous distribution.
The runtime of the localization process is not significantly affected by the number of mobile nodes.
The dependence between the number of fixed nodes and the number of mobile nodes is very strong. There is an exponential relationship between them and location accuracy (Fig. 17).
For best results in cost terms, it is necessary to minimize the number of fixed nodes and mobile nodes. So another variable is the number of users to be located. In conditions where there are large numbers of users to be simultaneously located, it would be desirable to increase the number of fixed nodes, because, if mobile nodes are increased, they have to be increased in each user.
In contrast, in those environments where there are very few users, or only one, it seems logical to increase the number of mobile nodes where incrementing a mobile node means decreasing one fixed nodes. The tests have been done only with one user.
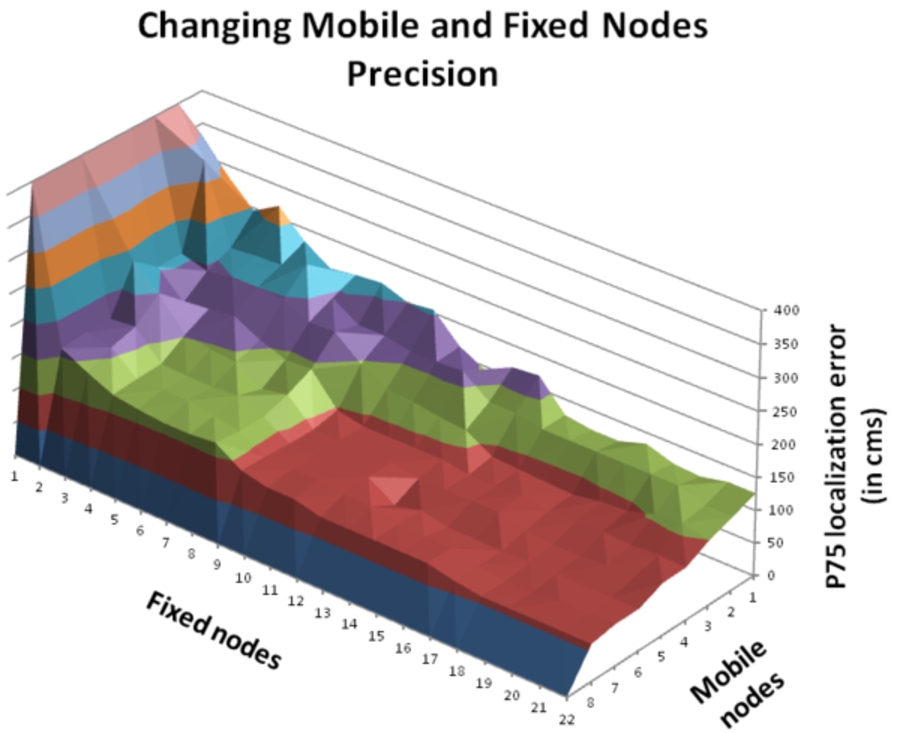
Location accuracy varying fixed and mobile nodes.
The location accuracy in an environment is proportional to the existing reference points. As shown in Fig. 18. This is a linear proportionality, that is, the more reference points are taken, the better the results, so the number of reference points to take will mainly depend on the minimum precision needed.
A homogeneous distribution of reference points in the test environment gives better results in terms of accuracy in localization that heterogeneous distribution.
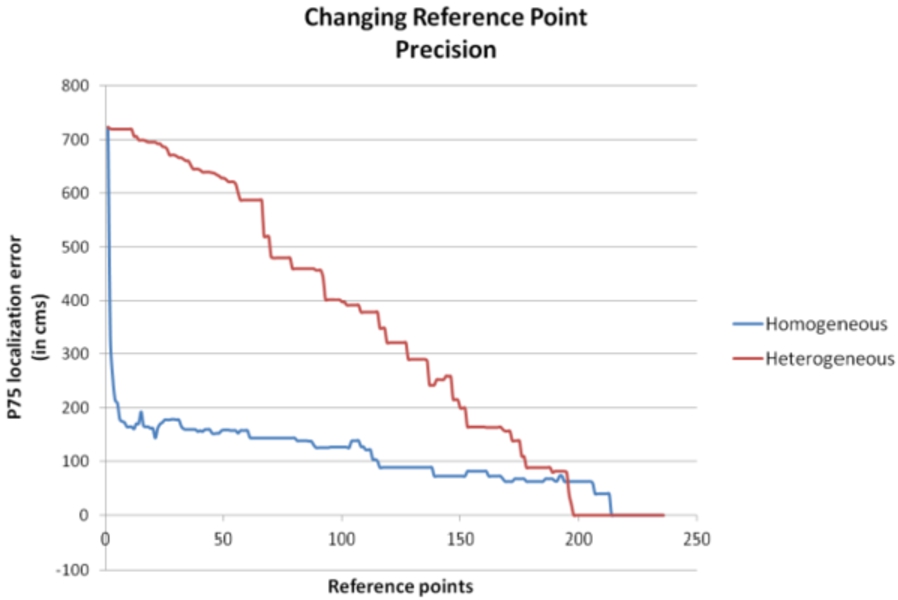
Location accuracy varying reference points.
Depending on the specific case, if desired more precision in a specific area of the localization environment, more points can be taken in that area, leaving other ones, where less accuracy is required (e.g. corridors or places where access is sporadic) more depopulated.
The localization process runtime is proportional to the number of existing reference points. This proportionality is also linear.
For each different number of reference points in the database, the minimum number of fixed nodes over which the improvement in accuracy is not significant, appears to vary. That number is lower as higher is the number of reference points taken. See Fig. 19.
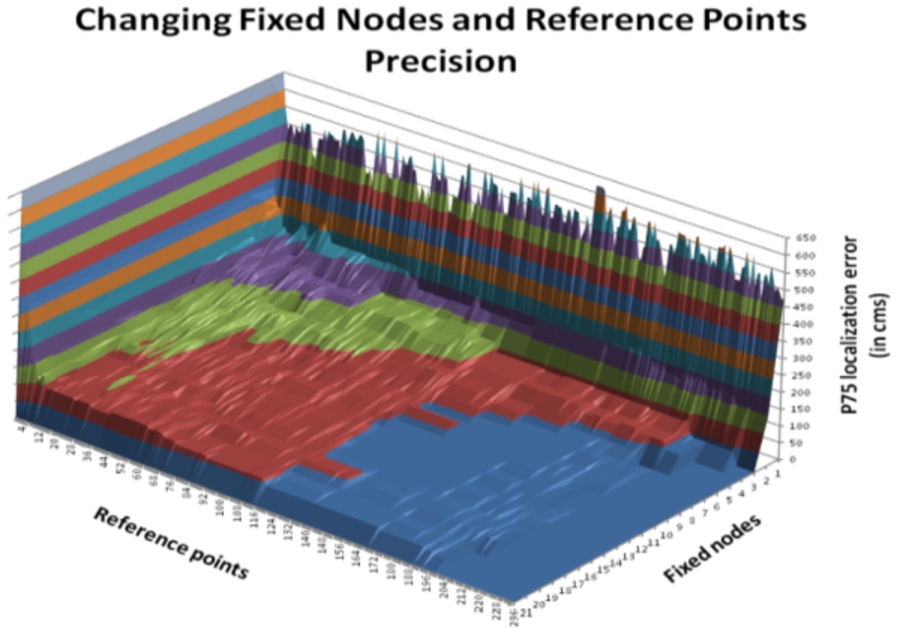
Location accuracy varying reference points and fixed nodes.
There is a relationship between the number of points used in the database and the values of the C parameter of RT algorithm and K parameter of KMLN algorithm, so that decrementing the number of reference points, the values of C and K parameters should be increased for best results. See Figs 20 and 21.
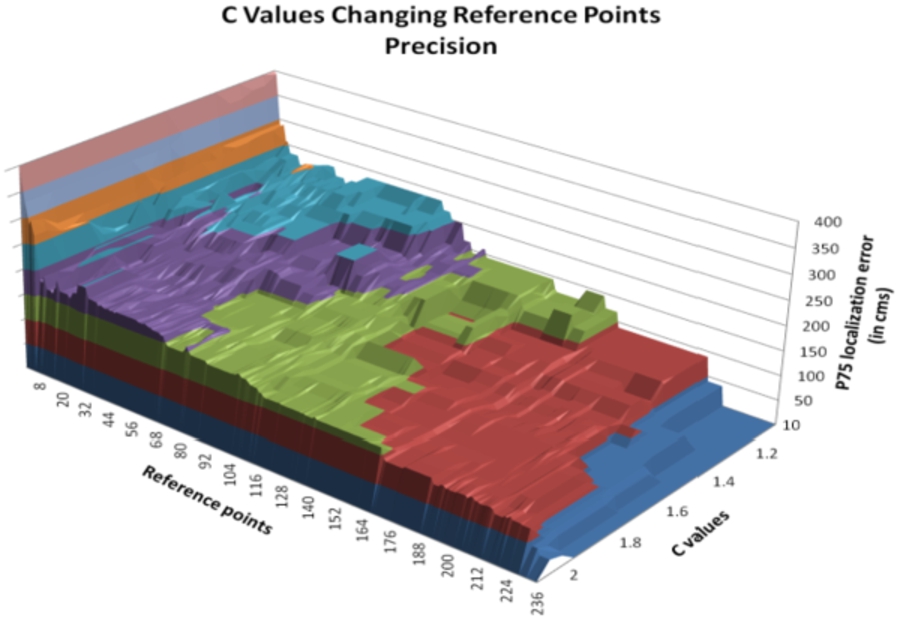
Location accuracy varying reference points and C values.
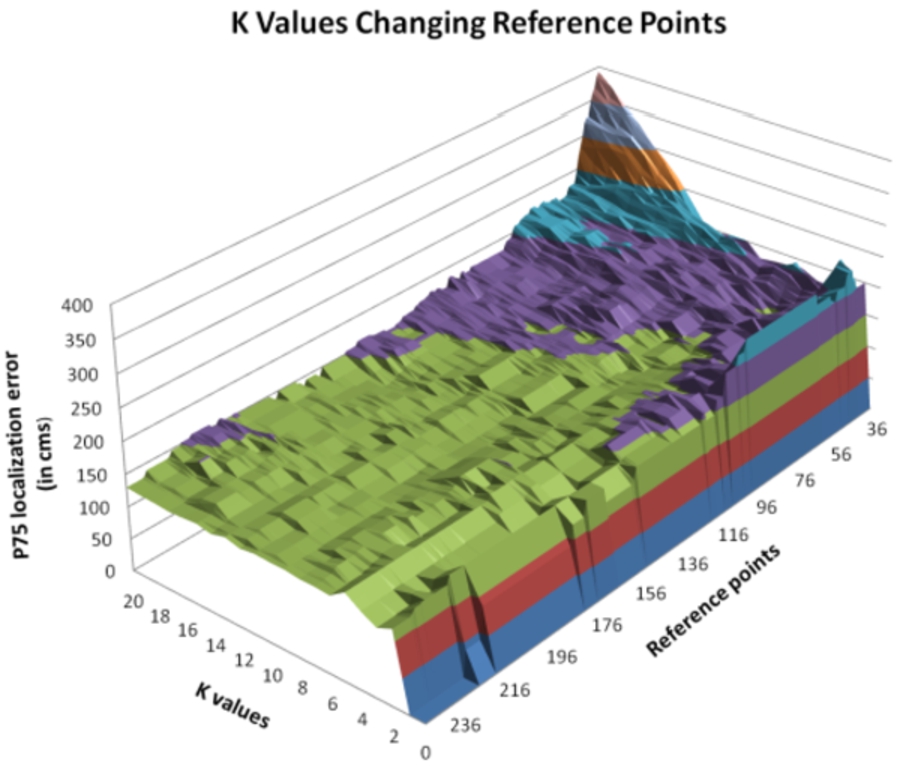
Location accuracy varying reference points and K values.
At last, it remains to define which combination of parameter values gives a good result for the test environment, minimizing the number of fixed and mobile nodes as well as reference points to take. Accuracy error not greater than one meter is deemed valid.
By analyzing the above tests, especially those parameters analyzed together, the chosen combination can be: {50 Reference Points, 9 fixed nodes, 5 Mobile nodes, Mean, Euclidean, Best Fingerprint; RT Algorithm, C parameter between 1.45 and 1.75}.
If it is desired to minimize the number of fixed nodes without increasing the error in the location, it is necessary to decrease the distance between reference points, that is, significantly increasing the number of points of reference databases. Another good combination taking into account those conditions might be: {120 Reference Points, 4 fixed nodes, 2 Mobile nodes, Mean, Euclidean, Best Fingerprint, RT algorithm, C parameter between 1.3 and 1.5}. In this case more hours of calibration are required.
This research has focused on indoor location systems based on fingerprint method. All processes carried out in the fingerprint method have been analyzed. There are many parameters of the localization process based on fingerprints that can be set and depending on them the behavior may be different, so setting them appropriately is a key issue. This has led to a comprehensive study of the trends and behaviors of the localization process by mean of varying these parameters. In addition to all the variants of the localization process studied in the state of the art, new variants thereof have been proposed. All of them have been studied by carrying out the same kind of analysis.
As there are many different possible combinations of parameter values, a tool, called PosSimulator, has been developed to study the fingerprint method behavior in indoor location. This modular and expandable tool is able to deal with a vast number of different cases produced by the use of multiple values for every parameter of the localization process.
A ZigBee network has been deployed in a test location in order to test PosSimulator. This environment is similar to that used in [16,21]. As shown in the paper, a wide battery of tests was performed in order to detect trends in location accuracy by modifying different parameters of the localization process. First was modified each parameter separately and then, those which could be related, were modified together. These tests have been developed based on a set of assumptions and issues, either from the findings of previous studies of the state of the art, or from our own concerns. Test results have already been presented in Section 4.5: two possible combinations are the best for the test environment, depending on whether the aim is to reduce cost by using a minimum number of fixed nodes and mobile nodes, or reduce calibration time, by taking fewer reference points.
PosSimulator is a useful tool that can be used to evaluate fingerprint based indoor location systems in AAL. PosSimulator only requires a set of fingerprint samples as input data. These samples can be actual samples taken in a real environment, as shown in this paper, or can be acquired through analytical or simulation methods.
By using PosSimulator and the samples of a particular site, obtained by empirical, simulation or analytical methods, different combinations of parameter values can be studied to determine, according to a certain criterion, which are the best.
The current version of PosSimulator uses only deterministic algorithms, but due to its modularity, it is possible to add new tracking algorithms, for example non-deterministic, which makes it a flexible tool.
Finally, it can be quickly developed an efficient indoor location system for a particular site by reusing part of the source code of PosSimulator and taking into account the results of the study made with PosSimulator in that particular site.