
Abstract
Smart environments require context information about their inhabitants in order to dynamically adapt their functionality. The location of persons or entities in an environment is an important piece of the context information. To this end, several types of indoor localization systems have been developed, with fingerprinting-based systems being the most common. Fingerprinting-based indoor localization systems tend to achieve higher accuracy compared to other approaches such as signal propagation modeling. However, they also tend to have a higher effort/cost for deployment and maintenance. Changes in the configuration of the indoor space like moving of furniture, or defective signal sources can cause the signal characteristic distribution in the environment to change significantly. This renders the fingerprint radio map (used for training the system) outdated, and causes a corresponding drop in localization performance over time. This paper proposes an approach for environment self-monitoring and autonomous recalibration using the system infrastructure, and demonstrates that it can reliably detect changes in signal distribution and recalibrate the radio map of the localization system. The proposed approach achieves localization performance of up to 93% of the optimum achievable through manual system recalibration.
Introduction
Ubiquitous computing envisions the achievement of distraction-free support for everyday tasks by means of context-aware applications. Context-aware applications are applications which adapt their functionality based on changes in the context of the user or the application. Context can be defined as all the information that can be used to describe the situation of an entity. In smart environments, the environment continuously adapts to achieve optimum conditions for the inhabitants in the environment. This includes examples such as adaptation of heating, ventilation and air conditioning (HVAC), or adaptive lighting controls, as well as any other connected devices which can be adapted for user convenience. In order for this adaptation to happen, the location of the user within the environment is necessary. This makes location information an important piece of context information for ambient intelligence in smart environments.
The past decade has seen a marked increase in the research and development of indoor localization systems, many of which rely on the characteristic signal strength of RF signals for location estimation. Localization typically involves measuring some signal characteristic in an environment, and then applying probabilistic or deterministic techniques to match the signal characteristics to a previously known pattern. The location of the pattern which best matches the user measurement is considered the location of the user. Several different radio frequency (RF) technologies have been used in developing localization systems [10,12] such as WLAN, RFID, GSM, Bluetooth and hybrid combinations thereof. WLAN signals are the most commonly used due to their pervasiveness (as they can be found in almost all buildings nowadays), ease of deployment, and mainstream support in widely available consumer electronics hardware. There are two main WLAN signal characteristic estimation techniques used in localization systems – signal propagation modeling or fingerprinting systems.
The signal propagation modeling approach seeks to computationally determine the characteristic signal strength of a particular signal at different areas in the building. This approach greatly reduces the effort for manual calibration during deployment of the localization system. However, the signal propagation models tend to be complex in order to accurately capture the dependence of signal path loss on the environment.
The fingerprinting approach relies on actual measurements of the signal characteristics of the WLAN signal sources at several positions in the environment. These measurements, together with the location where they were measured are saved as tuples to form a fingerprint. The resulting collection of fingerprints over the whole area forms a radio map, which is then used to train the localization algorithm. During localization, signal measurements from the environment are matched against fingerprints in the radio map using either deterministic of probabilistic techniques. The location of the closest matching fingerprint is determined to be the current location estimate. RADAR [1] is one of the earliest indoor localization systems which utilizes this approach for fingerprinting and it achieves 50th percentile error distance of 2.67 m. There have been refinements to the basic fingerprinting approach and pattern matching over the years which have improved its accuracy and reliability [1,31].
Unfortunately, the layouts of indoor areas are not always static. For example, a signal source may be moved or disappear over time, and furniture can be moved around as well. These changes in the environment layout can alter the characteristic RSSI of the different signals in the space and thereby render the radio map (which was created during deployment) outdated. This can lead to a drop in the accuracy of the localization system, as the radio map is no longer an accurate representation of the signal distribution in the environment. The more changes occur in the environment, the more the localization performance drops and eventually the localization system may become unusable.
This paper proposes an approach for autonomous recalibration of WLAN fingerprinting-based indoor localization systems. The main contributions are the use of off-the-shelf hardware and custom software to create a self-monitoring infrastructure as part of the localization system architecture. The system infrastructure senses and detects changes in the characteristic RSSI of the signal sources. The detected changes can then be applied to dynamically recalibrate the signal characteristics of affected areas in the radio map. Because the proposed system is software-based, it can be added to new and existing localization systems with relatively low effort/cost.
The rest of this paper is structured as follows. The next section discusses related work in indoor localization with respect to self-recalibrating and infrastructure-based localization systems. Thereafter is presented the proposed approach to autonomous recalibration of the localization system – spontaneous signal change detection and the recalibration algorithm. Finally, there is a conclusion with a summary and directions for future research.
Related work
There has been a lot of research on RF-based indoor localization systems in recent years [17], with a particular focus on the use of WLAN signals. One of the challenges facing the development of localization systems is the effort for initial calibration of the systems and maintenance of the localization performance characteristics over time. There are two major categories of WLAN-based localization systems, signal propagation modeling and fingerprinting systems, both which approach the challenge from different perspectives.
Signal propagation model based systems rely on computational determination of the path loss incurred by a signal as it travels through space. Such a model was proposed by [27] for path loss at 914 MHz, and this has been used a basis for determining path loss for WLAN signals which follow a log-normal distribution [5]. By determining the signal strength at different points in an area, it is possible to apply a range of lateration algorithms to estimate the location [19]. Signal propagation model-based systems have minimal effort for initial calibration. However, signal propagation is heavily influenced by factors such as building materials and layout, furniture, etc. Thus, it is difficult to accurately model the propagation of WLAN signals in indoor environments due to the dense multi-path effects, such as the reflection, diffraction and scattering of the signal [15]. This results in a high number of variables for an accurate model, or a limitation thereof, which reduces the complexity of the model and consequently, its performance.
An alternative to signal propagation modeling is fingerprinting-based localization, and several systems have been built based on WLAN [20]. One of the earliest systems built is RADAR [1] which collects the RSSI strength of WLAN signals scans and couples them with location information to form a fingerprint. A collection of these fingerprints over the indoor area forms the radio map. This radio map is used as a training set for the localization algorithm. During localization, signal scans are then matched against the radio map to obtain a location estimate. The system achieves accuracy of 2–3 m and was later further improved upon with a Viterbi-like algorithm [2]. Other systems have built upon similar principles as RADAR such as HORUS [31] which addresses the wireless channel variations and temporal fluctuations in the area.
While WLAN fingerprinting-based indoor localization systems tend to achieve higher accuracy than the signal propagation model counterparts [10], the cost of deployment of fingerprinting systems can be prohibitively high especially in large indoor areas. The effort for collecting the fingerprints can be a significant hurdle for the adoption of such systems. As a result, several research systems focus on reducing or completely eliminating the initial calibration effort. SEAMLOC [26] seeks to reduce the effort by combining an interpolation algorithm with measurements at fixed points to estimate location. A similar approach is used by PiLoc [21] and Calibree [29] to estimate absolute location of mobile devices. MapGENIE [25] and ARIADNE [13] use a minimal amount of fingerprints and some information about the building to generate a radio map for the area. Other systems such as [8,30] have sought to optimize the deployment of access points in the area in other to minimize calibration effort while increasing localization performance. In [9,18], the systems rely on sniffers which serve as anchors in the environment and the measurements from these sniffers are used to predict the signal characteristics of the environment and therefore compute location estimates.
Although there is much work done on reducing initial calibration effort, there is relatively little focusing on system recalibration. In [22], the authors propose an approach for spontaneous recalibration of an FM-based localization system. They propose to lessen the resulting signal degradation through a combination of signal pre-processing and applying the measurements of the user mobile devices at known locations in the environment. In order to facilitate this, several positions with fixed locations are defined throughout the environment. These positions are referred to as “anchors”, and typically involve a deliberate user action. When situated at these anchors and triggered by user action, the measurements made by the user mobile device can be used to recalibrate the system. KARMA [28] uses fingerprints which are collected by the mobile devices to model changes in the environment, and then improve the location estimate during the online localization phase. It thus relies on the continuous measurements obtained during use of the system. A similar approach is used in [14], whereby measuring devices are placed at several reference points and measurements made continuously. The measurements collected are then used in the online localization phase to adjust the location estimate for temporal variations in the signal characteristics. The work focuses on temporal changes in the system and depends on the relationship between the reference points and the mobile devices. The approach proposed in this paper however, uses the access points both as signal sources and receivers to monitor other access points and detect significant changes in the signal distribution in an environment. It therefore does not depend on the presence of users actively using the system, and can autonomously adapt to both temporal and permanent changes in the signal characteristics over time.
Approach
This section describes the system architecture and approach to recalibration of the signal characteristics. The basis for this work is a fingerprinting-based localization system which is fully calibrated as is done in most WLAN-based fingerprinting systems. It relies on access points running custom software which are deployed in the indoor localization area. The access points simultaneously serve as signal sources and sniffers for measuring the RSSI of the signals in the environment. The readings from the access point sniffers are saved for different time frames and compared with each other in order to determine which access points’ signal strength characteristics have significantly changed between the two time frames. The observed changes are then applied to the radio map from the initial calibration in order to create a new radio map which is a better representation of the signal distribution in the environment. This should improve the localization accuracy of the system. In the following sections, the environmental infrastructure and system architecture, signal change detection and recalibration algorithm for continuous autonomous adaptation of the localization system are presented in more detail.
System setup
The system infrastructure uses off-the-shelf hardware for the access points. In particular, it uses TP-LINK M3020 access points which are small, easily deployable and inexpensive. The OpenWRT [4] firmware is installed on the access points and used to configure two virtual wireless network interfaces which are simulated by the real wireless network interface. One of the virtual wireless network interfaces serves as a beacon and actively transmits regular IEEE 802.11 beacon frames which can be measured by any compatible device. This interface can also serve to provide normal network access for mobile devices in an indoor area. The other virtual wireless interface is passive and acts as a sniffer, using a network packet capture library [23] in order to capture beacon frames from the other access points in the environment. These sniffer measurements from all the deployed access points provide an overview of the state of the signal characteristics in the environment. To be able to access these measurements on a continuous basis, one access point is configured to serve as a passive sink for receiving data. All the other access points are configured to send their measurements to the sink. In order to avoid running cables through a large indoor area, the Optimized Link State Routing (OLSR) [3] protocol is installed and configured on all the access points. This forms a mesh network between the access points, and allows them to transmit their measurements to the sink using the wireless interface by routing through the neighboring access points. Therefore information can flow from one access point to reach any other access point via the resulting wireless mesh network. The sink access point is connected via Ethernet to a server which aggregates the measurements and runs evaluations of the system state on a continuous basis. Figure 1 shows an overview of the system architecture.
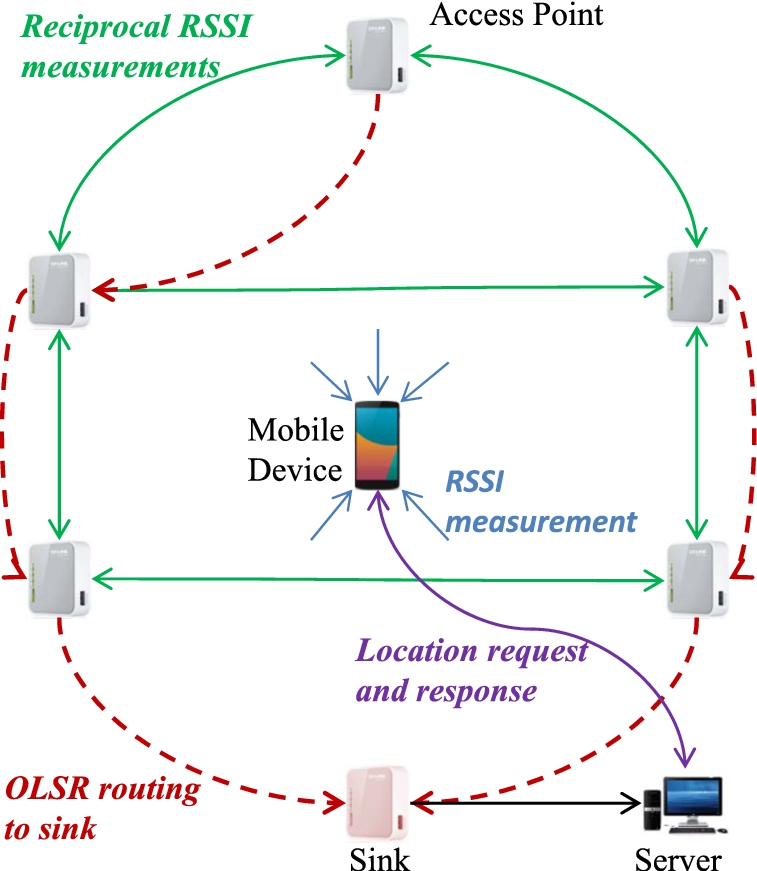
Overview of system deployment setup.
The access points are deployed for optimum coverage of the indoor area while maximizing the differentiation of the RSSI signals at different physical locations [24] for better localization accuracy. After deployment, the system is calibrated by collecting fingerprints of the area using the method described in [7]. The fingerprints are collected by moving along different paths defined in the building and having multiple devices continuously scan the area for WLAN signals. The person performing the calibration (trainer) carries multiple devices in both front and back pockets. The devices thereby face different orientations so as to compensate for the signal attenuation caused by the human body during fingerprinting [6]. Several measurements are collected per device along the path walked by the trainer and later aggregated. The measurements are interpolated along the path walked by the trainer to create fingerprints which comprise the signal characteristics and the geographic coordinates of the location. The group of all fingerprints forms the characteristic signal distribution map of the environment. This radio map is uploaded to the central server and used for training the localization algorithm. The algorithm used for location estimation is based on RADAR [1], with some additional aggregation for stabilization of temporal effects similar to HORUS [31]. Given a measurement, the algorithm computes the location probabilities for all fingerprints in the training radio map and then ranks them from highest to lowest. A dynamic deterministic nearest neighbor averaging of the fingerprint matches (with the highest probabilities) is then used to compute a location estimate for the measurement. The number of nearest neighbors is set to a minimum value, k, which expands to include any matching fingerprints with identical probability match as the k-th one.
Indoor environments are not static and over time, positioning of furniture or other objects in the environment can change, or access points could malfunction. The deployed access points in the setup each continuously monitor the signal characteristics of the environment and transmit this information to the central server via a sink, as previously described. By examining the aggregated measurements from all access points on the server, it is possible to have an overview of the stability of the system infrastructure for any given time duration. If a significant change occurs in the characteristic RSSI of a particular access point, it will be observed by the other access points in the immediate vicinity. The mesh of co-measurements formed by the access points enables any significant change in one to be immediately measured in multiple links in the network as illustrated in Fig. 2. Having multiple observations reinforces confidence in the observed change. By continuously evaluating these links, it is possible to reliably detect dynamic RSSI changes in the environment. Although WLAN signals are subject to temporal fluctuations [31], it is necessary to determine the access points whose signal characteristics have changed significantly beyond the threshold of temporal fluctuation. This is because the measurements from those changed access points can no longer be trusted to be an accurate representation of the signal characteristics of the environment.
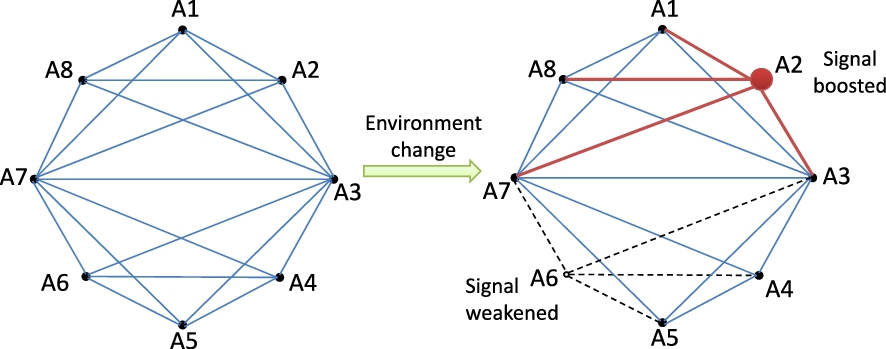
Link quality change detection in mesh network.
In order to detect signal distribution changes, consider a time duration for which it is required to determine if there is a change in the environment. The time duration can be chosen depending on the environment and localization requirements. For example, an airport hangar may use a specific duration to adapt to changes in the signal distribution which might occur, depending on the presence or absence of a plane in the hangar. The duration will depend on how long an airplane is usually present in the hangar for maintenance before it is removed. Similarly, a train station might use an hourly duration in order to account for peak times in the mornings and evenings when there are large numbers of workers commuting.
Given one router
Having determined the access points whose signal distribution has changed significantly, the system can now be recalibrated accordingly. The input for the recalibration comprises the list of all observed RSSI changes (by each access point) between the two time frames. The recalibration is performed by applying a function of the observed RSSI deltas to the fingerprints in the radio map from the initial calibration. But first, it is necessary to quantitatively describe the function that correlates the infrastructure RSSI measurements to the mobile device measurements in the radio map.
RSSI correlation
An experiment is designed and executed to determine the relationship between the access point RSSI measurements and the mobile device RSSI measurements. The mobile device used is an LG Nexus 4 running Android 4.4. The access points are configured to function both as beacons and sniffers, so they can measure RSSI signals in the environment. Nine of the access points are placed 2 m apart from each other in a straight line in a hallway 4 m wide by 28 m long. RSSI measurements are collected using four of the aforementioned mobile devices throughout the length of the corridor at the same locations as the access points. The access points are themselves measuring the RSSI signals in the environment.
After the data collection, an examination is performed of the correlation between measurements by the different access points and those collected on the mobile devices for the same positions along the corridor. The measurements of an access point, for example,
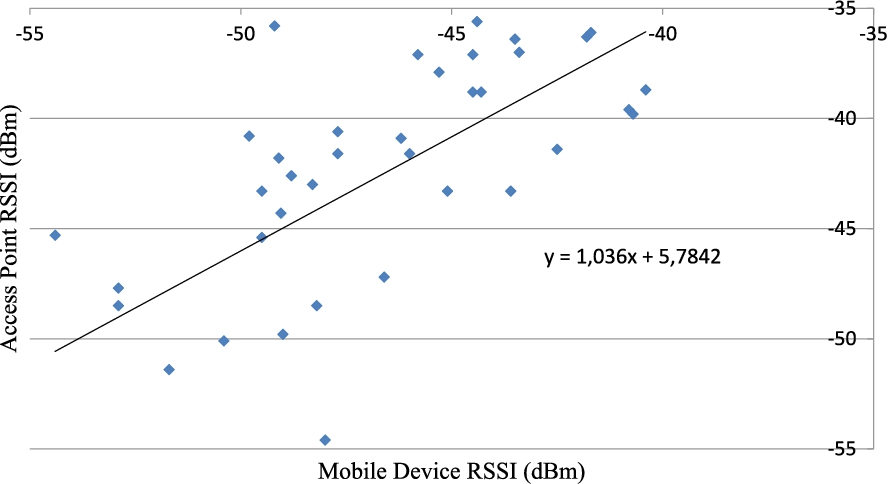
Correlation of access point and mobile device RSSI measurements.
The system recalibration algorithm makes use of the average RSSI delta of the significantly changed access point as observed by each and every other access point in the vicinity. For each access point which observes a change, the observed change (RSSI delta) is applied to all the fingerprints in the radio map which are closest to this access point. The reason being that the fingerprints closest to the access point are most likely to have experienced a similar change as the access point. Therefore, the fingerprints in the environment need to be partitioned by grouping them according to the access points to which they are closest. A Voronoi tessellation, which is a partitioning of space according to proximity of points to a node, is suitable for making approximating the effect of the signal distortion on the fingerprints. A Voronoi tessellation of the indoor area is created, with the access points serving as the nodes excluding those access points which have changed significantly. The location coordinates for the access points are dynamically computed from initial calibration radio map using the method described in [11]. The radio map from the initial calibration is thereby grouped into buckets of fingerprints which are closest to a particular access point, each forming a partition as illustrated in Fig. 4. During the Voronoi partitioning, any access points whose signal distribution has been determined to have changed significantly are excluded. These changed access points possess potentially skewed observations of all other access points. The observations of the modified access point would therefore not be representative of the signal distribution in the environment.
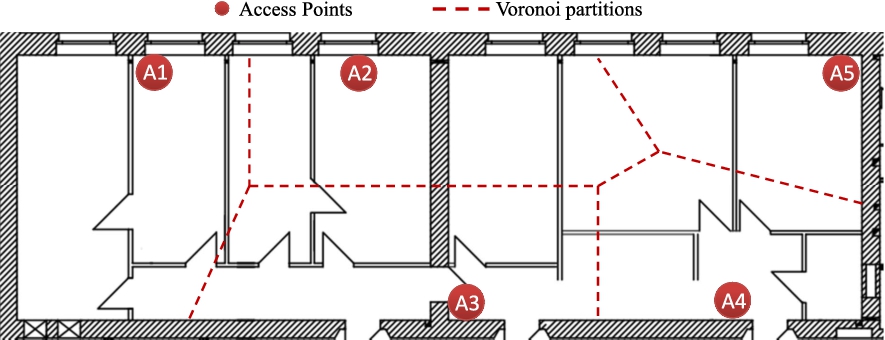
Building floorplan with access point layout and Voronoi partitions.
As an example of the recalibration process, consider the case of recalibrating the signals of access point
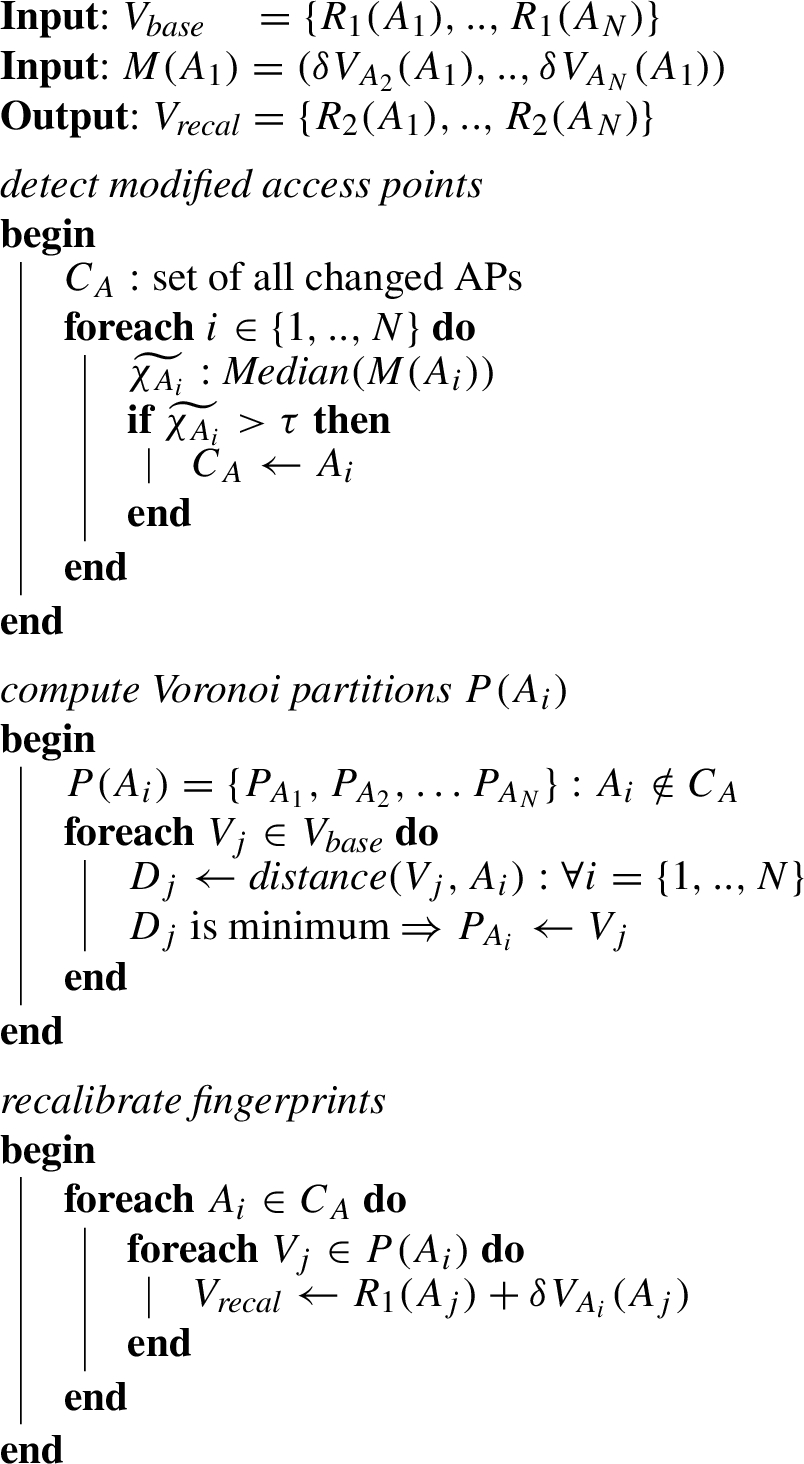
System recalibration algorithm
The recalibration process can be repeated on demand, or on a continuous rolling basis with a fixed period in order to maintain the freshness of the radio map. The latter configuration is especially useful in indoor areas whose configuration is constantly changing, such as shopping malls which may have peak periods during the day and other periods of relatively low activity. In the next section, an experimental evaluation of the proposed autonomous recalibration approach is presented.
In this section, the proposed recalibration approach is evaluated with respect to the quality of the recalibrated signals, and with regards to the modified characteristic signal distribution of the environment. Furthermore, the localization performance gains from autonomous recalibration vs manual recalibration (or no recalibration) are evaluated.
Setup
The experimental evaluation is done in an office area which is 11.5 m × 28 m in dimensions. The localization system is set up as described previously in Section 3.1. The deployment consists of 5 access points as depicted in Fig. 4. Two sets of approximately 2400 fingerprints each are collected in the whole area to form the radio maps for the evaluation of the base system performance. The access point
B – Base configuration
D3 –
D3_D4 –
D3_D4_D5 –
Furthermore, a recalibration of the signals for each of the dampened configurations is performed. The base configuration fingerprints and the signal observations from the different access points are used as input to the recalibration algorithm. The recalibration is performed offline for evaluation purposes, and classified into the following evaluation configurations:
R3 – Recalibrated after D3 R3_R4 – Recalibrated after D3_D4 R3_R4_R5 – Recalibrated after D3_D4_D5
In the next sections, the results of the signal characteristics and localization performance evaluation of the system are analyzed in detail.
Signal characteristics
In order to evaluate the effect of the recalibration on the characteristic RSSI of the signals, a comparison of the signal differences between the different configurations enumerated in evaluation setup is performed. First, a grid is overlaid on the floor plan with 2 m × 2 m cells. Then all the WLAN measurements within each cell are aggregated to form one characteristic fingerprint reading for the radio maps of each of the configurations. Next, the differences for each cell between the different configurations are computed. As a starting reference, the measurements between two sets of base, B(1) and B(2) are compared. Furthermore, the RSSI deltas between the B(1) and the D3(1) configuration, as well as the R3 and the D3(1) configuration are also compared. Figure 5 shows a visualization of the RSSI differences per cell between the different radio maps overlaid on the floor plan for access point
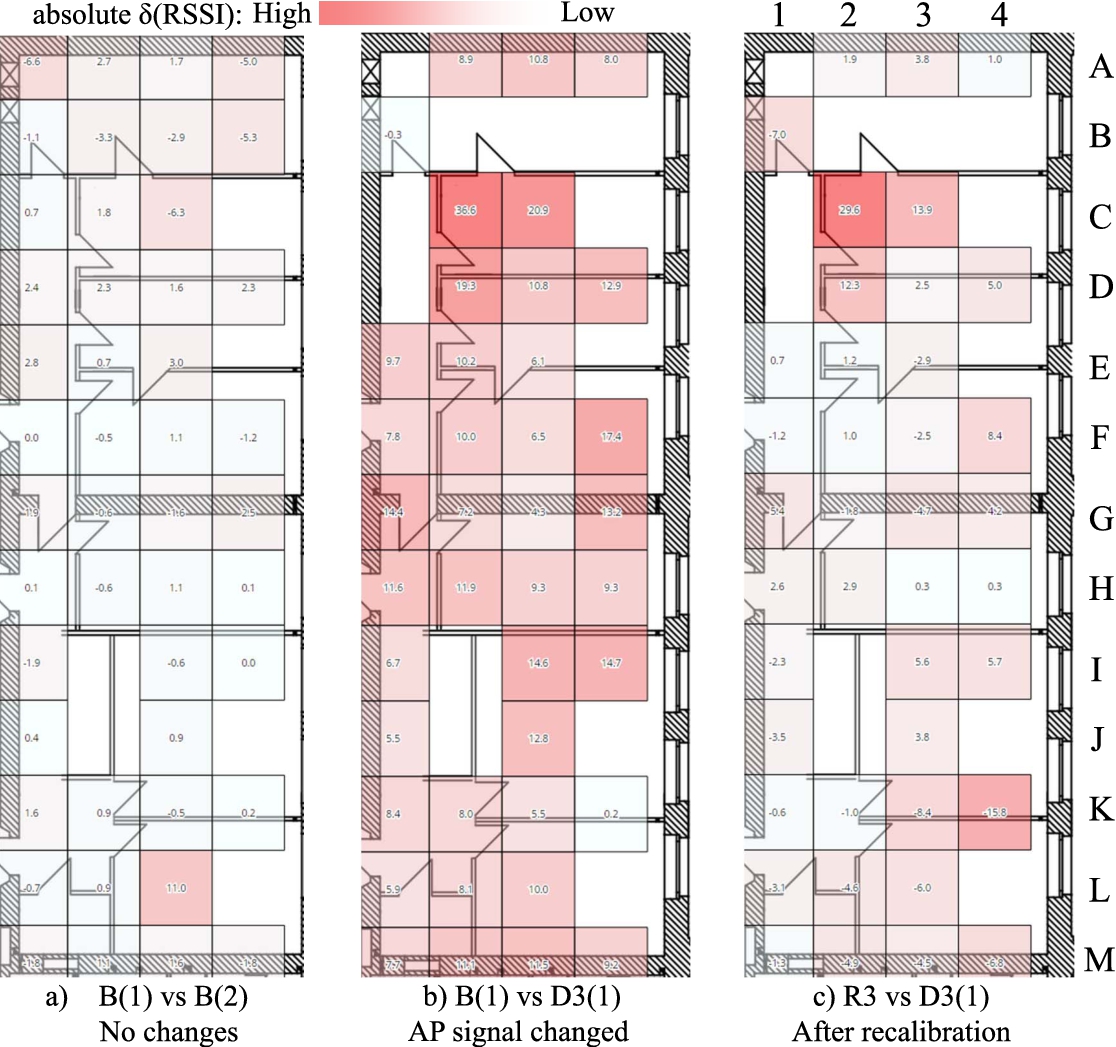
Signal differences for AP3 in different configurations.
It can be observed that for the access point
The above experiment is repeated for all the signal radio map configurations in the evaluation setup and similar results for the other access points
Average RSSI delta for the different configurations
where δ is the RSSI difference between the configurations (in dBm)
All three configurations demonstrate a strong positive correlation between the base-vs-dampened RSSI deltas and the recalibrated-vs-dampened RSSI deltas as shown in Table 1. This implies that the base and recalibrated radio maps exhibit similar properties with respect to the dampened radio map and are comparable in terms of RSSI characteristics. It is therefore possible to conclude that the recalibration process successfully captures the characteristic RSSI changes in the environment and applies these changes to the radio map. Thus, by applying the recalibration as described above, it is possible generate fingerprints that are more representative for the signal propagation in the environment, which should improve the accuracy of any fingerprinting-based localization algorithm. In the following section, this effect is quantitatively evaluated for one localization deployment using one particular algorithm that provides a high accuracy for the base configuration in this environment.
The localization performance evaluation is performed offline using the fingerprint radio maps which were created for the different evaluation configurations. The localization algorithm is a derivative of the algorithm used by the RADAR system [1] with some additional aggregation for stabilization of temporal RSSI flucturations, similar to that performed by the localization algorithm in the HORUS [31] indoor localization system. A dynamic k-Nearest Neighbors location estimation method is used with a deterministic k minimum value of 4, determined empirically to achieve the best performance for the base deployment radio maps. The actual value of k used for each localization iteration expands to include any matching fingerprints with identical probability as the kth one. In order to get a reference localization accuracy for the evaluation, the accuracy of the localization system is computed using the base configuration radio maps B(1) and B(2) for training and evaluation respectively. The average error distance thus obtained is 2.7 m, with over 90% of the location matches within 4.4 m. This serves as a baseline for comparing the degradation or improvement in performance of the subsequently different environment configurations. In addition, the localization performance in the environment is evaluated after the signal distribution has changed but with no changes to the training radio map from the initial calibration. This serves to indicate the effect on localization performance when the signal distribution changes, but no recalibration is done.
In order to evaluate the effect that the proposed recalibration algorithm has on localization performance, the recalibrated radio map is used for training the localization system and then its performance in the dampened environment is analyzed. The signal measurements gotten from the environment after the dampening of the signal are matched against the recalibrated radio map of the environment. The localization error distribution and average error distance are computed from all the localization samples to assess the quality of the recalibrated radio map in comparison to the baseline radio map. Given that changes in the signal distribution can also affect the best possible accuracy achievable by the localization system, the localization performance using the two manually calibrated radio maps of the system in the dampened state is also compared. A summary of the different evaluation configurations used are illustrated in Fig. 6.
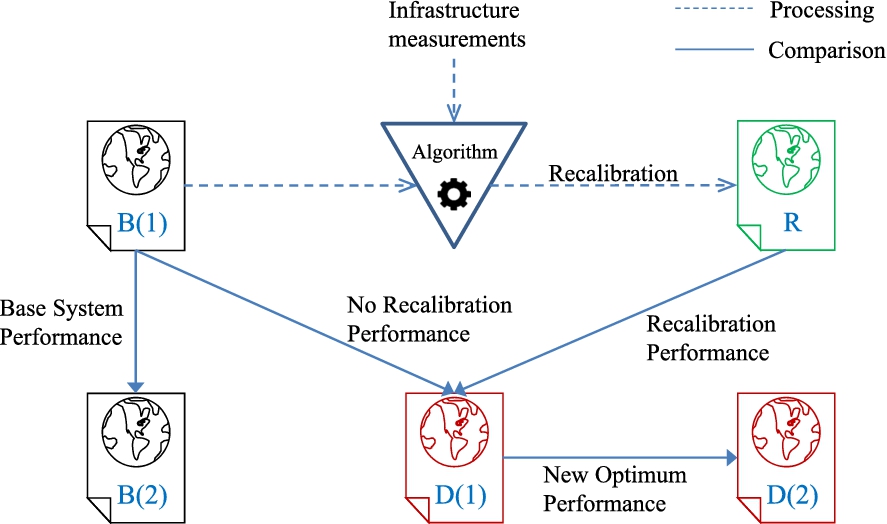
Configurations for Localization Performance Evaluation.
First, an evaluation with just one access point,
Localization Error Distribution With All Fingerprints.
Considering the localization performance over the whole indoor environment when only
After recalibration, the average error distance is reduced to 3.4 m, which represents a 15% improvement over the dampened case. The automatic recalibration radio map is thus within 90.4% of the optimum performance with an average distance error of 3.1 m. A similar effect is observed when 3 access points are dampened as shown in Fig. 7(c). The drop in average error distance is even larger at 4.3 m, representing a 59.3% drop compared to the base localization performance. A recalibration of the system reduces the average error distance from 4.3 m to 3.5 m. Table 2 summarizes of the localization average error distance for all three scenarios.
Localization average error distance (m) – all fingerprints
Localization Error Distribution With Affected Fingerprints.
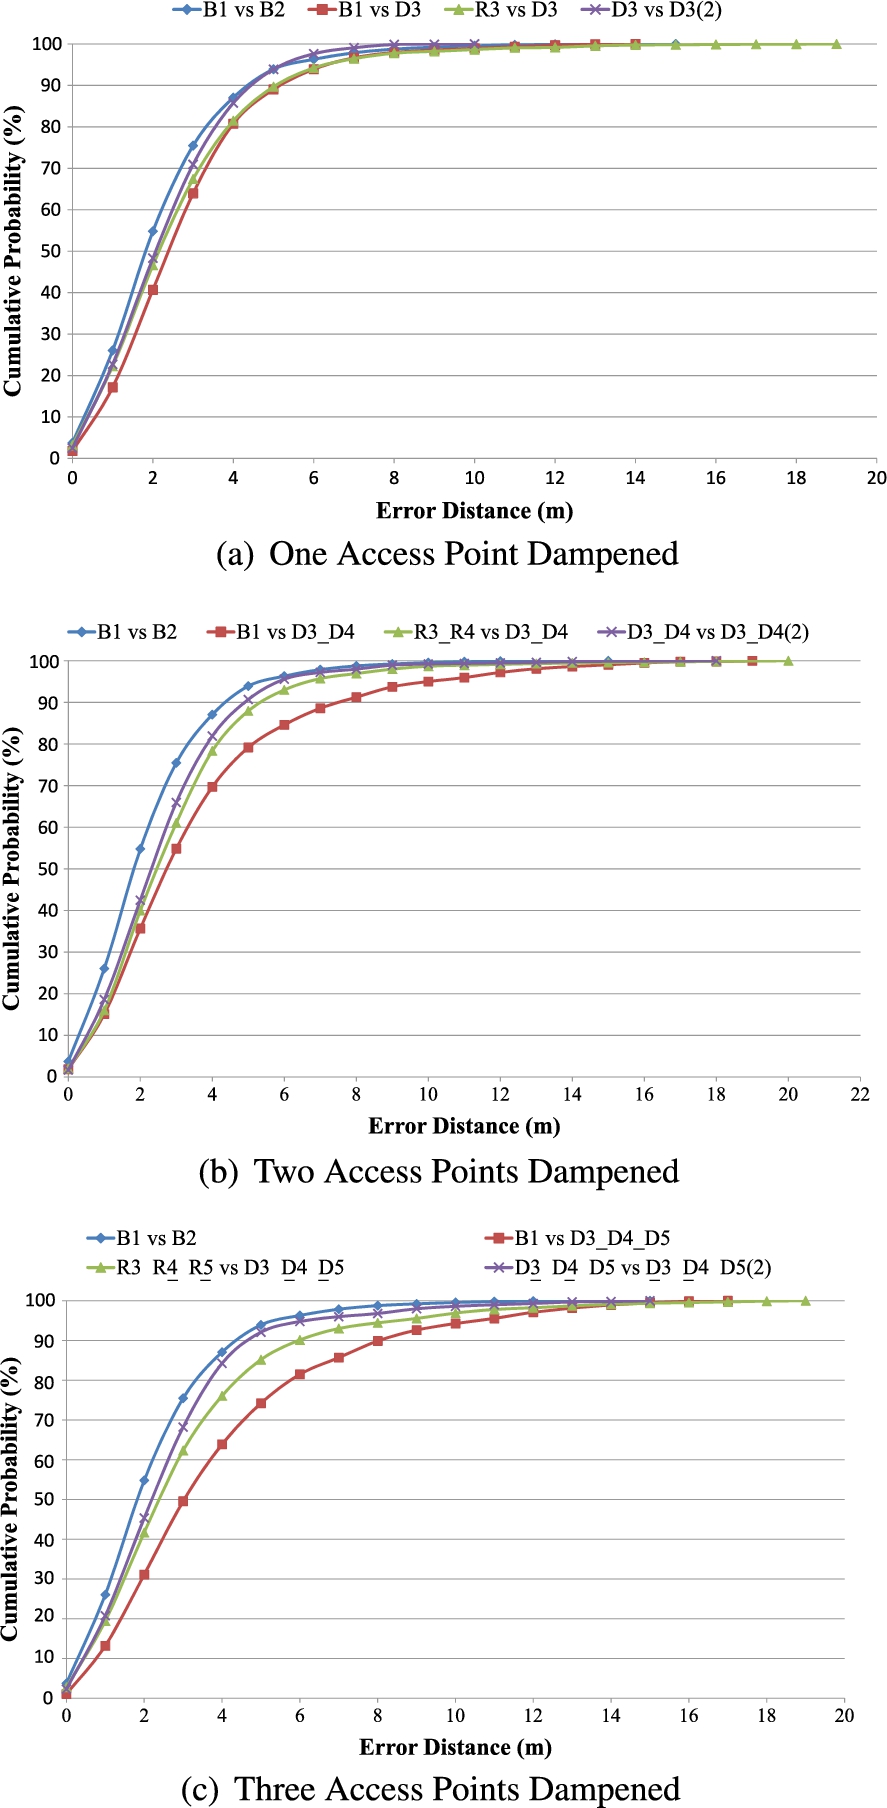
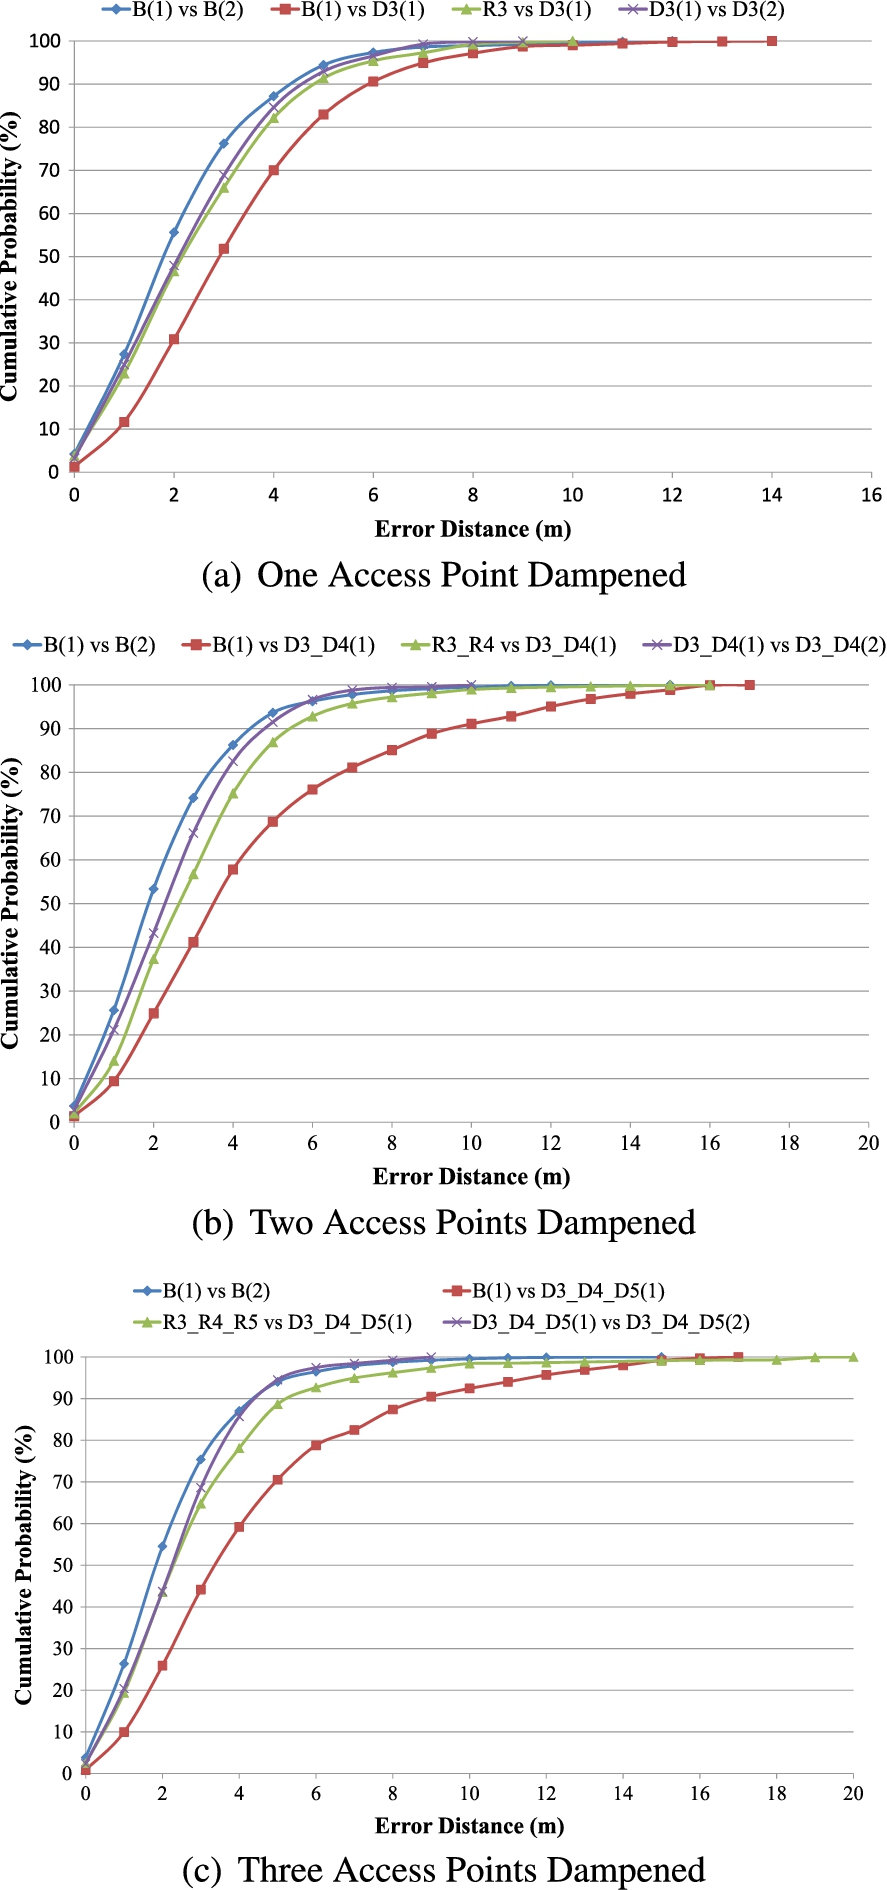
In aggregate, it can be observed that the recalibration of the indoor environment yields improvements in the localization performance of the system. The error distribution is restored to levels which are comparable to the optimum achievable through manual recalibration of the environment. However, from the results it is possible to deduce that the other signals in the environment compensate for the changed one during localization. The larger the indoor localization area, the more localized the impact of dampening an access point. The resulting effect of dampening is masked when considering localization performance over the whole indoor area. Therefore, it is necessary to also consider the localization evaluation in the dampened configurations, with only those fingerprints that contain at least one signal from the affected access point in order to systematically evaluate the actual impact of dampening on the system performance in the local area where the access point is visible. Figure 8 shows the cumulative distribution functions of the localization error when only the fingerprints containing dampened signals are used in the evaluation. The probability distributions cover different configurations for one, two and three successive access point dampenings.
It can be observed in Fig. 8(a) that the localization performance of the system drops to an average location error of 3.7 m when access point
To further explore the effect of the dampening and recalibration on localization system performance when only affected signals are considered, consider the scenario with two dampened access points. The two access points dampened represent the configuration D3_D4 where the access points
The experiment is repeated for the third configuration D3_D4_D5 and a similar pattern to the previous two discussed cases is observed, as illustrated in Fig. 8(c). Here, the proposed recalibration approach achieves an average localization accuracy of up to 86.3% of the optimum achievable localization performance in the dampened state. The average error distance of the approach shows a difference of only 0.4 m to the case of a manual recalibration of the system (optimum performance). Table 3 summarizes the localization average error performance results obtained for the different configuration combinations taking into account only fingerprints containing signals that have changed.
Localization average error distance (m) – affected fingerprints only
It is noted that the localization performance for the recalibrated radio map does not quite get back as high the performance of the manually recalibrated radio map. This can be attributed to the fact that the signal propagation path loss (with the accompanying multipath effects) cannot be fully replicated by the recalibration using a constant delta within the different Voronoi partitions. However, the gains from the application of the recalibration are close to the optimum performance achievable through manual configuration. This means that the recalibration algorithm is able to capture and compensate the most significant impacts on the signal propagation and is therefore worthwhile to apply regularly to a system deployment.
Furthermore, given that the recalibration procedure uses a majority voting to determine which access points have changed, the algorithm becomes inapplicable when greater than half of the access points in the deployment experience a sudden change in the signal characteristics. In many practical cases, this scenario can be avoided by simply increasing the frequency of recalibration of the system which will ensure that any changes to a particular access point are promptly detected and fixed. In other words, the proposed recalibration approach is applicable in areas where there is constant but periodic change in the environment which seriously affects the localization signal. The localization system can be configured to recalibrate the training radio map to match the environmental signal characteristics and thereby significantly limit the decay of the localization performance. In cases where the majority of the access points’ signal characteristics do not all change at the same time, the system would easily quickly detect those that change and recalibrate them.
It is observed that the average error distance is lower when fingerprints from the whole indoor area are considered than when only fingerprints containing signals from the dampened access points are considered. This is due to the fact that when looking at all fingerprints, the average localization accuracy directly depends on the ratio between the number of affected and unaffected fingerprints. For configurations where only one access point is affected, only measurements in its vicinity (i.e. surrounding the dampened access point) can lead to increased the localization errors. Consequently, when looking at the localization accuracy of the whole area, the impact seems somewhat limited. However, this hides the fact that in the affected area there is a significant performance degradation. By dampening more access points, the affected area (and thus, the fraction of affected fingerprints) increases and as a result, the performance degradation becomes much more noticeable across the whole area.
This paper has presented an approach to autonomous recalibration of a fingerprint-based indoor localization system. The approach is software-based using off-the-shelf hardware components, making it cost-effective to deploy and relatively easy to retrofit to existing system deployments. The results of the experimental evaluation indicate the following:
The approach detects and properly handles the changes in signal characteristics. The resulting recalibrated radio map is more representative of the actual signal characteristics which should lead to performance improvements for any fingerprint-based localization algorithm.
When quantifying the impact with a particular algorithm that performs well in one deployment (average error 2.7 m with 93.9% of matches within 5 m), the recalibrated radio map is able to achieve a localization performance of up to 93% of the optimum (achievable through manual recalibration).
Not handling changes such as the movement of furniture can have a significant negative impact on system performance. The presented approach can significantly lessen this impact in a fully automated fashion.
In the future, the plan is to extend this work to detect and handle other types of changes which can occur in the environment. Specifically, it is helpful to investigate how to detect and handle the movement of access points from one location to another. If such changes can occur in a deployment, the infrastructure measurements must be augmented with measurements of mobile devices using the system in order to reliably categorize the change and perform a suitable recalibration.
Footnotes
Acknowledgement
This work is supported in part by the European Center for Ubiquitous Technologies and Smart Cities (UBICITEC e.V.).