






Abstract
This work concerns the development of low-cost ambient systems for helping elderly to stay at home. Depth cameras allow a real-time analysis of the displacement of the person. We show that it is possible to recognize the activity of the person and to measure gait parameters from the analysis of simple features extracted from depth images. Activity recognition is based on Hidden Markov Models and performs fall detection. When a person is walking, the analysis of the trajectory of her centre of mass allows to measure gait parameters that can then be used for frailty evaluation. We show that the proposed models are robust enough for activity classification, and that gait parameters measurement is accurate. We believe that such a system could be installed in the home of the elderly, while respecting privacy, since it relies on a local processing of depth images. Our system would be able to provide daily information on the person’s activity, the evolution of her gait parameters, and her habits, information that is useful for securing her and evaluating her frailty.
Keywords
Introduction
The increasing trend in the number of elderly people is a major public health challenge. Home support is an important preoccupation for the elderly and their families. However the home is not a place without risk for the people, which may even be responsible for their loss of independence. One of the causes of autonomy loss at home is fall. The physical consequences of falls, such as fractures, can lead to the placement of the person in an institution. Psychological problems are also very common after a fall and may cause the reduction of the activities for fear of relapse. These damages can lead to a loss of autonomy and compromise the capability to stay at home. It is necessary to secure the home so as to be able to live independently as long as possible, for instance by detecting falls to quickly alert emergency services, and reduce the risk of physical or psychological damages. We believe that it is also necessary to prevent falls and the risk of frailty by analyzing, in the ecological environment, the gait parameters of a person regularly enough to detect a possible dangerous evolution over time.
The proposed system uses a RGB-D camera, which was chosen for the advantage of depth reconstruction, its low cost, and its independence to visible lighting. We imagine to fix the system at a high position on a corner at home. Several stages are necessary to achieve our goal. The system must be able to detect the person in the field of view, to detect her activity and finally to analyze her gait. Our method consists in extracting some features representing the person from the trajectory of her centre of mass and the vertical distribution of her silhouette. These features are locally calculated from the depth image, to preserve the anonymity of the person.
This paper is structured as follows. First, we present existing systems that allow to measure the degree of frailty and to detect falls at home. Next, we present the algorithm we developed to detect and track the person from the information obtained with the depth camera. Then, we present the features that we have selected and the algorithm for extracting them. Section 5 describes our algorithm for activity detection, based on the formalism of Hidden Markov Models (HMMs). Our algorithms for gait parameters extraction and activity detection are then independently evaluated in Section 6. Finally, we present the combination of the two contributions in a single system for securing and assessing the frailty of a person at home. We also develop a method to map the habits of the person, i.e. to learn the most common habits in different areas of the home. This will be used to detect the evolution of the habits of the person in the aim of being able to detect abnormalities.
Approaches to frailty measurement and fall detection
In this section, we identify the existing approaches to analyze frailty and to detect falls. Since these two issues are usually addressed separately, we present the state of the art in two parts.
Analysis of the frailty
The frailty of people is usually evaluated by medical professionals analysis, via motor skill analysis. Analysis of the gait is performed through a large sample of clinical tests (e.g. Up and Go test, Tinetti test). The analysis of the frailty in the home is also an active research topic, requiring measurement tools to quantify the gait. Gait analysis can be performed using wearable sensors such as force sensors, accelerometers, gyroscopes, goniometers, electromyography, etc. Reviews, such as Tao et al. [29], Razak et al. [1] listed the different types of wearable sensors. For example, some authors ([5,18]) used a wearable footwear-based sensor system to provide measurements of longitudinal displacements. Accelerometers and gyroscopes can be placed on the person’s leg to analyze the acceleration of the body and the angle of the different segments of the leg as Takeda et al. [28] did. Electromyography (EMG) is a system that records the electrical activity of muscles by placing electrodes on them. Wentink et al. [31] used this sensor to predict the gait initiation. In their review, Muro-de-la-Herran et al. [21] presented other type of sensors, which have the advantages of not being wearable sensors. In this category, we find floor sensors such as force platforms, treadmills, and actimetric carpets that allow to record the plantar pressure of the feet, in addition to some spatio-temporal parameters. Leusmann et al. [17] developed a floor sensor to analyse the gait patterns. This system can be integrated in home environments. Hagler et al. [13] installed several passive infrared motion detectors on the ceiling. Their goal was to observe possible decline through the walking speed and to continue analysis outside the doctor’s office. Systems based on image processing can also be used to analyse gait. Stone et al. [26] installed a camera in the homes of elderly persons to analyze their gaits during several months.
Systems to detect falls at home
Fall detection systems at home constitute a growing market. Different systems exist already. Some of the systems require the participation of the person to avoid false alarms. Alert buttons on a necklace or a bracelet, allow the person to call for help after falling. Other systems integrate accelerometers in devices such as watches or bracelets to automatically detect the fall. In research, the automatic detection of falls is addressed. For example, Bourke et al. [6] and Wu [32] use the speed provided by accelerometers to distinguish between falls and others activities. Sensors in the floor can detect falls allowing elderly people not to feel constantly monitored. Rimminen et al. [23] chose floor sensors to track a person (with a Kalman Filter) and to build an algorithm based on Markov chains to detect falls. Finally, image processing may be used to detect the falls. The aim is to develop algorithms to analyze the activities more accurately without committing errors and to detect all the falls ([2,4,16,25]). Igual et al. [15] and Mubashir et al. [20] presented reviews about fall detection systems.
Conclusion
Each described system has more or less of advantages and disadvantages compared to what we want to develop. Systems that are only adapted to a medical office do not correspond to our objectives. We propose an easily transportable system that can be installed in existing houses. The method do not use wearable sensors so as not to interfere with the person’s daily life. We propose a low cost ambient sensor that respects privacy. Our system is based on a RGB-D camera with a fully automatic local processing. We do not need to follow very precisely the body parts, an overall analysis of the person is sufficient. Thus, the use of the skeleton is not necessary. We can reduce the features to a set of descriptors of the vertical distribution of the body. The major interest of working with a simple representation is that it will be less subject to variations and therefore more robust to different situations. Finally, the proposed method addresses fall detection and frailty monitoring.
Detection and tracking of the person with a depth camera
In this section, we present the different processing steps, from human detection, with the extraction of mobile pixels, to the tracking of a person. The depth camera simplifies the vision process. Microsoft’s Kinect sensor, in addition to providing color information, indicates how far each pixel of the scene is from the camera. Conventional cameras have the disadvantage of being dependent on changes in brightness. We chose to follow the person from her centre of mass and the vertical distribution of her silhouette. From these two features, we can deduce other characteristics as the vertical velocity and horizontal velocity of the centre of mass and the highest point corresponding to the top of the head when the person is standing.
Detection of the person
Here, we present the method for detecting the person from the depth image provided by the camera. Some steps have already been presented in article [10], so we do not describe them here. In a depth image, each pixel represents a point in a 3D space given in the camera coordinate system. The points of the image plane can be projected to this coordinate system using the optical parameters of the camera. The first step consists in learning the background by averaging over time the distances for each point of the depth map. The next step is to extract the ground for changing the coordinate system so as to make the calculations independent of the camera position. The 3D coordinates of the points are initially calculated in the camera coordinate system whose origin is the optical centre. To be able to measure the displacement of the person on the ground and the height of the extracted points, we work in a coordinate system aligned with the ground. The method consists in redressing the camera with the tilt angle measured by the camera accelerometer. Then we select an arbitrary number of the lowest point in the scene that are assumed to belong to the ground. Finally, the least squares method allows us to retrieve the equation of the plane passing through these lowest points and which will constitute the ground. The coordinate system transformation matrix is derived from the ground equation. The ground coordinate system is calculated immediately after initialization of the background, without requiring the use of a specific calibration. Then, we seek to identify the mobile points of the image, i.e. the points occupied by the person. For this, the background is subtracted from the current image so as to keep only the points having a shorter distance in the current image than in the background image. To eliminate the noise, i.e. the points detected as mobile but not being, an Erosion-Dilation filter is used. The labeling of connected components is used to group mobile points belonging to the same object, to distinguish several objects in the same scene. We assume that among the mobile objects are the person, and objects that have been moved (as a chair, a door). The group corresponding to the person is the group with the largest number of mobile points.
Tracking of the person
The tracking of the body movements in space is complex, because each body part can be analyzed. According Saunders et al. [24], the analysis of the body in motion can be reduced to a simple analysis of the centre of mass in motion. Specifically, the horizontal and vertical movements of the body, when a person is walking, can be analyzed by looking at the movements of the centre of mass. To represent the body of the person and follow it over time, we chose to associate the analysis of the vertical distribution of the silhouette with the centre of mass trajectory. We reduced the features to a set of descriptive elements of the vertical distribution of the body. A major advantage of working with a simple representation is that it is less prone to variations and therefore robust to diverse situations. At the beginning of this stage, the person to track is detected. The person extracted with the algorithm is composed of a set of 3D points. The centre of mass is calculated as the geometric centre of the silhouette, it is the average location of all the mobile pixels, as described in previous article [11]. Only the vertical trajectory is used in the following treatments because she forms a sinusoidal curve. In addition to the position of the geometrical centre, we use its horizontal and vertical speed.
To complete the person representation, we add two features representative of the vertical distribution that are the standard deviation and maximum vertical coordinate of mobile points. The standard deviation and the maximum coordinate of mobile 3D points corresponding to the person are calculated on the vertical axis.
Conclusion
We opted for a representation of the person through 5 features easy to extract: the position, the vertical and horizontal velocity of the centre of mass, the vertical dispersion and the highest coordinate of the silhouette. This simple representation allows us to track the person in real time. The higher level of treatments that are described next (the analysis of the gait parameters and the detection of the activity of a person) are based on the analysis of one or all of these features.
Measure of the gait parameters at home
The aim is to observe over time the gait parameters of a person as indicators of the evolution of her frailty.
Selection of indicators
When a person ages, her gait changes. Several changes can be cited, including a decrease in the speed of the gait, reduced lengths of steps, an increase of double support time, and a greater variability of the gait [12]. These changes in the gait are considered as « normal » because they are due to the advance in age. What interests us in this section concerns the « abnormal » changes, that may be indicators of a worsening of the frailty of people.
Hausdorff et al. [14] showed the degradation of certain parameters among fallers and tested the hypothesis that fall prevention is possible from these parameters. After one year of experimentation, they showed that the variability of stride time and swing time are associated with an increased of the risk of fall in the future. Auvinet et al. [3] performed an experiment where they showed that the speed, the frequency, and the step lengths had reduced values for the fallers compared to the person who had never fallen. Irregular step lengths was considered in their study as a reliable variable to prevent falls.
Other articles showed the interest to study the spatio-temporal parameters for the correlation with the risk of hospitalization. The analysis of the speed of the gait is a good indicator for predicting a risk of hospitalization and a declining health according to Studenski et al. [27]. In this article, the authors showed that 41% of slow walkers (<0.6 m/s) were hospitalized at least once a year, while only 26% of intermediate walkers (0.6–1.0 m/s) and 11% of fast walkers (> 1.0 m/s) were hospitalized.
Other researchers have focused on the analysis of the gait indicators that can help to predict a possible emergence of dementia or cognitive impairment in the following months or years. Although the main signs of dementia are cognitive decline, several articles showed that motor disorders are present in the early stages of the disease. Several studies ([8,30]) have determined that a slow speed of the gait can be an indicator of early cognitive deficits.
Extraction of the indicators
According to the previous article, the analysis of the spatio-temporal parameters seems to be an interesting approach to assess the general state of a person. The parameters, we are interested in, are the step length, the pace, and the speed of the gait. A detailed description of the extraction algorithm is presented in article [11]. The center of mass is at its highest when it is at the vertical of the supporting foot. The position of the supporting foot can as a consequence be estimated by the projection on the ground of the center of mass at the time of the maxima, as shown in Fig. 1. In our case, the step length is calculated as the Euclidean distance between the center of mass corresponding to two consecutive vertical maxima. The extraction of the first step length is shown in Fig. 1. To calculate the pace, we divide the number of steps performed during a sequence by the sum of their duration. The duration of the step is the time between two consecutive local vertical maxima of the trajectory of the centre of mass. The extraction of the duration of the first steps is shown in Fig. 1. The speed is calculated by dividing the sum of the lengths by the sum of the durations of the steps performed during a sequence. The extraction of the walking speed is shown in Fig. 1.
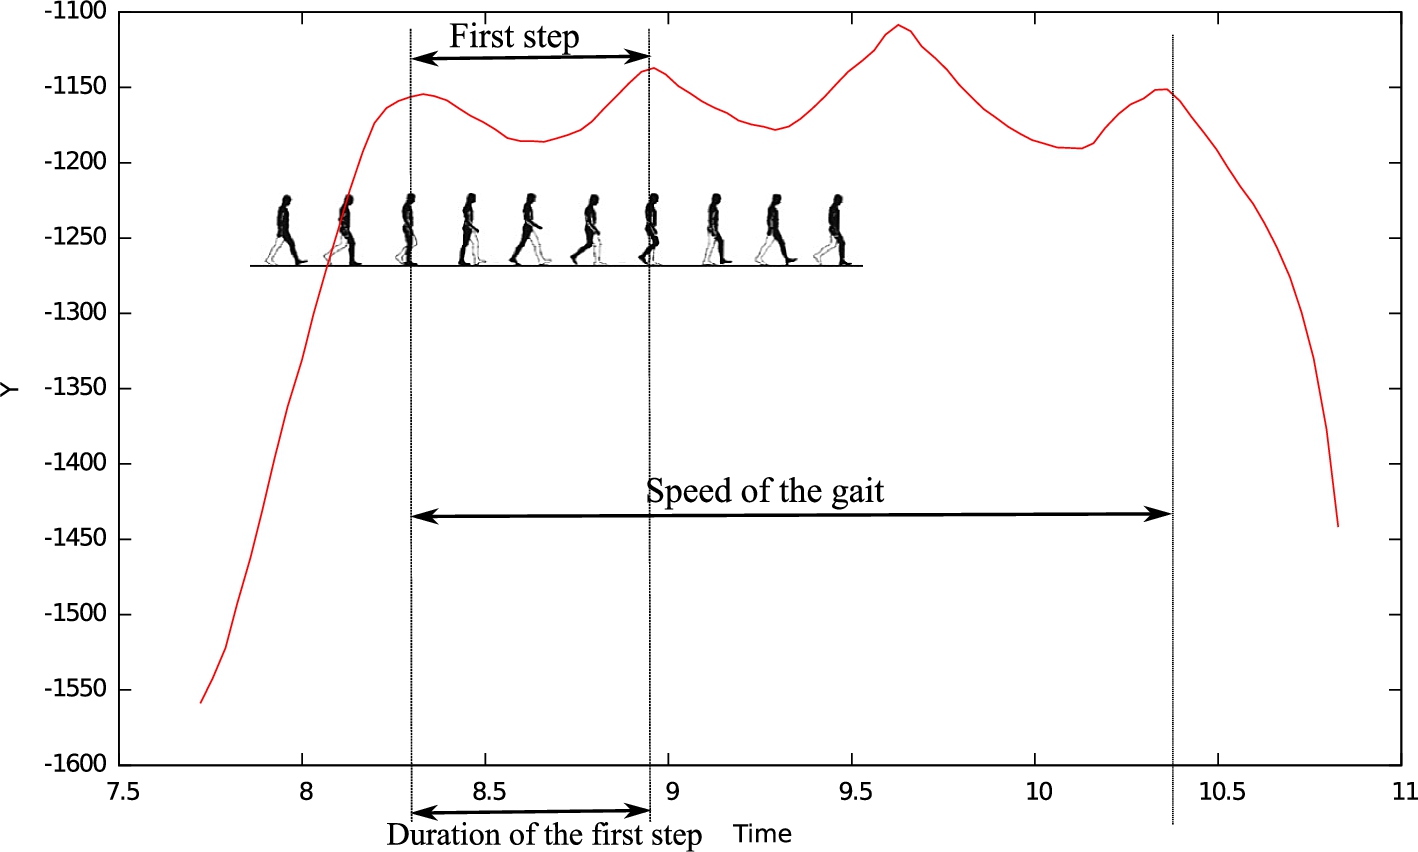
Extraction of the gait parameters from the center of mass.
We have assumed that our database can not be exhaustive. It is difficult to record all the activities or postures that a person can achieve during the day. Recording realistic and completely natural movements of a person is very difficult to make in a laboratory situation. We have, for example, no real fall records. We used HMMs because of their good generalization capabilities from a limited database.
Description of the HMM
HMM provide an effective framework for modeling phenomena or processes governed by a dynamic hidden state [22]. Only partial observation on the process is available, and the state can be inferred with a certain probability from a sequence of observations. HMM is formally defined by:
a set of states; a matrix an initial probability an observation function
Description of the model
The aim is to detect falls and dangerous situations but also to recognize the activities that the person can take in her every day life, differentiating the activities where the person is passive and those where the person is active. Activities are the hidden states, that we seek to determine from a sequence of observations extracted from the depth images of the RGB-D camera. This model is the result of a compromise minimizing the complexity of the model and in particular the number of observations while ensuring robustness in the recognition.
States
The model contains eight HMMs of three states, each HMM corresponding to one activity among: walking (including the upright position), lying (on a bed, on a couch for example), sitting, lying down, squatting, going up on an obstacle (a chair for example), falling, and bending.
Initial probabilities and transition matrix
No knowledge is inserted into this model. These probabilities are learned automatically from the database.
Observations
Each of the eight HMM is based on three observations:
the position of the centre of mass on the vertical axis; the vertical velocity of the centre of mass; the vertical dispersion of the silhouette (standard deviation) on the vertical axis.
The observation function, giving the probability to observe a value
Parameter estimation
We used the Baum-Welch algorithm to learn the parameters of each model from the database that we have built. The estimated parameters are:
the transition matrix of each HMM; the normal distribution parameters,
Inference
Inference is done with the algorithm Forward, by calculating at each time step the likelihood of the different models on the latest images of the sequence. The most likely activity is the one that corresponds to the HMM giving the greatest likelihood.
System evaluation
In the two previous sections, we have presented our contribution to the extraction of the gait parameters and the recognition of activities. In this section, we evaluate performance of these algorithms. Several experiments are performed. The first two are experiments that have been conducted in an experimental apartment with young subjects. The third experiment presents some results obtained with elderly people.
Experiment on gait analysis
The aim of the experiment is to test the accuracy of gait parameters provided by our algorithm.
Description of the experiment
11 healthy subjects took part in the experiment among which four women and seven men aged from 22 to 53. The experiment consisted in using an actimetric carpet (GAITRite) of 5 meters length, as a reference for evaluating our system. The error of measurement is 1.27 cm which is the distance between the sensors in the carpet. The gait parameters obtained with the carpet were compared to the values provided by the camera algorithm. We have compared the results on the three gait parameters extracted in Section 4.2: the length of the steps, the pace, and the speed of the gait. Subjects walked in different situations to have a large representative data sample:
they walked in a straight line « normally »; they walked straight making small steps; they all walked with a long skirt to know if the clothes disturb the gait parameter extraction; they walked in front of the camera (the other situations were performed with the camera perpendicular at the subject); they walked with two cameras observing the same scene.
To follow a person at home we need to cover a room with multiple cameras and it is likely that there are overlaps between their field of vision. With the last situation, we want to evaluate whether, in this common area, the results are degraded, because the RGB-D camera that we use is an active sensor. The subjects performed these situations three times to obtain a sufficient number of steps.
Results
The values of the step lengths, pace, and speed of the gait are measured with the carpet and with our algorithm for each sequence. We treated 165 sequences, composed each of 2 to 5 steps, depending on the subject and on the situation. The results are shown in Table 1. This table shows the means and standard deviations (denoted σ) calculated, for each parameter and each situation, from the measurements provided by the carpet and by our algorithm. For the steps length, the mean obtained with the carpet and with the camera are similar for all the situations. The maximum error between carpet and camera is 2.2 cm, obtained for the situation in which people wore a skirt. « Normal steps », « Two cameras », and « Small steps » are the situations where the differences between the average for the carpet and the camera are the lowest. For the situation « Front camera », we get an error of 1.6 cm, but with high variability. The difference between the standard deviation for the carpet and the camera is 20 cm. For the pace, the mean maximum error is 0.08 step by second. For the speed of the gait, the error is more important in the « Front camera » situation than in the other situations. In the « Front camera » situation, the mean error is 0.11 m/s. In the other situations, the mean error is less than 0.04 m/s.
Comparison of the gait parameters obtained with the carpet and with our algorithm using the camera
Comparison of the gait parameters obtained with the carpet and with our algorithm using the camera
The experiment tested the accuracy of gait parameters obtained with the camera in various situations that may be encountered at home. We found that the clothing had apparently no influence on the accuracy of the results. The oscillations of the centre of mass trajectory are amplified by an artifact related to body profile occlusions. This artifact is even more present in the situation in which the person is wearing a skirt. The oscillations of the person wearing a skirt are larger than those in which the person is wearing trousers. The number of points detected in the bottom of the person’s body is greater when she walks wearing a skirt, in double support position. The phenomenon of the artifact also explains why many mistakes are made when the person walks in front of the camera. When the camera is in front of the person, the artifact is not present, so the centre of mass trajectory is smoother. The trajectory being smoother, extraction errors of the local maxima and, therefore, errors on the gait parameters are committed. The results show that for measuring the gait parameters at home we can use the mean of each parameter, for example at the end of the day since the mean values are close to the real values for all those situations.
Experiment on activity recognition
The experiment test the ability of the built HMMs to recognize human activities.
Description of the experiment
28 subjects took part in the experiment among which 8 women and 20 men aged from 20 to 53. The experiment was held in a laboratory apartment where the subjects made 7 situations filmed by a RGB-D camera placed in a corner of the apartment. Each situation corresponded to an activity that we have defined during the construction of the HMMs in Section 5. These activities are: squatting, bending, sitting, walking, falling, lying on the ground, going up on an obstacle, and lying on a couch. We built a HMM for each activities using 80% of the subject’s sequences. The remaining 20% of the subject’s sequences were used to evaluate performance of the method.
Correct and false classification of activities by the algorithm
Correct and false classification of activities by the algorithm
20% of the sequences were used for inference. The results are shown in Table 2. The columns represent the different activities (« Lie »: Lying on a couch and « Ground »: Lying on the ground). The first line indicates the number of correct classifications for each activity according to the model. The second line indicates false detections. We consider a false detection when the performed activity is not detected in the sequence or is detected too late. Activities « Falling » and « Lying on the ground » are considered as special cases. Whenever the algorithm indicates « Falling » or « Lying on the ground » while these activities were not performed we consider it as a false detection. The idea is to consider the detection of a fall (or lying on the ground) as a very important information and that committing a false detection of these activities is worse than producing a false detection of other activities. The line « Total » indicates the total number of occurrences which should have been found for each activity. The system, trained with Baum-Welch, is accurate since it detected all the « Fall », « Squat », « Lie on the ground », « Walk » situations. One « Sit » and « Lie on a couch » were not recognized because the subject performed these activities differently from the situation in the database. For example the subject put one leg over the other, which was not performed in the database. The model makes no false detection for falls, as shown in the second line of the table.
Conclusion
To develop an algorithm that can detect daily human activities and detect the falls, we need a model classifying correctly the activities, and especially a model making few false detections. The 8 HMMs of 3 states detect all falls without producing false detection and classify correctly the other activities, which corresponds to our expectations. Moreover this model is not being constrained by the dynamics of situations. For home, we believe that this model will be robust for the new sequences.
Tests in real situations
A limitation of the two previous experiments is that they were made in the laboratory with subjects not representing the category that we want to address. We present the results of some tests on the elderly people.
Test of the gait analysis algorithm
We asked two persons in a hospital to walk in front of our system. Figure 2 shows the vertical trajectory of the centre of mass with lengths detected for one of the two persons. For this experiment, we have no reference system. We can only make a qualitative analysis by observing that the system detects, as in our previous experiments performed on younger patients, oscillations and is able to extract the gait parameters. Moreover, we can notice that the detected lengths (68 cm, 53 cm, and 55 cm) are plausible measures and that their number is right.
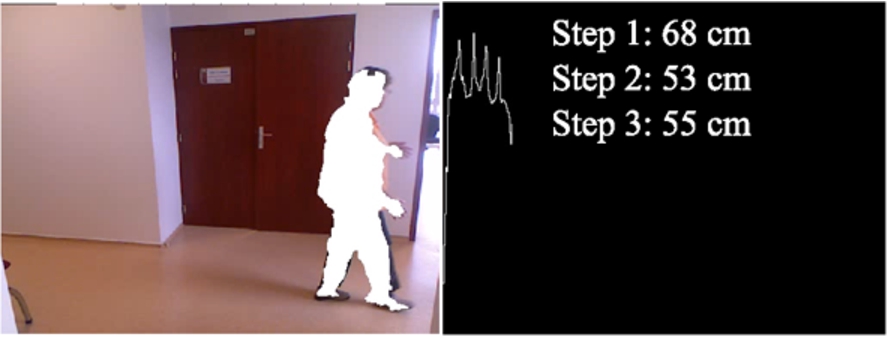
Using our system with a patient during his hospital visit.
We also filmed four persons over 80 years old at home, walking perpendicularly to the camera. Three out of four persons had already fallen. In all the four cases, the oscillations of the centre of mass, on the vertical axis, are present as it can be seen in Fig. 3 and in Fig. 6. The local maxima are perceptible, the algorithm can deduce the gait parameters. Qualitative analysis allows us to see that the most regular trajectory belongs to the elderly who has never fallen 3(a). The person in Fig. 6(a) had significant balance problems, cognitive impairments and had already fallen several times. The oscillations of the centre of mass are less regular than with the young subjects, but the trajectory remains sinusoidal. It is therefore possible to obtain the gait parameters. The trajectory which oscillates little in Fig. 3(c) belongs to the person, of 84 years old, who had recently fallen. The spacing between the maxima indicates a slower pace than that of the person represented in Fig. 3(a). Finally, one of the subjects had an artificial leg and walked with two canes. When he walked, the artificial leg is only slightly raised above the ground. The representation of the trajectory of its centre of mass is shown in Fig. 3(b).

Representation of the mass centre, on the vertical axis, when elderly people walk.
We asked one of the elderly people to walk, sit, bend, and go up on a steps. Situations where the person walks, sits, and bends are recognized. The activity where she goes up on a steps is not recognized. The person climbed on a 13.5 cm steps whereas in the database, people climbed on a chair. The climb was perhaps not big enough to be detected by the algorithm. We believe that the parameters learned for a chair are different from those that would be learned for a steps. This is why the situation has not been recognized.
Conclusion
The different tests with elderly people give us the first results of what we would get if we were making experiments with them. Thus, we can see that the trajectories of the centre of mass, on the vertical axis, are more irregular than the ones we get with younger people. The curves follow all the same a sinusoidal trajectory, which allows us to extract the gait parameters. Regarding the activity detection, the tests show that we need to change the database on which the models are trained before starting an experiment with elderly people, especially for the situation « Going up ».
System for home care
Activity Recognition (AR) and Gait Parameters Extraction (GPE) are the two axis of research that we have developed to deal with the problem of securing the person at home and the evaluation of her degree of autonomy. In the end, the goal is to develop a unique system for home care.
Toward a system at home
Coupling of the AR and GPE contributions
The AR algorithm provides the current activity of the person in real time. According to the detected activity, a specific task is performed:
« Walk »: recording the time spent in this situation, which will be classified as an « active » activity and extraction of gait parameters when the person is entirely visible; « Sit » or « Lie on a couch »: recording the time spent in these situations, which will be classified as « passive » activities; « Fall » or « Lie in the ground »: sending an alert to the family or to the emergency services; « Go up » or « Squat »: sending a signal to the family or the doctor to warn that the person adopts a risky behavior that can increase the risk of a fall. The signal may be contextualized and graduated according to the location of the sensor and the duration of the situation.
At the end of each day, the system provides a summary of the total time spent in « passive » and « active » activities, the number of changes of activity, and the mean of the step length, of the pace, and of the speed of the gait. With this information, it will be possible to observe changes over time on these indicators (at different time scales: weeks, months or years). This information, along with the evolution of gait parameters, can be used as an evaluation criterion for the loss of autonomy. In the latter case, the family or the health professionals could be alerted, which will help securing the person’s home.
Habit map at home
The objective is to develop a learning method of the person’s habits in the environment. A change in the person habits can be an indicator of a health problem.
System limitations and constraints of the environment Partial visibility problems due to occlusions or limits of the sensor field of view must be taken into account when following a person. It is important to identify these areas in which the system performances are different. Areas of the border of the exit of the field of view must also be taken into account in the interpretation of the results. These areas are located on image edges, but also in the crossing of a door that would be visible in the scene. To incorporate this information into the habit map, we need to differentiate the cases where the person is hidden, from the situations where she is fully visible.
Partial occlusion detection The proposed method to detect the occlusions is obtained by Forward algorithm. This algorithm is used to know in which state the person is. The Forward phase calculates the joint probability α for each state, at each time step t, of observing the sequence
Habit map building To learn the localisation habits in the environment, we divide the scene in areas of 50 cm2. We asked a subject to perform several activities in the experimental apartment where two armchairs are pushed together, as shown in Fig. 4(a). The person could sit, lie, walk behind the chairs being partially hidden, and walk in front being fully visible. The algorithm learns, for each area of the environment, the frequency of the activities of the person, the edges of the camera’s field of view and the visibility or not of her body. More specifically, the algorithm observes whether the person is hidden or visible, using the likelihood values. If the person is visible, the model learns that the activity can be performed in this area. If the person is hidden by furniture, the model learns that the cell where the person is found is located behind an obstacle. Finally, we consider an edge as the place where the person goes completely out of the sensor’s field of view. Figure 4(b) represents the habit map built after the subject had performed different activities in the experimental apartment. The white cells represent unexplored areas where the person has never been detected. The black cells represent areas where the individual has been detected as performing a « passive » activity. The dark gray cells represent the areas where an occlusion of the person has been detected. The light gray cells represent areas where the individual has been detected performing an « active » activity. In these areas, the HMM system detected that the person was in « Walking » or « Upright » state. The proportions of the colors in each cell represent the proportions of the detected situations. We can see that dark gray areas are properly behind the two seats. Black areas are located at the place where the two seats are located. This shows that the activities « Lying » and « Sitting » were correctly identified at the locations of the two chairs. The light gray areas are located at the places where the person walked while being fully visible. On the map, we marks « Edge » where the person has come out of the sensor’s field of view. In the home of the elderly, we imagine learning day by day the activities performed by the person to build a map of her habits in the environment.
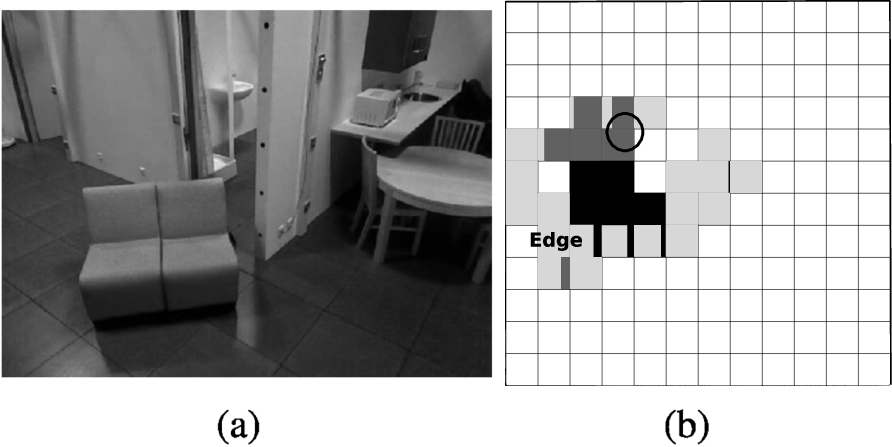
(a) Image of the environment and (b) map representations of learned habits of a person (in white: unexplored areas, in black: passive zones, in light gray: active zones, and in dark gray: areas behind obstacles.
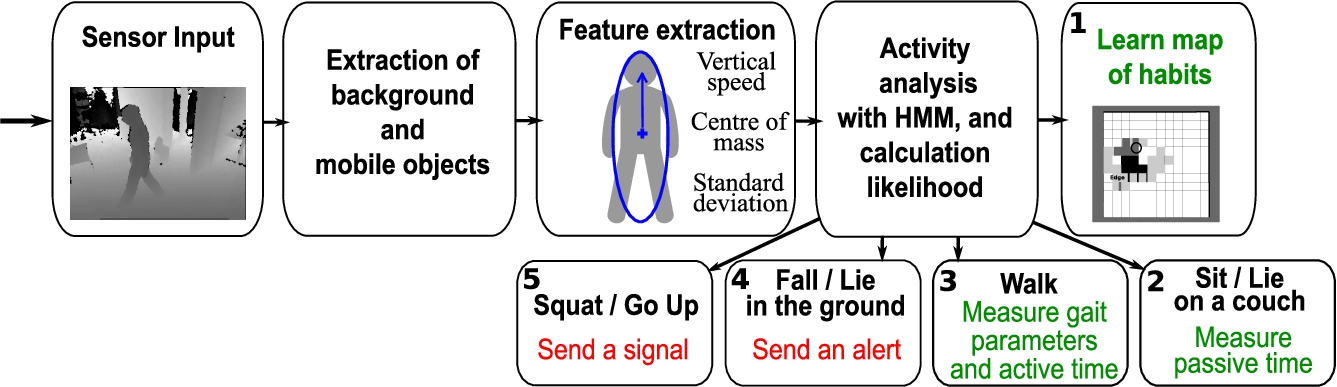
The architecture of the system with the evaluation function of the frailty (1, 2, 3) and the securisation function (4, 5).
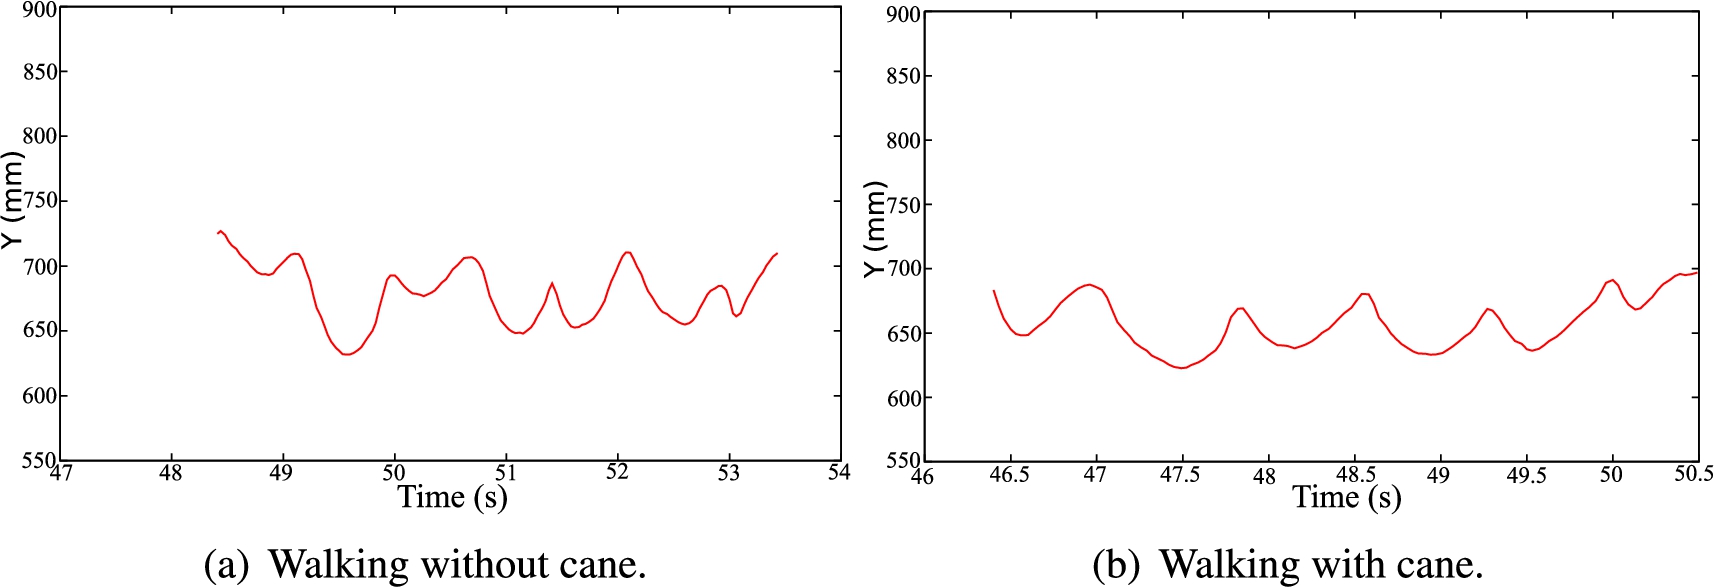
Representation of the centre of mass, on vertical axis, of a person aged 90 having balance problem.
Detection of abnormalities The map can be used as a basis for detecting abnormalities. The mapping of the person’s habits can be used for monitoring the evolution of the activities. A change in the person’s habits can be an indicator of deterioration of the person’s health. Other abnormalities can be detected using the map, and they can trigger alerts. For instance, when a person disappears from the field of view, the proximity to a zone of occlusion can be detected from the map, which could indicate a occluded fall. The algorithm can then calculate the time spent in this situation. If the time is greater than a certain threshold (a few seconds), we can consider the possibility of a fall. Figure 4(b) corresponds to a situation where the person is hidden behind a chair. On the image of the habit map, at the top left, the circle represents the final position of the centre of mass that was detected when the person was still visible. We can see that the position of the circle is on a dark gray cell, meaning that this area has been learned as a location where the person can potentially be hidden. The delay from disappearance indicates if there is a fall or not. Conversely, the map can help us to take into account the areas of normal exits of the field of view. The person can leave the field of view at image edges but also due to the crossing of a door that would be visible in the scene. If the person disappears from the field of view at a position close to a normal exit zone, the alert is not triggered.
The coupling between the activity detection, and the gait indicator extraction provides a lot of data that can be used to secure the person’s home and evaluate the degree of frailty. With tools, such as the detection of occlusions and learning the habits map, we increase the robustness of the system for the home care support. The habit map allows to know the usual occlusion areas by combining over time the analysis of the likelihood. The detection of an occlusion can be reinforced by looking at the position of the person on the map, so as to be robust to possible sudden variations in likelihood. The likelihood can then be used to avoid possible false detections, taking into account the occlusion zones and usual activities in the area where the alarm was detected. Finally, the map of the environment provides a spatial representation of patterns that can be used to further analyze the evolution of human activities. The different step of the system is summarized in Fig. 5.
Other perspectives
Our current system provides support to home care for the elderly. Additionally, we believe that this system could have other applications. For example, this system could be used for a physician to assess patient compliance. We tested the system with a person aged 90 having balance problems. When the person walked without her cane, the trajectory of the centre of mass in Fig. 6(a) was less regular than when she walked with the cane, as shown in Fig. 6(b). The physician advised her to walk only with a cane at home, not to worsen her balance problems and prevent her from falling. This system would allow the physician to observe, through the regularity or not of the trajectory of the centre of mass, if the person respects his advice. The physician could prevent the degradation of the person’s health instead of noticing this degradation once the person has fallen. This tool could also be useful in the case of patients in rehabilitation, for example following an accident or amputation. One of the problems in rehabilitation is the return to home. People at hospitals follow the exercises that are indicated by their caregivers. However once back home, they tend to stop the training. The installation of the system would allow the patient and the physician to analyze regularly the trajectories of the centre of mass. He could know whether the patient continues the rehabilitation by walking properly at home and continues to improve.
We can also imagine to evaluate at a daily basis, the gait parameters and observe their evolution with respect to time to detect the risk of hospitalization, cognitive impairment and dementia (as presented in Section 4.1). One of the major problems in the case of dementia is that people are often treated too late. With a system constantly analyzing the gait, alerts can be triggered at the first sign of trouble, and orientate the patient towards neuropsychologists, to perform cognitive tests.
General conclusion and horizon
One of the major topics of the next years will be the aging of the population. One consequence is the increasing number of people losing their autonomy. This raises the question of where they live and their accompaniment. The majority of people prefer to continue to live at home. Moreover, the admission into institutes has a significant cost to the individual or for families. We have made a contribution to home support for older people using technological devices. Living healthy as long as possible at home raises a number of questions, such as the social link, the degree of autonomy, the security, the nutrition, the cognitive stimulation or the hygiene. We are interested in two issues of this problem, the security by detecting falls, and the evaluation of the degree of autonomy to prevent accidents. We imagined installing at home an ambient system minimizing obtrusion that would automatically process data at home. This approach has led us to use Microsoft’s Kinect sensor. To detect falls, we have developed a fall and risky behavior recognition algorithm. To prevent frailty, we developed an activity detection algorithm to determine if the person’s habits are stable, and a gait analysis algorithm to assess changes in its locomotor behavior. These two algorithms may allow to establish a degree of frailty of the person, like the physicians do in consultation with their clinical tests. The lab results we obtained allow us to plan a larger real life validation study.
In the objectives, we mentioned that we wanted to build a usable realistic system, which has to deal with the issue of acceptance of the system by people. Few studies assess the perception the elderly have of new technologies that can be installed at home. The issue of acceptability is more present for the installation of cameras that could violate the person’s privacy. According to Caine et al. [7] and Melenhorst et al. [19], people would be willing to partially compromise their private life if it allows them to remain independent. Demiris et al. [9] show that anonymity of the images could be a solution for implementing a less intrusive system regarding to the privacy of individuals. The authors show the need for users to have an understanding of the output of the system, but also of its processes and purpose. They also expressed the desire to control the operation of the system by being able to turn it off when they wished. In addition, they emphasize the importance of determining by themselves who will have access to the information. According to the interviewees, some of them wanted that their families had access to information to reassure them and others did not want. To the question of the interest of such a system, nine out of ten expressed that they did not want to install the system at home, because they did not feel the need for it, they felt independent. The only person who wanted to install the system had recently fallen and specified that such a system would have been useful during her fall to alert people. To build an acceptable system, we must take into account these recommendations: images must remain anonymous. For this, the system is conceived so that image analysis can be done locally, and only the activity measurements are transmitted or recorded. The system will need the possibility to be turned off. This possibility is not only useful for the monitored person but also for outsiders (carers and families) who might not agree to be filmed. For the system to be acceptable, the user should know the benefits of installing such a system, how the system works, and the decision of who will have access to the data must be his/hers.