






Abstract
Aquaculture, in addition to agriculture, is one of the most sought after occupations in the coastal regions of India. The livelihood of thousands of aquaculture farmers depends on the output generated through aquaculture and thus this is one of the major factors influencing the socio-economic status of the country. However, the current practices adopted by these farmers in developing countries are very traditional and need to improve in order to get higher yield and production. This paper presents an intensive review of the design of WSN (Wireless Sensor Network) in aquaculture. Indian scenario of aquaculture is represented through surveys and case studies that were conducted in Bhimavaram, a city in western Godavari region of Andhra Pradesh. A system design based on wireless sensor network is proposed which enables remote monitoring of the aquaculture farms and sending alerts to the farmers when any deteriorating deviation in tank water quality is detected.
Introduction
Aquaculture is farming of aquatic organisms such as fish, molluscs, crustaceans and aquatic plants under controlled conditions. Aquaculture can be classified into different culture environments such as freshwater aquaculture which is cultivation in freshwater such as rivers and canals, brackish water aquaculture found in bays and logoons, and marine water aquaculture practiced in inland seas and open waters. Aquaculture system may also be categorized according to the degree of production namely extensive, semi-intensive and intensive. Extensive aquaculture requires minimal input and produces low yield whereas intensive aquaculture demands high external input to produce good yield and involves high expenditure costs [42].
India is an important country of the world that produces fish through aquaculture and is home to more than 10 percent of the global fish diversity. Presently, this country ranks second in the world in total fish production with an annual turnout of about 9.06 million metric tonnes of fish (Food and Agriculture Organization). Some of the cultures include shrimp varieties namely tiger prawn (Penaeus monodon), exotic whitelegshrimp (Penaeus vannamei) and major Indian carps, namely catla (Catla catla), rohu (Labeo rohita) and mrigal (Cirrhinus mrigala).
The dependence of over 14.5 million people on fishery activities for their livelihood and foreign exchange earnings to the tune of US$ 3.51 billion (2012–13) from fish and fishery products highlights the importance of this sector on the country’s economy and on livelihood apart from meeting the domestic needs of the people (Food and Agriculture Organization).
Comparison of wired and wireless network from aquaculture perspective
Comparison of wired and wireless network from aquaculture perspective
The aquatic environment provides food, shelter and oxygen to the fresh water/marine creatures [7]. However due to human activities, excessive pollution, agriculture and other multiple reasons, the water is getting polluted which is hampering the growth and survival of the aquatic creatures. Variations in physio-chemical parameters of water such as water temperature, dissolved oxygen and pH can make the pond unsuitable for cultivation which leads to fish and prawn mortality. Some species are known to be highly sensitive to these parameter changes in the water quality, which can hamper their growth and result into premature death.
One of the solutions is to monitor the water parameters in a reservoir for detection of any deviation in water quality. At present the farmers and researchers of Godavari region are manually collecting the water samples and performing lab tests to get the water parameters. However, this method is cumbersome and lengthy. Also, the parameter readings get altered over a period of time during transport from the ponds to the laboratories and this lack of real time analysis reduces the accuracy of the results. Thus, farmers are unable to get any warning about the deteriorating water conditions developing in their ponds and are unable to prevent any misshapenness for the aquatic creatures leading to heavy losses for them.
Therefore, there is a need to automate water quality monitoring system to eliminate the need of manual water collection and testing and get real time values of water parameters. This could be achieved with the help of a sensor network.
Sensor networks are of two types – wired and wireless, suitable for different applications [2,30]. Wireless sensor network provides better monitoring and control of the water quality due to mobile nature of the nodes in the aquatic region, ease of deployment, scattered monitoring locations and real-time data transmissions (Table 1).
However, for efficient and optimal wireless sensor network design, it becomes imperative to understand the physical nature of the area, the present practices of the aquaculture farmers, their practical problems along with their requirements and expectations. This data collection could be achieved through interviews, questionnaires, case studies and schedules.
The main contributions of this paper are formulated as follows: Review of wireless sensor network design for monitoring and controlling water quality parameters for aquaculture is presented in Section 2. Section 3 describes the problems, requirements, and expectations of the aquaculture farmers in western Godavari regions though user interaction feedback, which is formulated from personal interviews and questionnaires. Testing of a sample prototype to evaluate the effect of environmental conditions and water turbulence on the node for efficient node design is mentioned in Section 4. Finally, we propose an optimal wireless sensor network based solution to solve the problems of the end user (aquaculture farmers).
Introduction
Wireless Sensor Network (popularly known as WSN) is a framework consisting of plethora of sensor nodes for collecting external parameters, a network for connecting these sensor nodes and transmitting the collected parameters to a monitoring station for storage and further analysis. With the introduction of wireless sensor network in various domains, smart devices have emerged which have led to smart spaces. These smart spaces are saturated with embedded computer devices which identify the external parameters and act accordingly to provide solution to the users. Wireless Sensor Networks (WSN) have emerged as a highly flexible and dynamic framework that can be deployed at urban or rural areas to solve day to day problems.
In [45], focus is on how wireless sensor network can be used to solve the problems prevailing in urban areas. Examples of many such application domains include power system to solve problems related to malfunctions due to overload and risks of blackouts [33], automated remote meter readings and smart grid sensors [5,21,36]; transportation applications which include traffic congestion and traffic jams encountered frequently in the urban areas [26–28,39] and car parking problems [50]; security applications such as WSN surveillance [9] and intrusion detection; healthcare applications by connecting the rural areas to urban areas for remote health monitoring [16,41,56]; environment monitoring applications such as air quality monitoring [10,17,36,38,48,53].
Wireless sensor network architecture for aquaculture
Wireless sensor network architecture for aquaculture can be divided into three major parts namely, sensor node, transmission medium, data storage and decision-making unit.
Sensor Node: Wireless sensor network utilizes multiple sensor nodes to collect the information from the surroundings and transfer it to the main intelligent controlling centre for storage and further monitoring. A sink node can gather the information from all the nodes and may function as a customized device such as a PDA or a laptop. This sink node in turn connects to other networks or it may act as a base station and provide a link between all the other nodes to the central monitoring unit [45]. Remote monitoring requires real time accurate measurement of water parameters and hence sensors with high accuracy should be chosen [59].
In the context of aquaculture, the sensor node consists of sensors such as pH, dissolved oxygen, water temperature, water turbidity, salinity which measure the physio-chemical parameters of water; processing unit such as microcontroller which convert the analog signals obtained from sensors into digital values; and communication module to transmit the data to remote locations. The importance of the sensors for measuring water quality are mentioned in Table 2. However due to continuous emersion of sensor in water, the sensor body may be prone to fouling which can be avoided by doping the RuO2 – semiconductor electrode with Cu2O and ZnO to improve antifouling resistance [59]. A small size, low power and low-cost microcontroller which can perform analog to digital conversions is chosen for majority of the application. However nowadays, system on chip (SoC) are also preferred as a computing platform because of built-in sensors and communication modules which lowers the size and cost of the sensor node.
Sensors measuring water parameters
Sensors measuring water parameters
Transmission Medium: The sensor nodes are connected to each other and to the monitoring station using a medium. The medium could be either wired or wireless or combination of both. However, in the context of aquaculture, wireless medium is the most appropriate. Selection of the wireless medium takes place according to the application, space and complexity of the sensor nodes, transmission range and cost etc. The major transmission medium along with their parameters are mentioned in Table 3 [11,47]. The protocols selected for transmission must be energy aware, efficient, and scalable [19]. Data routing and forwarding techniques can be categorized into data centric, hierarchical and location-based routing approaches. Data centric protocol are query based in which query is sent from source to certain sensor node in network and waits for response from that sensor node. Hierarchical routing technique separate the sensor network into sub regions and a leader is chosen in each region, which is responsible for management and transmission of data. Location based routing uses the node’s position information (obtained through GPS) to forward data to destination. Multi-hop routing with IP addressing scheme is preferred in case of multiple mobile nodes for energy balancing and fault tolerance [3].
Transmission medium parameters
Intelligent Decision-Making Unit: The data acquired by the sensor nodes need to be stored for further analysis and decision making. Storage devices could be a local server capable of storing data with timestamp or a mobile application receiving data through Bluetooth. Data could be stored locally on a system or globally on the cloud platform. With the advent in cloud computing, data storage has become easily accessible anytime and anywhere. However, useful information need to be extracted from these data to provide early warnings and messages to the users (in this context, the aquaculture farmers). For example, fuzzy logic algorithms evaluate changes in dissolved oxygen level and turn on the motor when dissolved oxygen drops below threshold.
Remote monitoring of water parameters is important for proper management of water quality in ponds to prevent occurrence of unfavorable conditions that can harm aquatic life [18]. Incorporating wireless sensor network into aquaculture framework can lead to remote monitoring and early warning system which can save a plethora of marine lives and prevent hefty losses to the farmers.
M. Zhang et al. (2011) [57] presented water quality monitoring system for crab ponds in Yixing Jiangsu Province, China. The system was based on real time monitoring of dissolved oxygen, water temperature and pH using WSN. A configuration software module was developed using Visual Studio 2005 consisting of various functions such as viewing real time sensor data in graphical format, designing the onsite graphical equipment deployment, changing the device configurations such as sleep states as per need and sending alerts to nodes when thresholds were violated. Apart from data collection, node voltages were recorded which provided information regarding node current energy. However, the software was local to the system and not globally accessible.
D. S. Simbeye et al. (2014) [18] designed a system using gateway nodes to collect sensor readings such as temperature, pH, water level and dissolved oxygen and transmit them to the coordinator node via zigbee. The analysis in graphical format was carried out in Lab windows/CVI software attached to the gateway node via RS-232. The monitoring software had different subroutines such as data communication, testing and archive management. The system was implemented in Tangsu district for 6 months for fish ponds. The sensor node was battery operated with Duracell 6 V battery which remained in operation above 2.5 V for entire 6 months as the authors have used low power hardware for implementing sensor nodes.
Z. Chen et al. (2013) [15] proposed a remote monitoring system to monitor the water pollution using pH glass electrode and WSN conditioning circuit. The pH glass electrode was chosen over plethora of other pH sensors namely, photochemical, enzyme selective because of its wide measuring range, good reproducibility, high stability, and accuracy. The data collected was sent to the pH conditioning circuit to amplify voltage and remove harmonics. The output signal of sensor was input to the C8051F930 microcontroller which is a low power and low cost microcontroller to convert analog signals to their digital versions. The digitalised signals were sent to low power RF Si4432 module with working voltage of 1.9 V–3.6 V for wireless transmission. To conserve power, the sensor nodes were sent to sleep states and awakened when required.
S.N.R. Kamisetti et al. (2012) [29] developed a smart electronic system for pond management in fresh water aquaculture with predictive decision support system for predicting the stress factor on-line. Parameters such as operability, portability, adaptability to different pond sizes were considered. The system consisted of a sensing chamber where the water samples were collected for sensor sampling and facility to clean the chamber was also included. The physio-chemical parameters were depicted in form of mimic diagrams. Mimic diagram contained LEDs to depict alerts and pipes to denote the system.
J. Ho et al. (2015) [14] designed an automated system for fish pond monitoring and control. Physio-chemical parameters such as pH, water temperature, DO and water level were measured with 16-bit RISC architecture MSP430 microcontroller. The system was battery operated, solar powered and electricity powered. Power backup was provided by using UPS. Data was received on the Android device. Variety of actuators such as RGB light control scheme, heaters, feeders were interfaced with actuator node to control the water conditions in case of any abnormality in water quality.
An intelligent monitor and control system based on WSN was designed by M. Hua et al. (2010) [23] using BP neural network. The system architecture consisted of a low cost and low powered 8051 module interfaced with sensors. Decoupling relationship between temperature and dissolved oxygen were described using fuzzy control module. The inputs of fuzzy control module had error variations and the output were input to the neural network. 2 input-5 hidden-2 output decoupling method was used to carry out the experiment using MATLAB neural network toolbox.
An aquaculture multi-parameter monitoring system using DP profibus fieldbus has been proposed by the authors [54]. This communication module was used due to its accurate signal collection and formation of distributed network. The system consisted of DP slave module connected to the sensor node for transmitting data to the main PC which was connected to DP master. Data visualization was shown using Seimen WinCC software. A detailed analysis of the proposals and deployment is summarized in Table 4.
Challenges
The deployment of sensor node changes according to the environment. For example, if the sensor node is installed underground, then the transceivers that have high transmission power need to be employed to overcome noisy channel attenuations. Whereas, if the sensor node is in marine environment then the outer encasement need to be designed to withstand the effect of salinity, moisture, and humidity [12,13,45,52]. But such encasements obstruct signal power and reception of the sensor node. The harsher the impact of environment on the sensors, more robust should be the mechanical and electronic design.
In [40], signal attenuation due to general vegetation for applications in mixed crop environment was discussed. Crop specific parameters of the log linear model were derived and used to simulate the network. In agricultural field the signals can get scattered, attenuated, and deviated by vegetation due to scattering of energy. Attenuation due to vegetation depends on type of foliage, and depth of vegetation. Quality of service parameters such as RSSI and LQI were measured at different antenna heights to simulate and evaluate the best location to place the sensor node. In Harun et al. (2012), signal propagation in aquaculture environment was analyzed. The authors concluded that two ray models are sufficient for network coverage planning for antenna heights unto 1 m. Unlike agriculture fields, signal propagation is mainly influenced by changes in atmospheric conditions above the water surface and sometimes by vegetation. The variations in the signal is small and mainly influenced by changes in temperature, humidity and hence, refractive index of the medium. Ponds with trees at the edges contribute towards signal variations due to spacial variations in signal density and reflection and scattering angles of the transmitting and receiving node.
Deployment strategies of WSN for maximizing coverage and connectivity, energy efficiency and lifetime optimization have been reviewed in [1,6,32,37,46,49,55,58,60].
One of the main problems in marine fish farm is sustainability, as described in [10,25] is the amount of uneaten feed waste generated and deposited in sea beds. Therefore, the authors presented an analytical model to find the best location to place the sensor nodes in fish farm cages to monitor the amount of feed generated. The models depicted that it was best to place the sensor node at the centre of the cage to sense and monitor the feed generated.
However, description and analysis of the challenges in deploying the wireless sensor network for mobile self-autonomous nodes on the pond, anchoring and placement of these nodes and measuring the quality of service for aquaculture could not be identified in literature.
Summary of aquaculture deployment model in literature
Summary of aquaculture deployment model in literature
Ample surveys have been conducted by researchers in Indian as well as foreign universities regarding opportunities and sustainability of aquaculture in India [4,20,22,24,31,35,51]. In export, India contributes 2.5% of the world fish trade, which is only next to rice (10.4%), tea (16.4%), animal diet (4.3%). Though majority of the fish cultivated land is present in West Bengal, maximum utilization of land for cultivation of aquaculture is in Andhra Pradesh. More than half of the shrimp production in India comes from Andhra Pradesh [20]. Bhimavaram is a city in the Western Godavari region of Indian state Andhra Pradesh having an area of approx. 25 km square. Aquaculture is one of the most heavily practiced occupation in this region.
Farmers in the coastal Andhra Pradesh are turning away from traditional agriculture to aquaculture so much so in the state that the land under fresh water and brackish water aquaculture has seen a fivefold increase to 82,000 hectares in the last three years. During this period, the industry grew from Rs 346 crore to Rs 561 crore. Further investments of over Rs 400 crore are expected to flow in from as many as 20 integrated units which are coming up in the state [34]. The farmers are turning away from agriculture to aquaculture because this domain is more profitable as fishes are less affected by natural calamities such as droughts, floods, and rainfall. However due to human intervention, excessive pollution, and overuse of fertilizers in agricultural fields, the water is getting polluted- physically, chemically, and biologically [8]. Physically there is lot of stress on water; chemically the water is affected by a variety of contaminants and biologically a lot of microbes and pathogens are introduced in water which can cause diseases [44]. Food and fecal matter from aquaculture facilities can deplete the dissolved oxygen levels and impact the surrounding. Organic wastes lead to seabed deterioration and chemical changes in sea beds. The extreme condition of gasping of CO2, H2S and methane would occur which can endanger other species [43].
Present method employed in this region are field work and laboratory testing for measuring the physio-chemical parameters of water. Water samples are collected over a period of a year from the ponds and samples are tested in nearby laboratories. Such research was conducted in [44] in the regions of east coast of India. The field work consists of collecting water samples from 30 wells which include bore wells, dug wells and hand pumps over a period of a year. The laboratory work consists of chemical analysis of the samples collected by different analytical methods. The techniques of measurement involved in these methods consume a lot of time and energy. Also, the water samples get rotten over a period and may not give accurate and real time readings. There is no provision of providing alerts to farmers to prevent any misshapenness. Therefore, incorporating the concept of wireless sensor network can automate the water quality measuring process and reduce human efforts in monitoring. It can provide real time remote data for alerts to the aquaculture farmers of Godavari region.
User feedback form
It is important to understand the farming habits of aquaculture farmers in a region for successful project design and implementation. Having a knowledge of the problems prevailing in that region and the requirements of the people helps in proposing an efficient solution to solve their problems. There are different ways such as personal interview and questionnaires through which the requirements of the farmers can be recorded. In personal interviews the interviewee must respond in-prompt and doesn’t get much time to think and evaluate. Variety of unstructured questions could be asked which helps the interviewer to have a better insight of the situation. Through questionnaires, the interviewee can read the questions, think, and respond with much privacy. Limited number of questions can be constructed in a questionnaire.
Therefore, to take advantages of both these methods, a survey with a questionnaire and personal interview was conducted at Bhimavaram, Andhra Pradesh with the help of our collaborator to study the aquaculture practices adopted by the farmers in that region.
Collaborators (professors who were also farm owner) act as a bridge between us (researchers) and the local aquaculture farmers by acting as telugu language translators. They provide initial support such as local site identification, talking with local farmers, getting support for working in the laboratories, and provide platform for basic implementation.
Collaborators, thus help in selection of potential users by local site visits, surveys and interactions with local farm owners and recording their farming habits and requirements.
To understand the economic and social status of the farmers, their farming habits, kind of application requirements, type of alerts preferred, a set of questions were identified which were presented to them in the form of a questionnaire to fifty aquaculture farmers. The structured questionnaire consisted of two sets of questions –
a. Mobile operating system used by the farmers: There are variety of mobile phones available in the market with either Android, iOS or Windows Phone OS. These operating systems have different software development tools and support different programming language for application development. It is important to identify the most commonly used operating system by majority of the farmers so that a mobile application could be developed in that platform which would show alerts and sensor readings during monitoring.
As per the survey, 80% of the farmers used Android operating system.
b. Type of cultivation: Aquaculture farming could be divided into fish cultivation, crab cultivation or shrimp cultivation. All these marine creatures require different environmental conditions and topology for survival. Survey results show that 73.3% farmers cultivate shrimp whereas 26.7% of the farmers cultivate fishes which showed that shrimp farms outnumbered fish cultivation farms.
c. Effect on farmers: Any deviation from the optimal physio-chemical parameters of water results into death of fishes and shrimps resulting in heavy losses to the farmers. We tried to capture number of farmers who would be affected due to water quality deterioration in ponds. It was found that 66.7% of the farmers would incur very heavy loss due to such a deterioration as the livelihood of most of the farmers depend on it. Such loss would put a strain on the socio-economic growth of the country. Thus, it becomes imperative to timely measure the water quality of the tanks.
d. Sample collection for water quality testing: For accurate water quality measurements, it is important to measure water from different areas of the tank. 53.3% of the farmers take water samples from the four corners of the pond whereas 13.4% and 33.3% of the farmers take samples from two places and a single place respectively of their tank.
e. Help from the fishery department or the government agencies: This question throws light on support being availed from the government agencies. 93.3% of the farmers were not getting any support from the government agencies and they were monitoring and controlling the water parameters of their tank themselves. 6.7% of the farmers had collaborated with government agencies which help them to monitor their tanks.
f. Requirement of kit for remote monitoring of ponds: 93.3% of the farmers replied in affirmative that they needed a kit to remotely monitor their tanks and provide them alerts so that they could take preventive actions in time and avoid heavy loss.
g. Type of alert required from kit: 60% of the farmers preferred an SMS as an alert, 33.3% preferred a mobile application and 6.7% wanted a phone call. The farmers wanted to get alerts through SMS without getting irritated with repeated calls.
h. Requirement of floating kit: The kit would float on the water surface and collect the water parameters from all over the pond for accurate analysis. 93.3% of the farmers wanted such a floating kit.
i. Whether kit is always immersible or when needed: 93.3% of the farmers preferred the kit to be always immersed in water and provide reading automatically.
j. Willingness to spend on the kit: This question highlights the purchasing capacity of the farmers. 46.7% percent of the farmers were willing to spend approx. 25,000 INR on the kit.
k. Parameters which recognize tank water quality: The survival of marine creatures depends on controlled physio-chemical parameters of the water.
Some of the most sought after parameters include pH, BOD, DO, Ammonia, Nitride, Alkalinity, water colour and water temperature. Biochemical oxygen demand (BOD) is the amount of oxygen required by microbes to degrade the organic matter under aerobic conditions [44]
These multiple physio-chemical properties of water depict the quality of water in the tanks and help the farmers in identification of any degradation in water quality. According to the survey, 93.3% of the farmers measure pH, 86.7% measure DO, 66.7% rely on amount of BOD, 80% measure nitride and 86.7% of the farmers also measure alkalinity in this physio-chemical multi-parameter measurement. Water colour is the most easily identifiable parameter which can depict any abnormal conditions in water.
l. Procedure of measurement of the above parameters: Once the parameters are identified, the next step includes the procedure to measure them. Sometimes, the farmers themselves measure and identify the parameters such as water colour or with an instrument such as thermometer. Other farmers have a collaboration with a lab technician who measures the parameters at regular interval of time and reports the readings to the farmers after physical and chemical analysis.
According to the survey, 33.3% of the farmers themselves measure the water quality of the tank out of which 6.7% use instruments such as thermometer and pH meter. 66.7% of the farmers rely on the visit of a lab technician who provides report after physical and chemical analysis.
m. Time required for alerts: Preventive actions can be taken when farmers can get alerts in time. 26.7% of the farmers prefer an alert or warning 12–24 hours prior to the degradation in water quality so that they can take preventive actions.
n. Action taken when water quality decreases in tank: To avoid heavy losses, the farmers take certain remedial actions to maintain the water quality of their tanks. Some of such remedies include applying medicines (66.7%), pumping freshwater into the tank (73.3%) and draining water from tank (33.3%).
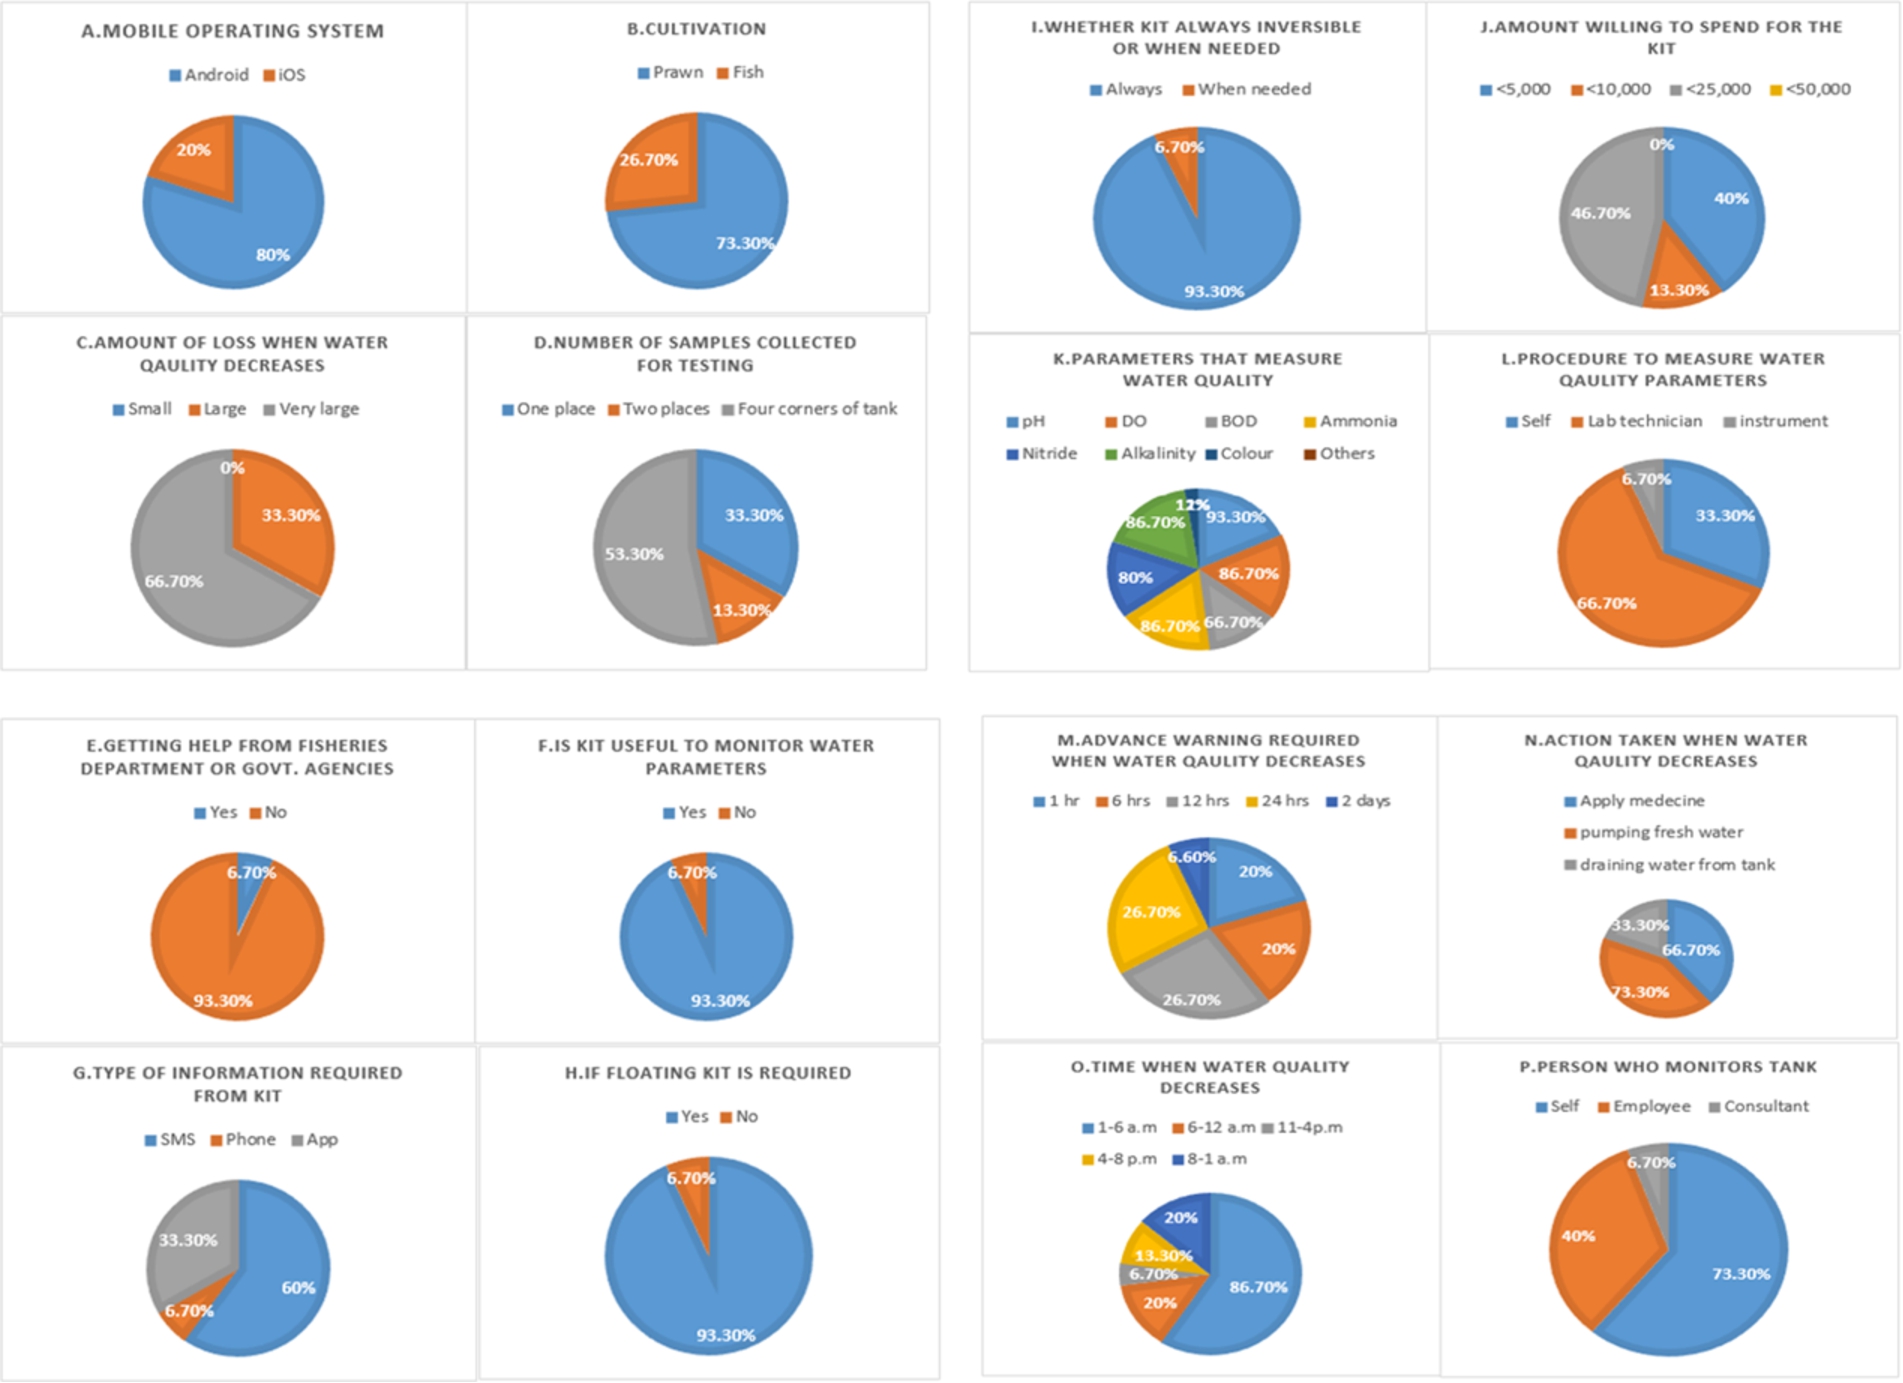
Analysis of the user interaction feedback form.
o. Time when water quality decreases: The physio-chemical parameters of water are not the same all the time but changes as per the season, time of the day, environmental conditions, high and low tides etc. This type of question helps in identifying time when more alerts are required to be sent to the farmers so that they could monitor their tanks and take preventive actions if required. The time range responded by the farmers include 1 a.m.–6 a.m. (86.7%), 6 a.m.–11a.m. (20%), 11 a.m.–4 p.m. (6.7%), 4 p.m.–8 p.m. (13.3%) and 8 p.m.–11 p.m. (20%).
p. Person who monitors the tank: If the farmer has prior knowledge of the water quality parameters, then he himself can monitor the water quality or else requires an externally employed agent such as a consultant. Sometimes, the farm owner is busy and hires an employee having knowledge of aquaculture to monitor the tank. The survey depicted that 73.3% of the farmers themselves monitor their tank, 40% hire an employee and 6.7% have a collaboration with a consultant who monitors the tank. A brief analysis of the response is depicted in the form of pie-charts in Fig. 1.
Personal interviews were conducted with 50 farm owners in their respective farms. The farm owners provided live demonstration of their farming techniques and enumerated their requirements. The size of the fields varied from minimum 2 acres to maximum of 50 acres.
Inferences
Design considerations adopted from such a survey are:
Design of a self-autonomous floating node to collect the water quality parameters. The sensor node design would consist of sensors meant to measure dissolved oxygen, pH, water temperature. The cost of the designed node is presumed to be kept lesser than INR 25000. The transmission medium to be chosen for the design varies according to the size of the field. The system designed should contain a provision of alerts.
Field visits
A ten-day field visit to Bhimvaram was conducted in the month of July 2016 to view the actual pond size and to get insight into the farming habits of the aquaculture farmers. The field visits were conducted in two phases. The first phase was understanding the current practice adopted by the farmers to measure the water quality of ponds. The second phase was testing the kit on the water surface to evaluate the effect of wind, water turbulence and rainfall on the kit. Such experiments guide in deciding the layout of the kit and in designing wireless sensor network for effective coverage of the field.
Phase 1: Visit to Fishery Department, Undi
The current practice adopted by the aquaculture farmers for monitoring the water quality of their ponds include collection of water sample from the ponds, rivers and performing physical and chemical testing in local laboratories. This work is performed by a lab technician or by the employee hired by the farmer in the field. Some of the chemical tests as seen in the fisheries department laboratory of Undi are depicted in Table 5 and the figures of the instruments are shown in Fig. 2.
Procedure of measurement of physio-chemical parameters of water in Fishery Department, Undi
Procedure of measurement of physio-chemical parameters of water in Fishery Department, Undi
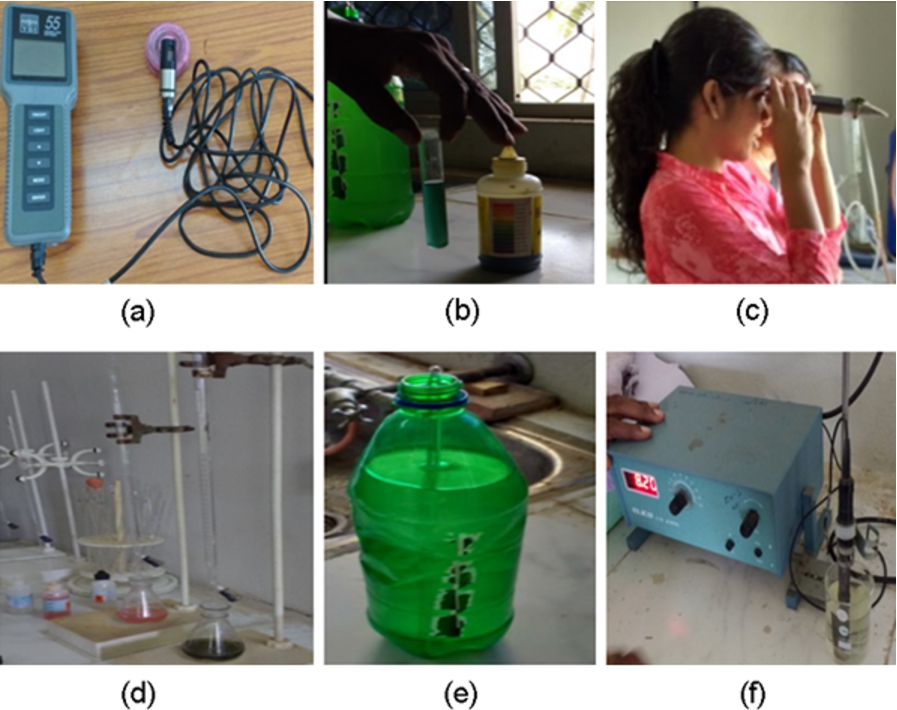
Instruments at Fishery Department, Undi for measuring water quality parameters: (a) Dissolved oxygen probe; (b) Colorimetric test; (c) A lab person checking water salinity through salinity refractometer; (d) Titration tests to measure alkalinity and hardness; (e) Thermometer to measure water temperature; (f) pH meter to measure pH.
Phase 2: Node design and case study
The project was carried out in collaboration with Intel and MHRD. Intel provided computing platforms and software tools to carry out the experiments and case study. Intel Edison is a computing platform for IoT based applications based on dual core Intel Atom 34XX processor working at 400 MHz. Intel Edison was chosen to be the most suitable computing platform in this project due to its built-in dual band (2.4/5 GHz) IEEE 802.11a/b/g/n Wi-Fi module on a Broadcom BCM43340 single chip quad device, which eliminates the need of interfacing any extra hardware peripheral to send data to the Internet. Intel Edison consists of 4 GB of eMMC flash in small BGA form factor to store user data and file systems. The Texas Instruments’ SNB9024 power management integrated circuit is specially designed for mobile computing platforms and provides high level integration to minimize board area and consists of subsystems for voltage regulations, A/D conversions, GPIOs and RTC. Moreover, Intel System Studio Studio software can be interfaced with Intel Edison to explore the architectural features and performance parameters. However, at later stages, the computing platform can be redesigned with the help of Intel for further compactness and efficient power consumption.
Sensor Description
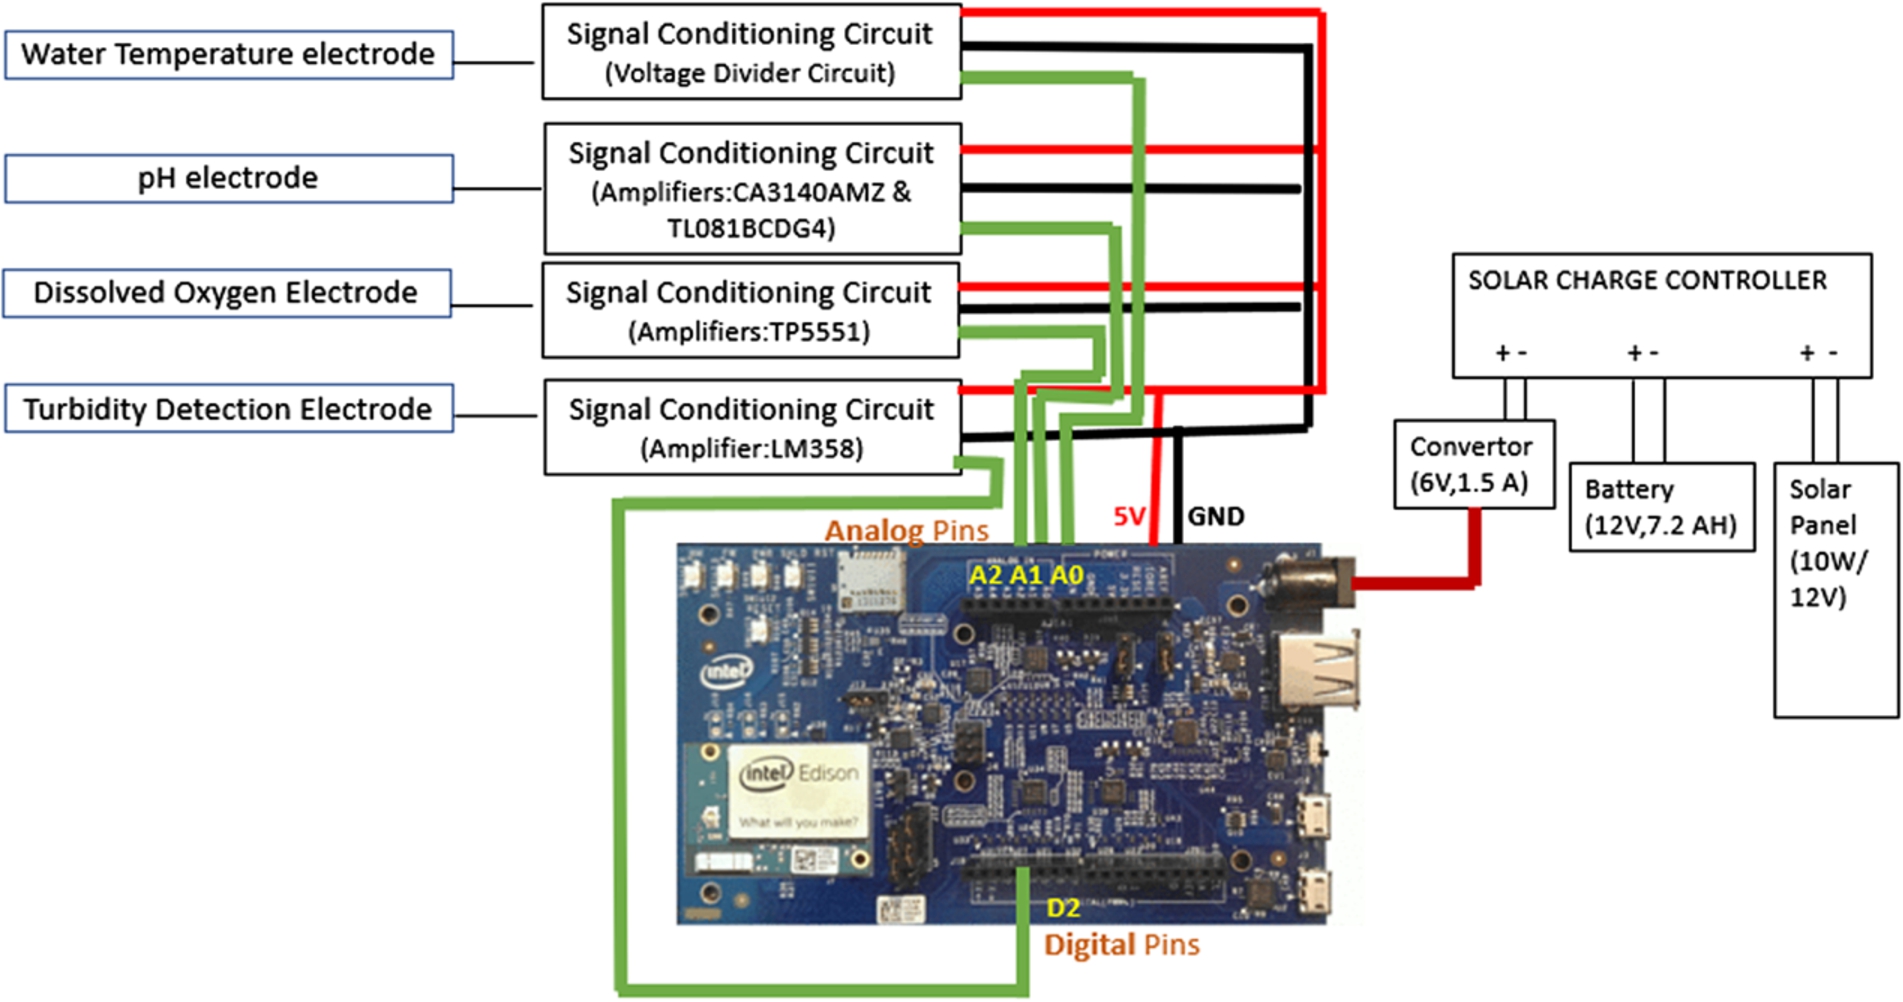
Block diagram of sensor node.
To evaluate the design requirements, a basic prototype was designed using Intel Edison SoC and with sensors which measure the physio-chemical parameters of water. Water temperature, pH, dissolved oxygen sensors and water turbidity sensors were interfaced with Intel Edison using the analog (A0, A1, A2) and digital pins (D2) respectively. Water temperature, pH and dissolved oxygen sensors were interfaced with the signal conditioning unit to get analog outputs. However, water turbidity sensor had built-in signal conditioning circuit and provided digital output when interfaced with Intel Edison digital pin. The accuracy of the sensors was 80% (water temperature), 85% (pH), 70% (dissolved oxygen) and 90% (turbidity sensor). Power consumption of sensor node is 0.6 W. Detail of sensors used in the prototype design are shown in Table 6. Block diagram of sensor node is represented in Fig. 3.
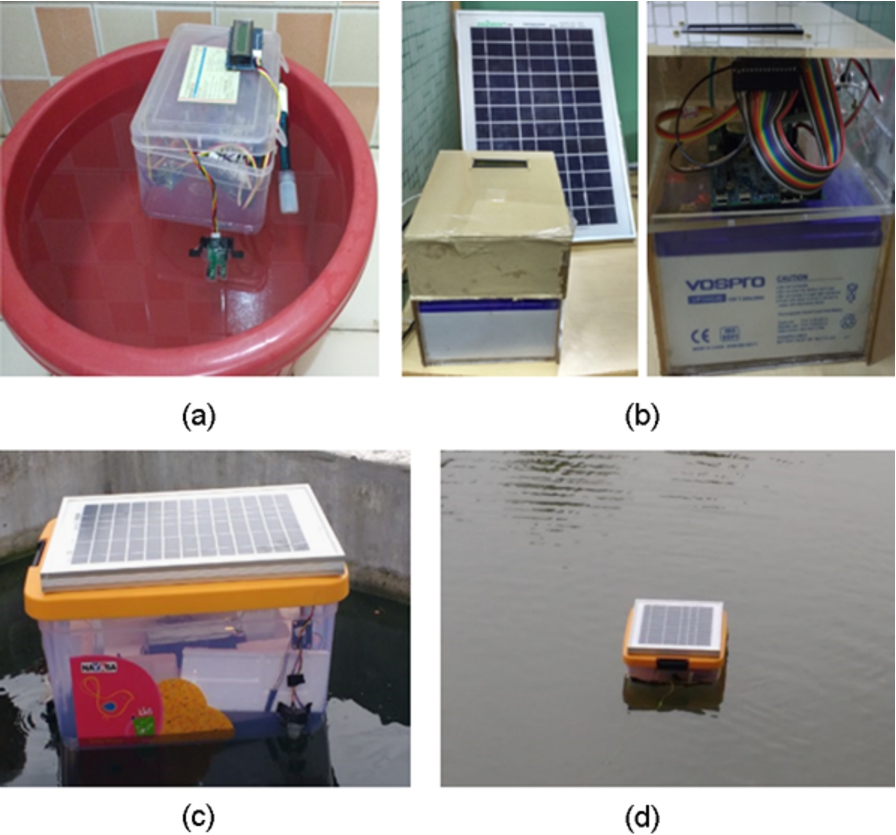
Node designs. (a) Version 1; (b) Version 2; (c) Version 3; (d) Version 4.
The
The
The
Such experiments and case studies gave an insight into the actual problems and requirements of the farmers of Godavari region regarding design and development of an aquaculture monitoring kit for the farming community. This enabled us to propose a self-sustaining floating boat design which can balance in the pond conditions. To evaluate the effect of rains and wind on the node, it was kept floating on the pond during adverse weather conditions and was found to be working efficiently.
Table 7 summarizes the node design experiments carried out at different places along with the disadvantage of each version. Figure 5 depicts the testbed where the testing was performed.
Summary of different versions of node designs
The survey and case studies were carried out in three phases which included literature review, user interaction and feedback and, field visits. The drawbacks captured in these arenas provided inputs to design and develop an optimal and efficient system to solve the problems faced by the aquaculture farmers of Bhimavaram.
The proposed solution is the design and development of wireless sensor network consisting of a floating self-autonomous solar power sensor node, an optimal and reliable sensor network, and an intelligent decision support system to record and store the readings for further analysis and provide alerts.
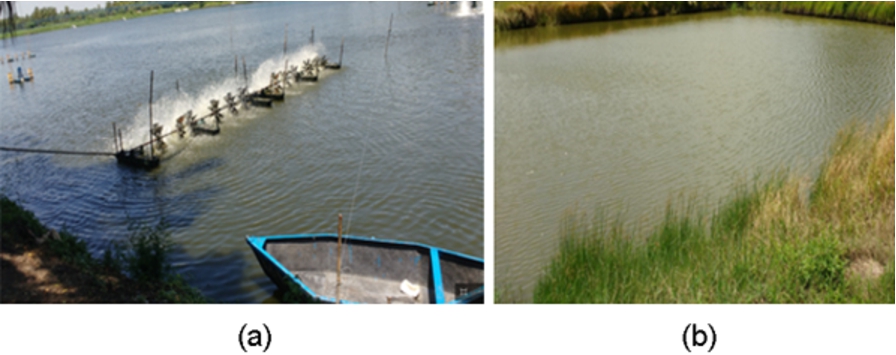
(a) 10 acres private aquaculture farm. (b) Fish Tank at Fishery Department, Undi.
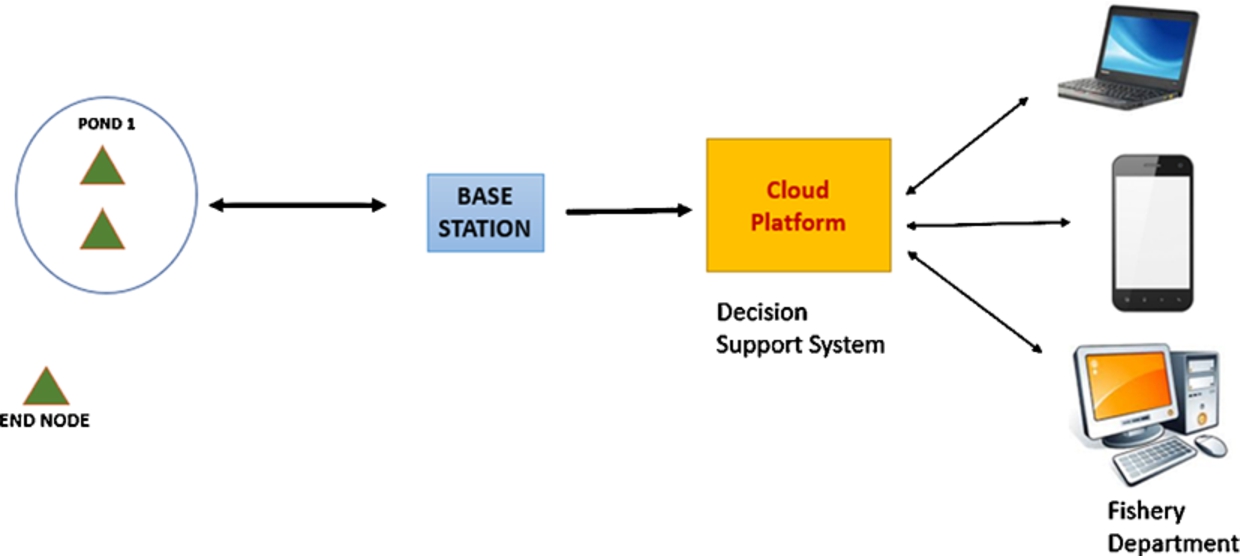
Architecture of proposed system.
However, the sensor node cannot be placed directly in water surface. An outer casing is required which provides protective rigid and robust support for the sensor node. Therefore, a vehicular boat-based design is proposed which would perform multiple functions for the aquaculture farmers. The vehicle would move on the water surface and collect water parameters across the pond, process and send this information to the monitoring unit through a base station. This vehicle would be equipped with motors which would turn on when the dissolved oxygen level drops from the threshold values.
It would also have a provision to accommodate one farmer for manual mode of operation in case of power failures. The pond parameters would be accessible through the mobile application or through web login to registered users, most commonly the aquaculture farmers and employees of fishery department. Alerts will be sent to the farmer in case of deviations of water parameters.
Figure 6 depicts the architecture of the proposed system.
This paper presents the importance of incorporating wireless sensor network for aquaculture in India for remote monitoring and automation. A comprehensive review of design of WSN for aquaculture through literature review, user interaction feedback and field visit are presented. The problems captured through this survey led to proposal of a vehicular based self-autonomous node design to monitor and control the water quality parameters of ponds in western Godavari region of India.
Such a system would solve the existing problems of aquaculture farmers and help them lead a better quality of life.
The implementation of the autonomous vehicle and sensor node will be addressed in future work.
Footnotes
Acknowledgements
We would like to thank our collaborators at SRKR Engineering College, Bhimavaram (Prof. Ramprasad Kalidindi, Mr. Chalapathi Raju, Mr. Gopala Raju PV) for providing us with initial support for performing survey and case studies. Special thanks goes to Dr. Prof. MBK Prasad for sharing his expertise on marine animals and their lives. We would also like to extend our heartfelt thanks to Intel and DIC (MHRD) for providing prototyping platform to carry out our experiments.