
Abstract
Smartphones, with built-in array of sensors, provide an opportunity to ubiquitously collect user’s behavioral data. This leads to variety of founding applications that identifies interesting patterns in the smartphone data to learn human behavior. In this paper, we propose an approach that enhances the productivity of individual’s by unobtrusively learning their routine through smartphones. We design and develop a non-intrusive smartphone app – Prodmapp that periodically collects sensing data from user’s smartphone. We extract several potentially useful behavioral features from the data and perform correlation analysis among the features and user’s productivity score (ground truth). We collect 15 days sensing data from 10 users through Prodmapp. Ground truth is collected from the users in the form of questionnaires to quantify their productivity. The results showed that there exists a significant correlation among several behavioral features and user’s productivity score. Finally, we train and evaluate a prediction model using significantly correlated features that can predict the change in productivity of users by analyzing the variation in feature values. We train three classifiers i.e., logistic regression, SVM and KNN to compare their performance on the two benchmark datasets, one collected through Prodmapp and other from CASAS smart home project. Results shows that our proposed approach performs well and all three classifiers achieve good prediction accuracy on both datasets.
Introduction
Productivity is defined as “The amount of the efficiency of an individual in converting inputs into useful outputs” [32]. Improved personal productivity increases a person’s ability to complete their tasks in timely manner, which may lead to a balanced and healthy life.
Productivity monitoring apps are one of the categories of smartphone apps that aims to help people in effective time management, and to improve their productivity. Currently, these apps are used as the only tool to enhance a person’s productivity. However, the problem is that existing productivity monitoring systems [9,15,25,33,37,38] are intrusive in nature and requires continuous human interaction. Users add their daily or weekly to-do tasks, then these apps calculate their daily or weekly productivity score after tracking their smartphones and laptop usage. Users must launch the app daily to view their productivity score and other statistics-based feedback these apps provide. This continuous interaction of users with the app can be burdensome for them, and reduces their interest in using these apps. Another limitation is that these apps can not keep track physical activities of users such as visits to different locations and the time spent there, the social application usage etc, which may also effect individual’s productivity. Moreover, existing productivity monitoring apps [9,15,25,33,37,38] do not predict the change in productivity of users by analyzing the historical and current pattern of their activities.
Smartphones, because of its ubiquitous nature and powerful sensing capabilities, can keep track of individual’s physical activities, locations and social apps usage in a non-intrusive way. Several studies [6,12,26,34,41] have demonstrated the use of smartphone sensing data to find a set of behavioral features that can potentially help to assess mental health [34], depression [6], mood [26], and academic performance [41]. Intuitively, in a similar manner, behavioral features can be potentially useful in inferring productivity of individuals. To best of our knowledge, none of the study till now makes use of smartphones to ubiquitously monitor and enhance the individual’s productivity.
In this paper, we propose a productivity enhancement tool that unobtrusively learn the daily routine of a smartphone user. Specifically, we identify various behavioral features from the smartphone sensing data that can be correlated to individual’s productivity. Finally, using significantly correlated features we develop a prediction model that can predict the change in productivity of users by analyzing the variation in those feature values. To summarize, the contribution of this paper is threefold.
First, we design and develop a non-intrusive smartphone app – Prodmapp on android platform to collect sensing data from number of users. We have specifically collected continuous 15 days location, physical activities and social apps usage data from 10 users through Prodmapp.
Second, we define set of location, activity and social apps usage features that can be extracted from the sensing data, and using the ground truth data collected by means of the same android app. We then perform correlation analysis between the extracted features and user’s productivity score to pick the best features that can be associated with user’s productivity.
Third, we propose a prediction model using significantly correlated features that can predict the change in productivity of users by analyzing the variation in feature values.
The rest of the paper is organized as follows: In Section 2 we provide a brief overview of relevant literature. Section 3 presents our proposed productivity monitoring approach. Section 4 presents the evaluation and discussion. Finally, Section 5 presents the conclusion and future work.
Related work
Behavior monitoring/prediction approaches are applied in multiple domains such as computer usage behavior [9,19,25,28,44], mood detection [26,27,43], stress/depression detection [5,6,29,34], sleep behavior [8,18,21], academic performance [22,24,35,41] and analysis of daily activities of a smart home resident [14,20,42].
Computer usage behavior refers to the frequency of usage of various kind of apps. Various studies [9,19,25,28,44] shows that high computer usage lead to loss of personnel productivity.
In [44], authors performs an intensive study on big data set with 3000 subjects to analyze the people task-switching behavior of computer usage. Authors through various task switching measures find that a very few set of tasks are involved in task switching activities such as online chatting, web browsing, document editing and online shopping. Moreover, this study also discovers that younger people are more habitual of constant task-switching or multi-tasking activities.
Authors in [28] explore the relationship between three email usage patterns, workplace productivity and stress. These three email use patterns are duration, interruption habit, and batching. Email usage was tracked via biosensors, computer logging and daily surveys from 40 workers for 12 workdays. Results of the study shows that the people who spent longer daily time on email has low productivity and high stress. With high email use, people who chose when to self-interrupt to deal with email has high productivity at the end of the day as compared to those who check email triggered by email notifications, and to those who check email consistently. Moreover, Batchers i.e. people who cluster email use also has high productivity.
In [19], authors investigate a link between over usage of smartphone and loss of productivity. To serve the purpose, self-report data via online questionnaire was collected from 262 participants to estimate their private and work-related smartphone use, smartphone addiction and self reported productivity. Results of the study shows a moderate relationship between smartphone addiction and a self-reported decrease in productivity due to spending time on the smartphone during work.
Researchers propose various productivity enhancing mobile applications [4,9,25] that captures the computer usage behavior of the users, and help them in reducing the usage frequency of distracting apps. For instance a productivity monitoring system TimeAware is proposed in [25], that enhances users productivity by capturing their computer usage behavior, and provides feedback through ambient widget technology. TimeAware uses framing effect technology to improve user’s productivity. Framing effect refers to showing identical information to users in two different ways with different wordings and different colors. Users may react differently to the identical information framed differently. Users have to launch TimeAware every time to view the detailed statistical feedback it provides.
Collins et al. [9], proposes RescueTime to improve individual’s daily productivity. RescueTime is a laptop/desktop app that monitors computer usage. In RescueTime, users need to specify the tasks they want to complete daily or weekly. RescueTime blocks distracting websites when the usage exceeds certain threshold time, set by the users. RescueTime provides the feedback to users through a web-based dashboard.
Authors in [4], forensically investigate 30 popular android productivity monitoring applications to devise a classification scheme. The classification scheme includes the categories of apps, and categories of artifacts that these apps contain such as timestamps, user location, task, messages and notes, contact information etc. These artifacts are extracted during the analysis of all apps. The purpose behind devising such classification is to allow end users to know what personal data remnants are available from the productivity apps. Moreover, the propose classification can warn users of the security implications of using any app.
Existing productivity enhancing mobile applications are intrusive in nature, and requires continuous human interaction. This continuous interaction of users with the app can be burdensome for them, and may reduces their interest in using these apps. Additionally, these apps are limited to computer/technology use, and do not monitor individual’s daily activities which are also important in understanding productivity. Moreover, there is no mechanism in these apps to learn the current routine of users, and predict the change in their productivity.
Smartphones due to its enormous sensing capabilities and portability can be used to monitor human behavior [19]. A comprehensive literature review on monitoring human behavior via smartphone sensors is performed in [19]. The study classifies the various behaviors that can be captured using smartphones and their embedded sensors. These behaviors are movement behaviors, social behaviors and other daily-life activities. Author believes that monitoring human behavior via smartphone sensing methods is a promising area of future research.
Mood refers to a generalized state of feeling and temporary state of mind. Mood plays a significant role in our lives, influencing our behavior, driving social communication, and work productivity. Therefore, it is necessary to recognize and improve individual’s mood state. Smartphones with built in array of sensors can be used to identify an individual’s mood state non-intrusively [26].
Zenonos et al. [43] explores the possibility of using smartphones and wearables embedded with physiological and movement sensors for mood recognition at workplace. This study propose the mood recognition framework that can identify five intensity levels for eight different types of moods after every two hours. A smartphone app “HealthyOffice” is also propose to collect ground truth. Sensing data is collected in an office environment to evaluate the framework. Results of experiments shows that the propose framework is able to recognize various classes of moods.
Smartphones are also used to monitor the depressive mood of people non-intrusively by examining their mobility patterns from GPS traces [6]. Moreover, a prediction model is proposed to predict changes in depressive mood of users by examining their movements [6].
Authors in [27] identifies the various behavioral features such as temporal features, accounting features and visibility features by analyzing the Wi-Fi radio signals. The goal is to monitor the staff’s behavior and mood to improve their wellness, reduce energy consumption in office, and understand their working patterns to enhance their productivity.
Padmaja et al. [29] shows that smartphones can be used to monitor the individual’s stress level unobtrusively. Authors presents a cognitive stress-level detection system namely Detect Stress, that can monitor the individual’s stress level unobtrusively based on smartphone daily activity data, and wireless physical activity tracker (FITBIT) data. FITBIT records an individual’s daily logs of food, weight, sleep patterns, heart rate, and physical activities.
Routine behavioral features are captured through smartphone GPS and usage sensors to identify the signs of depression among individuals [34]. A prediction model is trained using highly correlated features to predict mental health of people [34].
In [5], author investigates whether the smartphone sensing data can serve as behavioral markers for individual’s mental health. Results of the study shows that unobtrusively collected sensing data via smartphones can be related with individuals’ daily levels of stress. Moreover, sensing data can be related with changes in depression, stress, and subjective loneliness over time.
Good sleep is necessary for a individual’s health and well-being. Insufficient and irregular sleep effect person’s behavior, mood and work productivity. Therefore, it is essential to detect and improve individual’s sleep behavior. Smartphones due to its enormous sensing capabilities and portability can be used to monitor individual’s sleep behavior non-intrusively [18].
Author in [21] aims to monitor basic sleep behavior and irregular sleep nights through smartphone sensing. Author propose supervised learning approach to predict basic sleep parameters such as bedtime, wake time and sleep duration with a light-weight context sensing schedule. 14 weeks sleep data is collected from 18 participants to evaluate the proposed approach. Result shows that the propose approach performs well with average bedtime and sleep duration errors about 24 and 41 minutes respectively. Moreover this study also propose a novel unsupervised context profiling approach to detect irregular sleep night.
Chen et al. [8] propose a novel approach to infer person’s sleep behavior through smartphone sensors in a completely unobtrusive way. A sensor based inference algorithm predicts sleep duration by collecting and analyzing various smartphone usage patterns and environmental observations.
Comparative analysis of related work
Comparative analysis of related work
A system namely iSleep is propose in [18] to monitor an individual’s sleep quality unobtrusively using smartphone. iSleep via smartphone’s built-in microphone monitor the users activities that can effect their sleep quality such as body movement, couch and snore and then deduce quantitative measures of sleep quality.
Smartphone sensing data can be used to assess and improve student’s academic performance by controlling their overusage of smartphone, social activities and ultimately enhancing their work productivity [41].
Wang et al. [41] shows that the various behavioral features extracted from the smartphone sensing data such as study duration, party duration, conversation duration, conversation frequency, mobility etc. can be used to asses the academic performance of students. They also propose a prediction model that can predict student’s CGPA accurately by using the propose features.
In [24], author investigates the effects of smartphone’s overusage on academic performance of higher learning student. A survey was conducted from 100 students having smartphones regarding the usage of smartphones and their academic performance. Results after analyzing the data shows that there exists a negative correlation between smartphone usage and academic performance of higher learning students.
Author in [35] discovers that smartphone addiction risk is positively related to stress, but the stress is negatively related to satisfaction with life. Moreover a smartphone addiction risk is negatively related to academic performance, but the academic performance is positively related to satisfaction with life.
Janko et al. [22] propose a smartphone app namely e-Gibalec that monitors schoolchildren’s physical activities through built-in sensors and reward them in a game-like manner.
In [31], author presents and validate a method for measuring energy expenditure by people during physical activities such as standing, gym, walking, climbing stairs, jumping, running, playing tennis and squatting. Physical Activities data is collected through smartphone sensors by healthy people with ages between 12 and 50 years old. The validation of the propose method demonstrates that the energy expenditure is underestimated and super estimated in few cases, but with reliable results.
Kang et al. [23] classifies the various types of sensors that can be used for providing different kind of services in the smart home. Author also estimate the importance of each sensor with the help of sensor tree.
A smartphone inertial sensors-based approach is propose in [20] for human activity recognition in smartly controlled environment such as smart homes. Various meaningful features are extracted from raw data. After processing of extracted features, the features are trained with a Deep Belief Network (DBN) for successful activity recognition.
In [42], authors propose a model that uses massive volume of data generated by the various smart devices in smart home as a means of learning and discovering human activity patterns for health care applications.
A comprehensive literature review is discussed in [3] to summarize the latest smart wearable body sensors and their application for clinicians. These wearable sensors such as accelerometer, inertial, pedometers, motion, ultrasound, ECG electrodes etc. can be used to non-intrusively monitor patient’s various health markers.
In this section, we have seen that researchers in several studies demonstrate the use of smartphone sensors to ubiquitously learn different types of human behavior. Each of the related study broadly extracts meaningful features, and use them to predict human behavior. In this paper, we identify the potentially useful behavioral features from the sensing data that may be associated with individual’s productivity behavior. To the best of our knowledge, this is the first work that learns the person’s productivity of an individual using smartphone sensors.
Table 1 shows the comparative analysis between few studies we include in our related work.
High-level overview of our approach.
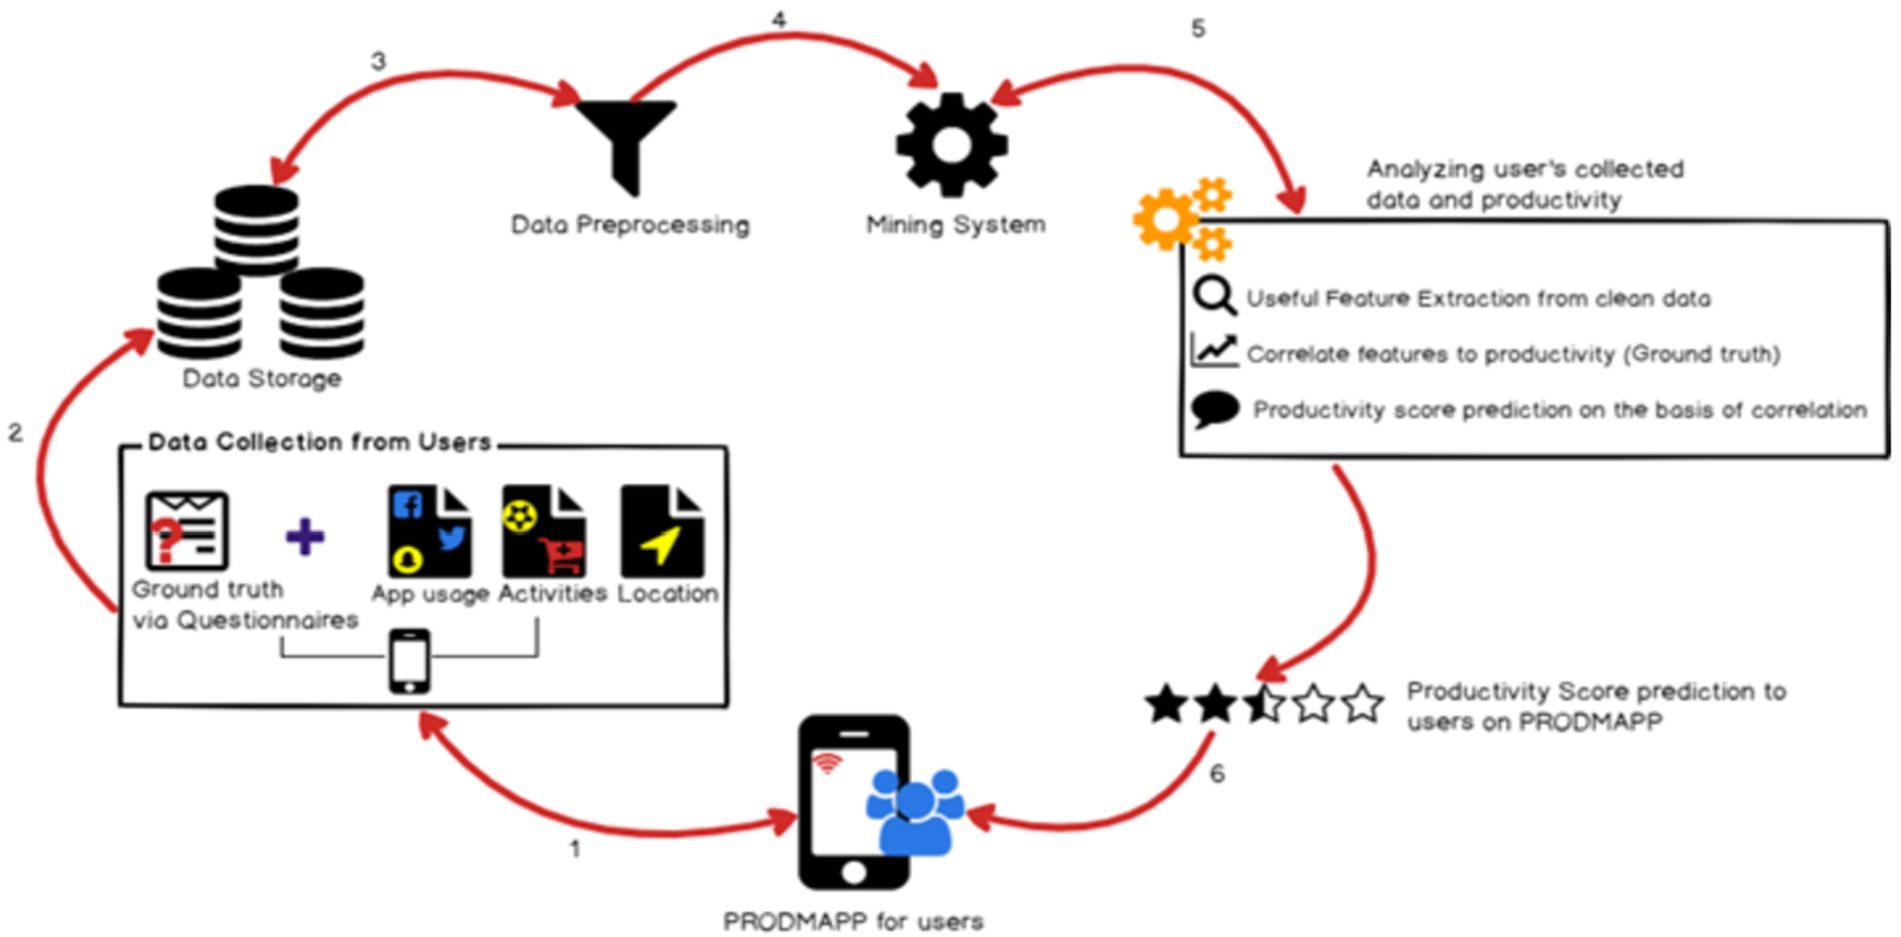
In this paper, our goal is to extract the potentially useful behavioral features from the smartphone sensing data that are useful in understanding the impact of daily routine on productivity. To accomplish this, we devise a methodology which is described in the following steps:
First, we develop a non-intrusive smartphone app – Prodmapp on Android platform. We choose Android platform because it is widely used mobile operating system used by over billion people [4]. Prodmapp keeps track of visited locations, physical activities, and social app usages of users through various smartphone sensors. We collect ground truth through same app in the form of questionnaires to quantify user’s productivity. In the next step, Prodmapp stores all the raw sensing data collected from different sensors (in Step 1) in the user’s phone, and then to a shared repository, where the analysis is performed. In this step, we extract the raw sensing data of all users from the shared repository, and pre-process it to remove noise and outliers. In the next step, we extract various potentially useful behavioral features from the processed data, and perform correlation analysis between the features and user’s productivity score (ground truth). Finally, we train and evaluate a prediction model using significantly correlated features that can predict the change in productivity of users by learning the variation in feature values.
The visual representation of our proposed methodology is shown in Fig. 1.
Design and development of prodmapp
The first step of our approach is to design and develop a non-intrusive smartphone app – Prodmapp. The primary purpose of Prodmapp during this study is to non-obtrusively monitor the user’s routine activities such as visit to different locations, physical activities, social apps usage and save this sensing data for further analysis. In the following sub-sections, we briefly discuss the various sensors that are used in Prodmapp.
Location We integrate Google Places API [16] in Prodmapp that uses location sensor to keep track of user’s visited locations. It returns the user’s current location name, address, longitude, latitude, likelihood, and datetime after every 15 minutes. The reason behind choosing 15 minutes delay in location detection of the user is to reduce the battery consumption while still getting enough location instances.
Activity In order to detect user’s physical activities, we integrate Google Activity Recognition API [1]. The API returns the detected activity (i.e., running, walking, in vehicle etc), their likelihood and datetime. The data is collected after every 15 minutes. The reason behind choosing 15 minutes delay in activity detection of the user is to detect the activity parallel to location of the user.
Social apps usage To detect the social apps usage of users, we use the built-in android class UsageStatsManager [39]. It returns the names of social apps that a user is using such as Facebook, Twitter, Instagram, Snapchat, Youtube, Messenger and Gmail after every 15 minutes. The reason behind choosing 15 minutes delay in detecting the social apps usage of the user is that we are interested in finding out the social apps used by the user at a particular location which itself is detecting after every 15 minutes. In this work, we limit our analysis to the widely used social apps i.e., Facebook, Twitter, Instagram, Messenger, Snapchat, Youtube and Gmail.
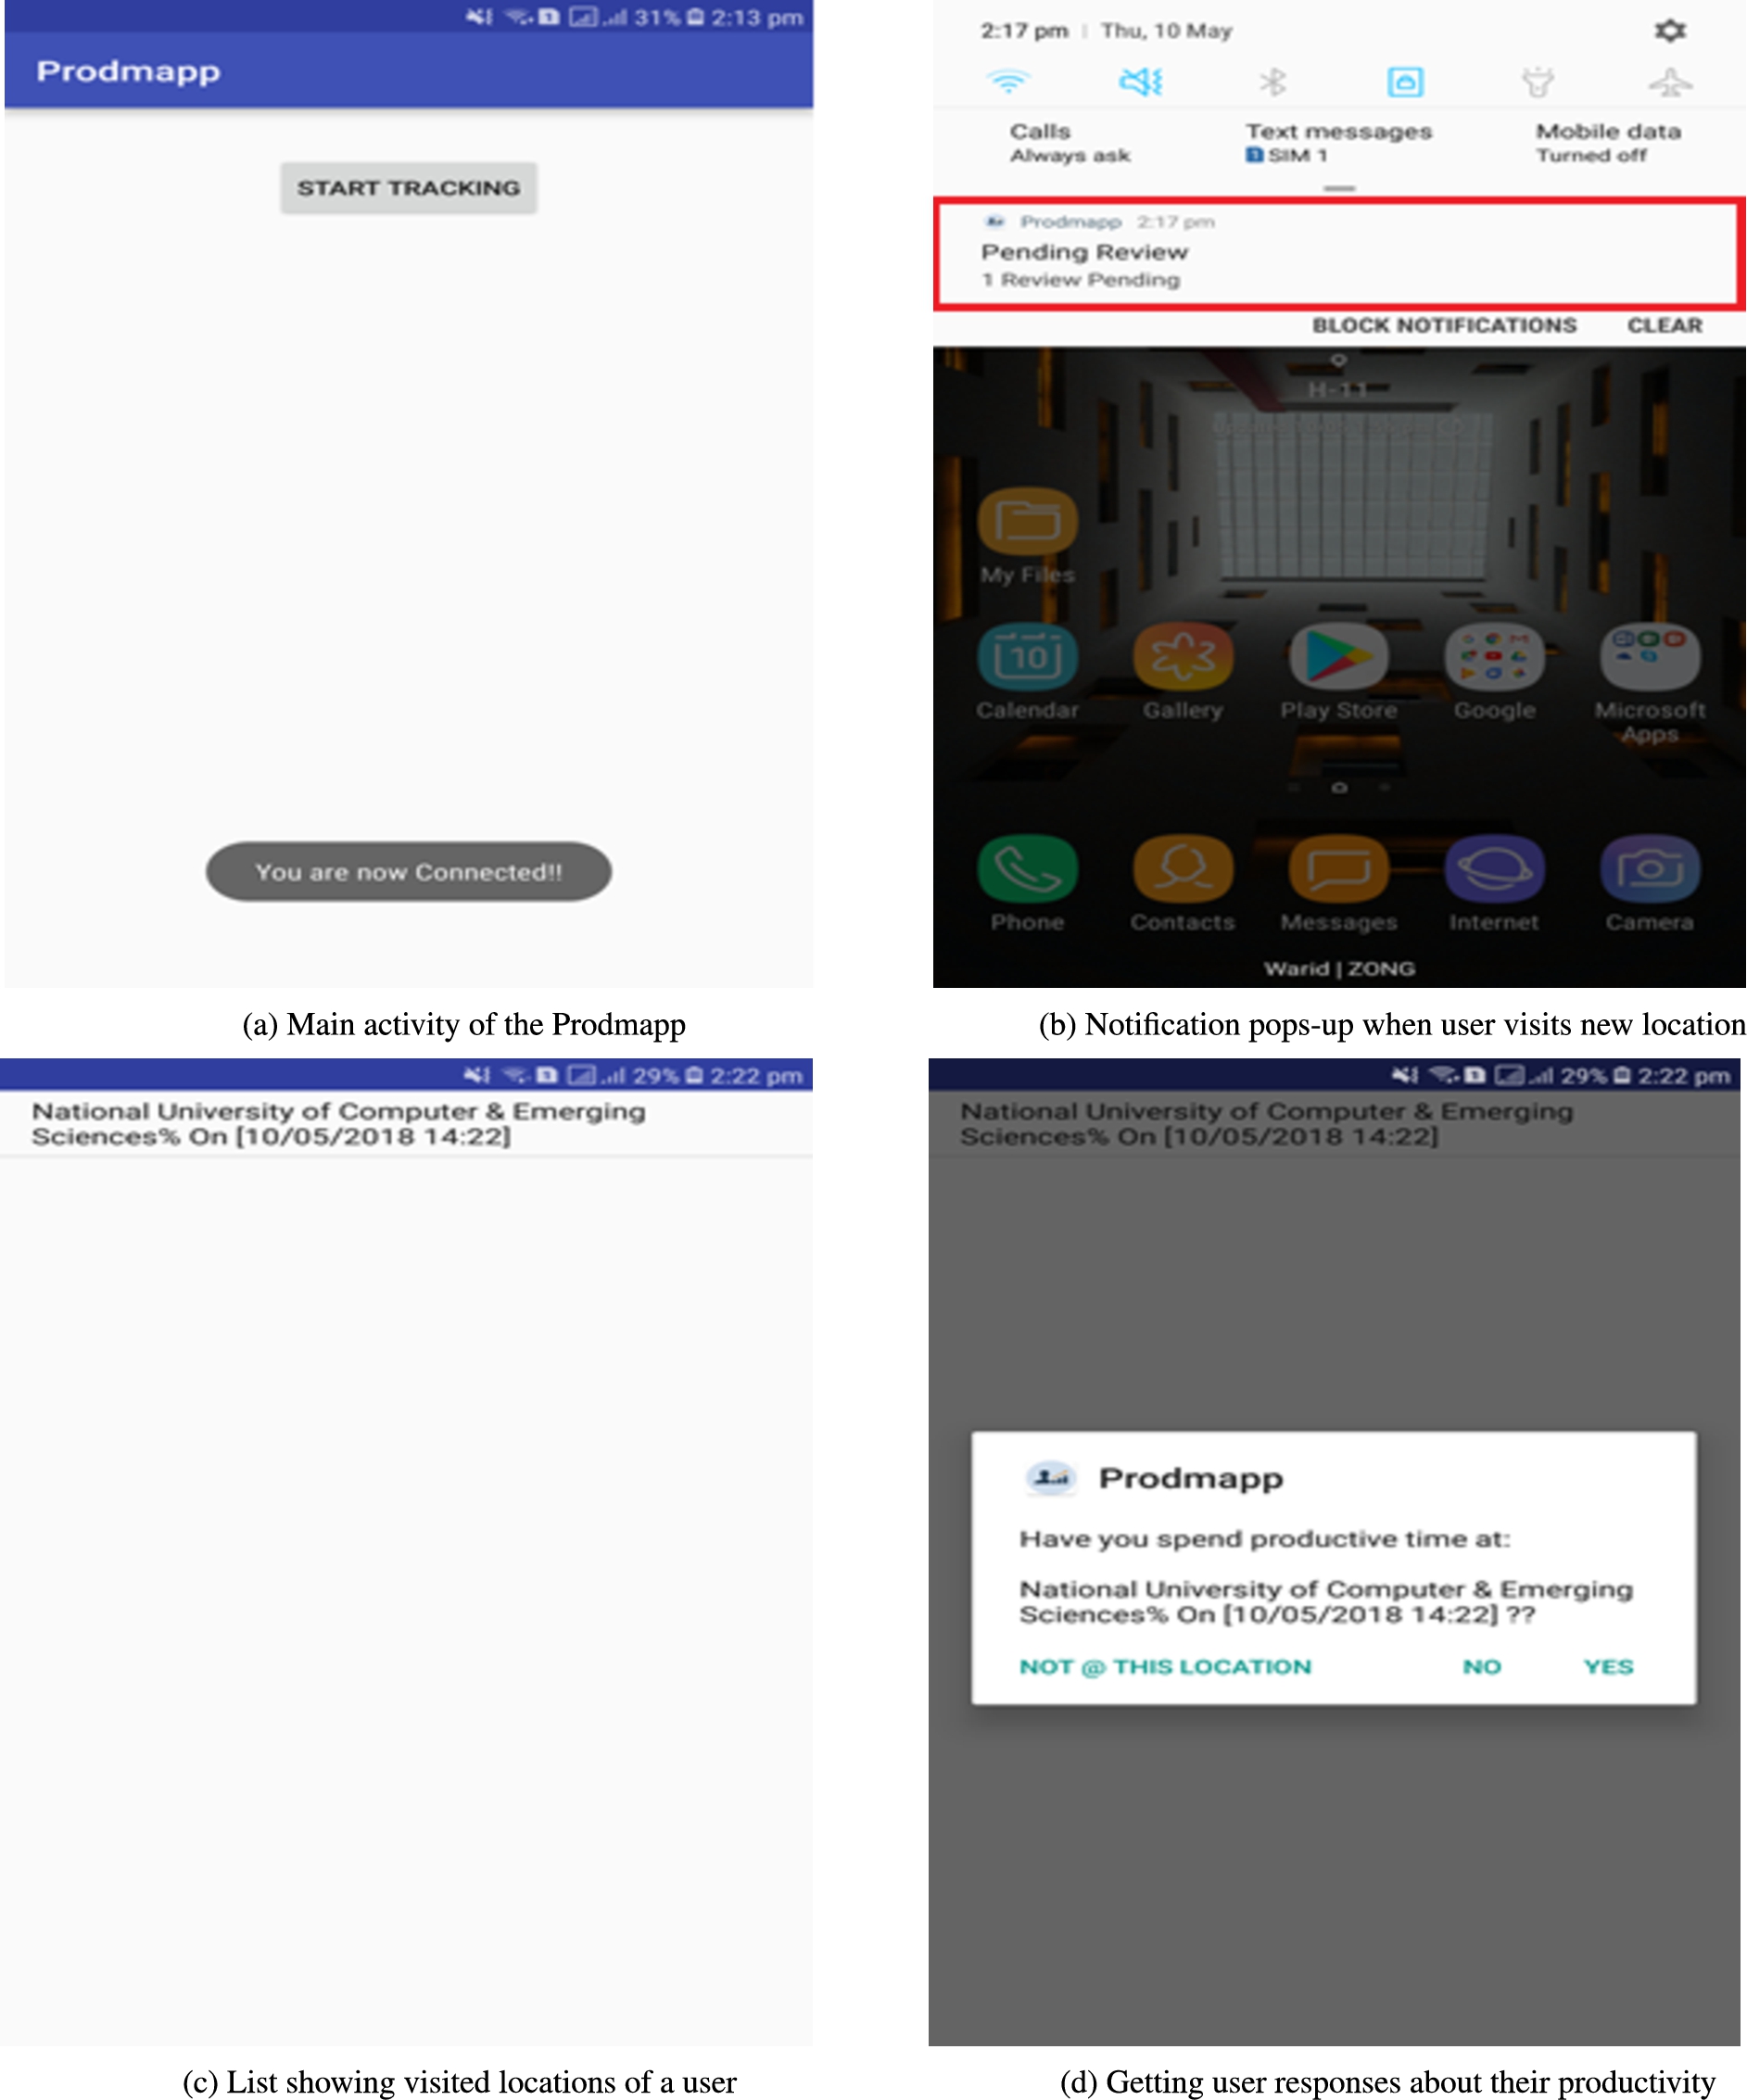
Graphical user interfaces of prodmapp.
Ground truth We design a questionnaire in Prodmapp to collect the ground truth from users in order to quantify their productivity. Whenever the user visits a new location in a day, Prodmapp pops up a notification on notification drawer (See Fig. 2b). When user clicks on that notification a list will appear which display the visited locations of user (See Fig. 2c). When user clicks on a particular location a dialog box will appear that asks user a question that “Whether his visit at that particular location is productive or not?” (See Fig. 2d). If user answers “Yes” than a productivity score 1 is added against that location, otherwise 0 is added. There is no need for a user to respond to question immediately and user can answer at any time within 24 hours.
We started to gather the ground truth from users after every 5 minutes but we found that it was burdensome for them and they were ignoring the pop-up notifications. We then reduce the frequency of the notifications so that we may get ground truth instead of no responses. Also, we learnt that it’s not a good idea to force the user to give responses at the same time when notification pops up and keeping in view the memorability issues, we kept the number of notifications low. Currently, Prodmapp asks users about their productivity after every 15 minutes and at the same time gathers their location, activities and social apps usage data.
Prodmapp GUI and data storage We design the GUI of Prodmapp extremely simple to keep the things easy for users during data collection process. It displays just one button on main activity (See Fig. 2a). When user press that button, Prodmapp starts running in the background as a service, and tracks user physical activities, visited locations, social apps usage, generate timely notifications to gather ground truth and store all this data in the user’s smartphone in CSV file. We choose Prodmapp to run as background service on user’s smartphones because we want to collect the sensing data non-intrusively without burdening user to launch the app every time in order to track their location, activities and social apps usage.
In this study, we have collected the data from 10 users through Prodmapp. The users were the hostelite students of three different universities of Islamabad Pakistan that spend most of their time in university and hostel. Out of 10 users, 6 students were from FAST University, 2 from NUST University and 2 from TMUC University. The age range of the users were 19 to 26 years. The detailed profile of each user is shown in the Table 2.
Profile of the participants
Profile of the participants
The reason to choose student population for this experiment was that they were easily accessible to us and willing to participate in this experiment voluntarily. We could easily access the participated students daily to ensure that our app is up and running on their smartphones and gathering the sensing data. Moreover, to be productive is the major challenge for every student.
At the start of the data collection, we requested 18 users to fill an online Google Form that contained few general questions about them such as name, age, email, cell number, smartphone owns and workplace/university name. After analyzing the information provided by users through these forms, we have selected 13 users for the data collection, but 3 users faced some issues in their smartphones after installing Prodmapp and politely refused to be a part of data collection process. The remaining 10 users provided us complete 15 days’ data and there were no big issues in their data. The number of data samples collectively of all 10 users were 1407.
During the selection of users for data collection, only those users were selected in the experiment that owns latest model Samsung smartphones having Android Nougat or higher installed. The reason behind selecting such users was the better sensors quality and good battery timing of Samsung smartphones. Before app deployment on the smartphones of selected users, we tested our app on various Chinese manufactured smartphones too such as OPPO, VIVO and QMobile. But these phones were not able to provide the accurate location and activities data due to low sensors quality. Even some of these phones were not able to support the Activity Recognition API.
We also observed that Prodmapp was draining the battery of the smartphone of some users at very fast rate. The reason was that initially Prodmapp was sensing the user’s location through GPS after every 5 minutes. We overcome this problem to large extent by increasing the location sensing time from 5 minutes to 15 minutes. After every 15 minutes, GPS enables, sense the location and then disables. This drastically improves the battery performance of user’s smartphone.
Aruba dataset In order to evaluate the performance of our proposed approach, we have used the publicly available Aruba dataset from CASAS smart homes, a project of Washington State University [7] to quantify the productivity of housewife. The dataset comprises of 6471 instances of daily life activities data obtained using 31 motion sensors, 3 light sensors, 5 temperature sensors and 3 door sensors. 11 daily life productive and non-productive activities were performed by housewife for 220 days (7 months). Out of 11 activities, the productive activities includes Housekeeping, Meal preparation, Eating, Wash Dishes, Enter Home, Work whereas non-productive activities are Sleeping, Relax, Leave home, Resperate, Bed to Toilet. Unlike our dataset, the location data was not included in this dataset.
In this step, we processed the collected raw data to remove noise and outliers. We performed data preprocessing in two steps:
In first step, we removed all those location and detected activities samples from the data files of all users where likelihood was below
The second step of our data preprocessing phase was clustering location data to find the significant locations that a user visited during the study period. We used a well-known data clustering algorithm known as Density-based spatial clustering of applications with noise (DBSCAN) [13]. DBSCAN groups together points which in our case are locations that are close to each other based on distance measurement and a minimum number of points. DBSCAN algorithm requires two parameters; Eps and Minpts. Eps refers to the minimum distance between two points, and Minpts refers to the minimum number of points required to form a dense region. We chose the values of Eps and Minpts as 0.4 and 4 respectively.
The reason behind using DBSCAN algorithm is that we do not need to specify the number of clusters prior to clustering like other data clustering algorithms such as k-means, Gaussian mixture model (GMM) etc. In this study, clusters represent the number of locations that a user visited during a day.
We applied clustering to only location samples that were in stationary state (i.e., a user is still) instead of transition state (i.e., a user is walking in the street, or driving a car, and his location changing frequently) because we are interested to determine the locations where users usually spend most of their time like home, workplace, restaurants etc. To eliminate the transition states of a user prior to clustering, we calculate the speed between two location points, and if the speed was greater than 1 km/h, we exclude those points before clustering. Figure 3a showing the transition points of one user we map through GPS visualizer [17] on geographical map. Figure 3b demonstrating the location clusters with labels we obtained after clustering.
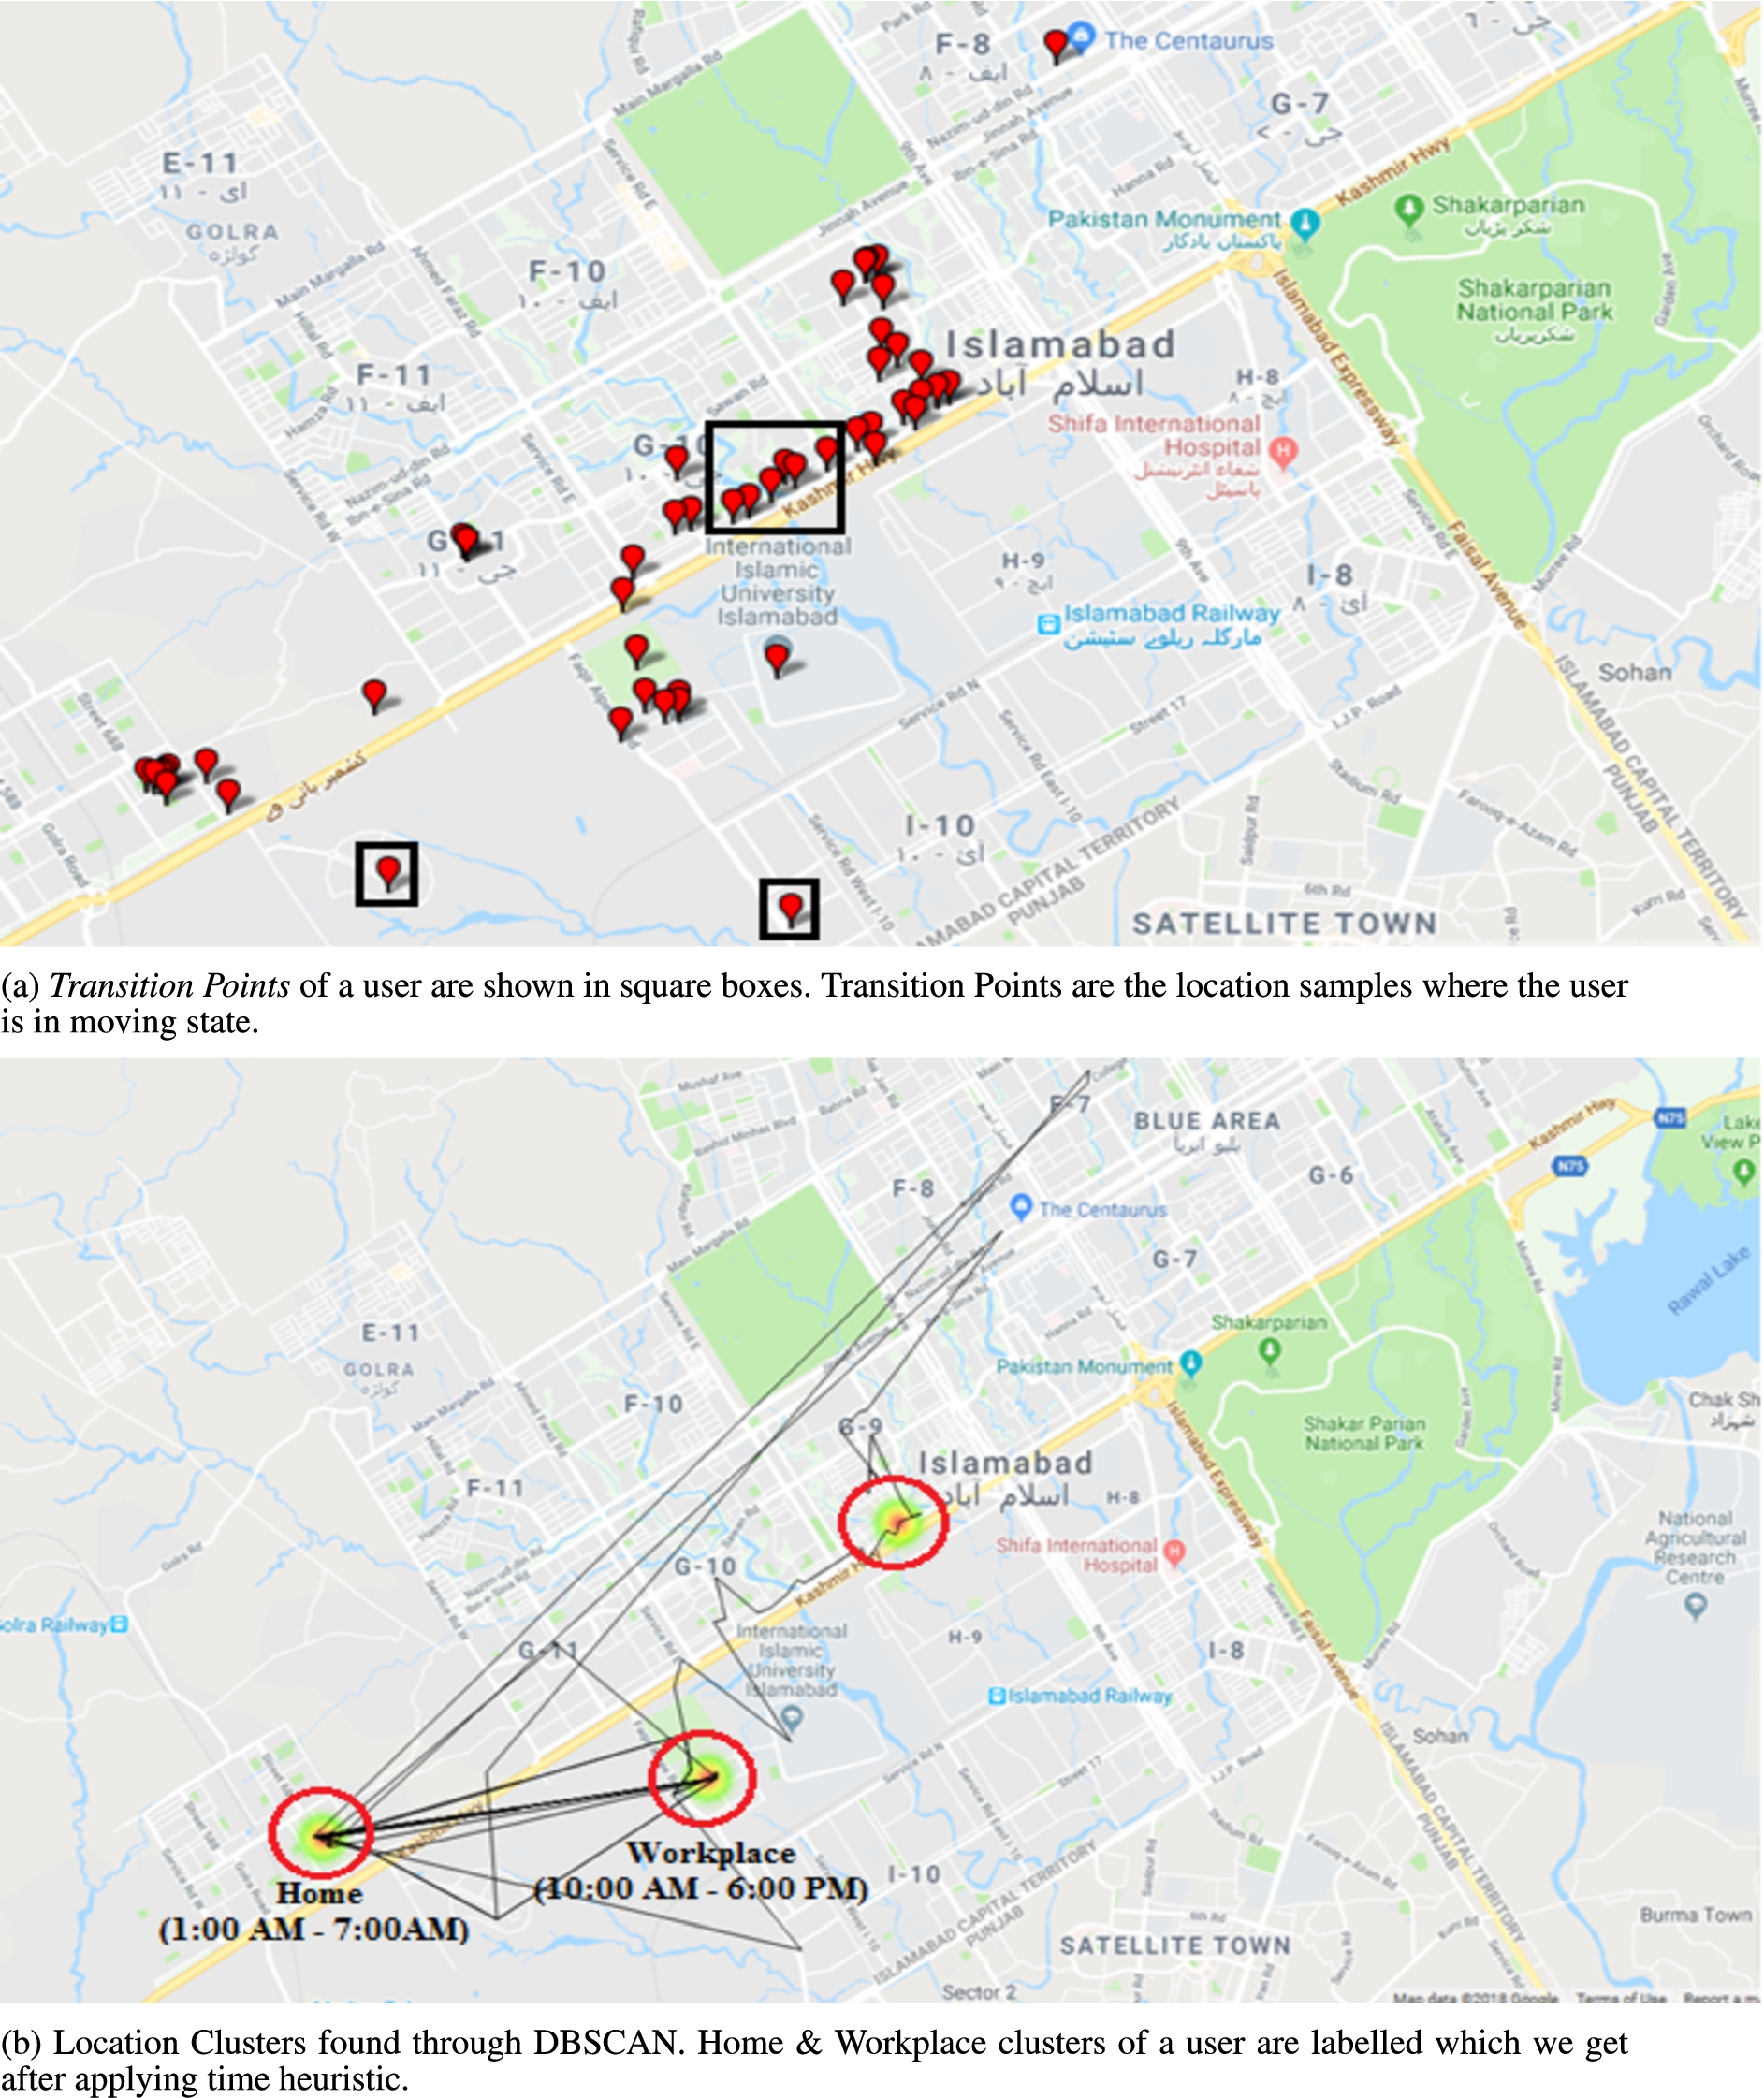
Identification of (a) transition points and (b) location clusters.
After data collection and preprocessing, the next step of our methodology was feature extraction. We have identified 8 GPS location and 1 social apps usage related features after analyzing the preprocessed data.
We skipped some features in this study i.e.: hour of the day and weekend/weekday difference as we have performed the experiment with students that have different routine each day. We did try to add time as 3rd dimension in dbscan, but number of clusters were meaningless.
The 8 GPS location features are number of clusters, time spent at home, time spent at workplace, unique places visit, total distance travelled, transition state, entropy, and normalized entropy. These features were inspired from [6,34] in which authors used them to learn the behavior of individuals and assess their depression state. In our work, we are using these features to infer the productivity of individuals by learning their daily routine.
In this study, Number of Clusters indicates the amount of location clusters found by DBSCAN clustering algorithm in data preprocessing phase. Time Spent at Home represents the amount of time in hours a user spent at his home during this study. To find this, we first identified the home cluster through clustering in data preprocessing stage. We used one heuristic to find the home cluster i.e., the location where user spend most of his time between 1:00AM to 7:00AM will be his home. Time Spent at Workplace shows the amount of time in hours a user spent at his workplace during this study. To find this, we first identified the workplace cluster through clustering in data preprocessing stage. We used one heuristic to find the workplace cluster i.e., the location where user spend most of his time from 10:00AM to 6:00PM on weekdays will be his workplace. Unique Places Visit indicates the number of different locations visited by user during this study.
Total Distance Travelled represents the total distance in kilometer covered by a user. Transition State shows the percentage a user was in transition/non-stationary state. We measured it by dividing the location samples of a user in walking, running and vehicle state by the total number of location samples. In our work, feature Entropy indicates the uniformity in time that a user spends in various location clusters that we determined in data preprocessing stage. We have calculated the entropy using Eq. (1)
Normalized Entropy represents the distribution of the visited location clusters. The value of normalized entropy ranges between 0 and 1, where 0 means that all location data points lies in the same cluster, and 1 indicates that they are uniformly distributed across all the clusters. We have calculated the normalized entropy of each user by dividing the entropy by logarithm of the total number of clusters. The equation of calculating normalized entropy is shown in Eq. (2)
Frequency of Social Apps Usage shows the number of times each user interacted with various social apps collectively such as Facebook, Twitter, Instagram, Youtube, Snapchat, Messenger, Skype and Gmail. We have calculated this feature by adding the number of social apps used by the user at each visited location.
Table 3 shows the smartphone sensors used in the extraction of each feature.
The smartphone Sensor used in the collection of sensing data from the users which helped us in the extraction of each Feature
The smartphone Sensor used in the collection of sensing data from the users which helped us in the extraction of each Feature
We determine the relationship between the extracted features and productivity score of the user. In this paper, we use Pearson correlation [30] to determine the correlation among features and user’s productivity. Pearson correlation coefficient is a well-known statistical test used to find the dependency of one variable on another. The results of correlation analysis are discussed in Section 4.
Prediction analysis
In the final step of our proposed approach, we train and evaluate a generalized prediction model to assess whether it is possible to predict the change in productivity of users with the variation of feature values. We train three classifiers i.e., logistic regression, SVM and KNN in order to compare their performance on our dataset. An overview of each of the classifier is discussed below:
1) Logistic Regression: Logistic Regression is a regression method that can be used in modelling binary dependent variables. It is a mathematical modelling approach used to define the relationship among X independent variables and Y binary dependent variable which is coded as 0 or 1 for two possible categories [11,40]. In this work, our target variable is also binary in nature i.e., 0 means Productive and 1 means Non-Productive.
2) Support Vector Machine (SVM): SVM has wide variety of applications in machine learning and human behavior prediction [10]. It is a supervised learning algorithm that transforms training examples to a higher dimensional space and builds a linear model. This model is then used to classify the new training examples.
3) K-Nearest Neighbour (KNN): It is one of the most simple, supervised machine learning algorithm. It can be used for both classification and regression problems. It finds the distance between a query and all the examples in the data, selects the specified number examples (K) closest to the query, then votes for the most frequent label [2].
Evaluation
In this section, we calculate the feature values that we have discussed in Sect. 3 for all users. We then perform the correlation analysis among the feature values and user’s average productivity score to pick the best features that can be associated with the productivity. Finally, we train and evaluate a generalized prediction model using significantly correlated features to assess whether we can predict the change in the productivity of users using smartphone sensing data.
Computation of productivity score of users
To determine the correlation between features and productivity, we first calculate the total productivity score of 15 days of each user that they provided through Prodmapp. For each user, we first calculate the productivity score by adding the total number of 1’s and 0’s. For each user, we then take the average of productivity score by dividing the productivity score by total number of 1’s and 0’s. Table 4 shows the productivity score, and its average of each user.
Productivity score of each user calculated by adding the total number of responses provided by each user in the form of 1’s and 0’s where 1 means productive and 0 means not productive. Average of the productivity score for each user is also shown in the last column
Productivity score of each user calculated by adding the total number of responses provided by each user in the form of 1’s and 0’s where 1 means productive and 0 means not productive. Average of the productivity score for each user is also shown in the last column
We calculate 8 GPS location features and 1 social apps usage related feature for each user. The correlation analysis among these features and the user’s average productivity score reveals that 6 out of 9 features are significantly correlated to the user’s average productivity score. The null hypothesis is that no correlation exists between average productivity score and features. We reject this hypothesis if p-value is less than 0.05. The results of correlation analysis is shown in Table 5.
The Pearson correlation coefficient r between each feature and user’s average productivity score and its corresponding p-value. The sign/intensity of correlation is shown in the last column based on p-value. No correlation exists if
The Pearson correlation coefficient r between each feature and user’s average productivity score and its corresponding p-value. The sign/intensity of correlation is shown in the last column based on p-value. No correlation exists if
Specifically, 5 out of 8 GPS location features i.e., entropy, total distance travelled, transition state, time spent at home and time spent at workplace shows strong correlation with user’s average productivity score with Pearson correlation coefficients r of 0.642, 0.647,
Moreover, 1 feature related to social apps usage i.e., Frequency of social apps usage showed strong negative correlation with user’s average productivity score with
Prodmapp dataset We only use those features to train Logistic Regression, SVM and KNN that are significantly correlated with average productivity score of users i.e., time spent at home, time spent at workplace, total distance travelled, transition state and frequency of social apps usage. We compute the feature values for each day and for each user. For each user and for each day we calculate the target variable/label as follows: We assign label 1 if productivity score of a user of that particular day is greater than the average productivity score of that day plus one standard deviation, otherwise 0.
We split our dataset into
In case of SVM, we use the values of kernel and gamma as linear and scale respectively. For KNN, we use the value of k as 5.
We get the overall accuracy of logistic regression, SVM and KNN as approximately
Table 6 shows the sensitivity, specificity and F-score of all three classifiers.
Sensitivity, specificity and F-score values of classifiers
Sensitivity, specificity and F-score values of classifiers
Table 7 lists the confusion matrix of Logistic Regression, SVM and KNN where 1 and 0 represent the two classes, “Productive” and “Non-Productive” respectively.
Confusion matrix for logistic regression, SVM and KNN
Aruba dataset We train the same three classifiers i.e., logistic regression, SVM and KNN on Aruba dataset to evaluate the performance of our proposed approach. The dataset includes the daily life productive and non-productive activities executed in a day by housewife with regular frequency. We train these classifiers with the same parameter values that we use in Prodmapp dataset.
We get the overall accuracy of logistic regression, SVM and KNN as approximately
Table 8 shows the sensitivity, specificity and F-score of all three classifiers on Aruba Dataset.
Performance metrics values of classifiers on Aruba dataset
Moreover, Table 9 lists the confusion matrix of Logistic Regression, SVM and KNN where 1 and 0 represent the two classes, “Productive” and “Non-Productive” respectively.
Confusion matrix for logistic regression, SVM and KNN on Aruba dataset
The results show that the proposed approach is able to monitor and enhance individual’s productivity non-intrusively through learning their daily routine. We find the significant correlation between several behavioral features and user’s average productivity score. Features Time Spent at Home and Time Spent at workplace shows negative and positive correlation respectively which means that the productivity of the user will increase if the user spent more time at workplace instead of home. Similarly, feature Entropy shows positive correlation with user’s average productivity score so we can say that the productivity of the users would improve if they spent uniform time at various visited locations. Productivity of the individuals might decrease if they move, and use social apps very frequently because there is a strong negative correlation among features Transition State and Frequency of Social Apps Usage with user’s average productivity score. We evaluate the performance of our proposed approach on Aruba Dataset from CASAS project to quantify the productivity of housewife. Results of the experiment shows that our approach generalizes well as the classifiers achieve good prediction accuracy. With all these strengths of our study, several limitations are also associated with this work that needs to be overcome.
The data is collected from 10 users and all of them were the hostelite male students of three different universities of Islamabad, Pakistan. No female was involved in this study. Therefore, we don’t claim that the results of this study will generalize to other user groups.
Conclusion & future work
We proposed an approach to monitor the individual’s productivity through their visited locations, physical activities and social apps usage frequency in a non-intrusive way using smartphone sensors. We perform pre-processing on data to remove outliers and feature extraction and then correlation analysis is performed to find the productivity. The experimental analysis of proposed approach demonstrates that it is able to successfully predict the change in productivity of users by analyzing the variation in feature values. We achieve good prediction accuracy with overall accuracy of logistic regression, SVM and KNN as approximately
In future, we aim to extend this work to perform predictive analysis of other types of behavior such as depression or mood detection.