
Abstract
Background:
Rheology experiments have been performed on the vitreous humor, a soft gel that rests inside of the eye, to study its viscoelastic behavior and underlying macromolecular structure. A significant challenge for experimentalists is preserving the macromolecular structure when removing vitreous from in vivo conditions.
Objective:
We have developed a novel probe-like rheometer geometry that allows us to perform shear rheology experiments on the vitreous humor in situ. The aim of this study is to assess the feasibility of the probe geometry.
Methods:
Creep compliance responses of silicone oils, Xanthan gum solutions, and bovine and porcine vitreous humor were measured using the probe geometry and compared to measurements performed with standard geometries.
Results:
Viscosities calculated from the creep responses of silicone oils closely match between the probe and standard geometry. Viscosities and creep compliance values of Xanthan gum measurements achieve order of magnitude agreement between the probe and standard geometry. Significant differences are detected with the probe between bovine and porcine vitreous (
Conclusions:
These results suggest the probe may feasibly measure viscosities of Newtonian fluids, and correctly detect differences in the creep response of complex fluids with varying viscoelastic behaviors.
Introduction
Rheological experiments with biological fluids are often challenging because these complex fluids have delicate molecular structures that are sensitive to changes in the immediate environment, especially when removed from in vivo conditions. Loading samples into rheometer geometries such as parallel plate or concentric cylinder runs the risk of introducing sample evaporation and destruction of structural macromolecular networks, particularly in soft gels. The vitreous humor (vitreous) is a gel that is difficult to characterize with rheology experiments because the material properties are sensitive to water loss, temperature, compression, and time after dissection. Vitreous is the fluid that rests inside of the ocular globe filling the space inside the eye, and plays an important role in regulating oxygen diffusion, acting as a mechanical damper to preserve ocular tissue, and in the development of many ocular pathologies like retinal detachments [1,2]. Although vitreous is composed of 99% water the elasticity of vitreous arises from a lightly cross-linked network of collagen fibrils that current models suggest is slightly stretched by a finer hyaluronan network [3]. Quantifying the rheological properties of vitreous experimentally provides a means to link whats happening in the underlying macromolecular structure to changes in material behavior, which may have applications in improving surgical outcomes, drug delivery techniques, and pharmaceutical treatments for ocular diseases.
Several groups have used different rotational rheometer geometries to characterize vitreous. A cleated geometry has been thoroughly developed to address wall slip and sample compression concerns because small compressions as low as 5% are reported to cause an increase in apparent modulus for vitreous humour [3–5]. The cleated geometry is manufactured to have a dense concentration of protrusions out from the geometry surface that penetrate the slip layer and engage the sample without damaging the macromolecular structure. Sandpaper-coated top and bottom plates have also been used to reduce wall slip [6,7], and one group performed experiments with a smooth surface parallel plate geometry where slip may have been present [8]. One drawback to all parallel plate measurements is that they require vitreous to be removed from the eye and cut into an appropriate cylindrical shape for sample loading, which is not only a delicate procedure but also it has been shown that hyaluronan is driven out of the vitreous after dissection [3]. Zimberlin et al. (2010) have demonstrated using cavitation rheology that mechanical properties of vitreous change significantly from before and after removal from the eye, which may be due to the importance of maintaining the integrity of the vitreous membrane [9]. Other geometries such as concentric cylinder or vaned shapes are not suitable for measuring the vitreous gel because they require large volumes and would significantly destroy the gel upon loading. In work by Bettelheim and Wang (1976), a unique dynamic mechanical measurement setup using a viscoelastometer preserves the shape and volume of the eyeball during experiments but does remove the lens and inserts compression chucks completely through the vitreous body [10]. What has been missing in current efforts to study vitreous rheology is a measurement technique suitable for in situ characterization that causes minimal damage to the fluid and surrounding tissues.
Current in situ methods to characterize vitreous include microrheology and imaging techniques. Microrheology experiments may cause little disturbance to the sample but results are more representative of local rather than bulk rheological properties [11–15]. This may be advantageous in applications such as improving drug delivery techniques but less so in attempts to numerically model bulk vitreous flow. The properties of vitreous are not homogenous throughout the eye most likely due to the varying density and alignment of collagen fibrils between the anterior and posterior sections of the ocular globe [13]. A light scattering technique used by Zimmerman (1980), who was one of the first to report shear viscoelastic parameters of vitreous, appears to suffer from lack of sensitivity [16]. Magnetic resonance imaging techniques performed by Piccirelli et al. (2012) report agreeable results with previously published work but also report issues with low resolution [17]. The benefits from small-scale measurement tools that minimize disturbance to the sample must be balanced against the limited resolution and ability to quantify parameters that represent useful bulk material properties.
As an alternative to previously used methods, a cylindrical probe-like geometry for a controlled stress rheometer is proposed here to obtain real-time rheological properties of both Newtonian and viscoelastic fluids, including the vitreous humor. The invented probe has a small diameter to be used for biological samples with small volumes and to cause minimal disturbance to gel samples such as vitreous. The probe surface is roughened to help prevent fluid slip between the probe and viscoelastic sample. The setup is flexible because the probe is attached to and may be exchanged via set screws, so that different sizes or surface roughnesses may be used if desired. The probe is directly inserted into the sample as illustrated in Fig. 1. The actuator rotates the probe and transfers shear stress to the sample at the contact surface. In this study the probe is used to perform creep experiments to obtain time-dependent viscoelastic data [18], where a constant shear stress is applied to the sample and the rotational deformation, or strain, is measured at the surface of the probe.
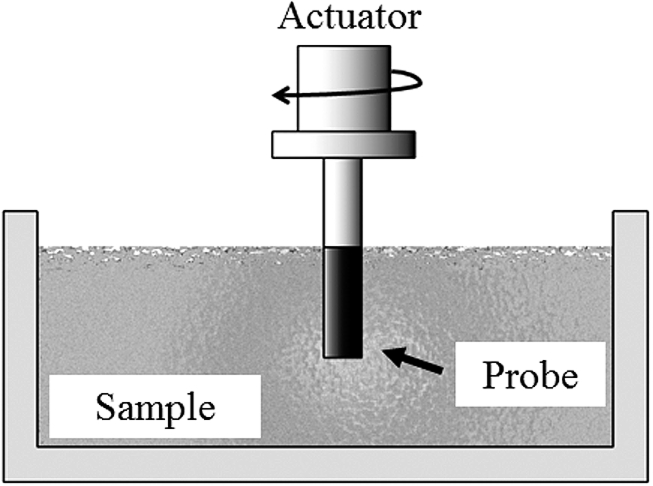
Illustration of the probe immersed in a viscoelastic fluid.
Newtonian silicone oils and non-Newtonian Xanthan gum solutions are tested with the probe and compared to parallel plate measurements. Vitreous samples are tested with the probe geometry only due to large sample slip encountered in sandpaper-covered parallel plate measurements. Good agreement between steady state viscosity values is reached between the two geometries for a wide range of silicone oils. We also show here that the probe is able to detect differences in viscoelastic responses between two different concentrations of Xanthan gum that match differences measured by the parallel plate geometry. Finally, expected differences in the creep response between two different species of vitreous are detected. The probe geometry is most useful for comparisons of creep responses between viscoelastic fluids that vary in concentration, elasticity, and viscosity.
Description of probe geometry
A novel probe-like geometry for a controlled stress rheometer has been designed to perform creep compliance tests, see Fig. 2. This cylindrical geometry is set up similar to a cup and bob concentric cylinder geometry with the exception that the gap is larger than 1 mm.
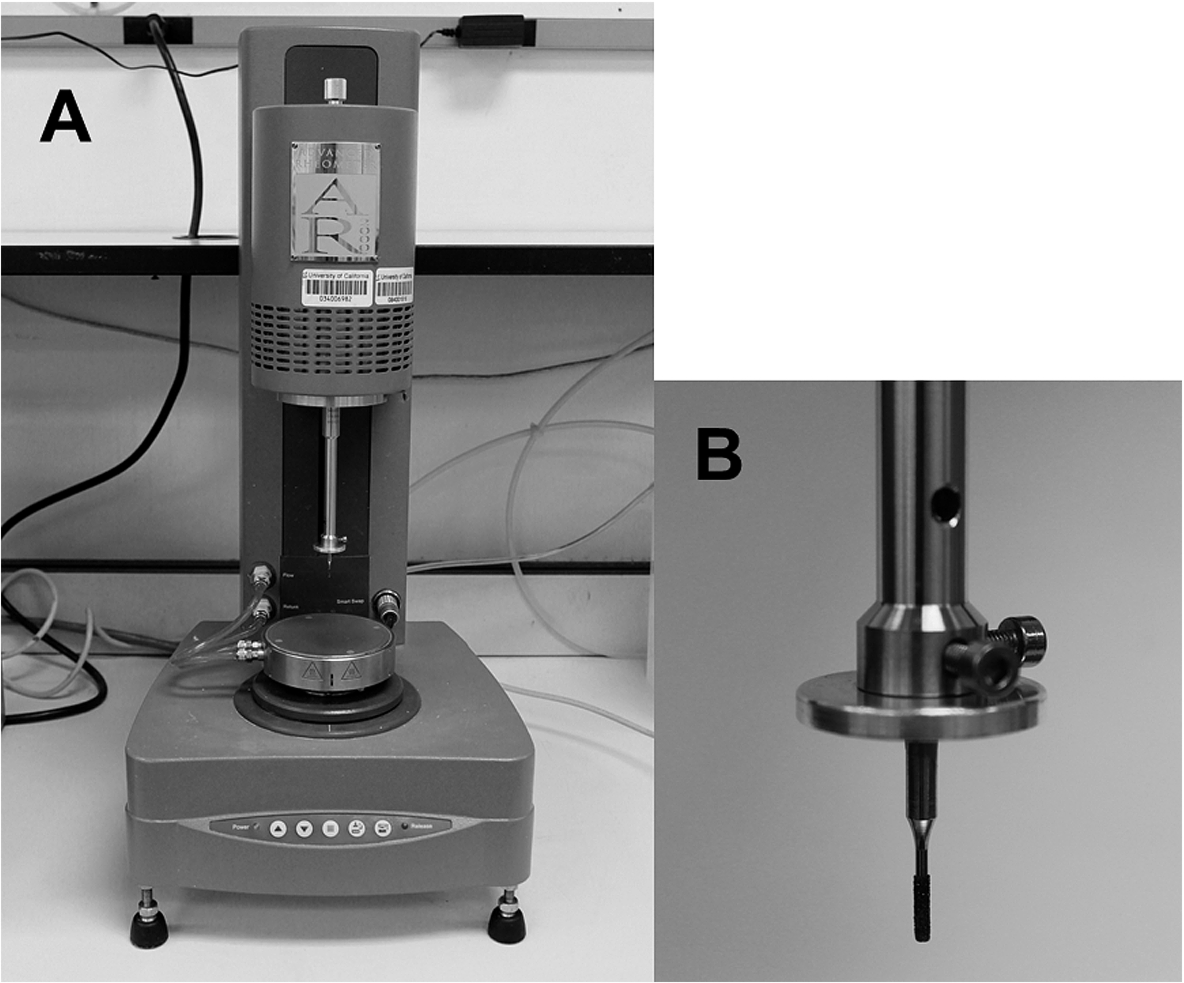
(A) TA instruments AR 2000 controlled stress rheometer with probe geometry attached. (B) Close up picture of the probe geometry showing the diamond coated probe tip attached to rotating shaft via set screws.
To provide flexibility with measuring different biological samples, the probe may be exchanged via set screws that secure it to the shaft, which is connected to the actuator. Increasing the size of the probe would provide greater surface area and improve measured signal. However, this must be balanced with minimizing the probe size to minimize disturbance to the sample. Size is also limited by sample volume. The probe used for the following experiments is a drill bit that has 1.72 mm diameter and 7 mm height. The outer surface is roughened to lessen slip between the probe and the sample. To perform rheological tests, the probe is immersed into the sample at a depth of precisely the height, 7 mm.
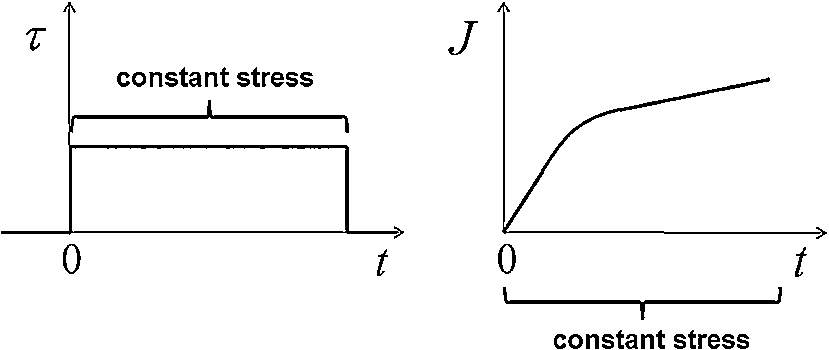
Illustration of the creep test: a constant shear stress is applied to the fluid at the surface of the geometry for the duration of the test. The right plot is an example creep curve for a viscoelastic liquid where compliance, J, is measured as a function of time, t.
To perform creep compliance tests a constant torque value is set using TA instrument software and is applied for a fixed amount of time, see Fig. 3. The actuator rotates the probe with the constant torque, which is then transferred to the sample at the surface of the probe. The torque limit of the machine used in this study is 0.1 μNm. The shear stress at the probe surface, σ is determined by multiplying applied torque, M, by the stress geometric factor,
In the study of Newtonian fluids a steel cone and plate geometry of 20 mm diameter was used for reference measurements. Four viscosities of silicone oil, 1000, 10,000, 100,000, and 1,000,000 cst (approximately 0.97, 9.7, 97, and 970 Pa-s, respectively), were purchased from Gelest, Inc. (Morrisville, PA) and used for all creep measurements. Three replicate creep tests were performed for each type of silicone oil. The applied shear stress was chosen by compromising between minimizing applied stress and torque to prevent Weissenberg effects [19] and maximizing shear stress to reduce signal noise in stress and strain measurements. For 1000 cst silicone oil 30 Pa was applied for both probe and cone and plate measurements, and for 10,000 cst silicone oil 150 Pa was applied with the probe and 30 Pa applied with the cone and plate. For 100,000 and 1,000,000 cst silicone oil 300 Pa was applied for both probe and parallel plate measurements. Because silicone oil is a Newtonian fluid there should be no variation in measured viscosity at different stresses.
For the study of non-Newtonian fluids, Xanatural 180 Xanthan gum purchased from CP Kelco (Atlanta, GA) was dissolved in deionized water to create aqueous polymer solutions of 1.5% and 2.5% (m/v). Solutions were agitated magnetically for five hours and gently heated to 40°C for four of those hours to help with dissolution. Solutions rested at 4°C for at least 24 hours before warming to room temperature before testing. For Xanthan gum measurements a steel parallel plate geometry of 20 mm diameter with a solvent trap was used to prevent evaporation of the samples. The top and base plates were covered with 600 grit sandpaper to prevent sample slip. Pre-shear of ten
The Xanthan gum solutions were first characterized with steady state shear rate ramp tests because the viscosities are known to have shear rate and concentration dependencies [20–22]. The shear thinning behavior arises due to the alignment of the micro-structure along the flow direction and reduction of intermolecular interactions under shear [22], and may be modeled as a power-law fluid.
Biological samples of vitreous were obtained from Sierra for Medical Science (Whittier, CA) as porcine (pig) or bovine (cow) eyes. Samples were tested within 8 hours of delivery and harvested the same day as delivery to preserve the vitreous as much as possible. Cuts were made in the sclera at the pars plana using scalpels to open a small window for the probe to fit through and be inserted into the vitreous, see Fig. 4. Care was taken to cause minimal disturbance to the vitreous during handling in order to preserve the vitreous environment inside the ocular globe as close as possible to conditions in vivo. All testing was performed at room temperature, 20°C. Creep tests were performed for a duration of five minutes with an applied shear stress of 30 Pa. The applied shear stress was chosen to balance between minimizing deformation of the sample and maximizing the measured strain signal. Statistical significance was determined between porcine and bovine results by performing Student’s t-test to obtain p-values, with sample sizes of 25 and 40 for porcine and bovine, respectively.
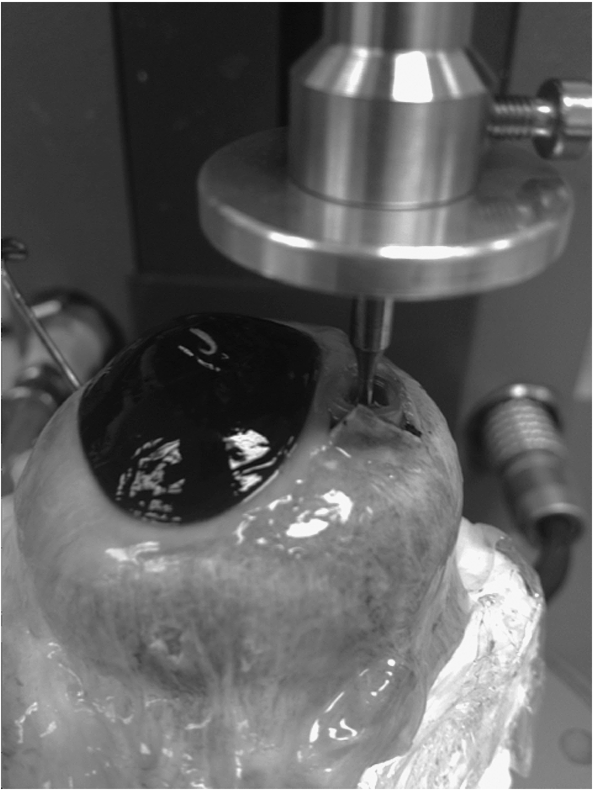
A bovine eye prepared for a creep test with the probe geometry inserted.
Here we verify analytically that creep curves generated by probe measurements in an infinite Newtonian fluid may be used to calculate viscosity at steady state. The assumptions are the following: The probe tip is an infinitely long cylinder rotating in an infinite otherwise quiescent fluid. End effects are neglected because the radius of the probe, The velocity only has an angular component, so there is no velocity in the radial (r) or z-direction, and is only a function of radial distance. There is no slip at the cylinder surface At
The shear stress
Analysis of creep curves
Creep experiments are performed in order to capture time dependent viscoelastic behavior of the sample. A plot of compliance, J, versus time, t, is known as a creep curve and represents the time-dependent deformation of the sample. The steady state region of the creep curve occurs when compliance varies linearly with time and is used to calculate the steady state viscosity,
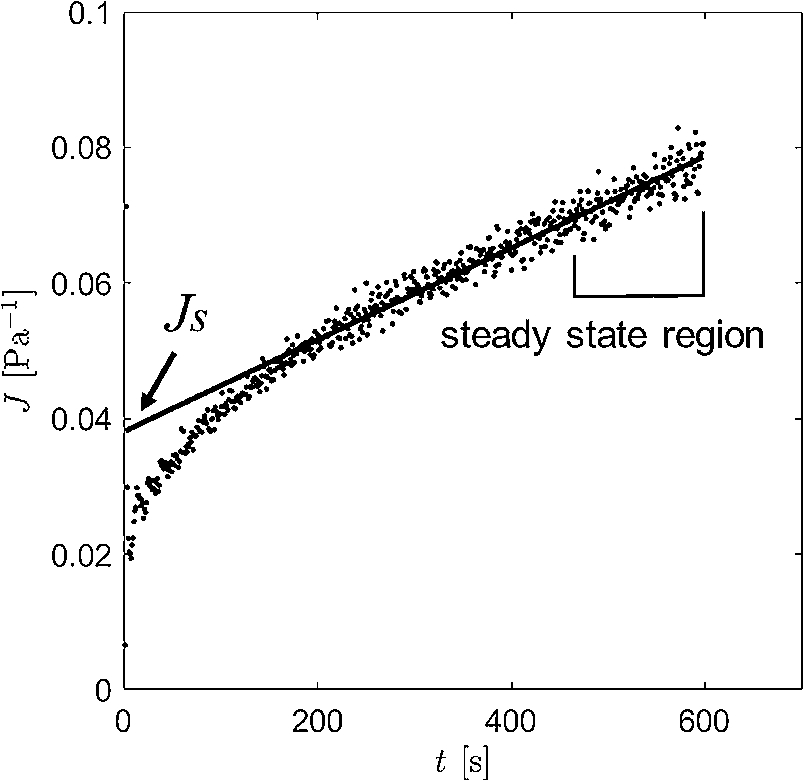
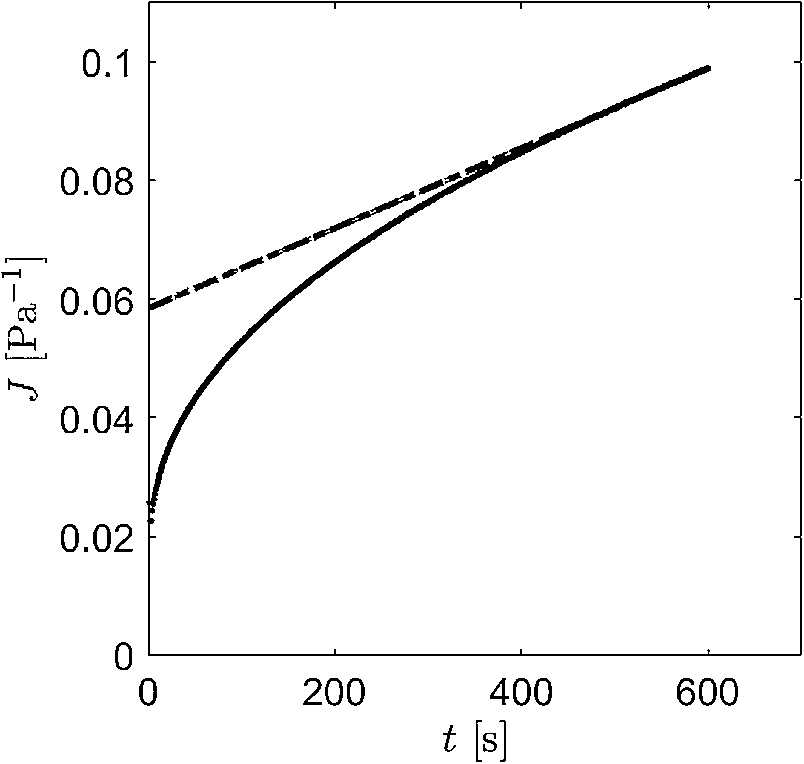
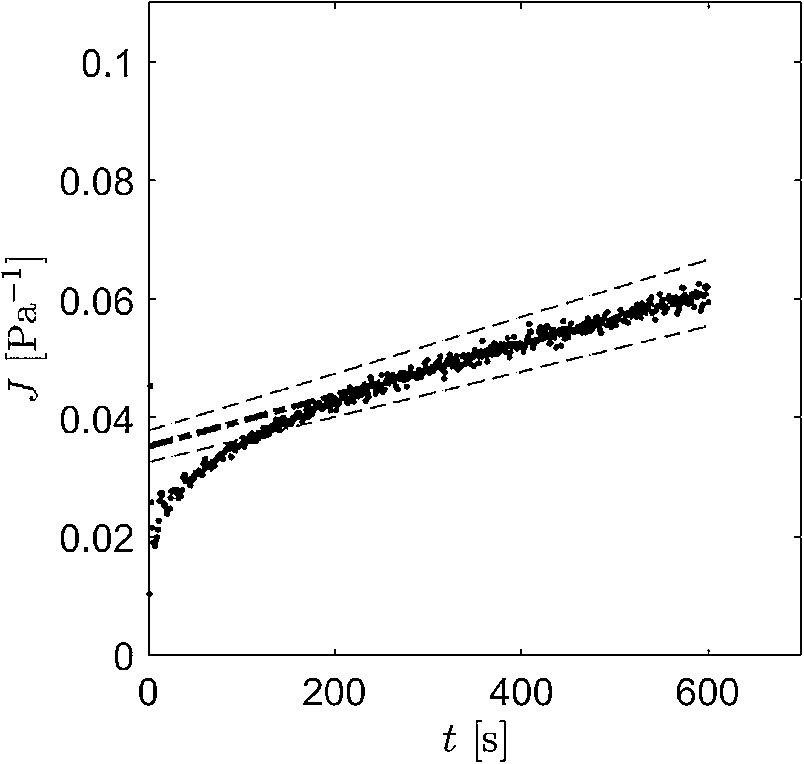
Example compliance data from a creep test of 2.5% Xanthan gum (dots) with fitted linear line (solid line). Data points were taken every 1 second. The linear fit is only calculated from data points within the steady state time period from eight to ten minutes, but the fit is extended and plotted here over all time points to clearly show the location of the intercept,
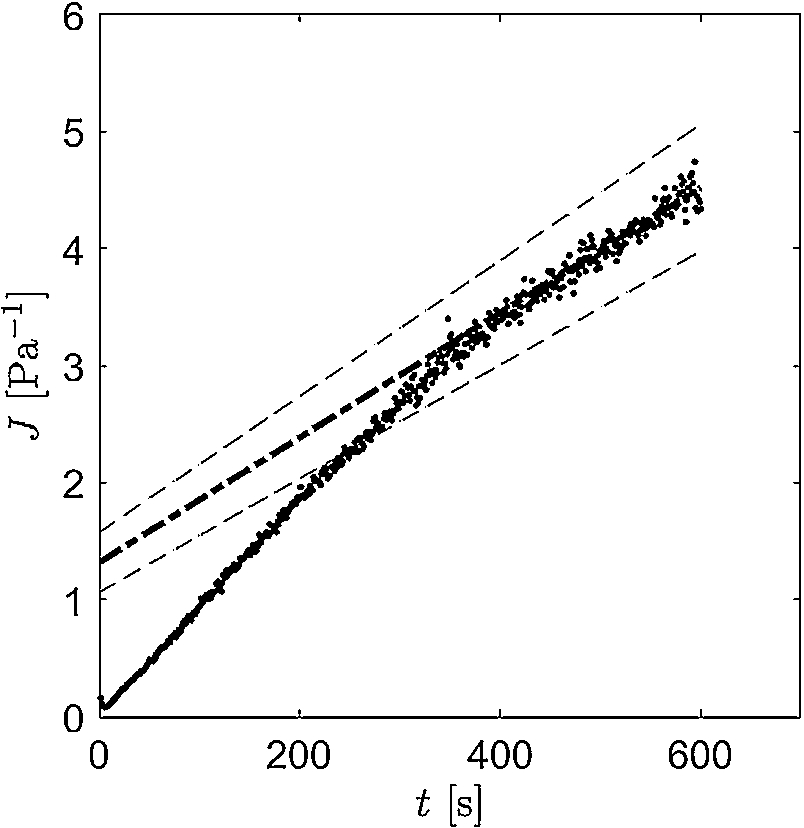
While error in the repeatability of the experiment is represented by the standard error calculated from three trials, the error in the measurement itself can be represented by a 95% confidence interval of the linear fit to the steady state creep data. The 95% confidence interval is calculated using MATLAB’s regress function, which performs a linear regression to the steady state region of the creep curve. Both polyfit and regress functions fit the data to a linear line but regress produces a 95% confidence interval on the intercept and slope coefficients. Also, regress is performed on the average compliance values from the three trials for each concentration and geometry, while polyfit was performed on each individual creep trial and then the viscosity and compliance intercept values were averaged afterwards. The confidence interval allows us to visually compare measurement error between 1.5% and 2.5% Xanthan gum solutions and probe and parallel plate measurements. Figures 6 and 7 are plots of the averaged compliance data from the three trials for 1.5% Xanthan gum solutions measured with the parallel plate and probe geometry, respectively. Figures 8 and 9 are from parallel plate and probe measurements of 2.5% solutions, respectively. Black markers indicate average compliance values, and in parallel plate experiments the data points are so close together that they appear to form a solid black line. The dot–dash line is the linear line calculated from the linear regression for the averaged data. The dashed lines are the 95% confidence interval in the regression fit, and for parallel plate measurements the confidence interval is small enough that it appears to collapse over the fit line.
Average compliance values from three creep experiment trials performed with the parallel plate geometry for 1.5% Xanthan gum solution. Dash–dot lines represent the linear fit to the steady state region and dashed lines represent the 95% confidence interval in the fit.
Average compliance values from three creep experiment trials performed with the probe geometry for 1.5% Xanthan gum solution. Dash–dot lines represent the linear fit to the steady state region and dashed lines represent the 95% confidence interval in the fit.
Average compliance values from three creep experiment trials performed with the parallel plate geometry for 2.5% Xanthan gum solution. Dash–dot lines represent the linear fit to the steady state region and dashed lines represent the 95% confidence interval in the fit.
Average compliance values from three creep experiment trials performed with the probe geometry for 2.5% Xanthan gum solution. Dash–dot lines represent the linear fit to the steady state region and dashed lines represent the 95% confidence interval in the fit.
Clearly the probe measurements have greater variance than parallel plate measurements, which translates into larger 95% confidence intervals for the slope and intercept values. This is likely due to the difference in applied torque between the probe and parallel plate geometries because the measurement loses precision when the applied torque is close to the machine limit, 0.1 μNm. The two geometries have different surface areas, so in order to maintain the same applied shear stress the applied torques must be different. The torque applied with the parallel plate is 9.5 μNm and about two orders of magnitude higher than the machine limit, whereas for the probe the torque applied is 0.2 μNm and close to the machine limit.
To characterize the feasibility of the probe geometry we compared steady state viscosities and compliance intercepts of several silicone oils, two Xanthan gum solutions, and porcine and bovine vitreous. While the probe geometry is unusual because we are not able to make the small gap assumption that is standard for traditional Couette geometries, it does capture the different responses of fluids with different viscoelastic properties.
Newtonian fluids
Four different silicone oils were tested with both a standard cone and plate and the proposed probe geometry. Creep compliance tests were performed and steady state viscosities calculated as previously described. In Table 1 the steady state viscosities are compared between the two geometries. Good agreement is achieved except for at the lowest viscosity, 0.97 Pa-s. However we believe this may be due to the lack of sensitivity of the rheometer used for our experiments because testing the same sample on a newer instrument model, TA Instruments Discovery Hybrid Rheometer HR-3 generated a viscosity value of 0.876 Pa-s.
Steady state viscosity results for silicone oils comparing probe and parallel plate measurements
Steady state viscosity results for silicone oils comparing probe and parallel plate measurements
Averages and standard error of the means reported here are calculated from three replicates.
It is expected that the probe measurements result in the same viscosity as cone and plate measurements because silicone oil is a Newtonian fluid, and therefore the viscosity is not shear rate dependent under the conditions studied here. While the cone and plate geometry provides a constant shear rate in the entire sample, the probe setup generates a non-constant shear rate in the sample because the gap is large [18]. Although the shear rate varies, the viscosity remains constant. Based on the reasonable error sizes and agreement between viscosities, the probe geometry creep measurements may feasibly characterize Newtonian fluids.
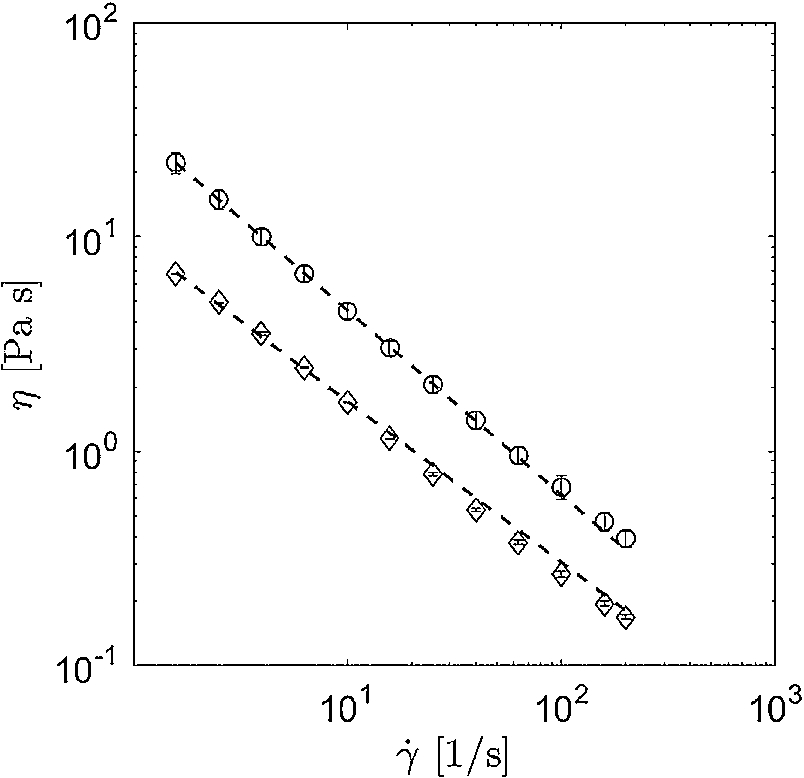
Vitreous is a viscoelastic fluid, so it is important that probe measurements characterize non-Newtonian fluids in addition to Newtonian ones. Creep test results are compared between the probe and parallel plate geometries for Xanthan gum solutions because it has shear thinning and elastic properties. The shear thinning behavior of both 1.5% and 2.5% solutions is apparent from steady shear rate ramp tests, shown in Fig. 10. The results from best fit power law models are reported in Table 2. The degree of shear thinning is very similar between the two concentrations but appears to slightly decrease with increasing concentration, and the overall viscosity values along with value of K significantly increase with increasing concentration. Both behaviors are consistent with literature. In work by Song et al. (2006), flow cures were generated for a range of concentrations of Xanthan gum aqueous solutions and the data was fit to a power law model. As concentration increased from 1 to 3 wt%, the value of n decreased from 0.1401 to 0.1299, and the value of K increased from 85.5159 to 310.382
Results from steady state shear rate ramp tests using the parallel plate geometry on 1.5% (diamond) and 2.5% (circle) Xanthan gum solutions. Dashed lines represent viscosity values calculated with the power-law model using the average of the parameter values reported in Table 2. Error bars represent standard deviations from two independent samples.
Power law parameters for Xanthan gum solutions
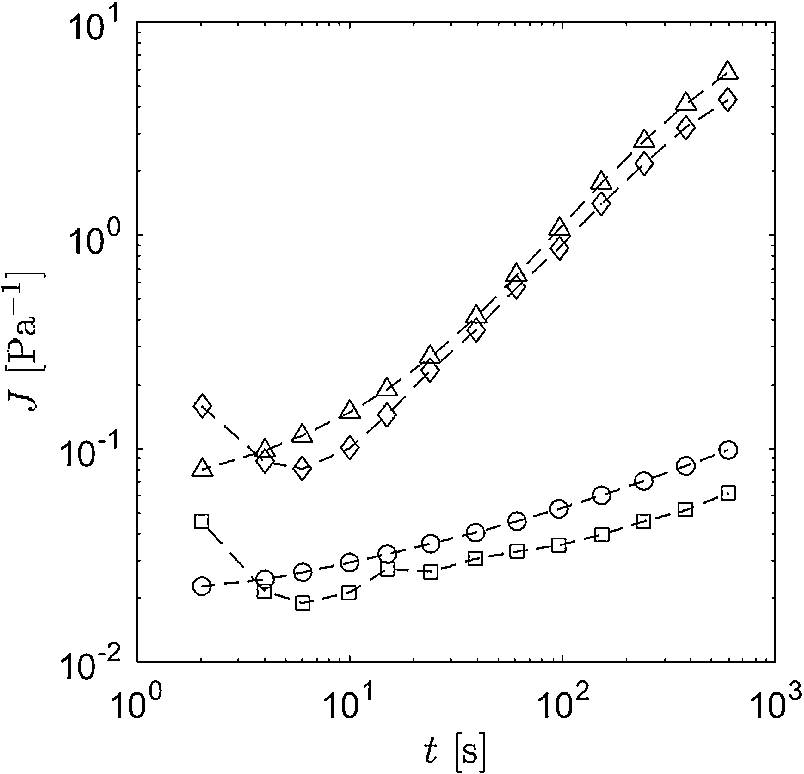
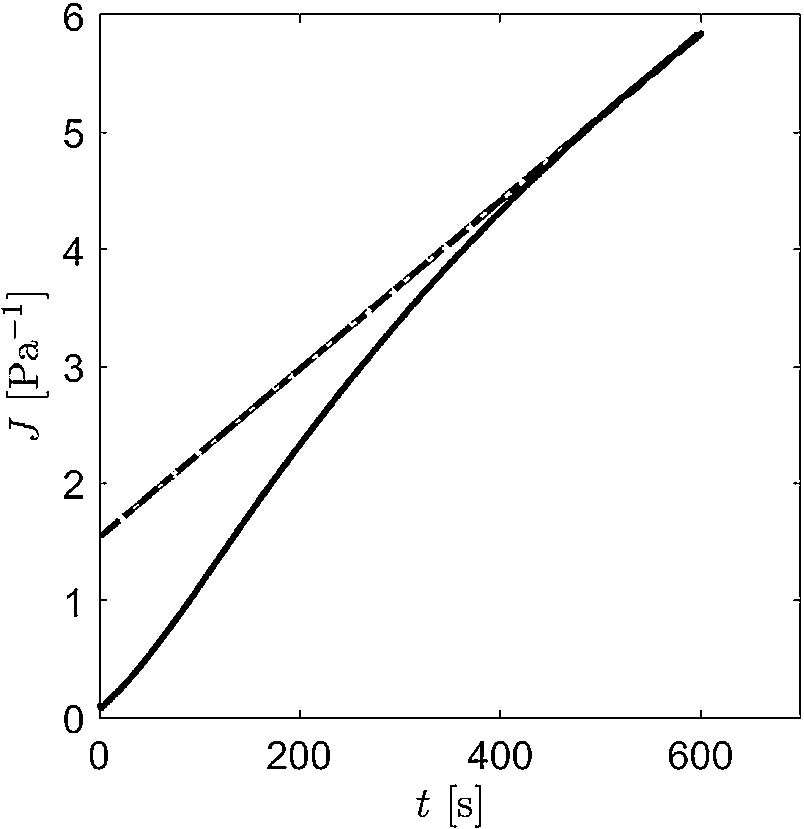
Creep curves from parallel plate measurements for 1.5% (triangles) and 2.5% (circles) Xanthan gum solutions, and from probe measurements for 1.5% (diamonds) and 2.5% (squares) solutions. Markers represent average values calculated at selected time points from three replicates, with intermediate dashed lines linking markers. Due to rheometer software limitations the first data point is measured at 1 second, and not at shorter times which are common for creep tests. Clearly, the response at early times is not reliable due to inertial effects and machine limitations. The first average data point for probe 1.5% is negative and is therefore not displayed on the plot.
Steady state viscosity and compliance intercept average values for Xanthan gum solutions
Averages and standard error of the means reported here are calculated from three replicates.
The differences in the viscoelastic response between the two Xanthan gum solutions are captured in both probe and parallel plate creep experiments. Namely, the differences in creep curve shape between different concentrations measured by the parallel plate geometry are qualitatively matched by the probe measurements, see Fig. 11. Overall compliance values are higher for the 1.5% creep curves (both parallel plate and probe) compared to the 2.5% creep curves. The quantitative representations of the creep curve are the steady state viscosity and compliance intercept, reported in Table 3 and calculated as previously described. There is order of magnitude agreement between probe and parallel plate measurements for the same Xanthan gum concentration measurement. As the concentration increases from 1.5% to 2.5%, the steady state viscosity increases by about two orders of magnitude and compliance intercept decreases by about two orders of magnitude for both probe and parallel plate measurements. An increase in viscosity with an increase concentration is expected based on a greater number of polymers offering resistance to the flow, and is observed in many studies on Xanthan gum [21–24]. It follows logically that a decrease in compliance values is expected as concentration increases. The differences in qualitative and quantitative aspects of the creep curves between these two concentrations of Xanthan gum are well matched between the probe and parallel plate.
Although order of magnitude agreement is achieved between the two geometries, the parallel plate geometry is more accurate because the shear rate is known and constant throughout the fluid, unlike in the case of the probe, and Xanthan gum is a shear rate dependent fluid. Additionally, there is less measurement variance in the creep compliance data from the parallel plate geometry because the applied torque is higher than that of the probe geometry, as explained previously and illustrated by Figs 6, 7, 8, and 9. However, the torque applied with the probe could be increased while maintaining the same applied shear stress by increasing the surface area of the probe. This may be limited by the volume of sample available, as in the case of the vitreous. The angular displacement resolution of the rheometer may also affect measurement error, particularly in 2.5% Xanthan gum tests because angular displacement is approximately an order of magnitude lower than for 1.5% tests and therefore closer to the resolution of the rheometer,
Analysis and comparison of the creep responses of porcine and bovine vitreous reveal significant differences in steady state viscosity and compliance intercept values between species, see Table 4. However, comparisons with parallel plate measurements were not achieved here because we encountered significant sample slip even with sandpaper coatings. Future work might use the cleated geometry proposed by Nickerson et al. to help overcome challenges with sample slip. In spite of this and based on the success of the probe to predict order of magnitude differences in the viscoelastic behavior of Xanthan gum solutions, we examine if the probe detects differences between the creep responses of two species of vitreous. Differences are expected because the concentration of collagen and hyaluronan are on average, higher in bovine vitreous than porcine vitreous, see Table 5. Also, previous dynamic shear rheology studies on porcine and bovine vitreous have found that the shear moduli are higher in bovine compared to porcine vitreous [3,5]. In this study the steady state viscosity of bovine vitreous is significantly larger than that of porcine vitreous (
Steady state viscosity and compliance intercept average values for porcine and bovine vitreous samples calculated from creep curves
Averages and standard error of the means are reported from sample sizes of
This work demonstrates the probe geometry’s ability to measure expected differences between creep behaviors of viscoelastic fluids (Xanthan gum and vitreous) with varying concentrations. For vitreous experiments, the probe geometry is an improvement upon parallel plate geometries because the vitreous is left intact inside of the eye. Further studies might investigate the velocity profile experienced by viscoelastic fluids in the probe setup, because the shear rate is known to not be constant. Stiff gels may be problematic to measure with the probe because it may break the sample before being able to be completely inserted into the sample. For vitreous gel and other soft biological fluids, the probe may be useful to quantify the changes in the creep response when the material is changed to study effects of parameters such as temperature, pH, or macromolecular structure.
Footnotes
Acknowledgements
The authors would like to thank Dr. Randy Ewoldt for helpful discussion regarding the creep response of vitreous. This material is based upon work supported by the National Science Foundation Graduate Research Fellowship Program under Grant No. DGE-1144087. Any opinions, findings, and conclusions or recommendations expressed in this material are those of the authors and do not necessarily reflect the views of the National Science Foundation.