
Abstract
Background:
Vasoconstriction and vasodilation phenomena reflect the relative changes in the vascular bed. They induce particular modifications in the pulse wave magnitude. Webcams correspond to remote sensors that can be employed to measure the pulse wave in order to compute the pulse frequency.
Objective:
Record and analyze pulse wave signal with a low-cost webcam to extract the amplitude information and assess the vasomotor activity of the participant.
Methods:
Photoplethysmographic signals obtained from a webcam are analyzed through a continuous wavelet transform. The performance of the proposed filtering technique was evaluated using approved contact probes on a set of 12 healthy subjects after they perform a short but intense physical exercise. During the rest period, a cutaneous vasodilation is observable.
Results:
High degrees of correlation between the webcam and a reference sensor were obtained.
Conclusions:
Webcams are low-cost and non-contact devices that can be used to reliably estimate both heart rate and peripheral vasomotor activity, notably during physical exertion.
Introduction
The cardiac activity is a vital function, observed to identify potential cardiovascular diseases through particular parameters like Heart Rate (HR) and Heart Rate Variability (HRV). A set of particular biological adaptations are orchestrated by the autonomic nervous system [1,2] to regulate the arterial pressure, specifically by dilating or contracting blood vessels through the vasomotor center.
During a physical exercise, local vasodilation of the arterioles (see Fig. 1) is orchestrated to bring oxygen and nutrients to the muscles recruited in the effort. In contrast, other non-essential muscles and organs are relieved by a local vasoconstriction that reduces the influx of blood. It is particularly the case of cutaneous vessels, which are contracted during the first moments of a physical effort and dilated to reduce the body temperature if the effort is prolonged in time. Through sympathetic efferent fibers, also called vasomotor fibers, the arterioles correspond to the blood vessels where the diameter evolves the most remarkably (Fig. 1).
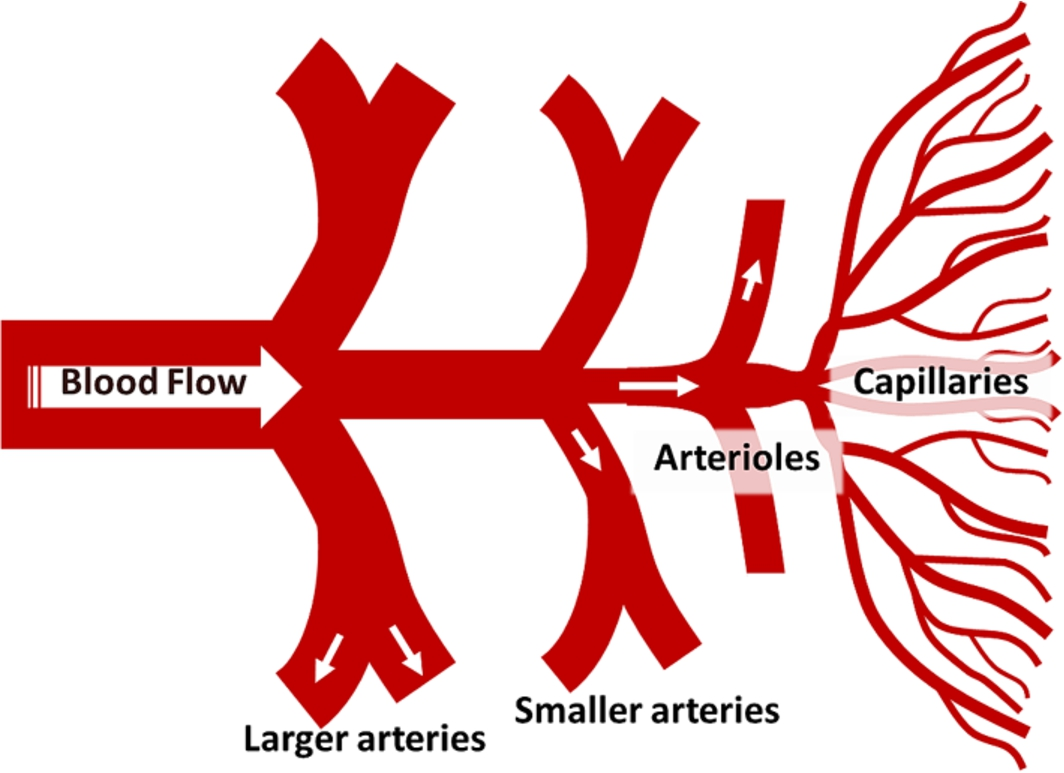
Arteries, arterioles and capillary bed.
Particular devices are employed to estimate these vasoconstriction and vasodilation effects. Measurement techniques based on the Photoplethysmograhpy (PPG) phenomenon are used to non-invasively measure the cardiovascular pulse wave.
The principle consists in observing light variations on the skin to recover the pulse wave. This optical technique is mainly implemented in contact pulse oximeters where red and infrared wavelengths are employed to compute the heart rate and assess the oxygen saturation [3]. The blood volume in the arteries and capillaries varies with each beat. The instantaneous pulse rate is calculated by detecting local peaks and by computing interbeat intervals.
Standards of measurement recommend the use of ECG sensors to measure HRV [4]. However, it has been shown that Pulse Rate Variability (PRV) derived from PPG signals can be a good surrogate of HRV computed using ECG [5–7]. The evolution in the amplitudes of the PPG signal reflects local vasomotion [8] effects through the blood vessels of the measurement site. Specific sensors are employed to measure photoplethysmography. Pulse oximeters, for example, are simply composed by the association of a light-emitting diode and a photodiode. These semiconductor components are calibrated in particular wavelength, typically the red (660 nm) and the infrared (940 nm) when considering pulse oximeters. Recently, Takano et al. [9] and Verkruysse et al. [10] have used standard optical cameras to remotely measure the pulse rate by observing color fluctuations on the face, with a set of predefined regions of interest. The PPG signal is simply formed by computing a spatial averaging with the face pixel intensities [11]. It can be done either with monochrome [9] or color channels [10–15]. Poh et al. [12] have employed a detrending method and independent component analysis, a particular blind source separation technique, to suppress the artifacts induced by motion and light fluctuations in order to recover the cardiovascular pulse wave and assess the pulse rate variability. The authors have used this filtering technique on red, green and blue signals that were computed from frames delivered by a low-cost webcam.
We recently have proposed a new method that robustly extract the PRV signal using the
This study presents an original method employed to assess changes in the peripheral vasomotor activity, reflected by a modification of the pulsatile amplitudes. A low-cost webcam was used to measure PPG signals on frames that contain human faces. A large majority of the study presented in this section were developed to remotely quantify the pulse rate. Only few attempts have been made to determine other important physiological signals, like the PPG amplitudes [17] or the oxygen saturation for example. In the present study, we propose a new filtering method that is based on the continuous wavelet transform of the PPG signal. The processing algorithms were already introduced in previous work [15] and were developed to robustly extract the relative amplitudes fluctuation of the PPG signal. Details of the processing method are presented in the first part of this study.
The quantified amplitudes were compared to those simultaneously recorded with an approved finger blood volume pulse sensor. Twelve healthy subjects with different skin color participated in the experiments. Statistical results and correlation rates are presented in the second part of this study. Webcams correspond to remote sensors that were used [11,12,15] to compute instantaneous pulse rate and pulse rate variability.
Experimental procedure
All experiments were conducted indoors. Different light sources were used during the experiments, particularly fluorescent light, sunlight or even a combination between them. Twelve healthy subjects (two females and ten males with different skin color, 18–50 years, mean: 26 years) from the laboratory participated in this study. All procedures performed in this study were in accordance with ethical standards on human experimentation and with the 1964 Helsinki Declaration and its later amendments. Informed consent was obtained from all individual participants included in the study. None of them had any known cardiovascular disease. After a short warming-up, the participants were asked to quickly climb 60 steps of a stair that were spread over 3 floors. They were asked to immediately sprint over 40 meters after reaching the top of the third floor. Directly after this short but intense exercise, they were asked to sit on a chair located approximately 1 meter from the webcam (see Fig. 2). PPG signals are at least recorded 90 seconds after the physical effort. The measure is extended on time if the participant has not recovered or if the pulse rate has not returned to its basic value after this period.
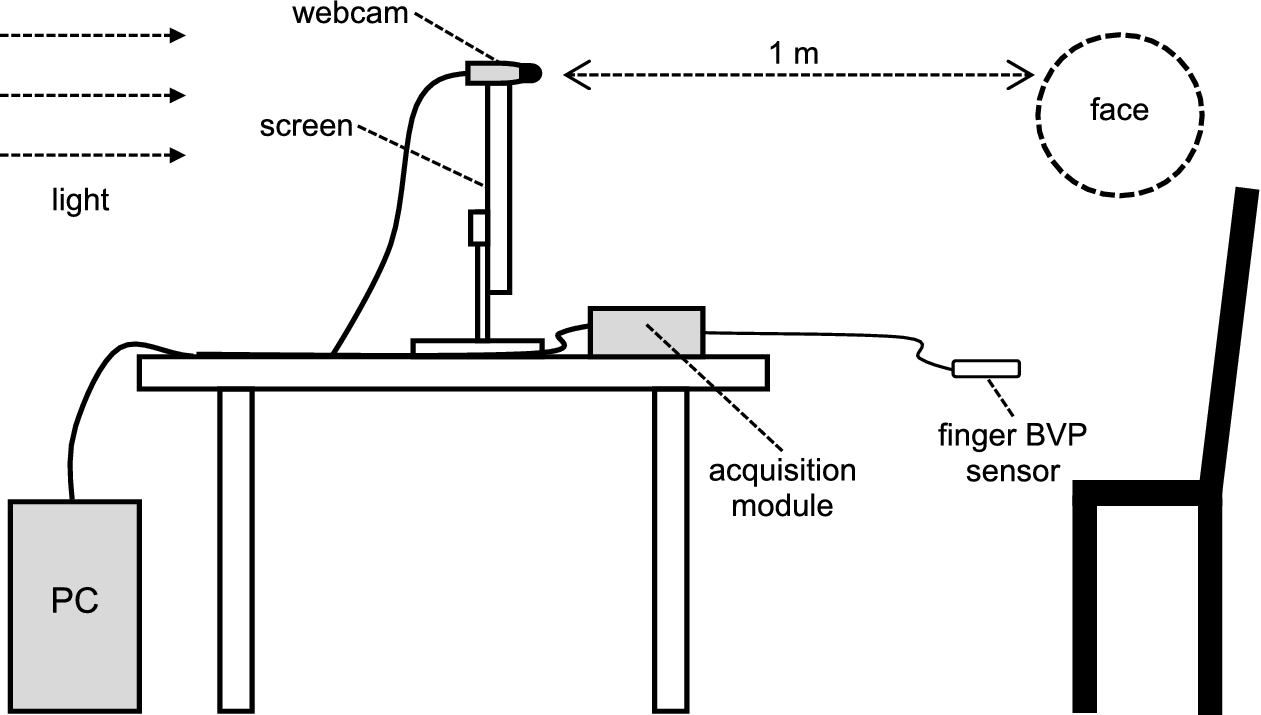
Experimental setup.
A low-cost HD webcam (Lifecam Cinema by Microsoft) was used in these experiments. The resolution of the device is reduced to 640 × 480 pixels in order to assure an acquisition frequency of 30 frames per second. The maximum webcam resolution is 1280 × 800 pixels. The three RGB channels are encoded with 8 bits per pixel. It is important to note that auto white balance is disabled in these experiments. White balance locally regulates colors and generates non-desired artifacts in webcam PPG signals [15]. A finger blood volume pulse sensor (BVP-Flex/Pro by Thought Technologies Ltd.) was used to measure the reference signal at a sampling frequency of 256 Hz. PPG signals were recorded with a C++ based software and analyzed offline with MATLAB (The MathWorks, Inc.).
Photoplethysmographic amplitudes assessment
Image processing
The face is automatically detected on each frame using a cascade of boosted classifier. The method was originally proposed by Viola and Jones [18]. All the image processing steps (Fig. 3) were already presented in previous work [15]. Briefly, a skin detection mask (Fig. 3(b)) is computed using the input frame to properly collect PPG pixels. The filter was developed in the
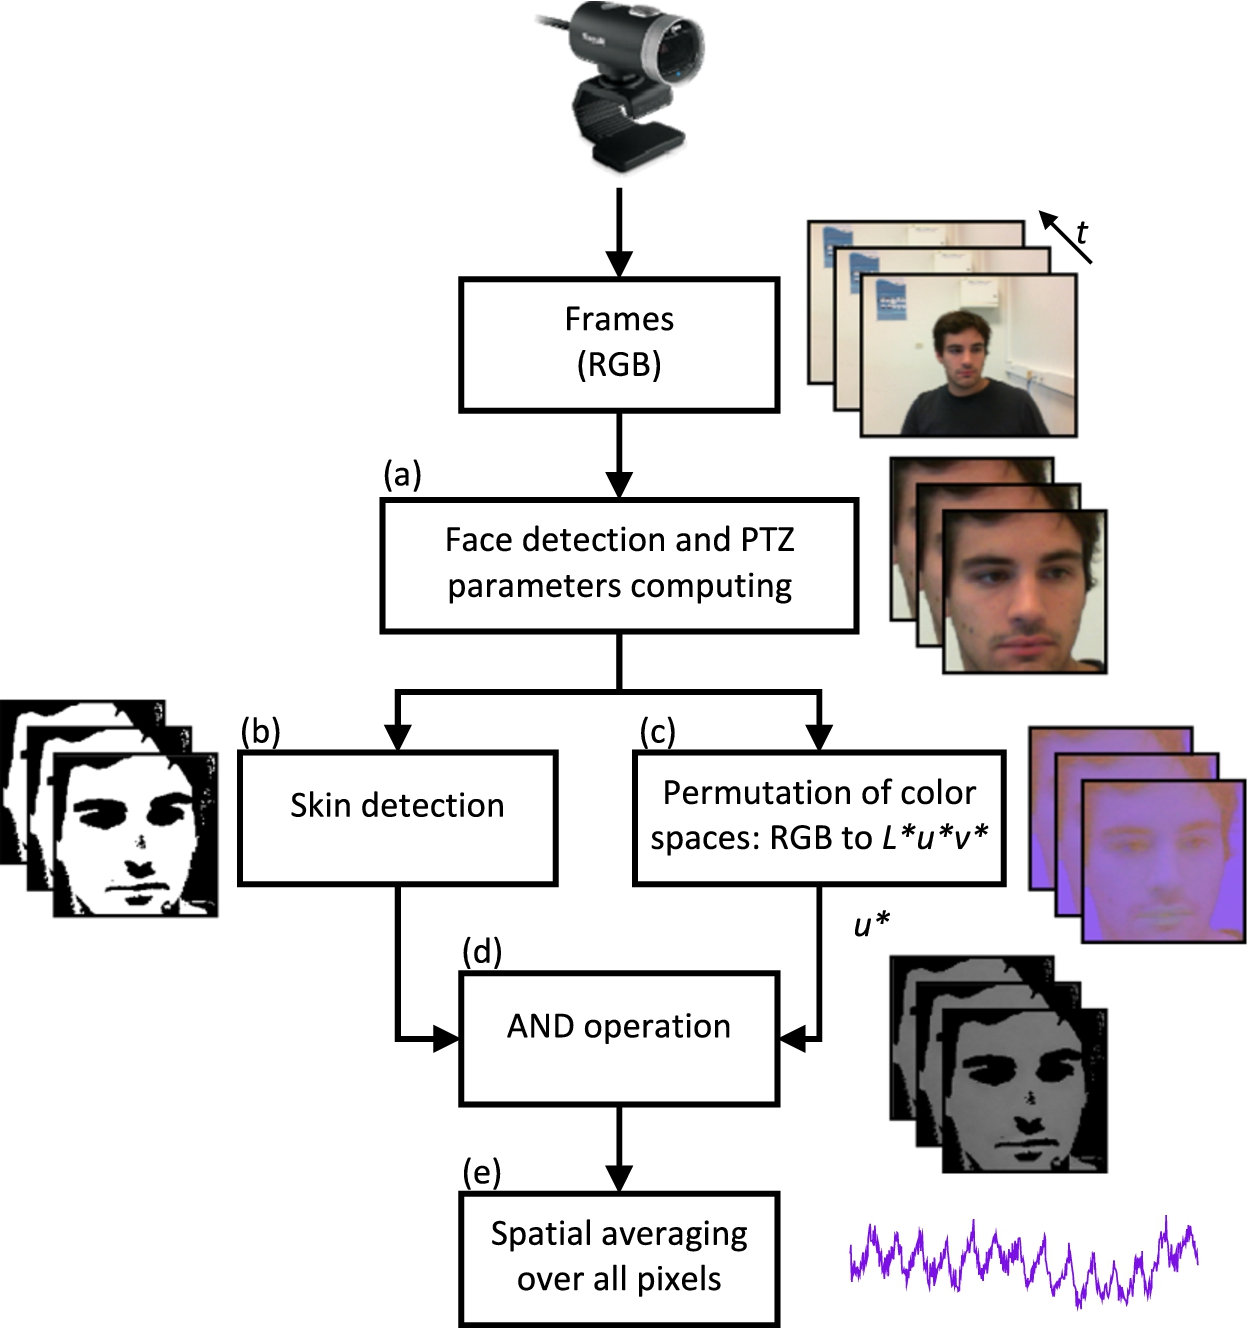
Image processing algorithm overview [15]. (a) Pan, Tilt and Zoom parameters are computed to zoom and track the face. (b) Pixels that contain PPG information are isolated by a skin detection. (c) The native RGB color space is converted to the CIE
In the following section and subsections, we detail a filtering technique based on the continuous wavelet transform, a particular time-frequency representation of time series. The presented filter is an upgrade from our previous method [15] and was updated to meticulously remove signal artifacts that corrupt raw PPG signals without altering the amplitude information.
Continuous wavelet transform. The continuous wavelet transform (CWT) constructs a time-frequency representation of a signal. The CWT uses inner products to measure the similarity between an analyzing function and the PPG signal. Unlike the Fourier Transform and the short time Fourier Transform, the CWT can detect rapid changes in frequencies in time due to its variable window width. The non-stationary PPG signal is convolved with a child wavelet
The global energy (Fig. 4(b)) is computed using the absolute CWT of this signal. We select the point that presents the maximum energy (Fig. 4(b)) and use the corresponding scale for further processing. Also, this particular scale gives an estimation of the mean pulse rate in the observed PPG signal.
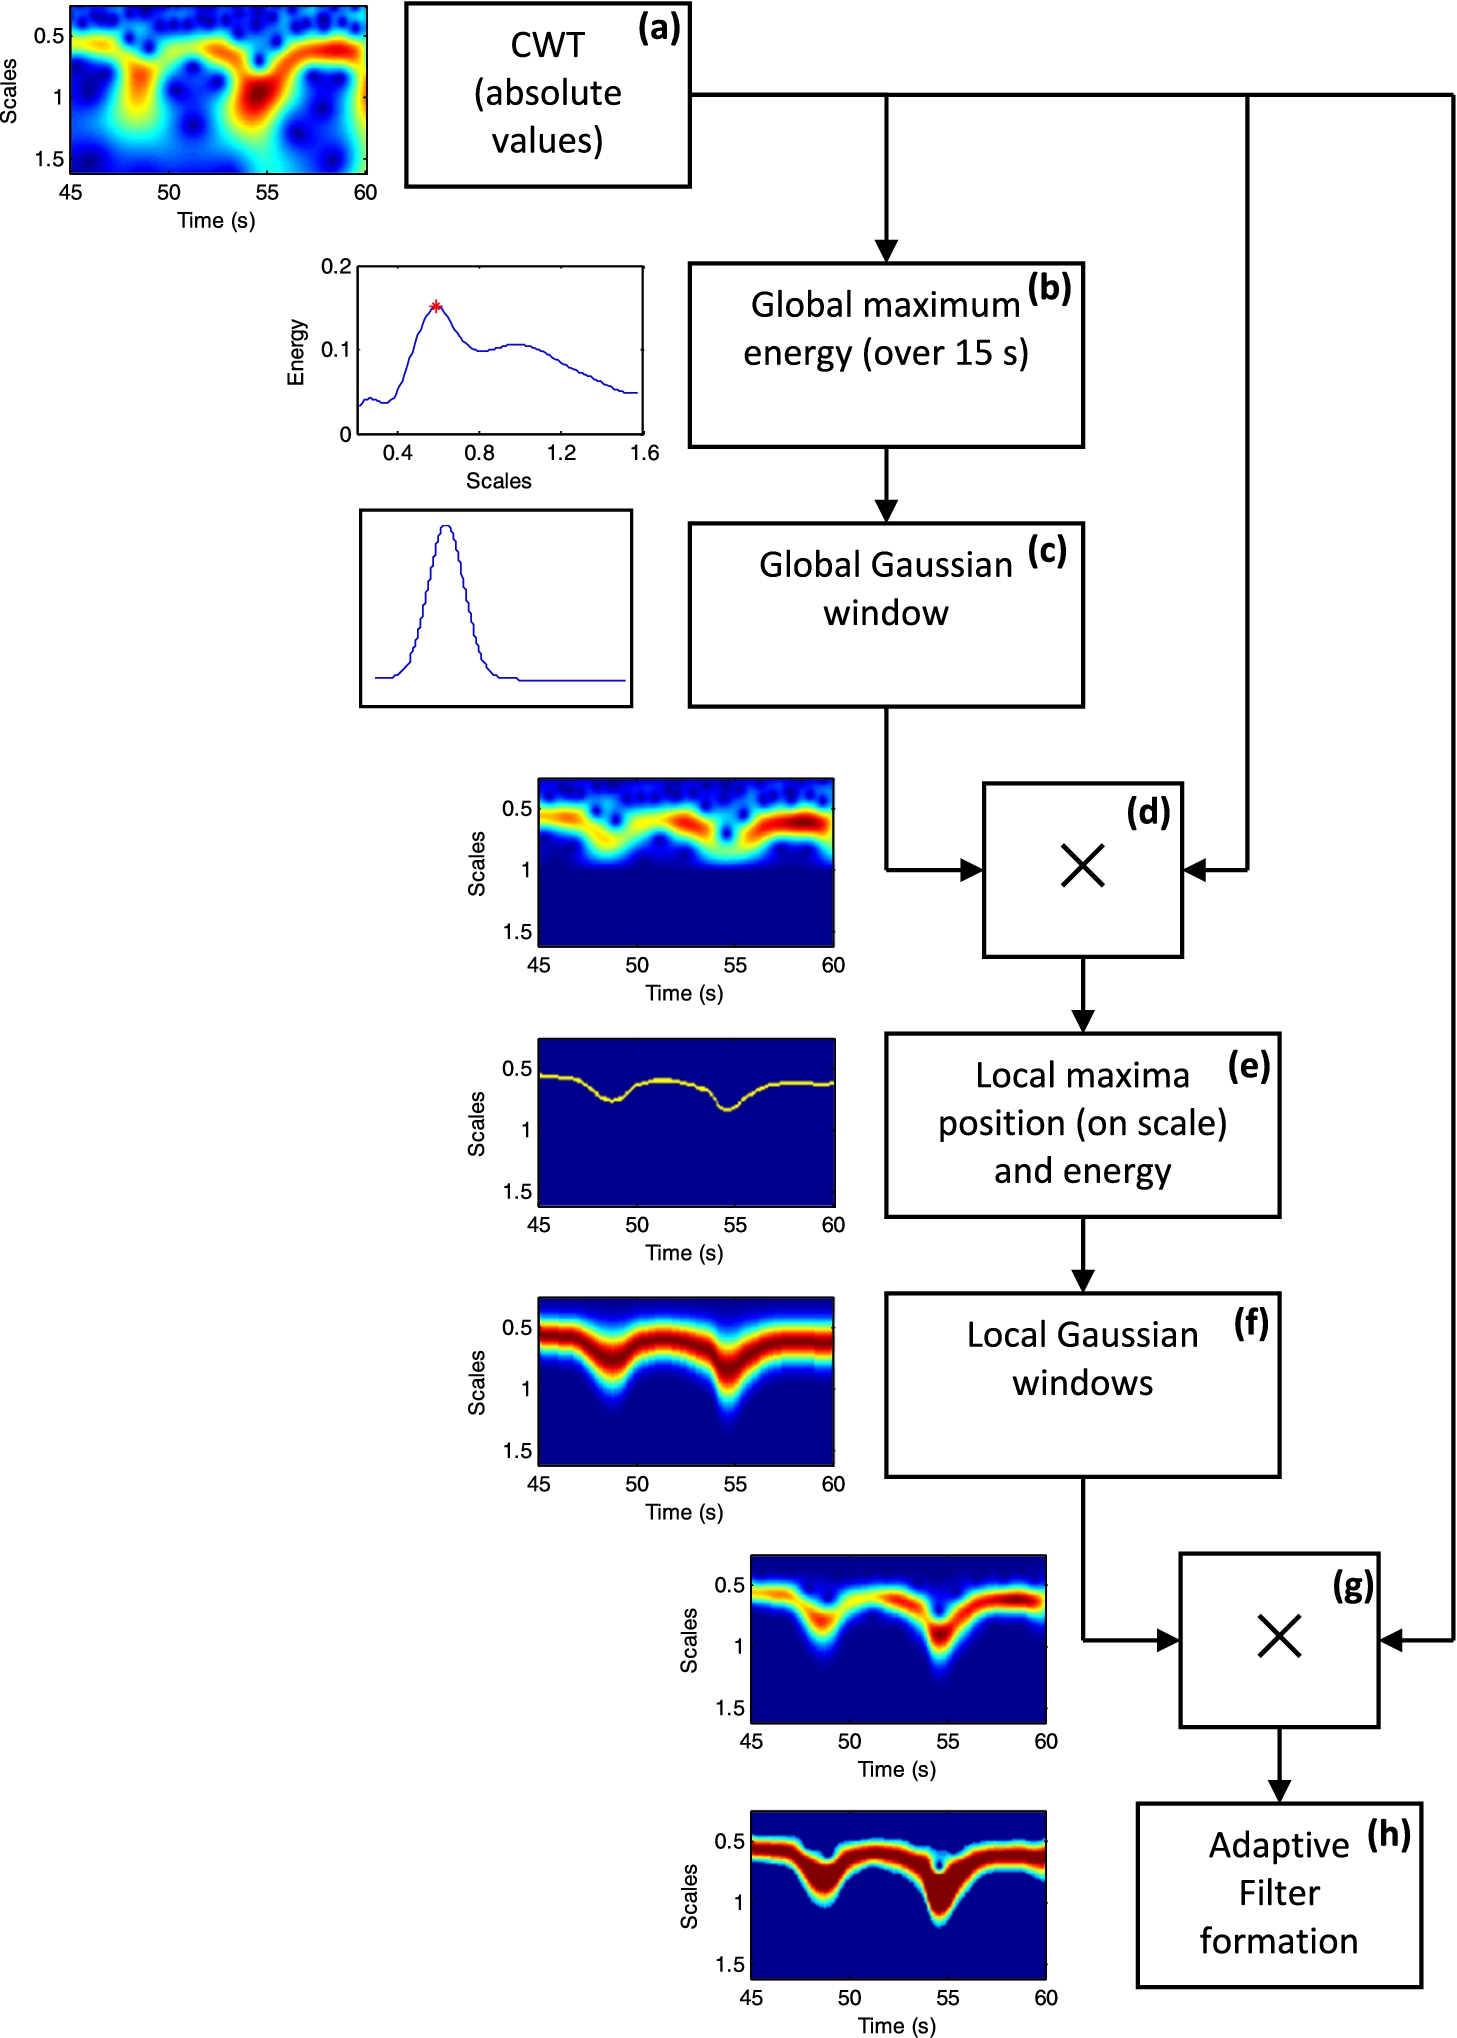
Filtering method overview. An adaptive filter is formed using the absolute continuous wavelet transform of a raw PPG signal by using a 15 s moving window with a 1 s increment (a). The maximum energy in scale is computed (b) and gives the average pulse rate of the windowed signal. A Gaussian window (c) is placed around the maximum location to filter the raw CWT. The generated representation (d) is employed to detect local maxima on each column (e) that represent pulse rate fluctuations. A local Gaussian window is then placed on each maximum (f) and once again combined with the raw CWT to precisely remove non relevant coefficients (g). The CWT coefficients of the produced representation are altered by the Gaussian windows, leading the amplitudes of the filtered signal – computed using the inverse wavelet transform – to be disturbed. Thus, a filter that maintains only relevant wavelet coefficients (h) was developed and combined with the CWT of the raw PPG signal.
Global filtering using an adaptive Gaussian window. An adaptive Gaussian window with variable length is computed (Fig. 4(c)) and combined with the raw wavelet transform in order to remove non relevant coefficients that belong to the cardiac frequency band. The window is centered around the maximum energy location on scale (Fig. 4(b)). The CWT frequency spreading is more important in lower than higher frequencies when presented in a linear way. Thus, the Gaussian will be stretched when positioned in lower frequencies and contracted when placed in higher frequencies. The window width is computed using
Local filtering using a set of adaptive Gaussian windows. Local maxima of the filtered CWT representation (Fig. 4(d)) are computed. The produced representation (Fig. 4(e)) gives an estimation of the cardiac pulse wave frequency fluctuations on time. An adaptive Gaussian window is placed around each local maximum. The length is computed just like before (see Eq. (5)). α is set to 4 this time in order to create narrower enclosing windows (Fig. 4(f)). This step is used to suppress non-relevant CWT coefficients that are not related to the cardiac pulse wave. The association of all these Gaussian windows is then combined with the raw CWT. In addition to local frequency fluctuations, the resultant transform (Fig. 4(g)) represents the amplitude evolution of the photoplethysmographic pulsatile component.
Filter application and inverse transform. The wavelet coefficients are weighted by all the Gaussian windows when multiplying the raw transform (Fig. 4(a)) with the local filter (Fig. 4(f)). These biased coefficients alter the amplitude of the signal reconstructed by the inverse transform. Thus, a new filter is formed to attenuate this bias (Fig. 4(h)). The maximum coefficient on each column is extracted and compared to all other coefficients to form the filter by using the following criteria:
The adaptive filter is finally combined with the raw CWT before computing the inverse transform. Residual CWT coefficients that present non-physiological intensities are automatically removed from the filtered representation. White skin present a maximum natural photoplethysmographic variation of 0.4 when observing the pulsatile component on the
The processing algorithms detailed in the previous section were employed to extract the PPG amplitudes fluctuation by the webcam for each subject. This physiological parameter was concurrently recorded using a finger blood volume pulse sensor. All the responses were smoothed using a 10 seconds two-sided moving average and normalized between 0 and 1 to only observe relative amplitude fluctuations. A typical example is presented in Fig. 5, where the curves from participant #4 (Fig. 5(a)) and #10 (Fig. 5(b)) can visually be compared. The two measurement techniques were able to sense the slight decrease in the amplitudes of the participant #10, which occurred between
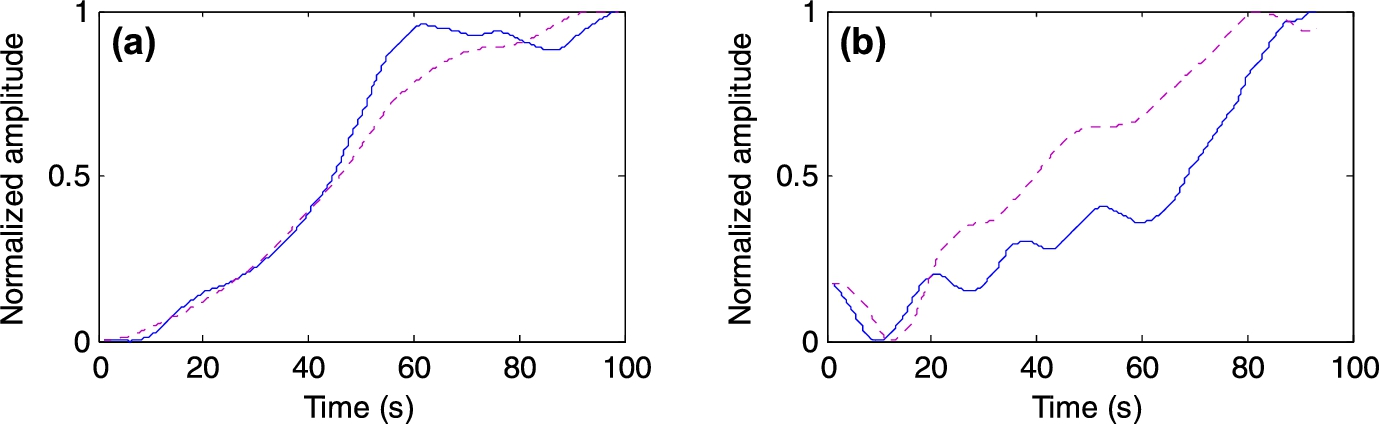
Two typical examples representing photoplethysmographic amplitude fluctuations from subject #4 (a) and #10 (b). Blue solid-line plots correspond to the amplitude variation measured remotely by the webcam while purple dashed-line plots are derived from the contact (reference) sensor.
Results of the statistical analysis between the measurements recorded using the webcam and the finger blood volume pulse sensor
The results exhibit strong correlation between the two measurement techniques, the mean correlation between all participants being higher than 0.9. In addition, the mean error between the remote and contact sensors is equal to 0.13 and its mean standard deviation to 0.1. In addition, boxplots were employed to represent the mean amplitudes during the first (≈first 45 seconds) and the second (≈last 45 seconds) half of the experiment for all the twelve participants and for both the contact (Fig. 6(a)) and remote (Fig. 6(b)) measurement techniques.
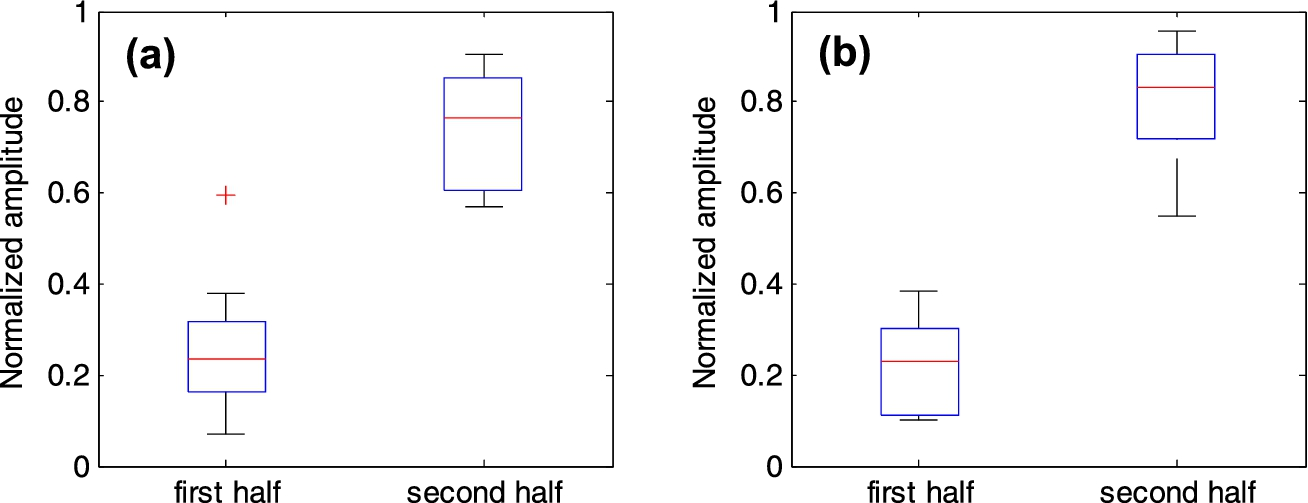
Boxplots representing the mean values during the first (≈first 45 seconds) and the second (≈last 45 seconds) half of the experiment for all the twelve participants and for both the contact (a) and remote (b) measurement techniques.
The presented results exhibit strong correlation (Table 1) between the reference sensor and the webcam. It indicates that the trend of the signals evolves in the same direction, even in presence of a residual error between the two measurements (Fig. 5(a)). This observation can also be appreciated for both contact and remote techniques in the boxplots presented in Fig. 6, where a significant increase of the amplitudes is observable between the first and the second halves of the experiment.
The fluctuations of the PPG pulsatile amplitudes are assessed using a low-cost webcam, particularly by analyzing the continuous wavelet representation of the photoplethysmographic signal. There are certain limitations that should be pointed out when considering the results presented in this study. The signals that describe the PPG pulsatile amplitudes were smoothed using a two-sided moving average operation, leading that only the global trend of the amplitudes evolution is compared herein. Yet, correlation and statistical coefficients presented in this study reveal that this trend can precisely be measured using a low-cost webcam. Otherwise, the experiments were performed on a set composed only by 12 participants. It is obvious that a larger sample should permit to ascertain the clinical validity of the method. Herein, the purpose of this study is to evaluate the feasibility of such a method, which is relatively innovative.
A contact sensor is placed on the finger to measure the reference signal. In contrast, the webcam is used to record photoplethysmographic signal on the skin of the face. The measurement sites are different. A general reaction of the body is orchestrated during a physical effort, particularly during the first moments of the exercise. It causes a peripheral vasoconstriction of the skin capillaries. In contrast, a peripheral vasodilation occurs during the rest period, which leads to an increase in the amplitudes of the measured PPG signal. Moreover, studies have shown that arterial oxygen saturation on the finger is as sensitive as in the forehead [23]. Nevertheless, other studies tend to demonstrate that the variation orchestrated by the sympathetic nervous system in the pulsatile component of the PPG signal is more sensitive in the finger than other regions of the body [24]. To conclude, there is no evidence that the measurements taken on the finger follow the same magnitude that the measurements recorded by observing the face, particularly when using webcams or other imaging devices.
The perceptible trends in a raw PPG signal do not always contain physiological information. These trends can be generated by other sources, especially when using imaging devices like webcams to compute the signal. The lightning source, in particular artificial lights like fluorescent light, can generate strong artifacts and trends in the recovered signal. Independently of the sensor used, the motion is a parameter not related to the physiology that must be integrated to the measurement method. For example, the contacting force between the finger probe and the measurement site can deteriorate the recovered signal [25]. The pulse wave can even vanish if the pressure is too important.
The improvement of the signal to noise ratio is principally due to the image processing methods proposed in this work. Basically, the skin detection (cf. Section 2.3.1) is an essential step, developed to gather only skin pixels that contain the photoplethysmographic information. As it was described in Section 2.3, we have employed the
We also tried the implementation of the independent component analysis (Fig. 7(a)) proposed by Poh et al. [12], particularly on the native red green and blue color channels to extract the pulsatile amplitudes of detrended PPG signals [12]. We can visually observe that the amplitude variation is hardly identifiable in this signal. The skin detection (Fig. 7(b)) proposed in this study is particularly trivial and must be upgraded to a more robust (invariant to the illumination source and the participant skin color) method. Nevertheless, it provides a significant improvement of the raw signal and allows a more precise detection of the PPG amplitudes. This step was particularly developed to remove non-skin components, like hair, mustache, beard or eyes. Other parameters like the number of pixels that composes the face, which is related to the distance between the user and the camera, may degrade the quality of PPG signal.
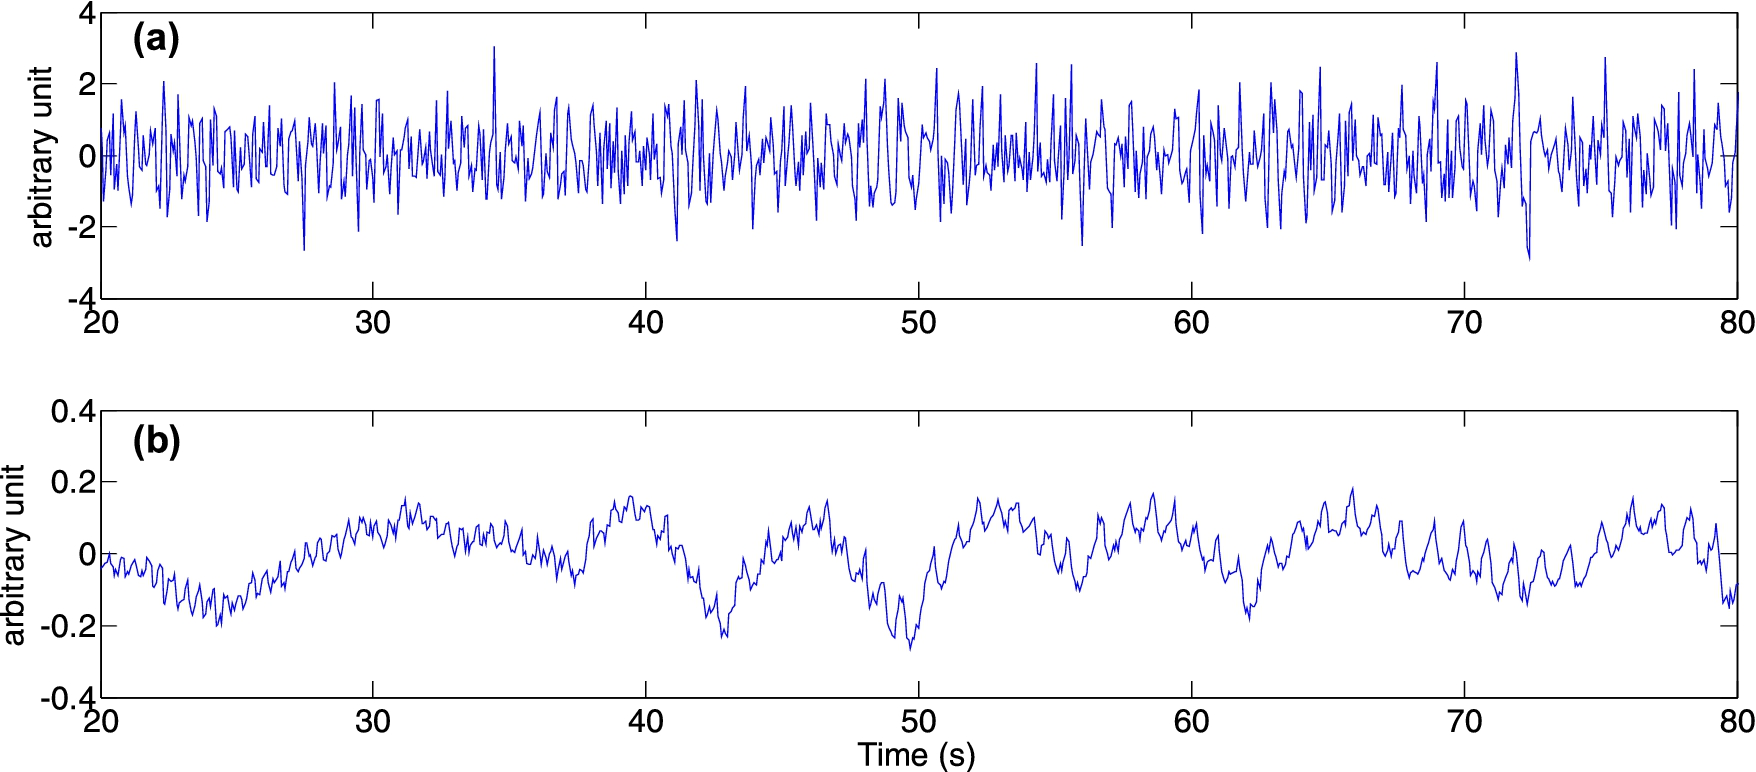
The independent component analysis was used on the detrended red, green and blue signals (a). The instantaneous pulse rate and the PPG amplitudes are not clearly perceptible in this particular reconstituted signal. In contrast, the method proposed in this study (b) is based on an efficient skin detection that improves the signal to noise ratio. The amplitudes fluctuation is herein clearly identifiable.
A low-cost webcam was employed to record color variations on the skin of the face to assess the peripheral vasomotor activity, specifically during recovery periods that occur after physical exertion. The amplitudes of the photoplethysmographic signals, which reflect local vasomotion fluctuations, were assessed using a filter based on the continuous wavelet transform. The participants were asked to perform a short but intense physical effort to cause a peripheral vasoconstriction of the skin capillaries, leading to a reduction of the pulsatile component amplitudes. Our results shown that the measurements derived from the webcam were in close agreement with an approved blood volume pulse sensor. Only slow amplitude variations and global trends were assessed in this study. Thus, our future work consists in improving the method in order to robustly measure rapid fluctuations and assess the pulsatile content of the signal extracted from the webcam. In addition, motion experiments must be conducted to evaluate the robustness of the methods over movements in order to assess the limits. Finally, comparisons experiments must also be conducted to extract strengths and weaknesses of the methods proposed by other authors of the community.
Conflict of interest
The authors have no conflict of interest to report.