
Abstract
BACKGORUND:
The development of vibration-induced finger disorders is likely associated with combined static and dynamic responses of the fingers to vibration exposure. To study the mechanism of the disorders, a new rat-tail model has been established to mimic the finger vibration and pressure exposures. However, the mechanical behavior of the tail during compression needs to be better understood to improve the model and its applications.
OBJECTIVE:
To investigate the static and time-dependent force responses of the rat tail during compression.
METHODS:
Compression tests were conducted on Sprague-Dawley cadaver rat tails using a micromechanical system at three deformation velocities and three deformation magnitudes. Contact-width and the time-histories of force and deformation were measured. Additionally, force-relaxation tests were conducted and a Prony series was used to model the force-relaxation behavior of the tail.
RESULTS:
The rat tails’ force-deformation and stiffness-deformation relationships were strongly nonlinear and time-dependent. Force/stiffness increased with an increase in deformation and deformation velocity. The time-dependent force-relaxation characteristics of the tails can be well described using a Prony series.
CONCULSIONS:
We successfully quantified the static and time-dependent force responses of rat tails under compression. The identified mechanical behavior of the tail can help improve the rat-tail model and its applications.
Introduction
It has been generally hypothesized that the initiation and development of vibration-induced finger disorders are primarily associated with the mechanical deformations and stresses of the fingers exposed to combined compression/pressure and vibration during the operation of powered tools [1]. Biological or animal models have commonly been used to help understand the mechanisms associated with the development of vibration-induced finger disorders by examining the relationship between vibration exposure factors and their physiological and pathological effects [2–6]. Of the biological or animal models, rat-tail models have been most frequently used due to their mechanical and physiological similarities to the human finger [7,8]. The most critical consideration for a vibration biological model of the finger is to replicate the real-world biomechanical environment which the fingers experience during the use of powered hand tools, since the mechanical environment of the soft tissues (i.e., static and dynamic stresses and strains) can modulate the growth, remodeling, and morphogenesis of the biological system [9].
Limitations of previous rat tail models have made it difficult to sufficiently simulate the biomechanical environment of the fingers, making it difficult to reliably quantify both static and dynamic stresses and strains in these models [10]. As a result, a reliable quantitative relationship between the mechanical environment and biological effects has not been established. This has led to the development of a novel rat tail model for further studies [10]. The new rat-tail model closely simulates the vibration exposure of the fingers grasping a tool and has made it possible to quantify the biomechanical environment of the tail conveniently and reliably. Its preliminary applications have demonstrated that the new model can work as designed [10,11].
While the new rat tail model has greatly improved upon the limitations of previous animal models, a crude method was used to estimate the tail deformation from the tail contact width [10]. This crude method may be acceptable for identifying the basic characteristics of the tail strain, but it is not accurate; a more reliable and accurate method should be established to measure the tail deformation and to estimate the static and dynamic strains. Furthermore, like soft tissue, the tail deformation or strain may be time-dependent, but this feature has not been investigated; it is unknown whether the deformation measured at the beginning of a vibration experiment can be used to represent the deformation for the entire experiment that usually last about 4 hours [11]. In the previous study [10], the dynamic stiffness and damping value of the tail were estimated from the vibration transfer function of the exposure system measured in a vibration test. They are critical biodynamic parameters for determining the tail vibration stress. An alternative method should be considered to estimate these biodynamic properties for further verifying the validity of the reported results. This knowledge may also be useful to help understand the biological effects of the combined pressure and vibration exposures. Therefore, the purpose of the current study is to develop a method for quantifying the tail deformation as a function of applied force and to identify the static and time-dependent characteristics of the rat tail under compression.
Methods
Specimen preparation
Eighteen tails dissected from male Sprague–Dawley cadaver rats (length: 172 ± 9 mm) were used in this study. These rats had served as air controls in inhalation exposure studies, with the inhalation exposure protocols being approved by our Institutions Animal Care and Use Committee. All eighteen tails were collected and put on ice after the rats were euthanized, stored at about 5 °C (41 °F), and then the tail samples were delivered to our laboratory immediately after. Each tail was wrapped in aluminum foil before being placed on ice to minimize air or water exposure. To preserve the mechanical properties of the tail during testing, all samples were stored around 5 °C to ensure that both the onset of rigor mortis and freezing were avoided [12]. No tails were stored in the ice (5 °C) for longer than 5 hours prior to testing. Approximately an hour before testing, the tail was removed from the ice to warm to room temperature (22 °C or 72 °F), which was verified using a non-contact surface thermometer. For each tail, a 7.5 mm diameter section was measured using a digimatic caliper, and the 7.5-mm-location was marked prior to testing, to ensure the tail diameter (d) at the compression location was consistent for all trials.
Experimental set-up for compression tests
Two experimental testing set-ups were used for the tail compression tests, which are detailed in 2.2.1 and 2.2.2. All compression tests were conducted using the Mach1Motion micromechanical testing system (BioSyntech, Montreal, QC, Canada), which was equipped with a displacement sensor with a resolution of 0.5 μm and a 98 N (10 kg) load cell with a resolution of 4.90 mN (500 mg). The maximum sampling rate of the testing machine was 50 Hz. For all the compression tests, each tail was only used once and then discarded. To ensure representative conditions, the tail was placed in a rigid base platen (Fig. 1), which was identical to the loading plate used in the new rat tail model [10]. The base platen was fabricated using a 3D printer (polylactic acid), and the testing slot was sloped to match the shape of the rat tails to create a level contact area between the indenter platen and the tails. Additionally, the radius of the testing slot on the base platen was 2–3 times that of the tails, to ensure the tail remained unconfined during compression (no contact with slot walls). The indenter platen used in the current study was a rectangular piece of plexiglass, which was substantially more rigid than the rat tail, and was cut precisely to be 57 mm in length and 25 mm in width (1.5 mm thick). The indenter platen had a smooth flat contact surface, simulating the flat vibration platform used in the new rat-tail model (Fig. 1) [10].
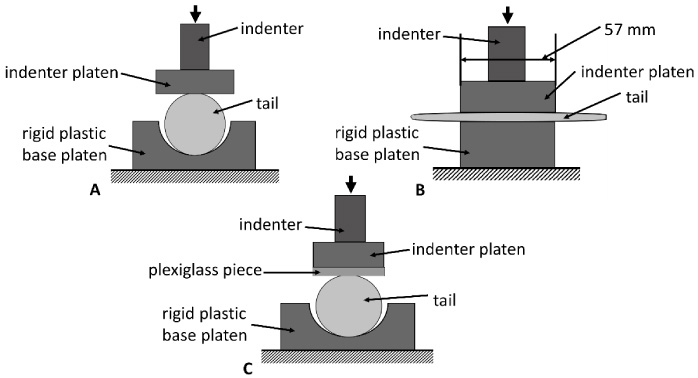
Schematics of the testing setups used. A: front-view schematic of setup for compression testing. B: side-view schematic of setup for compression testing. C: front-view schematic for the compression testing setup used to measure contact width.
During the force-deformation testing, the indenter platen was centered over the 7.5 mm diameter mark on the tail and applied directly to the top surface of the tail (Fig. 1A & 1B). For the force-deformation testing, a total of nine tails were used. Three tails were tested at each of the three deformation velocities (0.15 mm/s, 0.05 mm/s, and 0.015 mm/s), and all tails were compressed to a deformation magnitude of 1.875 mm (25% compression ratio). The deformation velocities used in this investigation were selected to avoid damaging the tissue of the rat-tail during testing and because the deformation rates were also comparable to those previously defined and used for human skin tissue [13]. The deformation time histories are displayed in Fig. 2A to show the differences between the three deformation velocities.
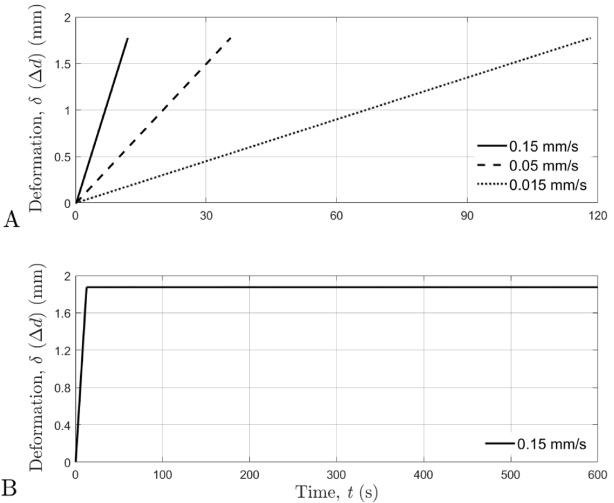
The deformation-time curves. A: deformation-time curves for each deformation velocity. B: deformation-time curve for force-relaxation tests.
For each trial, the pre-conditioning compression process was applied as follows: (1) the indenter platen moved downwards until contacting the tail sample, (2) the tail sample was then compressed until reaching the 1.875 mm deformation, (3) the indenter platen then moved up exactly 1.875 mm, and (4) the indenter then prepared for another compression cycle; for the rest of the compression cycles, the indenter just moved precisely down 1.875 mm and then up 1.875 mm. A total of 10 compression cycles were completed for each trial to guarantee that the tail reached a steady state (Fig. 3). The ninth compression cycle was selected for data analysis as it was consistently the most representative curve of the steady state (Fig. 3).
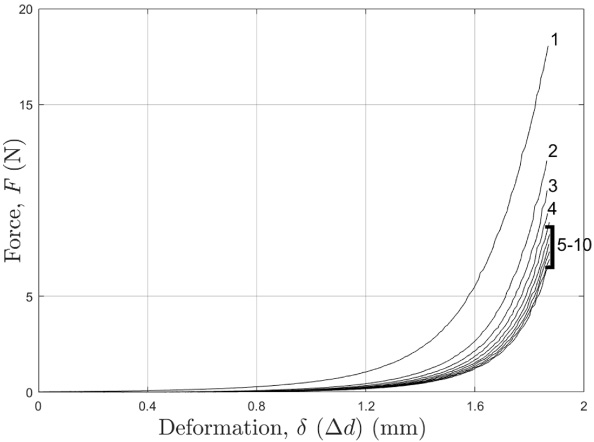
Representative force-deformation curves from one tail for all 10 compression cycles.
For the 0.15 mm/s deformation velocity, an additional 11th compression cycle was done with an 11-minute hold executed immediately after completion of the deformation, which was used to evaluate the time histories of the force responses during the force-relaxation of the tails. The deformation-time relationship for the 11-minute hold used for the force relaxation testing is displayed in Fig. 2B.
For the contact width measurement, an additional nine tails were used. Three tails were tested at each of the deformation magnitudes (0.75 mm, 1.35 mm, and 1.875 mm); all tests were performed at a deformation velocity of 0.015 mm/s. To determine the contact width between the tail and the indenter platen during testing, a light coat of baby oil and then baby powder was applied to the tail. A plexiglass piece (1.5 mm thick) identical in size to the indenter platen was then placed on top of the tail (Fig. 1C). The previously marked 7.5-mm-location on the tail was lined up with the center of the plexiglass piece and the center of the plastic indenter platen, and then the tail was compressed (Fig. 1C). After compression the plexiglass piece was carefully removed. The powder left a detailed outline of the contact width between the tail and the plexiglass piece during compression, which was photographed with a reference scale. All tail contact width data were then evaluated using the images.
Data processing
The time-histories of force and deformation from the ninth cycle of the compression tests at each deformation velocity were selected for processing and interpolated in MATLAB (Mathworks Inc., Natick, MA) to 46 data points, and then the three interpolated trials were averaged to obtain representative values for each deformation velocity. Stiffness (k) was computed from the collected data as the gradient of force (F) with respect to deformation (𝛿) in MATLAB
In the force-relaxation tests, a 25% deformation of the tail diameter (d) was applied at a velocity of 0.15 mm/s which took approximately 12.5 s to complete, and the deformation was then held constant. Since the maximal deformation was reached at t = 0, the force time-histories (F (t)) were recorded for t > 0. The force data was then normalized to the maximum force (F
0), which occurred at t = 0 (F
0 = F (0)). The force time-histories from the experimental testing, g (t), are characterized by:
In the current study, a Prony series was used to model the time-histories of the force responses during the force-relaxation of the tail:
Representative force response data for the pre-conditioning compression cycle testing is shown in Fig. 3. During the compression cycling, the mechanical property of the tail approached a steady state, which is characterized by the converging force-deformation curves (Fig. 3).
The time-histories of the force-deformation and stiffness-deformation curves are displayed in Fig. 4; and the corresponding normalized curves for force-deformation and stiffness-deformation are displayed in Fig. 5. The force-deformation and the stiffness-deformation characteristics of the rat tail were found to be strongly nonlinear and time-dependent. As deformation increased, force and stiffness increased. Additionally, the faster deformation velocities resulted in increased force and stiffness values.
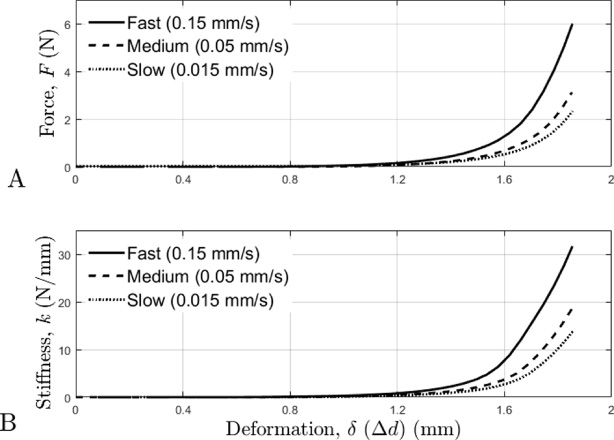
A: The average force-deformation curves during the compression tests for each of the three deformation velocities. B: The average stiffness-deformation curves during the compression tests for each of the three deformation velocities.
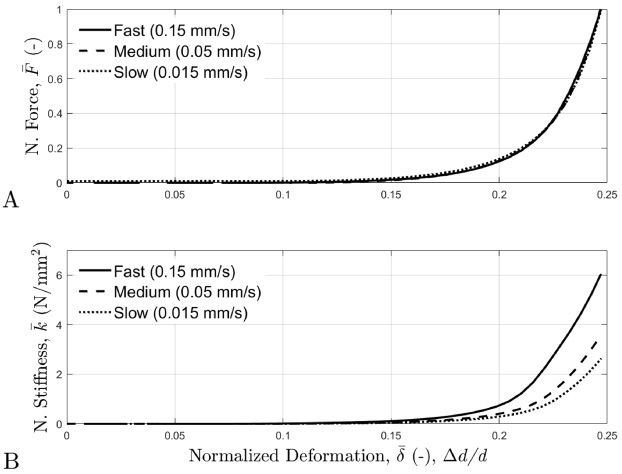
A: The normalized average force-deformation curves for each deformation velocity, where force is normalized as follows: instantaneous force normalized to the maximum force at (F (t)∕F max). B: The normalized average stiffness-deformation curves for each deformation velocity, where stiffness is normalized as follows: stiffness normalized to the maximum contact width at the 25% compression ratio of the tail diameter.
The force-relaxation curve was also strongly nonlinear, as displayed in Fig. 6. The experimental test data for the force-relaxation relationship was modeled using a four-term-Prony series (Eqs (1)–(2)), which provided a good fit, with the coefficient of determination (R 2) between the test data and the fitted curve being 0.9998 (Fig. 6). The fitted Prony series curve for the force-relaxation of the tail displayed in Fig. 6 was interpolated to 20 data points, which was done for visual purposes only. The force-relaxation parameter, g i , and the relaxation time coefficient, 𝜏 i , in the Prony series are obtained in an optimization procedure: g i (i = 1,2,3,4,5) 0.2575, 0.1898, 0.0817, 0.1338, 0.3189; and 𝜏 i (i = 1,2,3,4) 0.3683, 0.0471, 0.0096, 0.0017 (1/s).
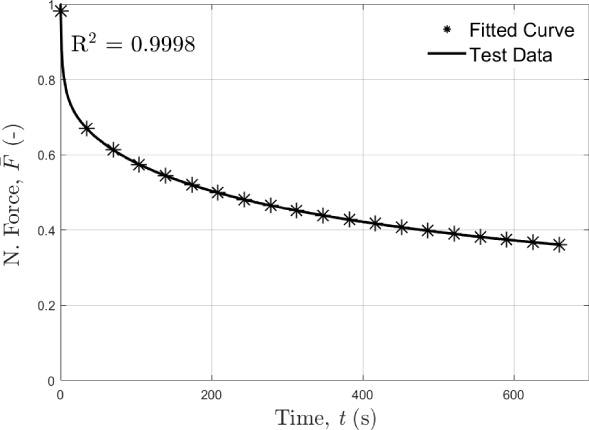
The average force-relaxation curve from the test data for the 0.15 mm/s deformation velocity, and the force-relaxation curve computed using the four-term-Prony series. The y-axis is normalized force (N. Force) (
The average contact width (W) between the tail and indenter platen increased linearly with increasing deformation (Fig. 7A) and nonlinearly with increasing compression force (Fig. 7B).
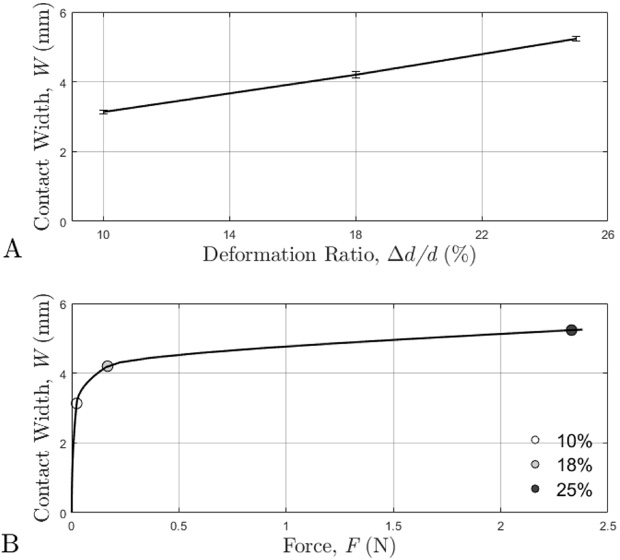
A: Average contact width at each deformation ratio (ratio of deformation and tail diameter). B: Average contact width at each deformation ratio with the corresponding force values (x-axis).
Our study analyzed the static and time-dependent characteristics of the rat tail under unconfined compression. We found that the mechanical behavior of the rat tail during unconfined compression was both nonlinear and time-dependent – stiffness increased nonlinearly with increasing deformation and deformation velocity. The mechanical characteristics of the rat-tail displayed during the force-relaxation testing was also strongly non-linear. Additionally, we demonstrated that the force-relaxation characteristics of the tails can be successfully described using a Prony series. The results obtained in this study can help improve the current design of rat tail vibration tests and potentially contribute to the reduction of vibration-related finger disorders.
Characteristics of tail compression behavior
The mechanical behavior of the rat tail was strongly nonlinear and time-dependent for both force and stiffness; the faster deformation velocities resulted in increased force and stiffness at the same deformation magnitudes, when compared to the slower speeds (Figs 4 & 5). Force and stiffness also increased with increasing deformation. In general, the force and stiffness curves had an initial toe region, a transition region as exponential force/stiffness growth began to increase, and then a region that experienced accelerated exponential force/stiffness growth.
Previous research has reported force-deformation and stiffness-deformation time histories for the human finger during compression at different contact angles (15–60°), which demonstrated that the force and stiffness increased at the same deformation magnitudes as the contact angle increased [14]. The general trends of the force and stiffness responses of the rat tail determined in our study are very comparable to those reported for the human finger [14], except for the magnitude of stiffness. The difference in stiffness magnitude between the current study and the previous study [14] is most likely due to the difference in approach, as the previous study applied a linear method to calculate stiffness (F∕𝛿). As the stiffness-deformation curve is strongly nonlinear, the method used by the previous study likely grossly underestimated the magnitude of stiffness [14], and the “tangential” method (∂F∕∂𝛿) used in the current study is more appropriate and thus the stiffness magnitudes are likely more accurate. Based on the mechanical characteristics of the tail and those previously reported on the finger [14], the rat tails had a mechanical response that is comparable to the human finger under unconfined compression.
The stiffness magnitudes reported in the previous novel rat tail model study [10] were about 3–5 times greater than those reported in the current study. The variations in stiffness magnitude between the two studies is likely due to the experimental differences. In the current study, only compressive loading was applied to the tail, whereas the previous study employed a combination of static compression/pressure and vibration, which likely increased the stiffness of the tail.
The force-relaxation behavior of the rat tail was also strongly nonlinear (Fig. 6). The initial region of the force response from the force-relaxation curve exhibited accelerated exponential decay, followed by a transition region where exponential decay began to deaccelerate, and finished with a flat region that continued to flatten as time (t) approached infinity (Fig. 6). When comparing the force-relaxation characteristics of the tail to those previously measured in skin tissue [13], similarities and differences exist. The force-relaxation behavior of the tail and skin both have strong nonlinear mechanical characteristics with a similar curve trajectory, however, the transition and flat region of the force response of skin occurred in a much shorter time duration than the rat tail, and the transition and flat region of the force response of the skin occurred at a much smaller maximum force ratio than the rat tail [13]. The differences in the force-relaxation response between the skin tissue [13] and rat tail in the current study are likely because of the differences in the thickness of the test sample and, most importantly, because of the differences in the microstructure of the samples.
In the current study, we demonstrated that the four-term Prony series fits the force-relaxation data obtained from the experimental compression tests well, as the two data sets exhibited strong agreement between each other (R 2 = 0.9998). Based on the agreement displayed between the Prony series and the experimental test data, we were successful in modelling the force-relaxation behavior of the rat tail. The limitation of the model is that the maximum was represented as g (0) = 0.982 instead of 1.0 theoretically, meaning that there will be a relative error of 2% for the model at t = 0. This limitation was accepted as it required the addition of many terms to the Prony series to reach 1.0 (theoretical maximum).
Contact width increased linearly with increasing deformation in compression (Fig. 7A). However, the relationship between the contact width and force was strongly nonlinear (Fig. 7B). The nonlinearity of the contact width-force relationship is due to force being nonlinearly related to deformation for the rat tail in compression. In the initial region of the contact width-force curve, there was gradual exponential growth, followed by a transition region, and then a flat region which continued to flatten as the force approached infinity. The trends of the linear relationship between contact width and deformation as observed in the current study are comparable to those reported for the human finger [14]. The contact width and corresponding force values in the current study are also comparable to those reported during the development of the new rat tail model [10].
Potential applications of the testing results
The data measured in the study can be used to estimate the static and dynamic stress and strains of the tails. As an example, Fig. 8 illustrates the average static pressure/stress (𝜎) on the interface between the tail and indenter platen, as a function of the applied force. It was estimated using the applied static force (F), tail contact length (L), and contact width (W) shown in Fig. 7B, i.e., 𝜎 = F∕(LW). The vibration stress is superposed on the static stress. Once the vibration force (F vib) on the tail is measured or estimated from vibration experimental data [10], the average dynamic stress (𝜎dyn) on the interface can also be estimated using the following formula: 𝜎dyn = F vib∕(LW).
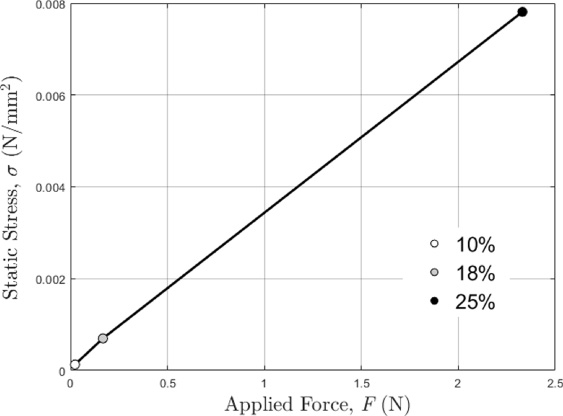
Average static contact pressure/stress (𝜎) and applied force (F) relationship for each deformation ratio (10%, 18%, 25%).
The deformation directly measured in the current study should be more reliable and accurate than the deformation that were previously estimated [10]. As an example, Fig. 9 illustrates the average static strain (𝜀) of the tails as a function of the applied force, which was using the measured deformation (𝛿) shown in Fig. 4A and original diameter of the tail (d), or 𝜀 = 𝛿∕d. The measured deformation can be used to determine the deformed tail diameter or h = d −𝛿. Once the vibration deformation (𝛿vib) of the tail is measured or estimated from vibration experimental data [10], the average dynamic strain of the tail can be estimated using the following formula: 𝜀dyn = 𝛿vib∕h.
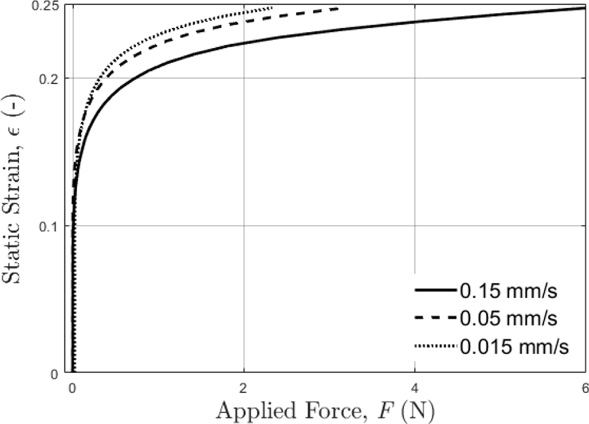
Average static strain (𝜀) of the tails as a function of applied force (F) for each deformation velocity (0.15 mm/s, 0.05 mm/s, 0.015 mm/s).
Although the mechanical stiffness of the tail varies with the applied force, it can be locally linearized for each given static force [10]. As the constant static force in the rat tail model remains unchanged during a biological experiment, the tail can be considered an approximately linear system in the vibration experiment. In the linear system, the vibration stress at each point in the tail should be approximately proportional to the vibration stress at the tail interface. Similarly, the vibration strain in the detail should also be approximately proportional to the overall vibration strain of the tail. Hence, the above-estimated static and dynamic stresses and strains can be used to represent the general loading environment of the tail under the combined compression pressure and vibration exposures for examining the relationships between the tail biodynamic responses and health effects [10].
This study found that the force-deformation relationship varied among the tested tails. It also varied with loading magnitude, loading cycle, and loading time. These features suggest that the pressure and vibration responses of each tail should be measured in the entire duration of the experiment so that the exposure dose can be accurately quantified.
A limitation of the current study is that rat tail cadavers were used, as there may be differences in the mechanical behavior between the cadaver tails and tails of living rats. Additionally, changes to experimental design (i.e., different base platen) may affect the force-deformation relationship presented in the current study, while the affect would likely be minimal, it should be considered when interpreting the results.
Conclusions
The current investigation was successful in quantifying the static and time-dependent force responses of rat tails under compression, which were strongly nonlinear and time-dependent. The quantification of the mechanical behavior of the rat tail during compression can aid in the improvement and appropriate application of the rat tail model used to determine the initiation and progression of vibration-induced disorders. The mechanical characteristics of the rat-tail determined in our study may also have clinical significance in mitigating disorders related to the hands-fingers and improving treatments for these conditions.
Footnotes
Disclaimer
The findings and conclusions in this report are those of the author and do not necessarily represent the official position of the National Institute for Occupational Safety and Health, Centers for Disease Control and Prevention.
Conflict of interest
The authors declare that they have no conflict of interest.