






Abstract
The study aimed to assess the pedestrian bridge structure along with the assessment of associated comfort due to human-induced vibration. It has focused on evaluating the footbridge behaviour consisting of two composite steel beams. The footfall analysis is carried out by Robot Structural Analysis software. It is noticed that human comfort is easily achieved for longer spans. An inverse relationship was found between natural frequency and bridge span. Human-induced vibrations produced human discomfort further leading to several incidents which could be avoided by abiding with the limits shown in several guidelines and standards. The study has addressed the issues of human-induced vibrations and comfort towards the structures of pedestrian bridges.
Introduction
In the contemporary world, the objective of the footbridges design process is to formulate a cost-effective and efficient structural design [26]. This objective is accomplished through the utilization of material strength which causes the formation of lightweight structures. The utilization of such material leads to the reduction of the total expenditures, and improved structural strength which in turn experiences vibration produced as a result of the human activity [23]. It is well known that pedestrians apply dynamic forces to the surface they are walking on. The vertical component of pedestrian induces a footfall frequency (typically around 2 Hz) which is about 40% of their body weight.The equivalence of the human-induced frequency and the structural natural frequency can lead to resonance problems [22, 26] (Knudsen et al., 2019). This resonance occurrence is not only limited to the fundamental structure frequency but also for higher natural frequencies (Knudsen et al., 2019). To this end, several load models have been developed to address the issues related to human-induced vibrations causing discomfort. It is because the bridge deck and the foot are always in contact which results in the prevalence of the loading at all times. This discomfort is related to the human perception which is dependent upon individual characteristics and psychological influences constituting of physical factors, the frequency of vibration, acceleration, and excitation location [21].
The vibrations resulted from human footfalls would cause serious problems that might lead to closure of some structures such as London Millennium Footbridge in 2000. In that case, the lateral forces induced by human are correlated and synchronized between crowds which are the reason for the beginning of horizontal sway. The perception of that sway between individuals enforces them to synchronize with the swaying of the bridge to maintain lateral balance. This means that the applied footfall forces are in phase with bridge resonant frequency which lead to more increase in motion. This scenario is called the “lock-in” phenomenon. It has been concluded that the reason of such motion is that the combination between high density of pedestrians and the existence of lateral mode shapes below 1.3 Hz. In the Millennium Footbridge, a large amount of damping are installed which increases the critical number of pedestrians required to cause such excessive response [10].
After that major incident of lateral vibrations, many international standards recommend a minimum lateral vibration of 1.3 Hz such as AASHTO LRFD [1] and ISO 10137 [15]. Eurocode EN 1990 (2002) specifies more stringent limit of 2.5 Hz to avoid second harmonic of lateral motion, however certain acceleration limits are given for normal and crowded conditions of about 0.2 & 0.4 m/sec2 respectively.
In designing these bridges, prime consideration should be given to the comfort level and an inclusive model should be formed, which explores the issues related to the vibration. Though, the damping ratio of footbridge serves as an uncertain element in the vibration issues at design stage, as it is determined after its construction [21]. Initially in international standards, the limit of serviceability was related to the constraints on the live load deflection in contrast to the span ratio; however, there exist some regulations by the international codes and design guides concerning the assessment of the vibration produced as a result of the human-induced force [29]. These design guidelines of the pedestrian bridges are inclusive of two approaches. The first approach focuses on the avoidance of making the natural footbridge frequencies equal to the frequencies resulted from the pedestrian walking activity [29]. Whereas, the second approach is based upon the calculation of the dynamic response related to the footbridge acceleration and for evaluating whether these meet the acceptable limit criteria or not. The following section demonstrates different international standards and guidelines to illustrate the implementation of the designing concepts.
International standards and guidelines
A number of guidelines have been presented to overcome the issues related to the serviceability of the structures. For instance;
BS 5400-2:2006
The fundamental natural frequency f0 of a pedestrian bridge [5]; should exceed 5 Hz for the vertical directed unloaded bridge. However, if the footbridge fundamental frequency f0 is equal to, or less than 5 Hz, the maximum vertical acceleration is limited to 0.5
Where f0 is the fundamental natural frequency (Hz). y s is the static deflection in use because of a vertical concentrated load of 0.7 KN applied at mid-point of the span (m). k is the configuration factor, taken as 1.0 for the simple span. Ψ is the dynamic response factor dependent on the length of the span and damping ratio.
The comfort criterion is defined in terms of the maximum acceptable acceleration in Annex A of that standard [7]. The recommended maximum value is considered as 0.7 m/s2 for vertical vibrations. It is not confirmed in this standard if this value is related to any type of pedestrian traffic or it is related only to a single person walking on the bridge. It is also recommended that comfort criteria must be verified when the deck fundamental frequency is below 5 Hz for vertical vibrations. However, no guidelines are included for such methodology of verifications. However, the comfort criteria are suggested to be satisfied with a significant margin [16], otherwise, design provision might be necessary for the potential dampers installation in the structure upon its completion. In such cases, requirements for the contracting tests are said to be considered and identified by the designer.
UK national annex for BS EN 1991-2:2003
In this national annex, the maximum vertical acceleration is essentially required to not exceed the design acceleration limit [6], given by:
Where: k1 is site usage factor which is ranges from 1.6 to 0.6 and is dependent on the bridge location if it is in rural areas or in primary route for hospitals or high sensitivity routes. k2 is route redundancy factor, this factor is ranged from 1.3 to 0.7, it depends on if there any possibility of other routes that pedestrians could use it for crossing the same location (k2= 1.3) or if it is the only way for crossing (k2= 0.7). k3 is the height of the structure factor which is ranged from 1.1 to 0.7. If the structure height is less than 4 m, it reaches 1.1. If the height is greater than 8 m, its value is 0.7. k4 is an exposure factor, considered to be 1.0 which otherwise determined specifically to the project. It may have a value ranging between 0.8 and 1.2 which reflects other conditions that can impact the users’ vibration perception. These may include reflection upon the design of the parapet, walking surface quality (such as solidity or opacity) as well as provision of related features which improve the comfort. These values of k1, k2, k3, and k4 are considered as response modifiers.
This standard gives some guidelines for vibrations level in the vertical direction related to the walkways over roads or waterways, it is recommended to not exceed a multiplying factor of 60 to the R.M.S. base curve [15]. The multiplying factor has to be more stringent and reduced to 30 in case of considering human comfort for a standing still person that is not in motion at mid-span and other people are walking across the walkway. This case is purely found in Hajj season at Saudi Arabia where many people are standing still and other ones are in walking activity.
AASHTO LRFD guide specifications for the design of pedestrian bridges (Dec. 2009)
The fundamental frequency in a pedestrian bridge vertical mode in the absence of the live load is considered to exceed 3 Hz in order to avoid resonance which occurs due to first harmonic [1]. However, it was mentioned in this guide that if the fundamental frequency cannot satisfy this limitation or in case concern related to the second harmonic exists, its dynamic performance shall be assessed. Nevertheless, such dynamic analysis or calculations is not clarified in that guide. In lieu of the vertical direction evaluation, the bridge is recommended to be proportioned so that either of the following criteria is met:
Where: W is the supporting structure weight, with only dead load (kips). f is the vertically directed fundamental frequency (Hz).
In this design guide, the recommended value for the acceleration limit of indoor footbridges is equal to 1.5% g or 0.15 m/sec2 [19]. These criteria should be compared with the peak acceleration “ap” which is calculated as follows:
“P0” is a constant force representing the excitation (taken as 0.41 KN for indoor/outdoor footbridges). “ f n ” is the joist panel fundamental natural frequency, girder panel or combined panel modes whichever is applicable. “β” is modal damping ratio taken as 0.01 for indoor/outdoor footbridges. “W” is the effective weight support, provided by girder panel, joist panel, or combined panel modes, as applicable. It was mentioned in that guide, that floor systems possessing fundamental frequencies below 3 Hz should not be included.
This design guide is considered as a procedure for undergoing rigorous analysis in order to calculate the structural response as a consequence of the single person walking, named as footfall analysis method [28]. The calculation is held for two different responses i.e. the resonant as well as the impulsive vibration responses, linked with low or high-frequency floors. The resonant response is calculated for structures which have a fundamental vertical natural frequency below 4.2 times of the fastest walking frequency. The impulsive response is calculated for structures which have a fundamental vertical natural frequency higher than 4.2 times of the fastest walking frequency. The overall response factor “R” is calculated, which is a multiplier of the Z-axis baseline curve for RMS acceleration (vertical direction) according to BS 6472 1992 [4]. This “Z-axis” is a fundamental term specified in BS 6472 that is related to foot-to head direction which means the vertical direction in case of walking people (as shown in Fig. 1).
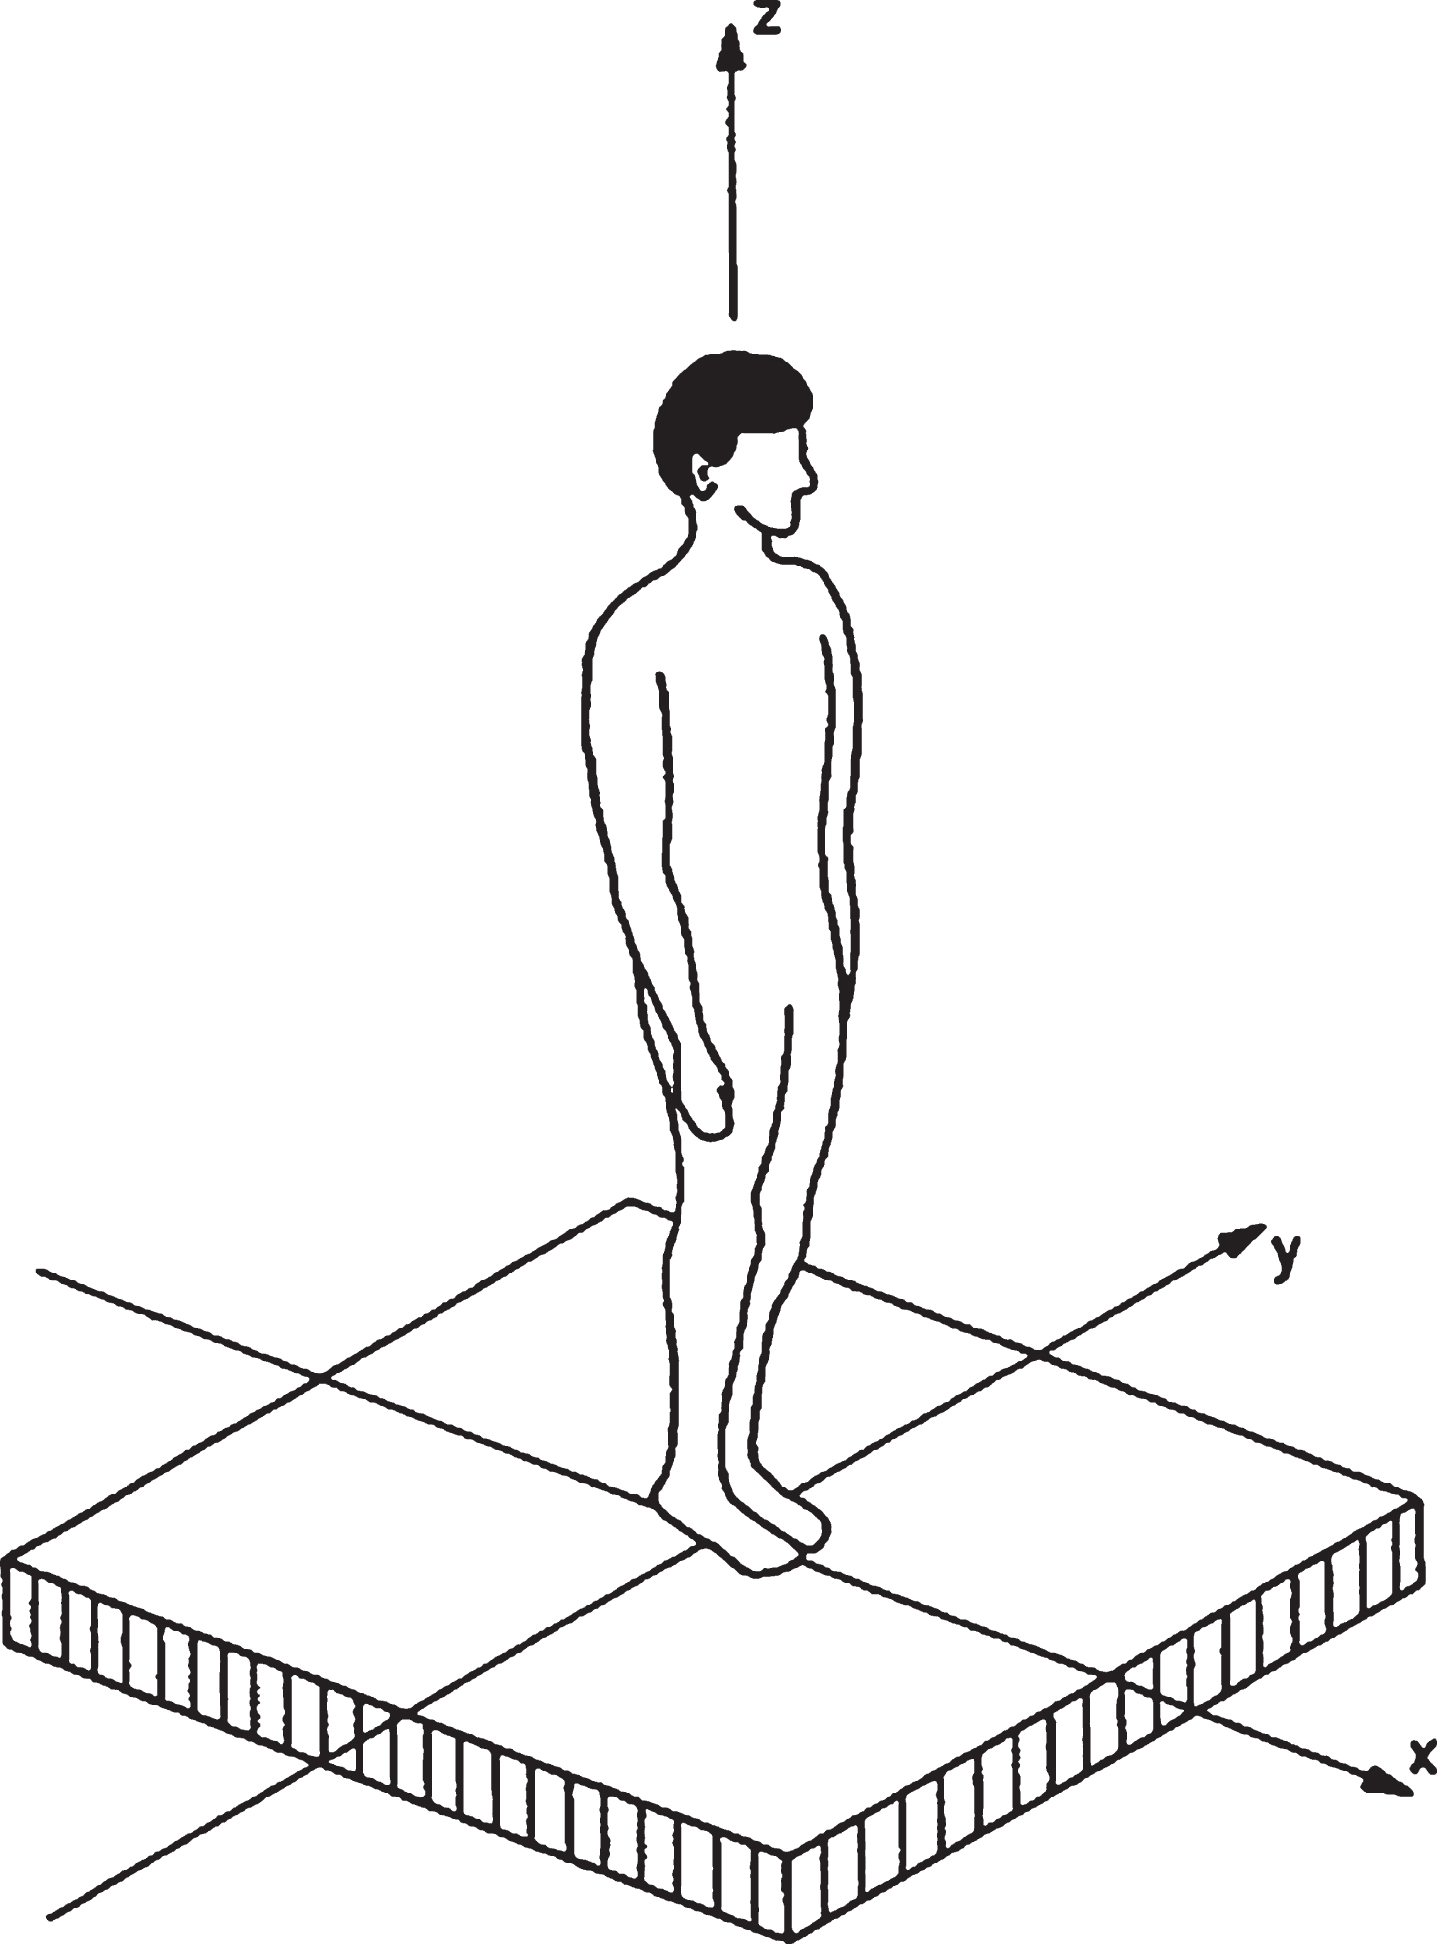
Foot-to head vibration direction in BS 6472.
A response factor of 1 indicates the vibration value which a typical human notice.
The guide provides performance criteria that are applicable to all spans and natural frequencies bridges. For external bridges “R” should be less than 64. For typical indoor bridges “R” should not exceed a value of 32. For heavily trafficked indoor bridge the value of “R” should be less than 24. Most of the structures that include the vibration problem are the ones which suffer from the resonant response. Therefore, these types of structures are susceptible to the footfall forces of the first four harmonics.
These harmonics are recognized as the sinusoidal forces which are applied to the structural frequencies of 1, 2, 3 and 4 times of the walking frequency (1 Hz to 2.8 Hz). All modal frequencies of up to 15 Hz contribute in the response calculations. The total response factor, R is calculated by considering the ‘square root sum of the squares’ a combination response factor for every four harmonics.
This technical guide provides some procedures, which link the dynamic response with the natural frequency and pedestrian traffic density to check the comfort level [13]. The comfort criteria are classified into 4 levels with degree of comfort varies from maximum comfort level to discomfort level. To compute the dynamic response, the following steps shall be followed; Estimation of natural frequencies and their critical range: If the pedestrians’ modal mass is more than 5% of the modal deck mass, it is recommended to account for the mass of pedestrians when the calculation of the natural frequencies is performed. Next step is to check whether these frequencies are placed at the critical range or not. The critical range is specified as 1.25 Hz to 2.3 Hz for first harmonic and 2.5 Hz to 4.6 Hz for the second harmonic. Dynamic calculations to pedestrian excitation should be performed if the natural frequencies are located within these ranges.
Determination of design situations is based on the events or real conditions that might occur during certain time intervals, like the inauguration of bridge and commuter traffic. Based on these events the traffic situation can be specified. Five categories are presented for pedestrian traffic; their ranges vary from 0.2 pedestrian/m2, for weak traffic up to 1.5 pedestrian/m2 for exceptionally dense traffic.
Then the comfort class is specified according to the expected occurrence for the design situation, if it occurs once in the lifetime then a lower level of comfort can be chosen, if it occurs daily then higher comfort class shall be selected. The comfort classes are specified in terms of vertical accelerations. Maximum level of comfort is 0.5 m/sec2, medium level is from 0.5–1.0 m/sec2, minimum level of comfort is in range 1.0 to 2.5 m/sec2 and the unacceptable discomfort is for accelerations more than 2.5 m/sec2.
The maximum accelerations can be determined by application of load models based on pedestrian traffic, or by using the method of response spectra concerning the pedestrian streams. The latter is a straightforward method, where the maximum characteristic acceleration is stated as the product of peak factor ka,d, and an acceleration standard deviation σ
a
:
Where “ σ a ”, is the response standard deviation. Its value is based on the modal mass, the damping ratio and other constants, which are specified in terms of natural frequency. “ ka,d”, is the peak factor that transforms the response standard deviation to the characteristic value amax,d. In the state of serviceability, the characteristic value is the 95th percentile, ka,d 95%. Both factors are resulting from simulations of the Monte Carlo based on numerical time step analysis of several pedestrians’ streams on different bridges geometries.
The following equation represents the empirical equation for determining the acceleration response variance;
Where:
kF is a constant.
n = is number of bridge pedestrians based on pedestrian traffic density “d”.
a1, a2, a3, b1, b2, b3 are constants.
ξ is the ratio of structural damping.
C is the constant defining the load spectrum at maximum.
fi is the natural frequency that corresponds to the with the pedestrian stream step frequency.
The study has employed a discussion method where it evaluates the impact of vertical vibration on the footbridges which occurs as a result of human-induced forces. The study focuses on evaluating the footbridge behaviour consisting of two composite steel beams. The bridge deck is formed by reinforced concrete (R.C) supported on two main beams. The total depth of the reinforced concrete slab with corrugation is 160 mm with the metal decking (Fig. 2).

160 mm thick R.C. composite slab on metal deck.
The width of the bridge is 3.0 m. Moreover, the footbridge is assessed for spans ranging from 10 m to 50 m. For low-finished bridges, the total finishes and installations for loads are taken to be 100 Kg/m2, 300 Kg/m2 for average-finish type and 800 Kg/m2 for heavy-finish. As per AASHTO LRFD guide specifications for the design of pedestrian bridges, the live load is taken to be 90 psf. Moreover, high strength steel design with a yield strength of 345 MPa is considered in the design of composite main girder. Furthermore, the concrete strength is taken to be 30 MPa. Additionally, the span-to-steel beam depth ratio is taken to be 30. Based on such deflection limit states and strength, a total of 15 footbridges was designed. The optimized cross sections are obtained by following the design requirements of AISC 360-10 for the design of composite beams. Next, these deflections were optimized and strength steel cross sections were further evaluated through footfall analysis for human comfort in accordance with CCIP-016.
The following points explain the required steps to calculate the response factor (R): A walking frequency ranging from 1 to 2.8 Hz was selected to create variant step frequencies. Next, the calculation of the forcing function was held for a chosen step frequency. The application of the forcing function occurred at the structure chosen nodes and the responses calculation at these nodes and other nodes is calculated. This is carried out for all the components of the four harmonic along with their forcing function and their corresponding harmonic frequencies. Next, with the help of the combination of four harmonic responses, a total response was resulted for the selected step frequency. Lastly, the process is repeated until all the frequencies are covered. The maximum response factor R is determined to set the structure acceptance.
The footfall analysis is carried out by Robot Structural Analysis software. The 100 mm shell element, is used for the simulation of the solid part concrete slab above the steel profile deck, simulated with an offset to account for composite action, (Fig. 3). The dynamic modulus of elasticity is determined to be 38 KN/mm2, moreover, the 4-noded quadrilateral finite element is used for the simulation of the R.C slab, where the mesh size is taken to be 0.5 by 0.5 m.
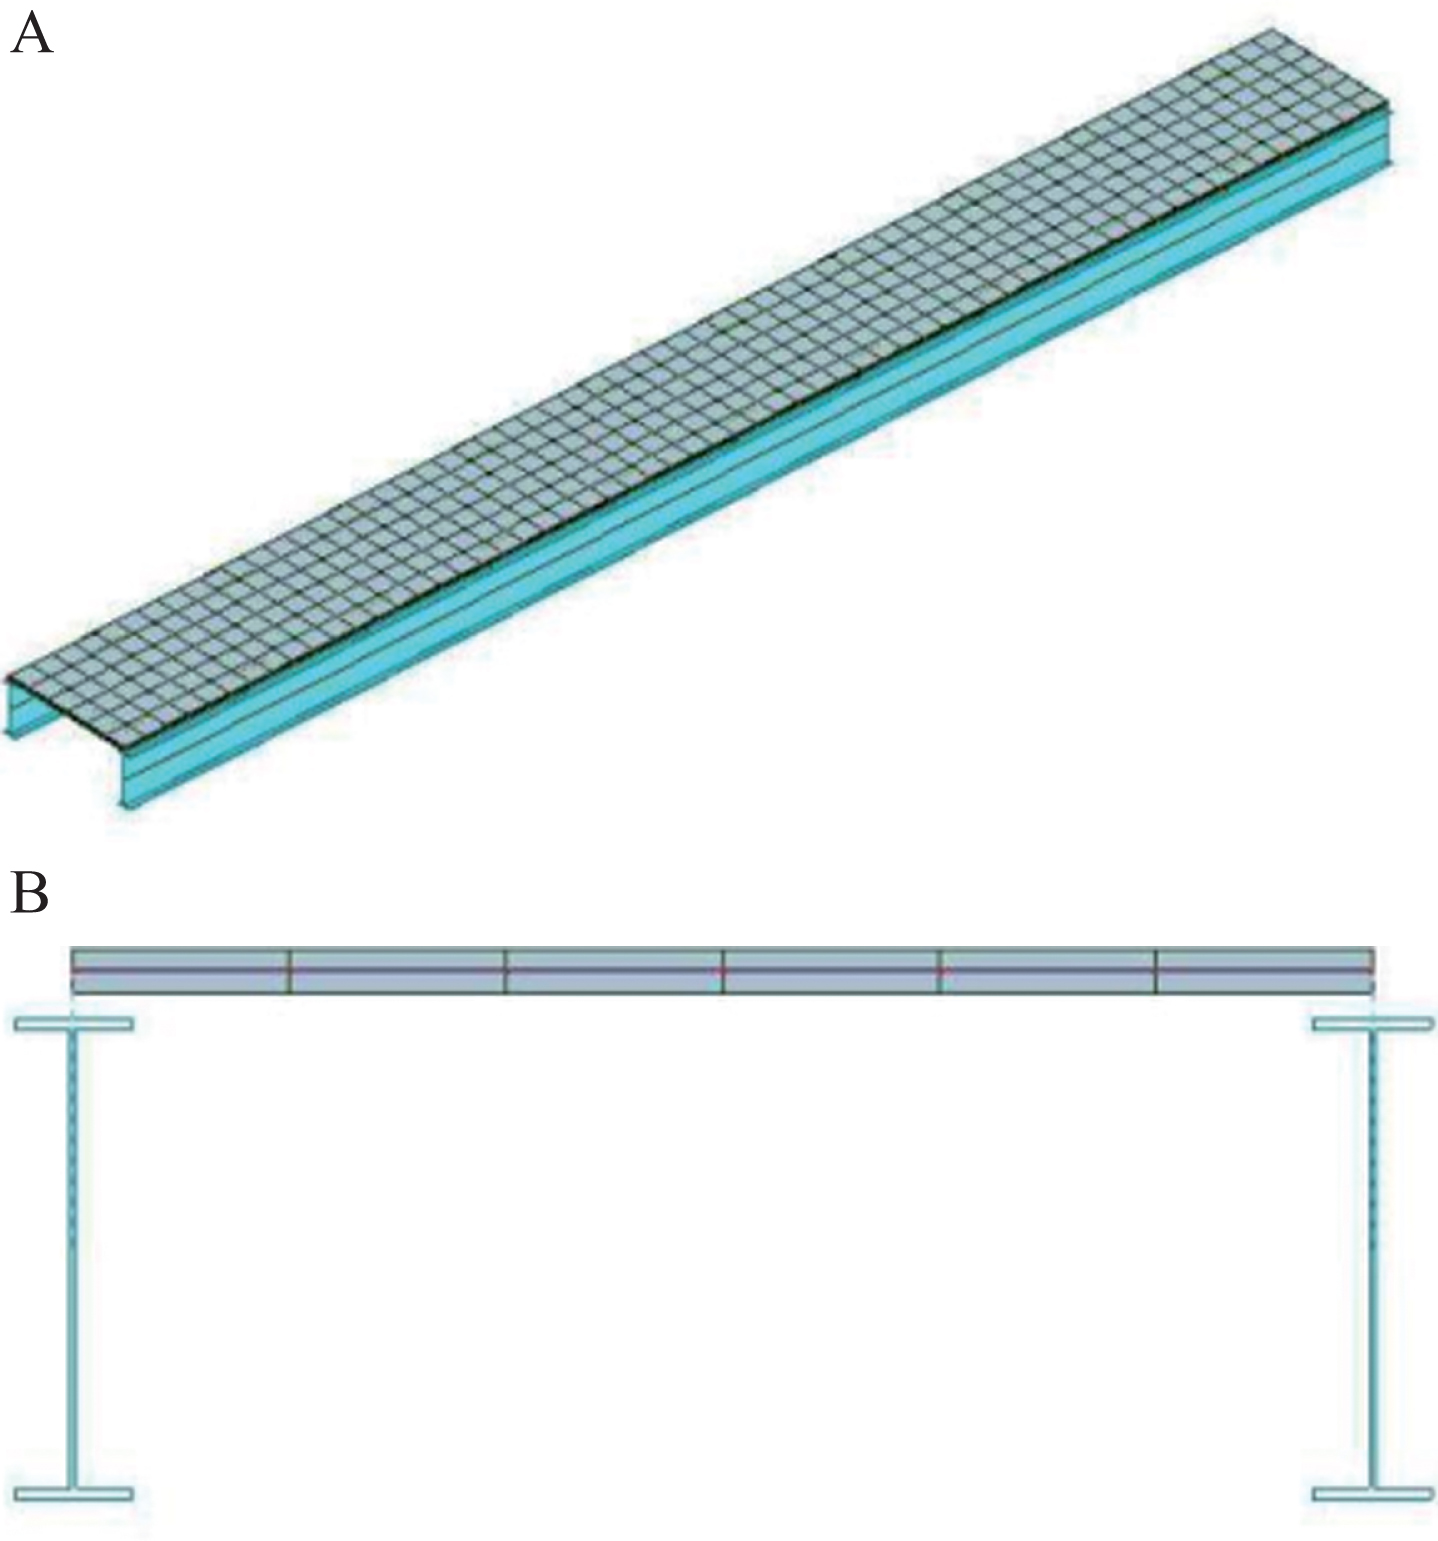
(a) Analysis Model 3D FE. (b) Cross section of the bridge with an offset in the slab.
For the study, the optimization of deflection, strength, and the response rate factor of fifteen bridges is illustrated similar to the earlier study for the comparison of various methods indicated in the literature [12]. The selected factors for comparison are those who meet the satisfaction level of comfort. For example, the overall response factor (R) shall be less than 64 for external bridges. The present study used the cross-sectional profiles of key beams which attained such limits through the utilization of variant finish weights i.e. 100 kg/m2, 300 kg/m2 and 800 kg/m2.
The result of Table 1 has shown cross sections of the optimized steel in the fifteen footbridges, in terms of its strength and checks for deflection unity along with the overall response factors. For heavy-finish bridges, the optimized steel cross sections were controlled by the strength limit state as the strength unity check is always greater than the deflection unity check. The overall response factor (R) for all the optimized fifteen bridges resulted from all types of finishes are higher than human comfort level for heavily trafficked indoor bridges (R < 24). If the studied footbridges are considered as external bridges (R < 64), only the case of heavy-finish can be considered satisfying or close to satisfy (for R slightly higher than 64) the human comfort level.
Data results obtained for optimized cross-sections with different finish weights
Data results obtained for optimized cross-sections with different finish weights
The response provided a contour distribution sample, which is achieved from the FE model, is exhibited in Fig. 4 where the finished weight of 100 kg/m2 and 30 m span is shown. It is evident from the figure that the maximum response of the vibration is observed at the footbridge mid-span level. Table 1 has listed down all the footbridges prime vertical natural frequency. El-Robaa, Gaawan, and Malek, [11] have asserted that longer spans and lightweight bridges lead to reduce the systems natural frequencies, which has a major impact on the performance dynamics of bridges associated with activities of the human.
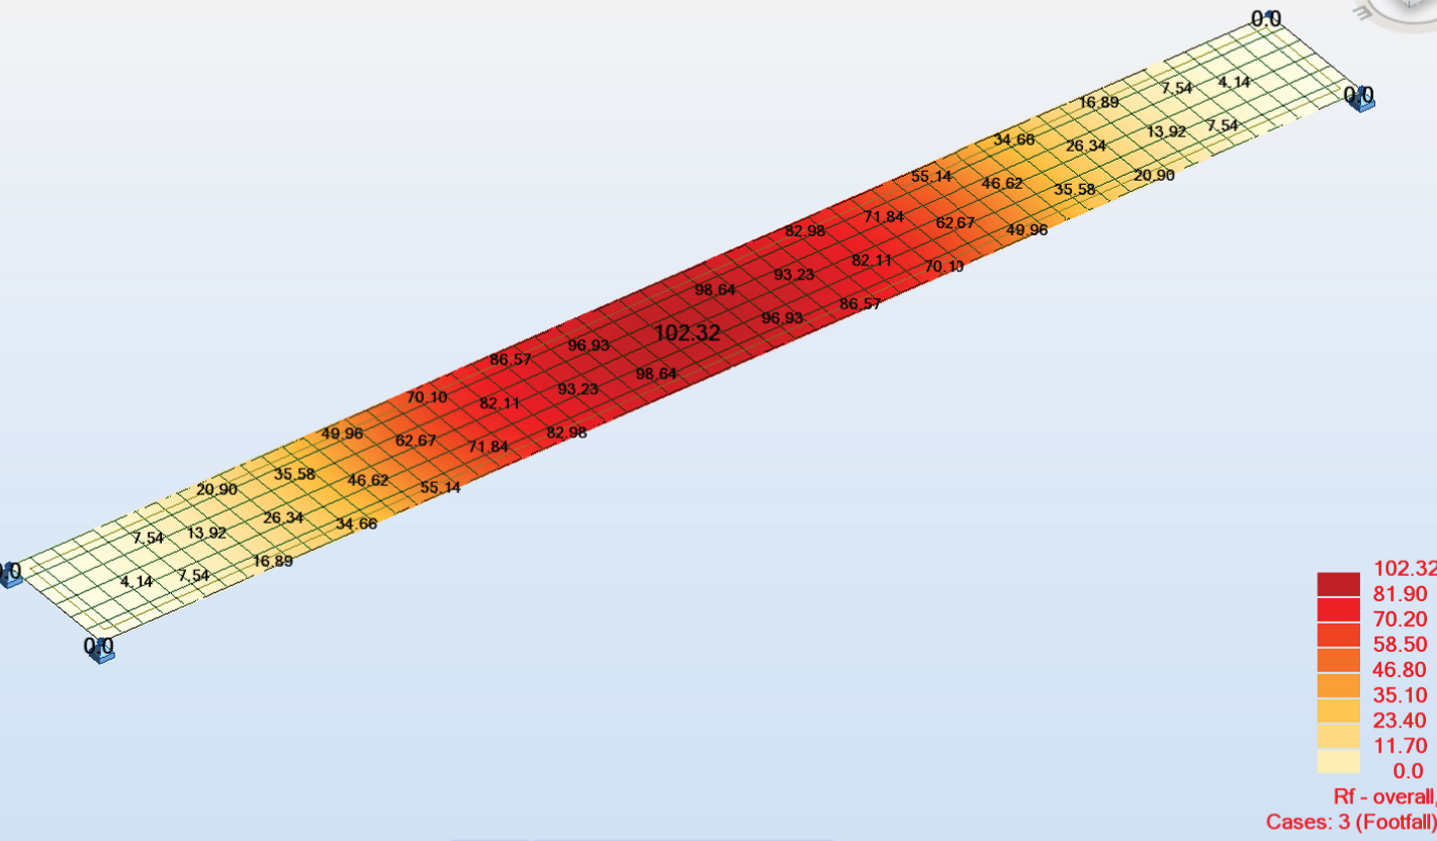
Overall response factor resulted for 30 m span footbridge with a finished weight of 100 kg/m2.
Considering the guideline followed on a global level such as AASHTO, it is observed that for the attainment of human satisfaction, the fundamental frequency should not be below 3 Hz. One of the obvious remarks from the natural frequency results that although the frequency is larger than 3 Hz for some cases (the 10 m spans), the human comfort is still not achieved. The footfall procedure that follows CCIP-016 is considering the initial four human forcing function harmonics. With respect to the higher harmonic cases, the walker frequency is equivalent to the footbridge natural frequency, which could obtain an increased response factor.
As per the earlier discussion, there are many optimized steel beams that have not been able to meet the acceptance level set for the human comfort in both cases i.e. external and internal footbridges. Consequently, the increase in cross-sectional sizes took place to meet the determined level of the human comfort in bridges both external and internal. The cross-sectional size enhancement influences the bridge total self-weight. For the achievement of the determined level i.e. to achieve the satisfaction level of the response factor that is below 24 and to achieve the response factor below 64, the football analysis has been performed again.
The ratio of new cross section weight to the optimized cross section weight is used to quantify the required increase in the cross section to satisfy the human comfort level and is referenced as “weight increase ratio”.
The increase in the weight ratio of the various type of finishes aimed at achieving the comfort level of R < 24 is exhibited in Fig. 5. It can be noted that the footbridges which comprise of the heavy finishes i.e. 800 kg/m2, will require a lesser beam weight increase to attain the comfort level if compared with the light and average finishes. Furthermore, the lightweight finish (100 kg/m2) and the shorter span are observed with the maximum increase. As the set criteria of R < 24 for comfort is stringent, the increase in the weight ratio reach about 8 to 10 times for shorter span and about two times of the original weight for the large spans up to 50 m.
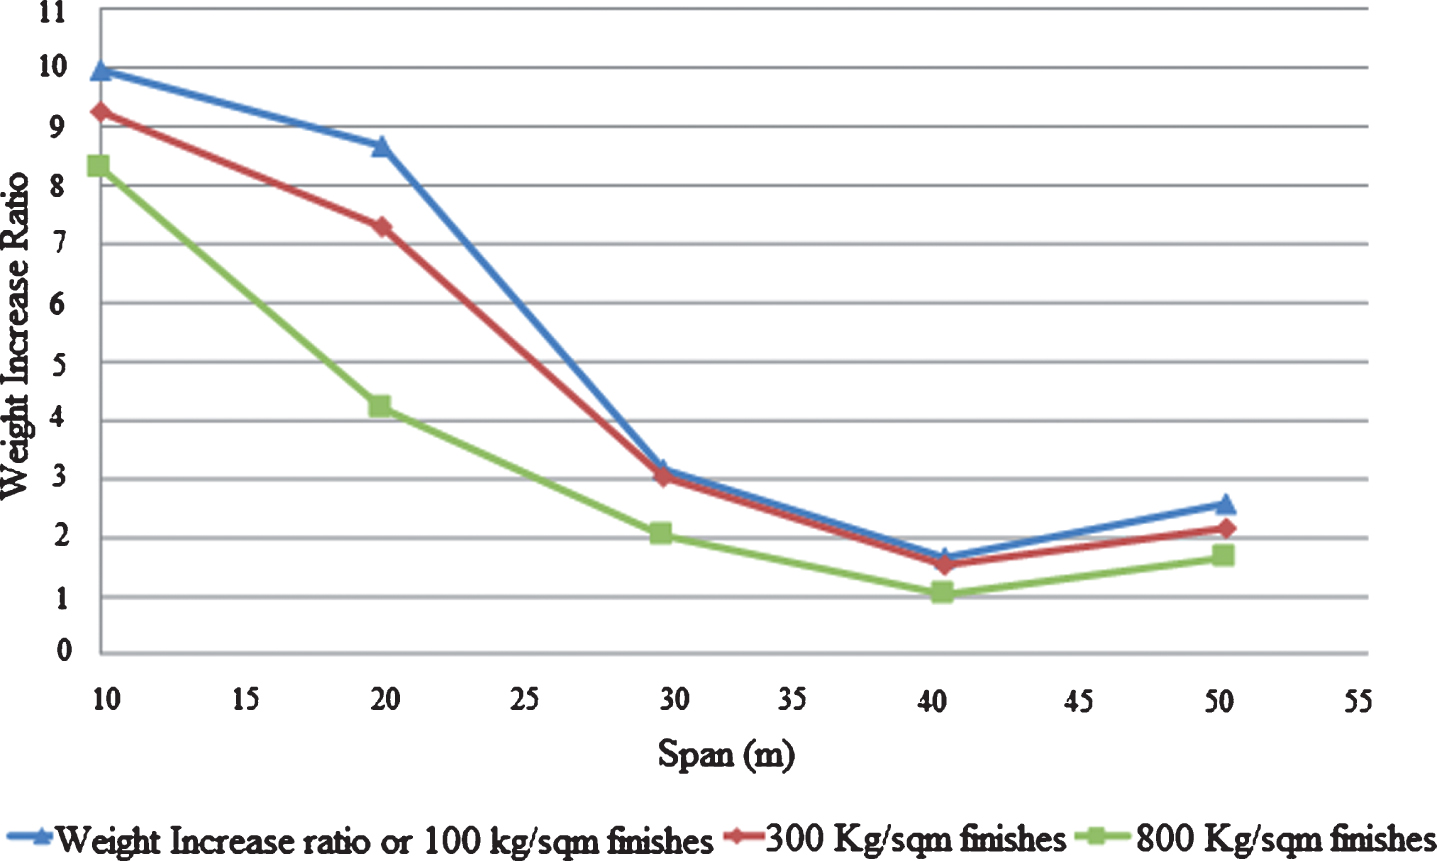
The weight increase ratio to satisfy an overall response factor of R < 24 for heavily trafficked indoor bridges.
The required weight increase ratio for external bridges is much smaller than those required for indoor bridges (Fig. 6). The weight increase ratio is very low for overall spans which have a range from 10 m to 50 m, considering the footbridges with the heavy finish (800 kg/m2). The short span maximum weight ratio is observed considering the light or average finish and it increases to a value of 1.75 to 1.8 ratios for 10 m span. Though, for spans which are longer i.e. 20 to 50 m, such as increase is considered to be minimum where the value lies below than 1.17.
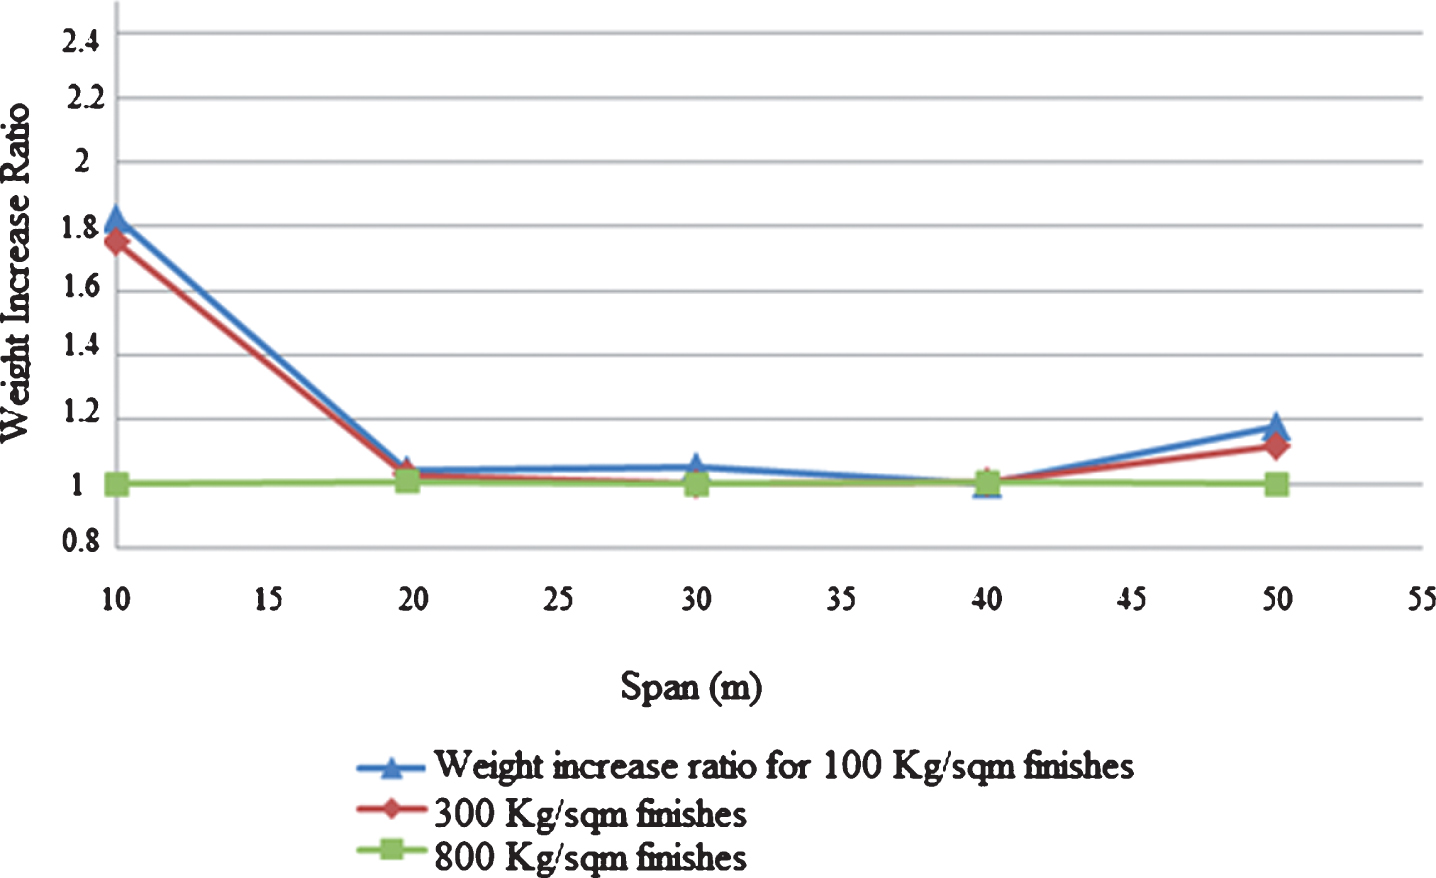
The weight increase ratio to satisfy an overall response factor of R < 64 for the external bridge.
The calculation of the fundamental natural frequency is performed again, in case of the steel main beam where R < 24 and R < 64, as noted in Table 2. Some footbridges despite having the natural frequency below than 3 Hz as observed in Table 2, the set level of human comfort is achieved. Therefore, it concludes that the implementation of the fundamental natural frequency of a particular single value limit is not practical for the achievement of human comfort. Typically, in case a parameter is to be set on the natural frequency, then these limits or parameters must be linked primarily with the footbridge span. The parameter on the natural frequency should be higher considering the shorter spans and should decrease with the footbridge span increase. There exists a need to further evaluate the various span ranges, widths and loading of the footbridge in order to determine limit that can be generalized for the footbridges as the fundamental natural frequency.
Frequency results to reach the required limits for the indoor and external bridge
The study has compared various methods of assessment. Many of these methods were related to the assessment of the vibration which results from the vertical forces, induced by single pedestrians such as CCIP-016, BS 5400-2 and AISC design guide no. 11. Whereas, the pedestrian traffic inclusive of various densities was included in the other group of standards and guidelines, which can be utilized for exploring the human comfort i.e. JRC - EUR 23984 EN.
The accelerations are computed and proportioned to their limits stated in each standard and guideline to obtain vibration unity check as shown in Fig. 7 (a), (b) and (c). The unity checks by CCIP-016 represents the upper limits between the three methods illustrated (AISC, CCIP-016 and BS 5400-2).
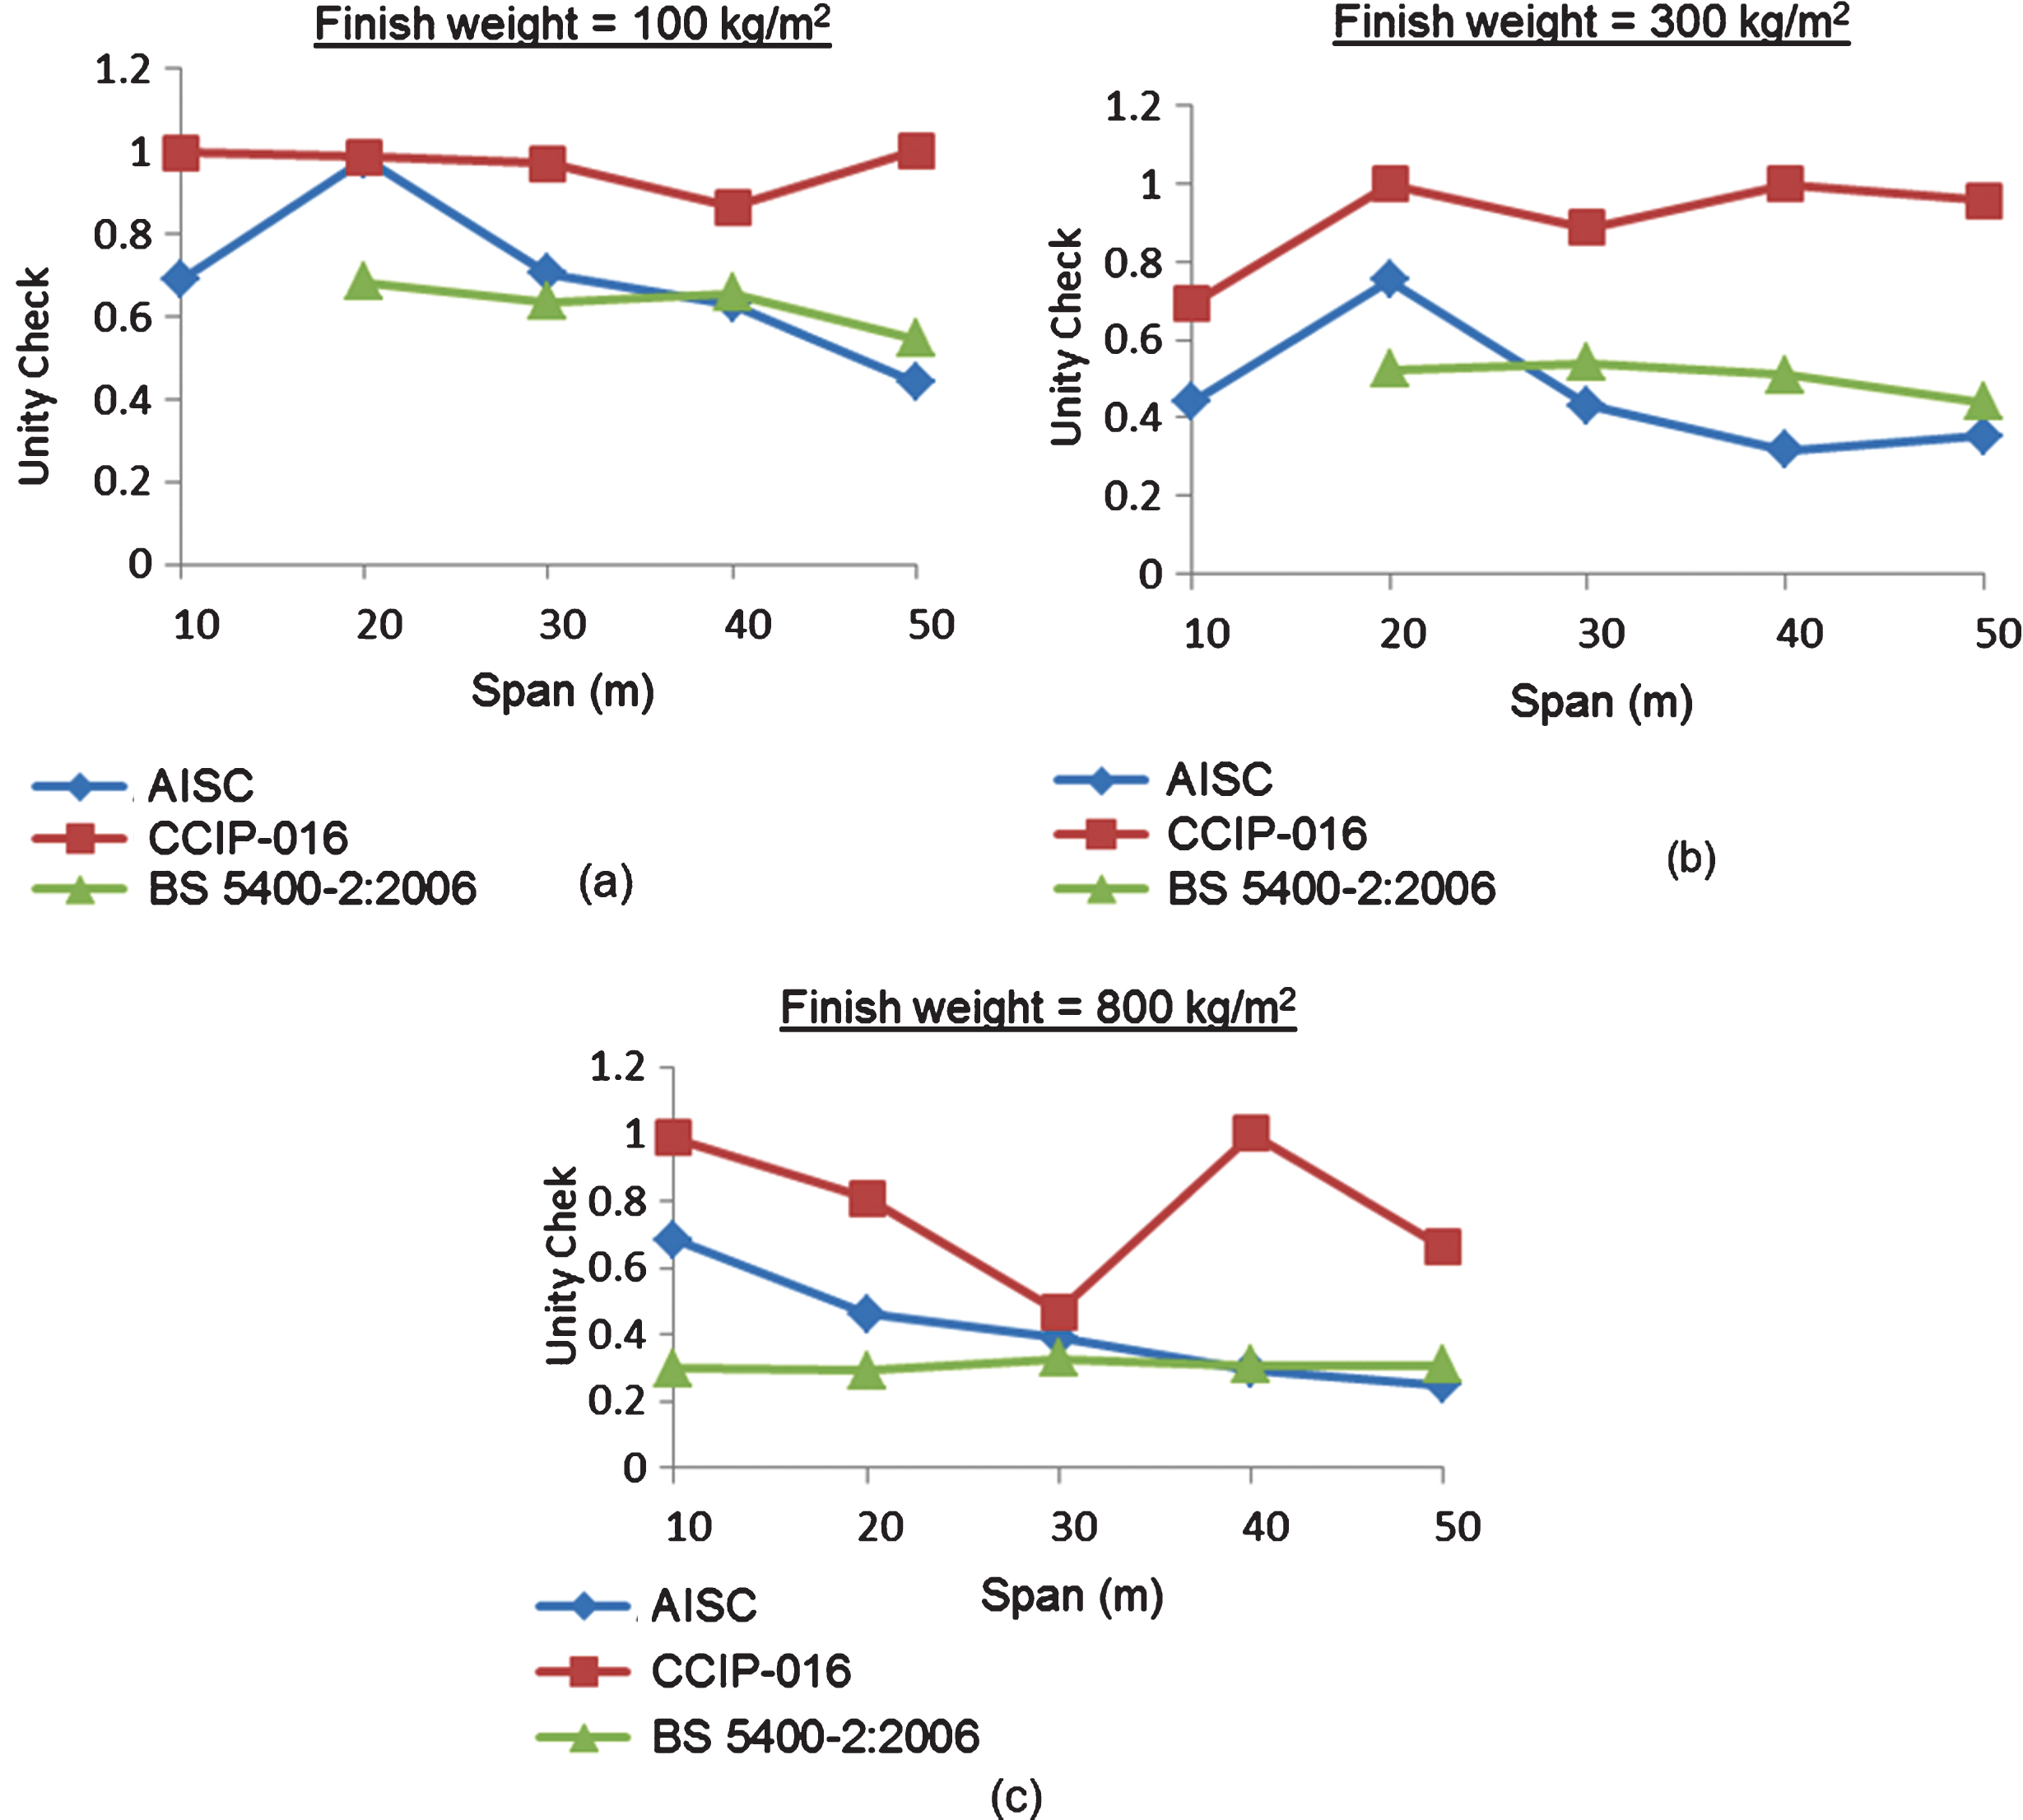
(a), (b) and (c) Unity check for acceleration limits specified in AISC, CCIP-016 and BS 5400-23 for finish weights 100, 300 and 800 Kg/m2 respectively.
Conformity was observed between CCIP-016, AISC, and BS5400-2 in terms of investigating the vibration problem due to single walking person. The vertical acceleration results based on response spectra method specified in JRC – EUR 23984 EN are shown in Fig. 8 (a), (b) and (c) for different pedestrian traffic classes. The chosen classes are 0.5 pedestrian/m2 representing dense traffic, 1 pedestrian/m2 representing very dense traffic, and 1.5 pedestrian/m2 representing the exceptionally dense traffic. It is evident from Fig. 8 that the resulting acceleration is inversely proportion to the foot bridge span. This is mainly attributed to the increase in bridge mass. The same observation is noticed for the effect of floor finish weight as the resulting acceleration decreases with the increase of the finishes weight. The vertical acceleration limit stated in Eurocode 1990 is not accompanied with clarification statement that confirms if it might be applied to crowded pedestrians’ case, or it is valid only to single walking pedestrian case.
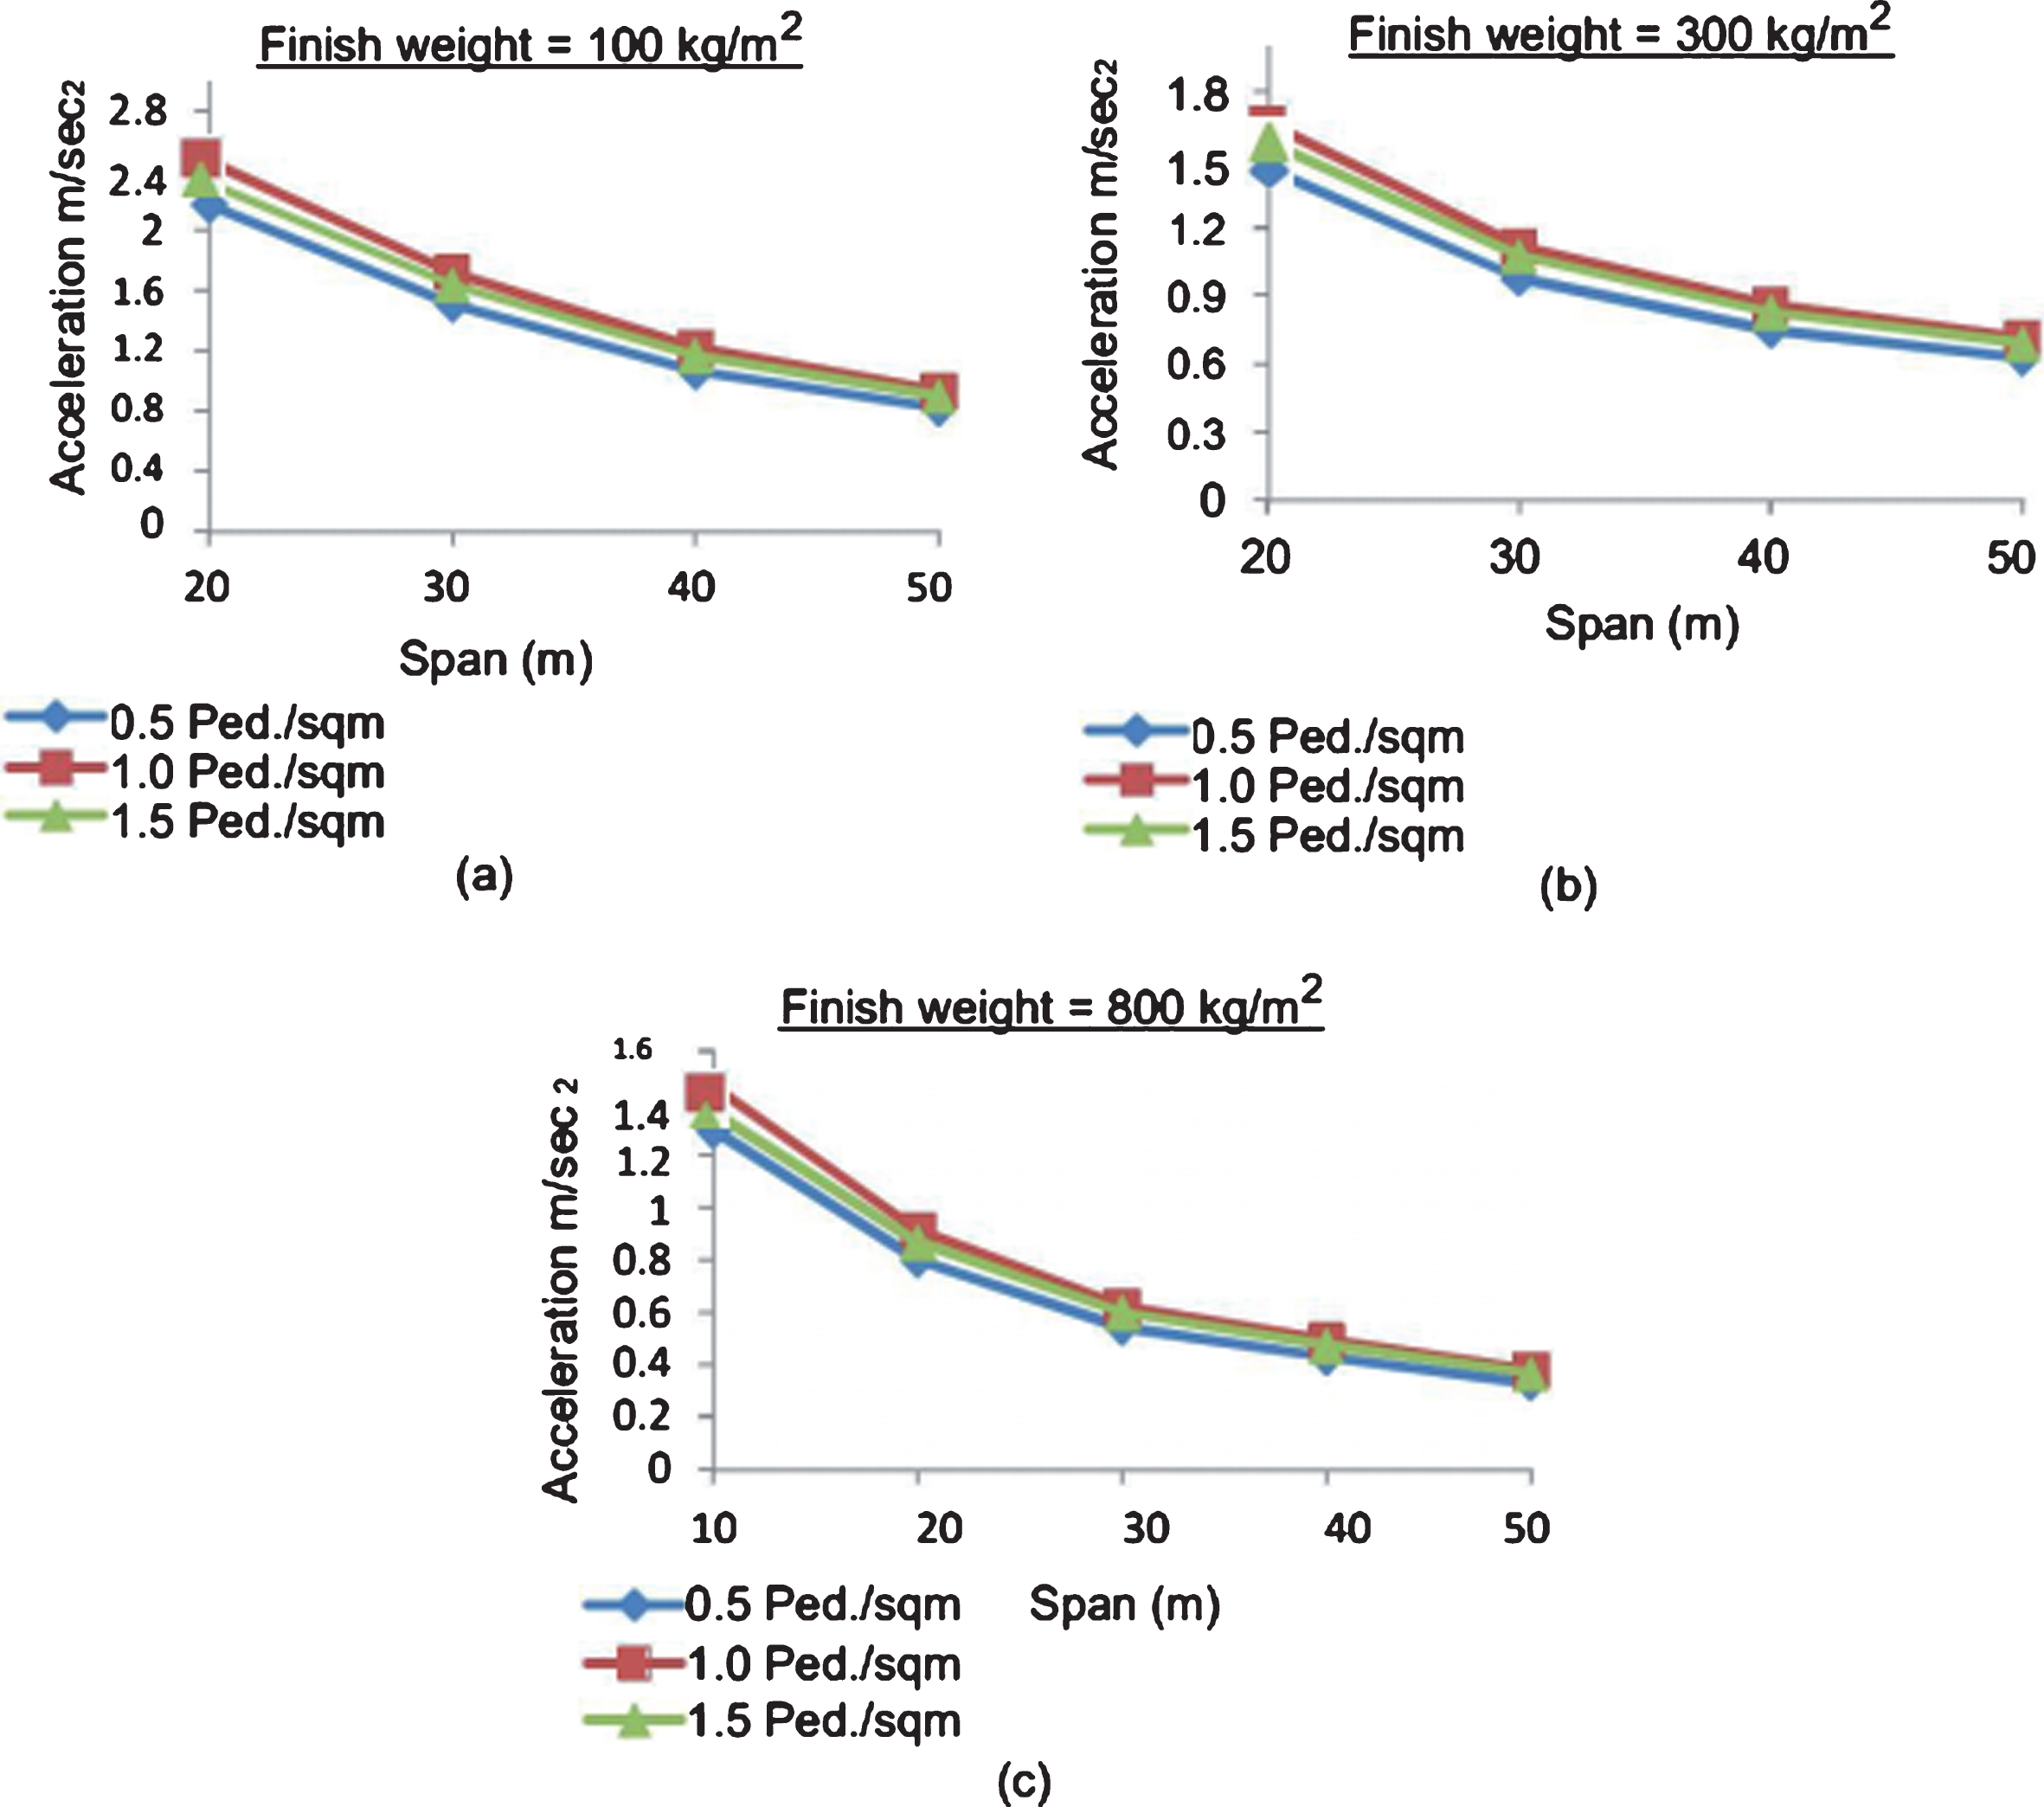
(a), (b) and (c) Acceleration results from JRC-EUR 23984 EN for different pedestrian densities and finish weights 100, 300, 800 Kg/m2 respectively.
The study evaluated the human comfort satisfaction impact on the footbridges with optimized composite steel. It has been reported in the study that the footbridge design is significantly impacted by the application of human comfort. Moreover, R < 64 could be achieved easily and despite the decrease in frequncey less than 3 Hz for some longer spans; the human comfort level was achieved. It is recommended that the methodology used in CCIP-016 to be followed as it captures more harmonic frequencies of the forcing function, which in turn gives more accurate results for the response that is more reliable than the frequency limit approach.
Conflict of interest
None to report.
Funding
This research is not funded through any source.
Footnotes
Acknowledgments
The author is very thankful to all the associated personnel in any reference that contributed in/for the purpose of this research.