
Abstract
GPS has been extensively used in measurement of displacements of long, flexible bridges, but we summarize evidence that geodetic instruments, GPS (GNSS) and RTS (robotic total stations), in combination with accelerometers, can be used to measure with safety semi-static and dynamic deflections of stiff bridges with main natural frequencies > 1–3 Hz. This is possible through a methodology derived from controlled, supervised learning experiments, field evidence and structural constraints. This methodology permits to understand the noise characteristics of dynamic displacement measurements and to develop techniques to suppress their noise, and has the following characteristics: (i) it is based on redundant/collocated sensors in order to control measurement uncertainty, avoid blunders and compensate for weaknesses inherent in each type of sensor; (ii) focusses on controlled excitations with structural/logical constraints, mostly free attenuating oscillations leading to direct estimation of first modal frequencies. This methodology was applied, refined, validated and exemplified in the study of several types of bridges in Greece, covering among others, cases of progressive decay and of soil-structure interactions.
Keywords
Introduction
In the last 20 years Global Positioning Systems (GPS) and in general GNSS (Global Navigation Satellite Systems) have been used for the monitoring of deflections of cable-stayed bridges (e.g. Roberts et al., 1999); a topic of major interest especially because of the impressive lateral deflections of the Millennium Bridge in London during its opening (Dallard et al., 2001). Apart from GPS, other geodetic sensors such as robotic theodolites (Robotic Total Stations, RTS, known also as Total Positioning Systems, TPS) have been used to measure stiffer bridges. Currently, probably more than 100 bridges in all parts of the world have been monitored using geodetic techniques, some in specific conditions (for example during the NY Marathon; Kogan et al., 2008), some in the framework of permanent monitoring systems (for example Cross et al., 2013).
However, there are two problems with bridge geodetic monitoring.
The first is a problem of metrology, corresponding to questions of the type: what is the range of displacements of a bridge that can be measured by geodetic sensors, whether an apparently “good” measurement of dynamic displacement is reliable, and under which conditions and with which techniques it is possible to measure dynamic deflections of a stiff or a flexible bridge using instantaneous GPS positioning which is contaminated by long-period noise (see Fig. 1).
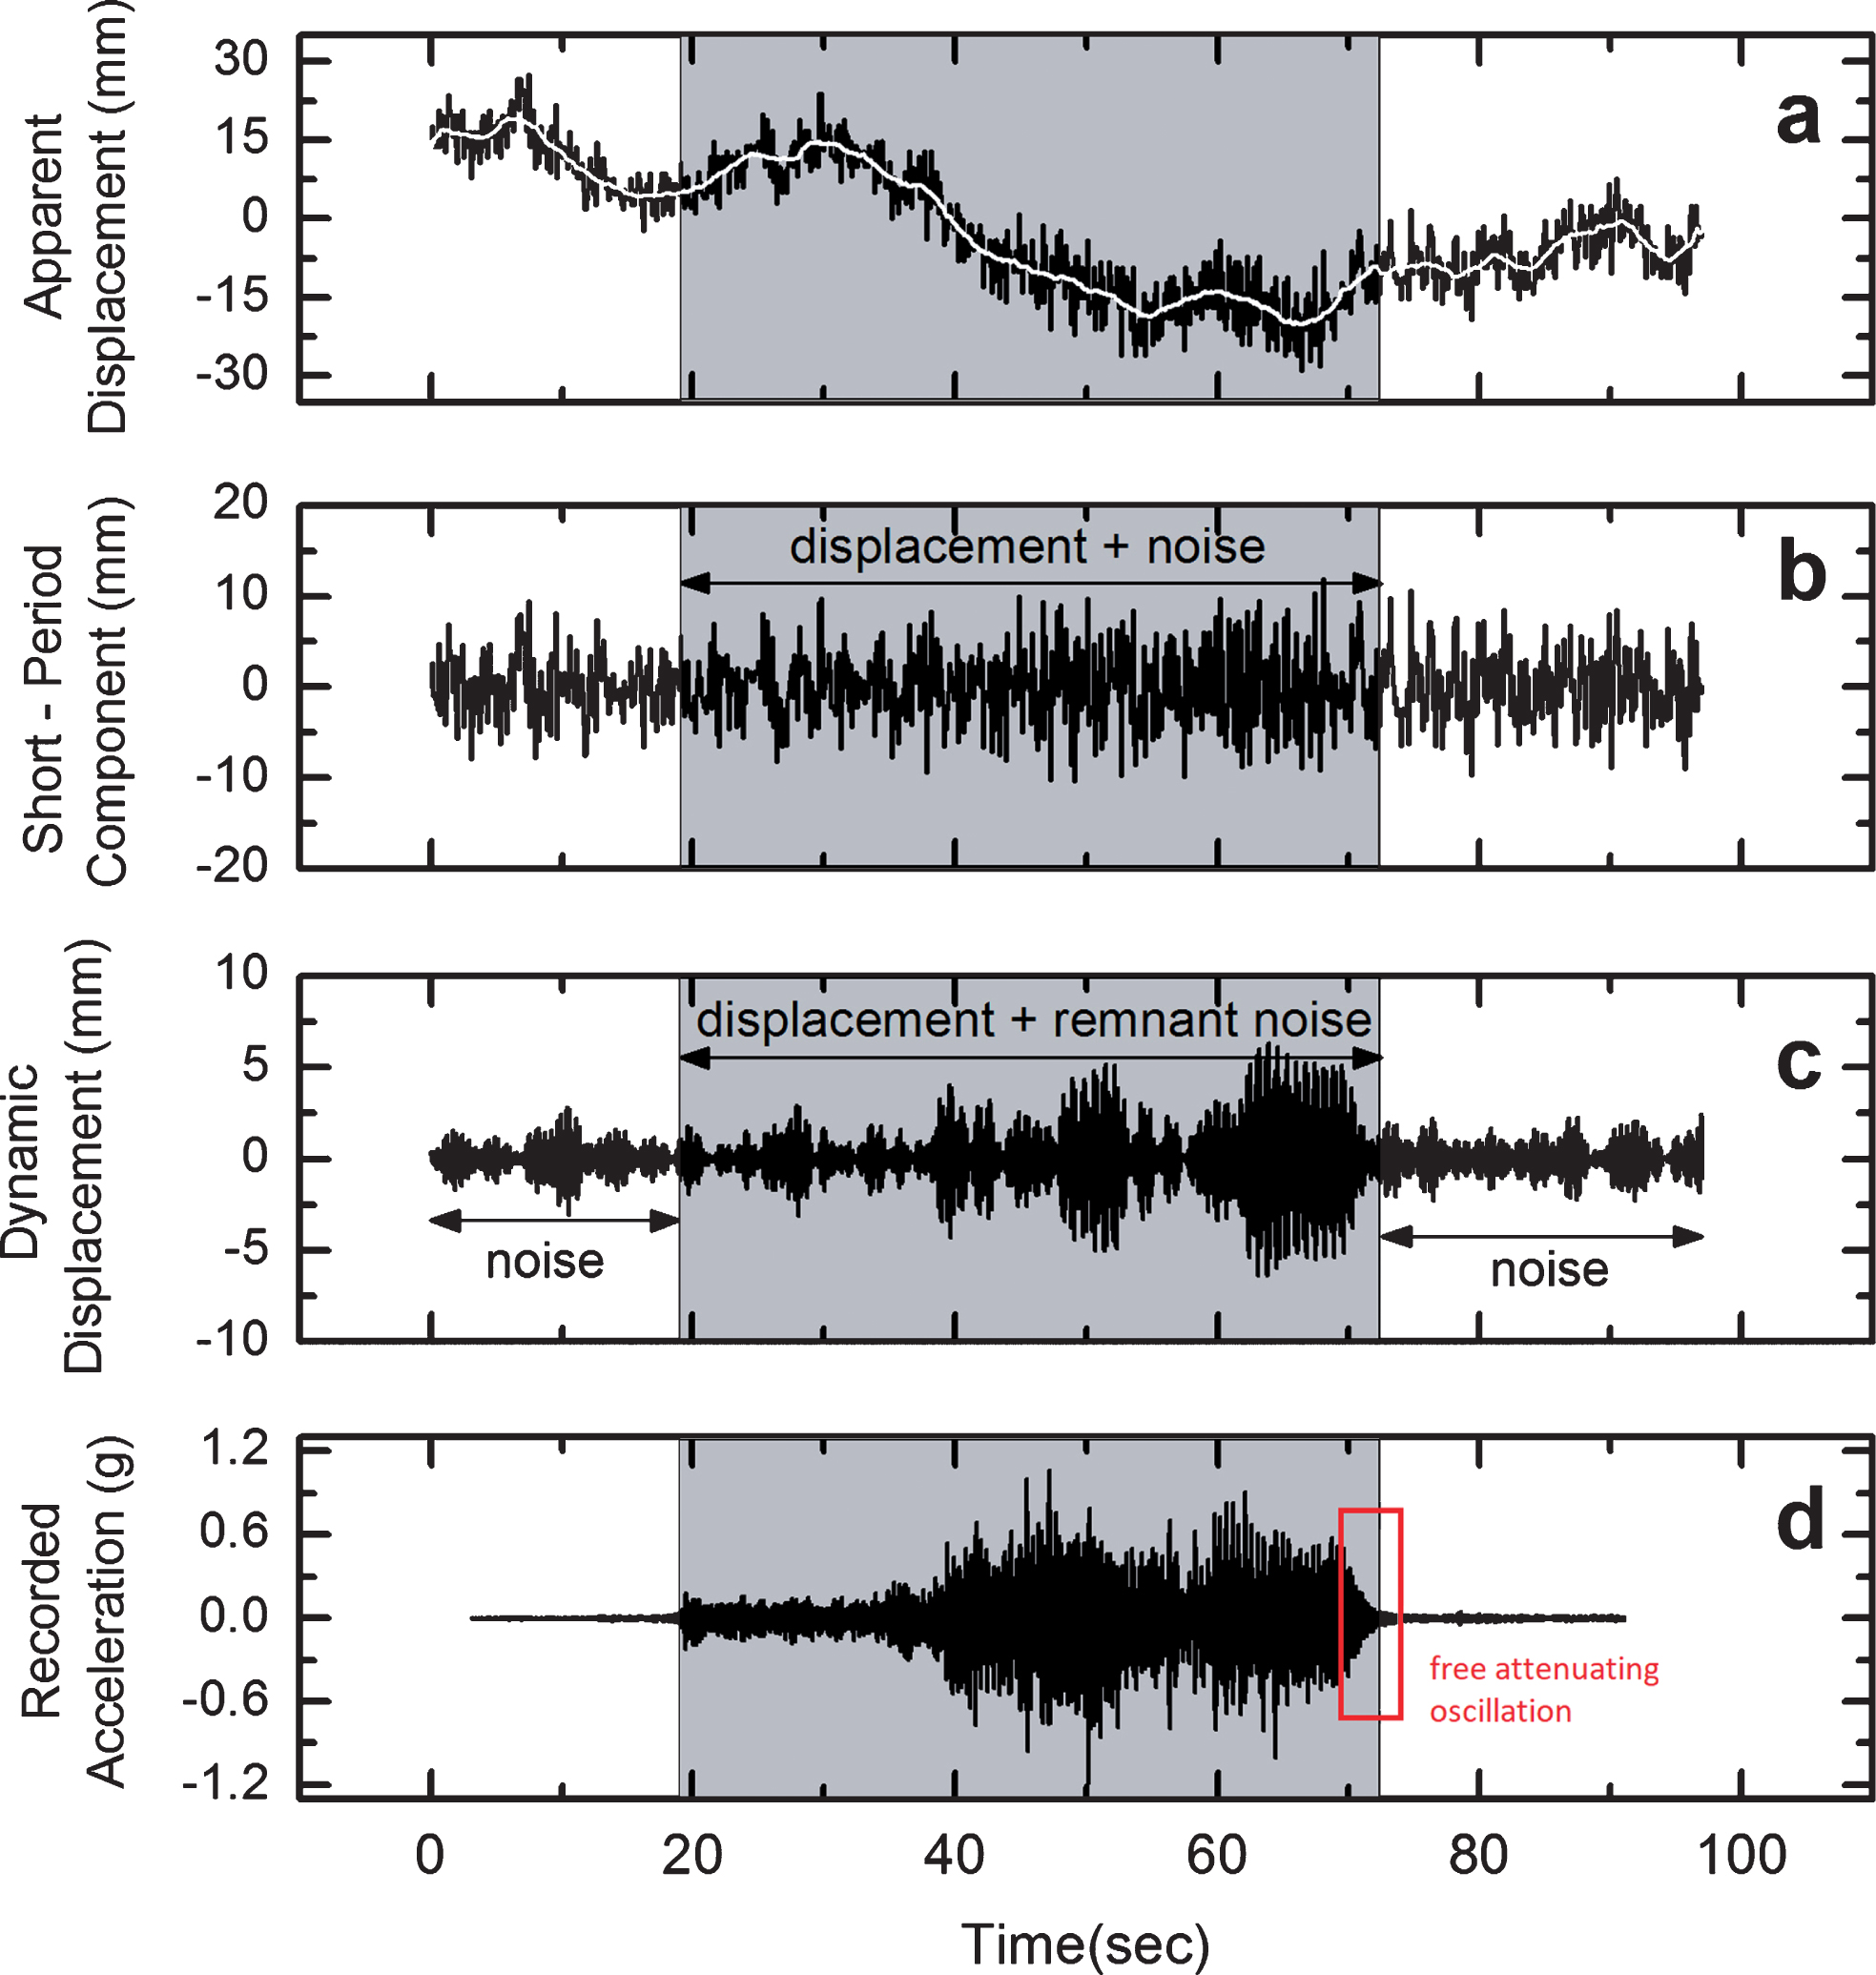
An example of analysis of GPS/GNSS recordings during a controlled excitation of the Kifissos footbridge discussed below. GPS data are contaminated by long and short-period noise, as shown in (a), in which a white curve indicates the long-period signal. If this last signal is subtracted, a short-period signal is computed (b), and then dynamic deflections (c) using filtering. If this repeated filtering is reliable, remnant noise is of the order of a few mm and the graph of dynamic displacements will be consistent with accelerograph recordings (d). In (d) a free attenuation oscillation that can provide information on a first natural frequency is marked by a red frame. Modified after Moschas & Stiros (2011).
The second is a problem of structural significance of measurement-derived displacements. A common question arising is whether and under which conditions analysis of deflection measurements can lead to estimates of natural frequencies of a structure.
In this article we review unpublished and previously presented results and ideas from monitoring deflections of several bridges of different types in Greece, both long-period and stiff structures (roughly, modal frequencies below or above 1 Hz, respectively), we summarize the basic characteristics of the methodology that has been developed, and finally discuss some conclusions of broader importance for the response of bridges to various excitations and for their structural health.
Our methodology for monitoring bridge deflections was developed in the last 15 years and has three main characteristics Measurement and data processing methodology was developed through representative, controlled experiments in which the measurement conditions and the expected output were known. Under these conditions, the response (accuracy etc.) of the instruments used (mostly GNSS and Robotic Total Stations with upgraded software and high-quality reflectors, in combination with accelerometers) can be assessed, and there can be developed reliable techniques for denoising data (supervising learning approach). Since RTS data characterized by unstable sampling rate (Stiros & Psimoulis, 2012), our methodology included a computer code for spectral analysis, specifying also statistical uncertainty limits of spectral peaks (Pytharouli & Stiros, 2008). We use collocated and redundant sensors of different types to record dynamic and semi-static defections during bridge excitations. This permits to double-check the output of each instrument and avoid specific types of noise, especially blunders (for example, dynamic multipath in GPS (Fig. 2; cf. see also sections 2.1 and 3.2 below), which may be interpreted as high amplitude deflections) and to compensate for the weaknesses inherent in each type of sensor (for example in oscillations above 1 Hz GPS overestimates peak amplitude while RTS underestimates them). We focused on measurements satisfying certain conditions, mostly on forced and free attenuating oscillations (see Fig. 1d, inset) permitting to directly derive the first modal frequency of a study bridge. We also exploited structural and logical constraints in the analysis of monitoring data; for example, comparison of measurements during intervals of no motion/excitation and of controlled excitation, in order to evaluate noise and the statistical significance of recorded deflections. Results of an experiment to simulate dynamic multipath, i.e. noise produced by reflections of a passing two-wagon train, recorded by a GPS receiver setup 2 m away from the train track on stable ground. The apparent dynamic displacements produced by dynamic multipath may be misinterpreted as dynamic deflections of a bridge. Right and left column indicate solutions with two different software packages and show the signature of the two wagons. After Moschas & Stiros 2014a). Multipath amplitude is variable and may range between a few mm to a few meters (Moschas et al., 2013).
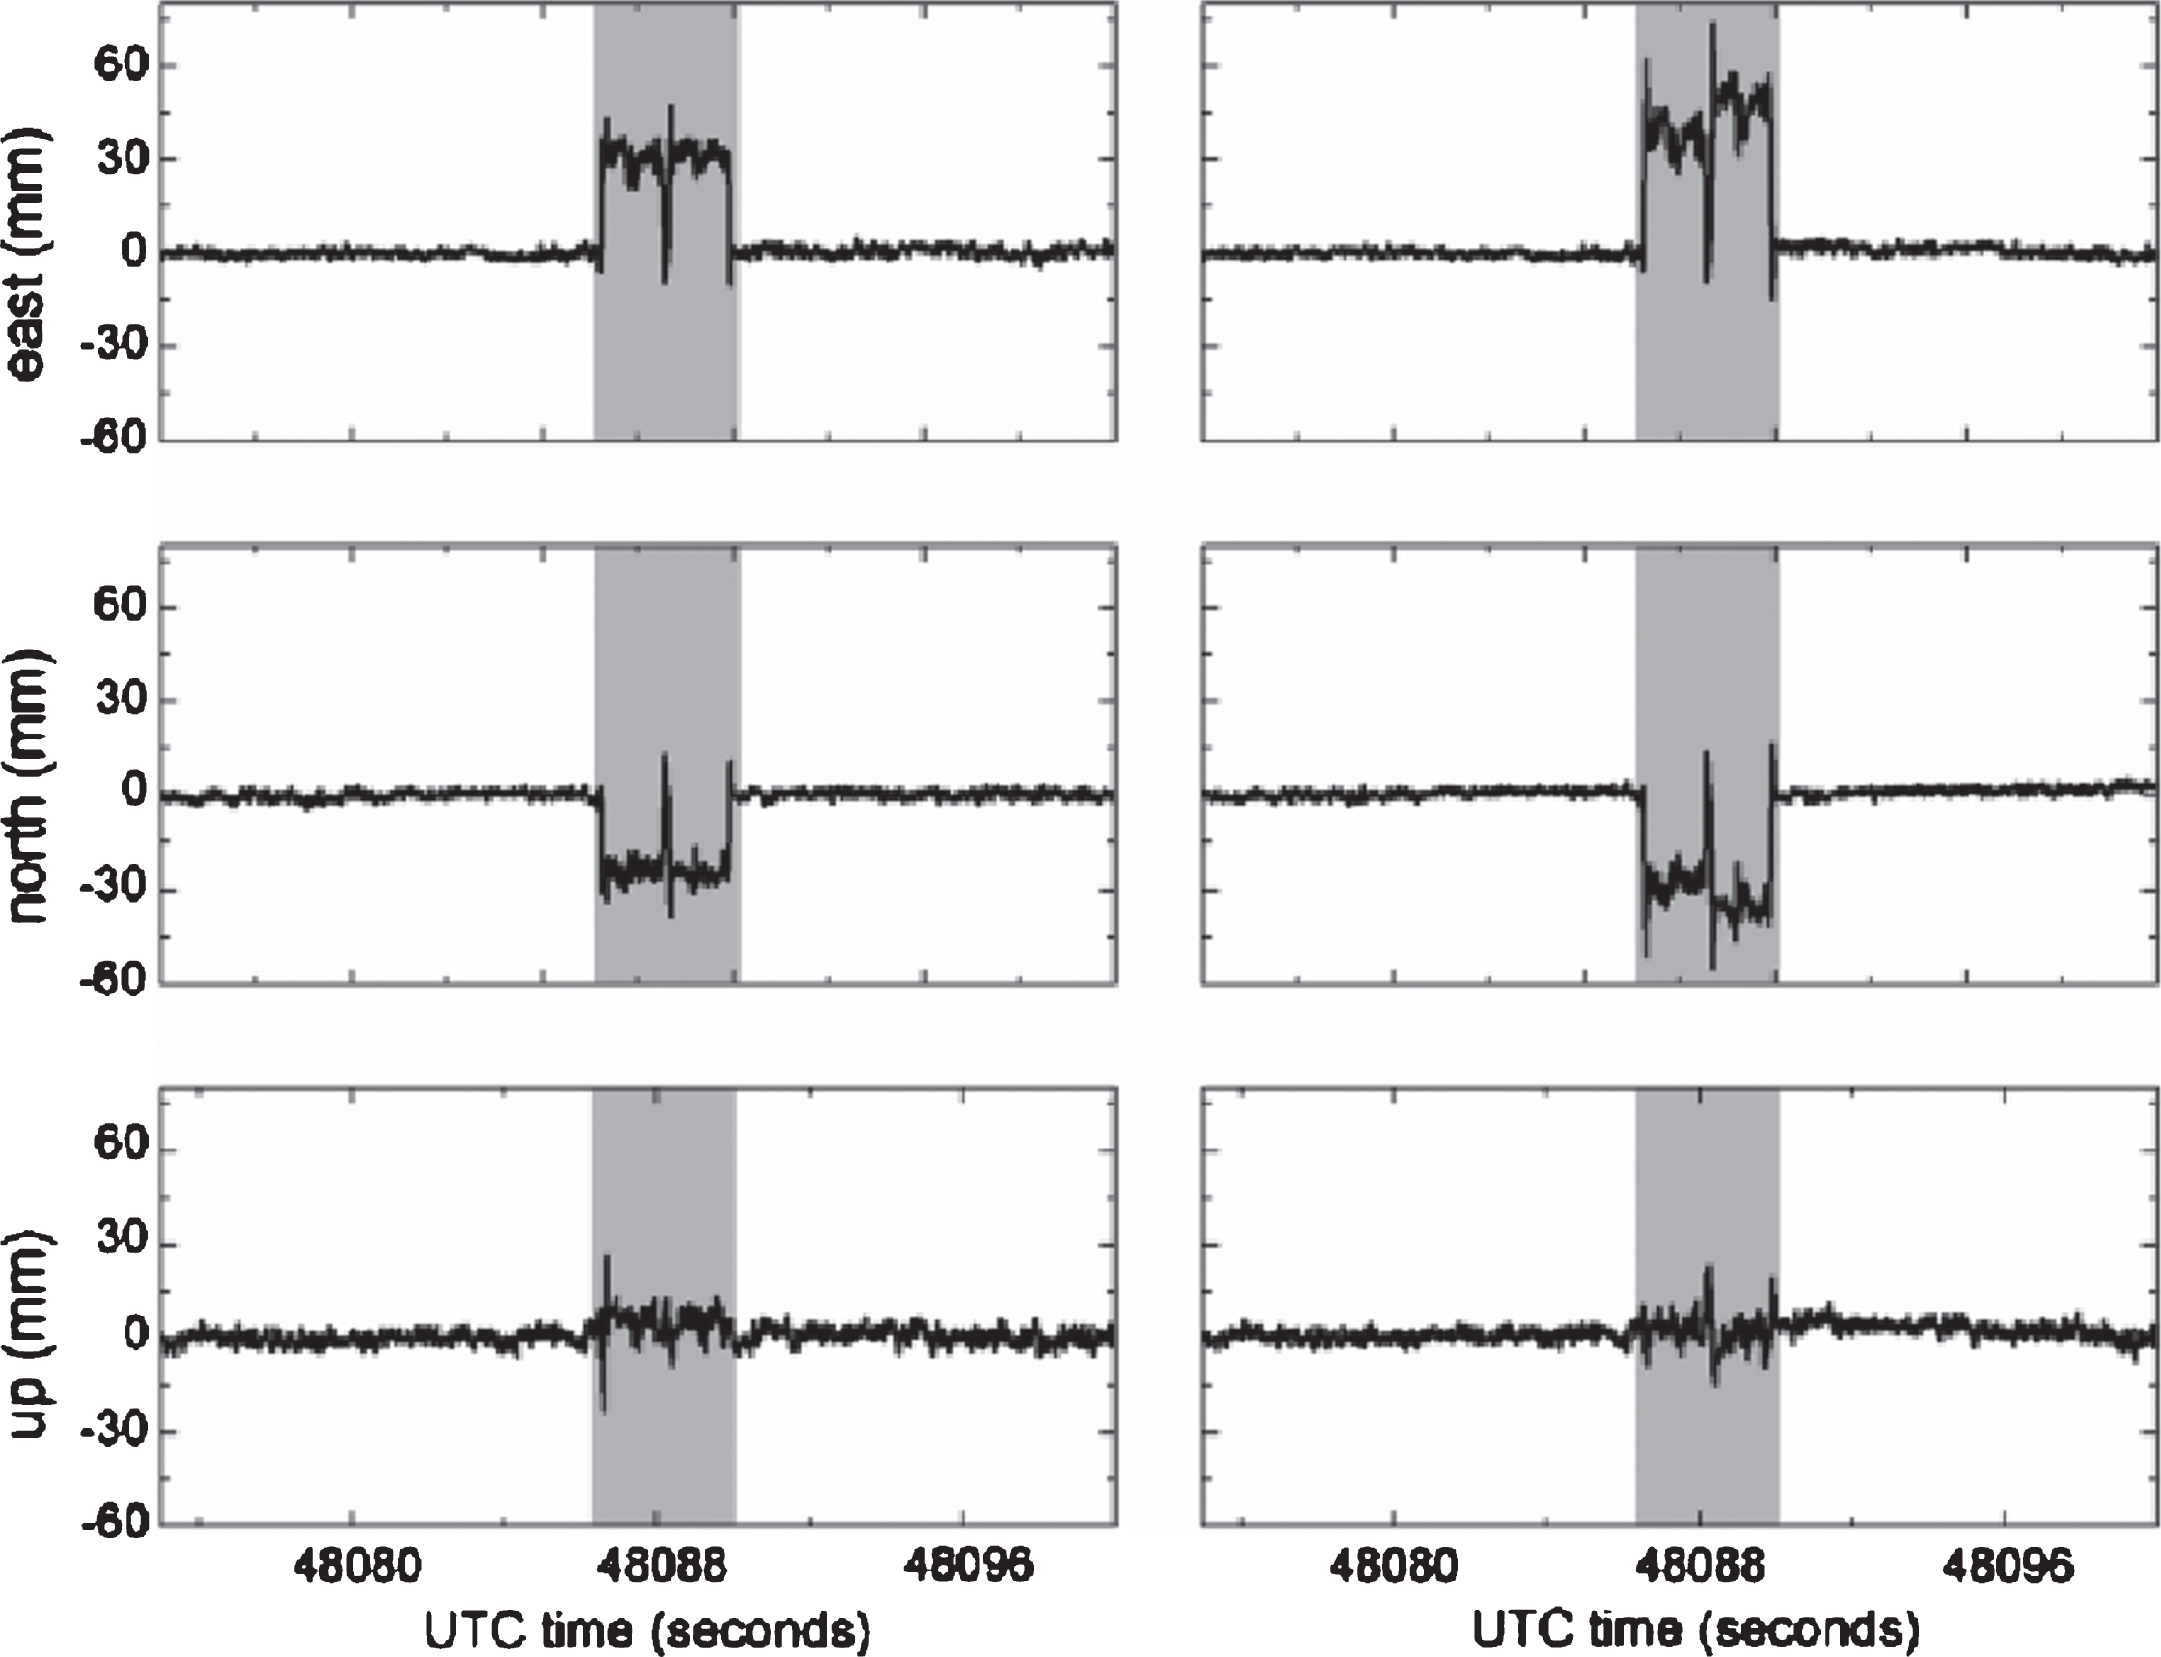
A wide range of controlled experiments were used to constrain the measuring strategy. These included measurements of known characteristics, for example recordings of dynamic deflections using sensors fixed on a shaking table (Psimoulis et al., 2008), or simulation of GPS measurements on a bridge deck, next to a passing train (Moschas and Stiros, 2014a). In this last case secondary reflections of the satellite signal to the highly reflective surfaces of the train gave the impression of an unrealistically high deflection (Fig. 2; see also section 3.2). This is a basic explanation for some cases of abnormally high deflections of stiff bridges that are reported by various authors. Of course, this error is limited to receivers next to passing vehicles, not to receivers on top of pylons or bridges with a rectangular section, with the deck on the lower level and GPS on the top of the truss, and hence not disturbed by passing vehicles.
An output of this study is to confirm the potential of application of GPS and of RTS in monitoring not only long, high-period bridges, but of stiffer bridges as well, expanding the limits of application of GPS and RTS (Moschas & Stiros, 2011; Stiros & Psimoulis, 2012; Moschas et al., 2013).
Concerning RTS, their main problem is the low measurement rate of commercial instruments. To overcome this problem, we used an upgraded built-in software permitting to collect measurements with a mean rate of 7 Hz and a resolution of 0.01 sec. This, in combination with high quality reflectors (AGA super-type reflectors) offers an accuracy of±1-2 mm for isolated measurements (not standard deviations of numerous measurements) and makes RTS suitable for monitoring of 3-D deflections of relatively stiff structures (Psimoulis & Stiros, 2008).
Use of collocated instruments
Because we are fully aware of the limitations of all sensors (various types of noise/errors, malfunctions, etc.), our field studies were based on collocated sensors, mostly more than one RTS, GPS and accelerometers were set next or on top of the other, in order to limit the effects of sensor malfunction and to compensate for the weaknesses inherent in each type of sensor (Fig. 3a). For example, GPS has higher sampling rate (usually 10 to 100 Hz for structural monitoring, compared to 1 Hz used for conventional geodetic work), but is noisy, while RTS has a smaller sampling rate but lower noise, so their fusion leads to reliable and useful results (Psimoulis & Stiros, 2008).
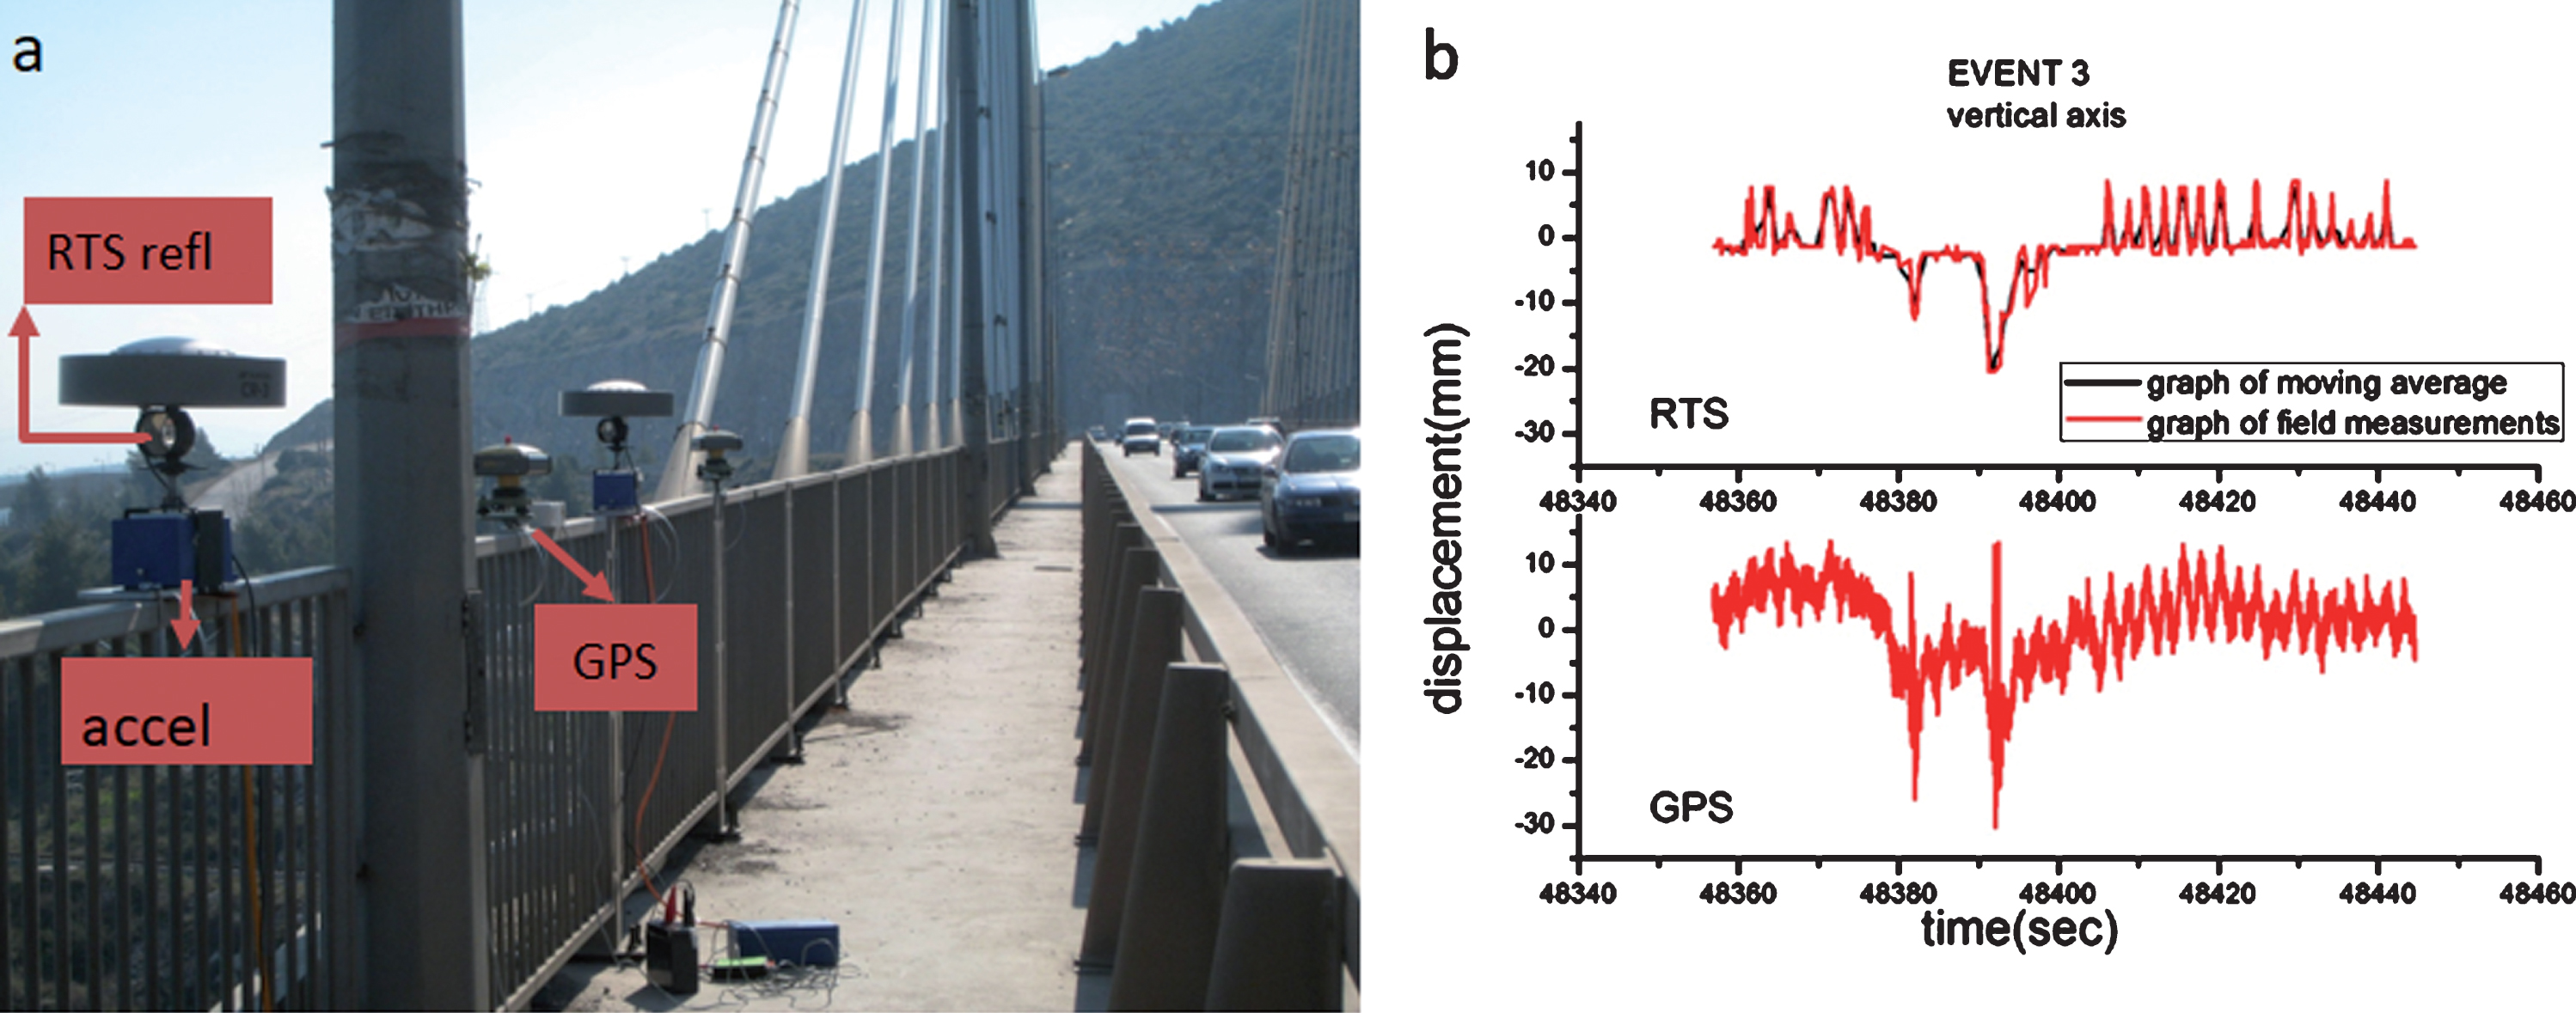
a: Monitoring instruments at the midspan of the Evripos Bridge. Two circular RTS receivers, two force-balance accelerometers and four GPS receivers (two of which with large chock-ring antennas) are visible. b: Vertical deflections produced by two passing trucks recorded by one of the RTS and one GPS.
An efficient way to control sensor noise is to compare recordings during intervals of excitation with measurements of no excitation (cf. section 3.3). Furthermore, if it is possible to record the response of a bridge during free attenuating oscillations, confirmed by accelerograph data, and compute its first modal frequency.
Accuracy of measured deflections
Only the values of instantaneous deflections are of importance for bridge monitoring, not their mean values or standard deviations, and this makes the estimation of accuracies of measured deflections difficult for any field study. This is because geodetic estimates are influenced by various sources or errors, depending on local conditions, The methodology described permits to estimates accuracies above the threshold of 1-2 mm for modal frequencies 1–3 Hz.
Case studies
We present results from monitoring of deflections of four bridges in Greece, with quite different structural characteristics. In the monitoring of these cases we adopted/developed the methodology proposed (instrumentation and data processing method).
The Evripos (Chalkis) cable-stayed bridge
The Evripos (Chalkis) cable-stayed bridge is about 700 m long with a very thin (45 cm) deck, the first cable-stayed bridge constructed in Greece. The dynamic response of this bridge, especially during an earthquake, derived from the analysis of accelerometers and geodetic sensors, has been discussed in the past by Lekidis et al (2005). Monitoring results discussed derive from a survey based on several fully or nearly collocated instruments at the midspan of the bridge: force-balance accelerometers, two passive reflectors each sighted by a different RTS, and four GPS receivers, two of which with large chock ring antennas to minimize secondary reflections (multipath). These sensors (Fig. 3a), in combinations with sensors on stable ground were focusing on the response of the bridge to traffic, during a wind-free day, and with traffic characterized by intervals of quiescence interrupted by excitations produced by lorries and busses, so that the response of the bridge to discrete loading events can be described.
Figure 3b summarizes some aspects of the response of the deck of the bridge to two passing conventional lorries, showing vertical deflections derived from GPS and RTS recordings. The overall pattern of the two diagrams is similar, and the signatures of the passing lorries are clear, marked by a maximum deflection of 20–30 mm, reasonable for the thin, flexible deck of this bridge. Still, the noise characteristics of the two graphs are different, highlighting the difficulties of applying these types of measurements to stiffer structures.
The Gorgopotamos historical railroad bridge
This is a historical bridge train in central Greece, next to the town of Lamia. The bridge consists of masonry pillars, up to 32 m high, a steel truss deck and openings about 28–30 m long (Fig. 4). This bridge has suffered much damage during the World War II and this has some impact on its dynamic behavior. In addition, it is founded on marls, the mechanical behavior of which is different in dry and wet periods. When excited by trains, this bridge produces strong vibrations which forced to low train velocities, and is currently out of use, because the whole line has been abandoned.
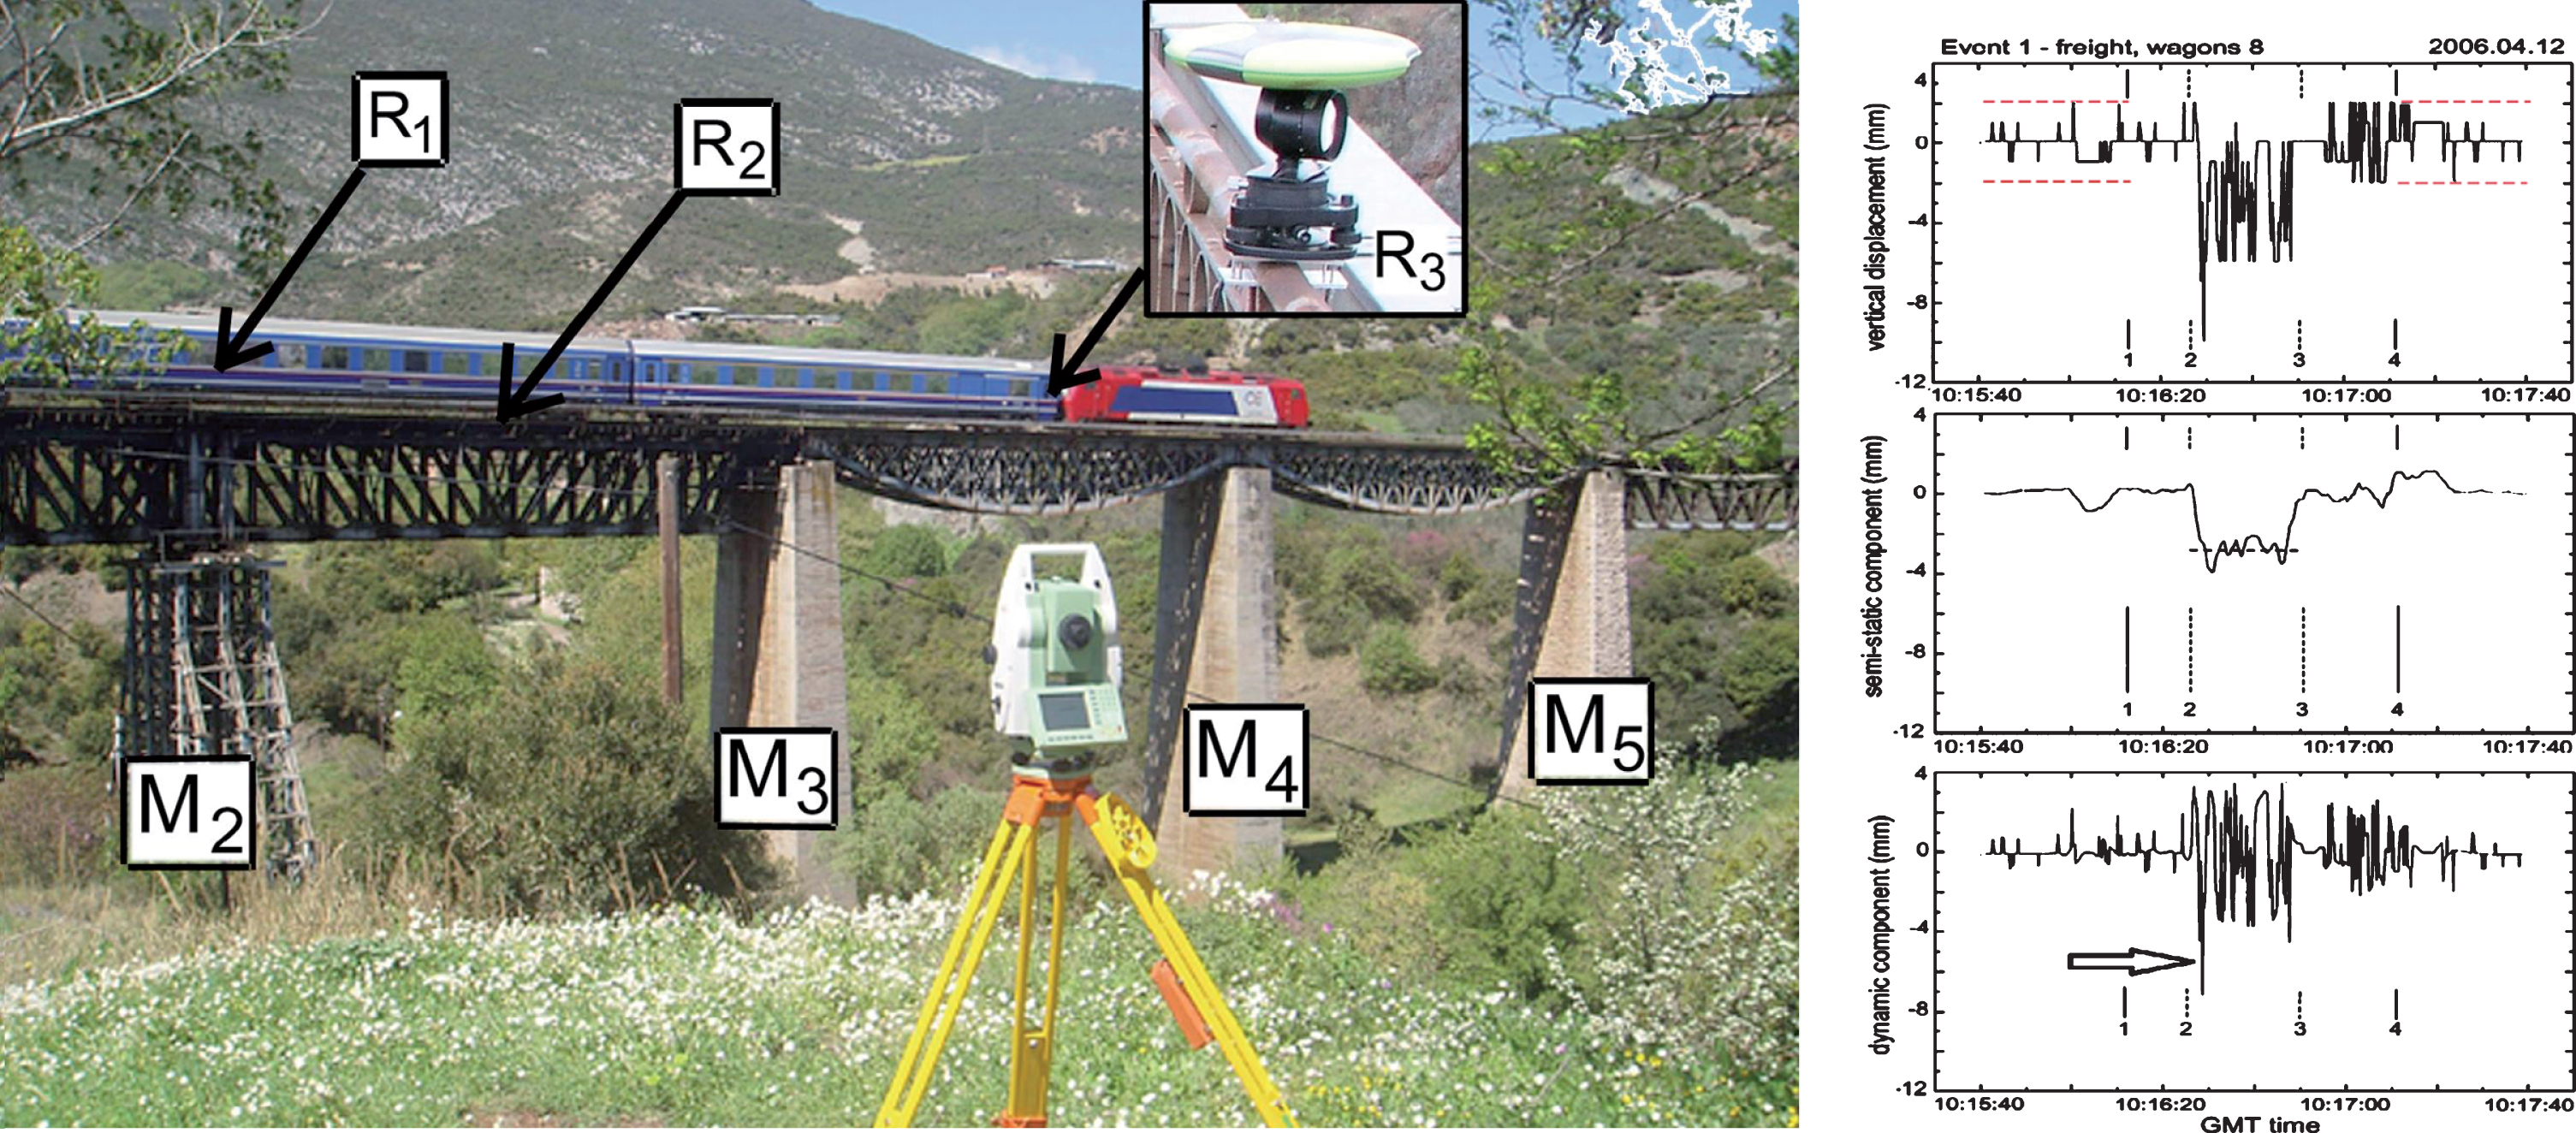
(Left): A train passing through the historical Gorgopotamos Bridge produces dislocations recorded by a Leica RTS (shown in foreground) sighting to an AGA super reflector at the midspan of the bridge (shown in the inset). The GPS signal recorded by an antenna collocated with the reflector, next to the tracks, was highly contaminated by dynamic multipath. (Right) Observed vertical displacement and its semi-static and dynamic components. In the latter, an arrow indicates a pulse, reflecting the first impact, a soil-structure-loading interaction effect.
Measurements reported were based on RTS and GPS, focusing on the response of the midspan of a central opening during the passage of trains of different types (light service trains, passenger trains and long, heavy freight trains) under different environmental conditions (dry marls at the foundations, responding as solid rock and wet marls responding as a compressible material).
Figure 4a shows the response of the bridge in the vertical axis when excited by a heavy freight train during a wet season. Measurements analyzed were based on RTS; measurements by GPS (with common, geodetic antennas) were highly contaminated by dynamic multipath, leading to apparent vertical deflections exceeding one meter in amplitude (Moschas et al., 2013). This justifies the use of collocated sensors of different types.
The bridge response to a freight train was characterized by semi-static and dynamic deflections of several mm (Fig. 4). It is of prime interest the peak in deck subsidence when the train was first entering the 32 m-long opening, leading to an additional pulse-type deflection of several mm. This effect was observed only for heavy loads (freight trains) and only when marls in foundations were wet. It reflects the first impact and a soil-structure interaction effect.
A stiff metallic footbridge crossing the Kifissos Avenue in Athens was tested during controlled excitations by a group of well-trained people to produce freely attenuating oscillations. The footbridge consists of a steel truss supported by four reinforced concrete pylons through isolators. The total length of the deck is 62 m and is divided into a central span 41.5 m long and two side-spans, each 10.25 m long (Fig. 5). The truss has a square cross-section, made with circular tubes with an external diameter of 244 mm. The bridge was designed to comply with the Eurocode EC-3 specifications, implying a first natural frequency of the central span > 3 Hz and maximum vertical deflections at the midspan < 30 mm. A preliminary FEM analysis revealed a dominant vertical frequency of 4.32 Hz and maximum vertical oscillations of 4-5 mm at the midspan (Moschas and Stiros 2013).

The steel footbridge in Athens. Monitoring sensors were mounted on the top of the truss, at the middle of the main, central span.
The vibration control system consisted of two compact 10 Hz GNSS receivers installed on the top of the truss (hence with undisturbed view of satellites), collocated with two AGA super-type reflectors, each sighted by one RTS on the ground, as well as event-triggered force-balance accelerometer. Discrete, controlled excitations were produced by a group of people with a mass of 450 kg, jumping or running, with their movement suddenly freezing to produce free attenuating oscillations. This produced excitation events with peak vertical accelerations between 0.10–2.00 g, occasionally giving the sense of an imminent collapse, and which were recorded by all sensors along with data from preceding and following intervals of no movement. Analysis of data following the process shown in Fig. 1 indicates consistency of GPS and RTS-derived deflections within an error margin of 1-2 mm. Figure 6 summarizes lateral and vertical dynamic deflections along with accelerometer recordings for a certain event.
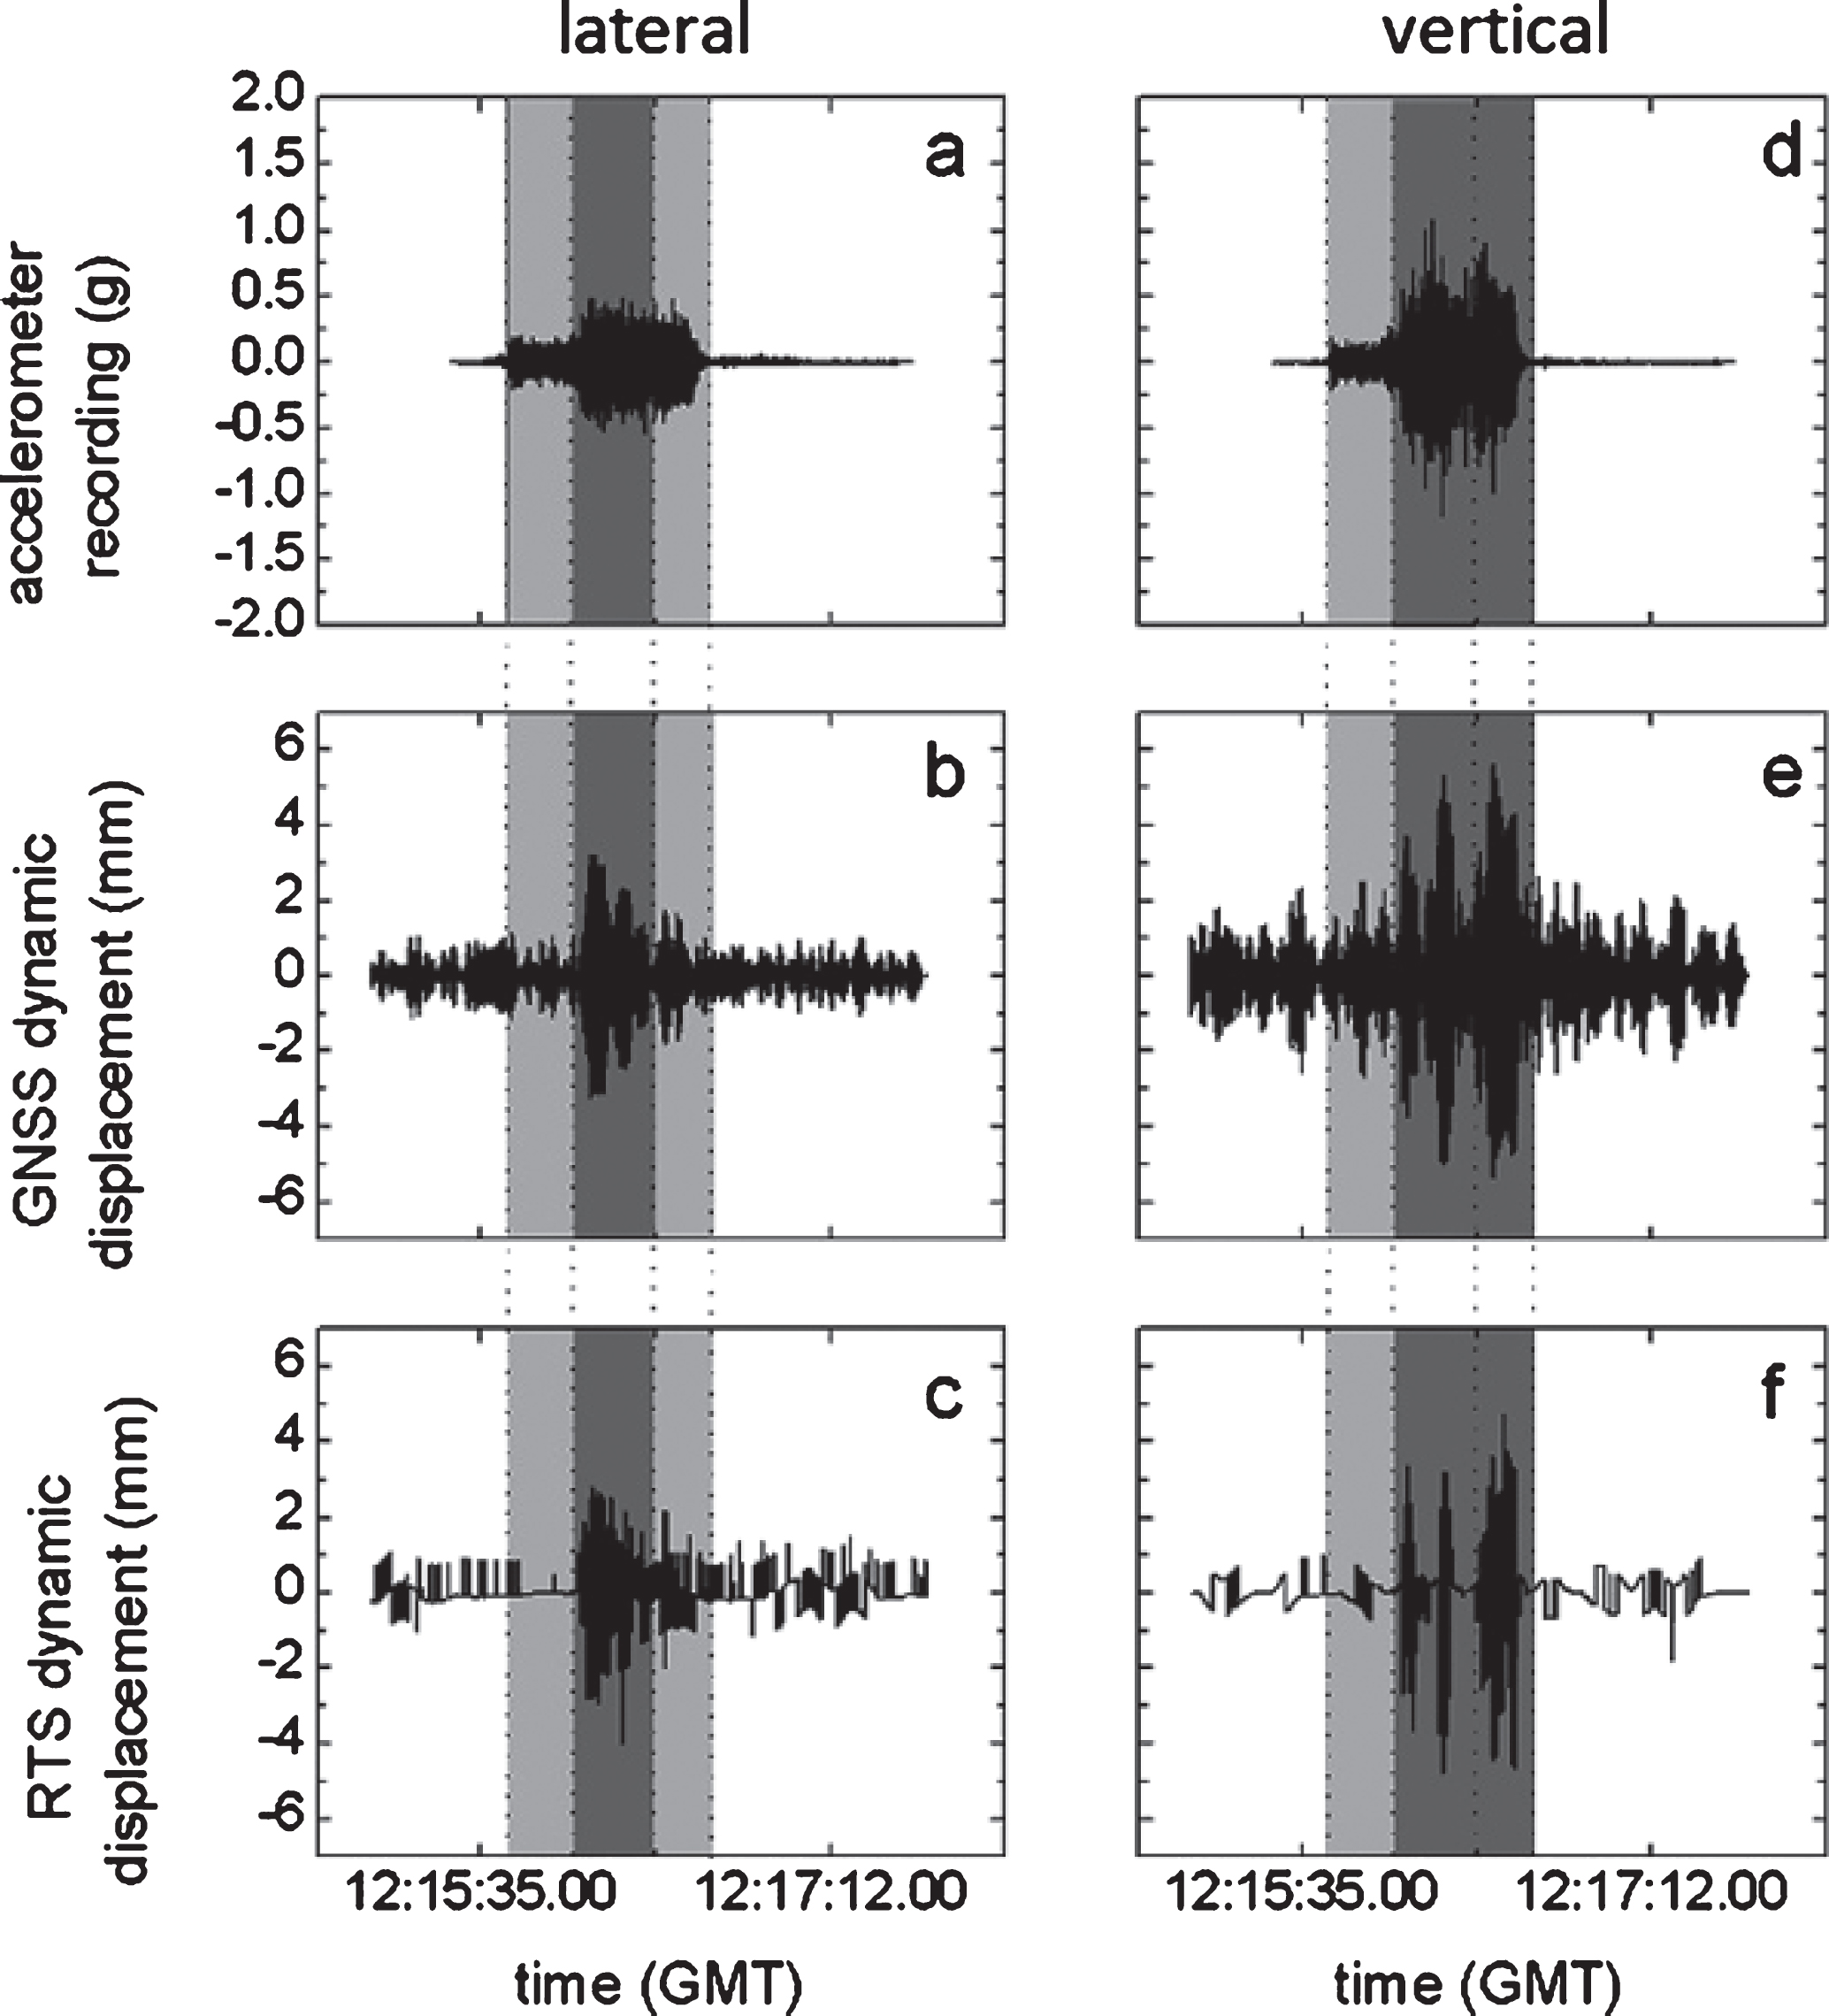
An example of dynamic displacements derived from GNSS and RTS, in comparison with accelerometer measurements. Mark consistency of results, but also noise of a few mm in deflections (modified from Fig. 9 in Moschas & Stiros, 2013).
Events satisfying certain criteria (mainly the criterion of a free attenuating oscillation derived from accelerometer measurements) were further processed based on a weak sensor fusion approach. Results are reported in Moschas & Stiros (2011), Moschas & Stiros (2014b) and in this article we focus on the contrast of spectra of deflections of the sensors (GPS, RTS) during intervals of motion and of no motion, as well as on components along the main axis (longitudinal), the lateral and the vertical axis. Spectra were computed with a least-squares based code to provide estimates of statistical significance and to cover RTS measurements which are not characterized by a constant sampling rate (Pytharouli & Stiros 2008; Stiros & Psimoulis 2012). Figure 7 shows that significant spectral peaks are observed only during the excitations and only along the vertical and lateral axis, as is expected in a stiff bridge of this type.
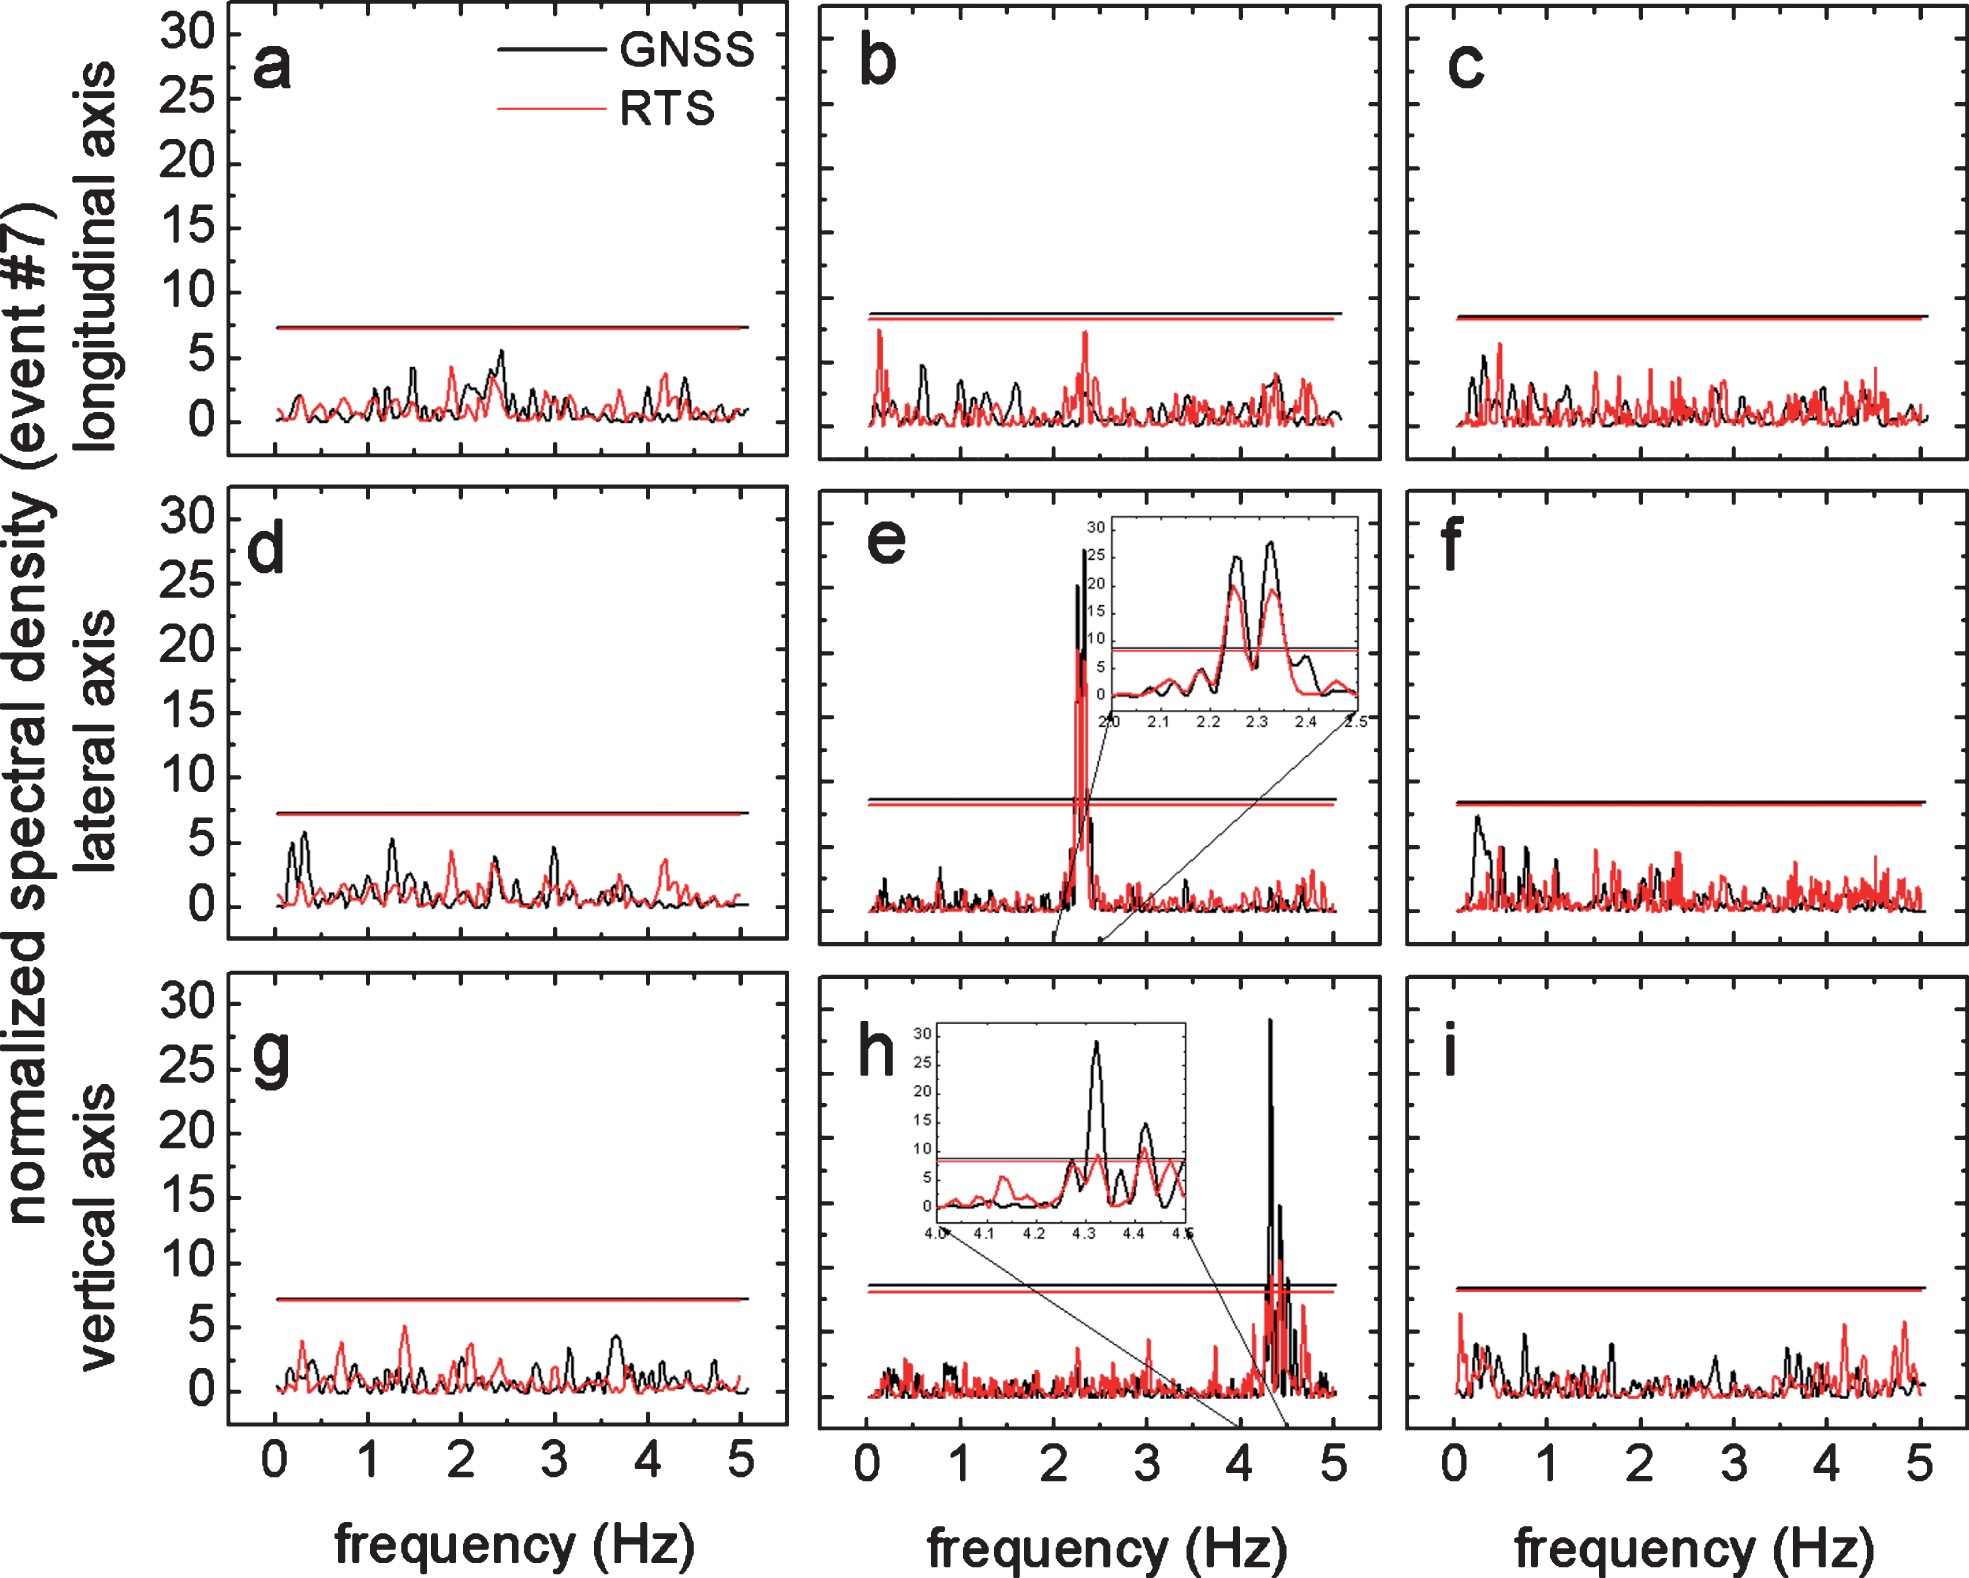
A composite graph explaining how spectra of GPS and RTS-derived deflections of the steel pedestrian bridge of Fig. 5 can be used as logical and structural constraints to assess the quality of computed deflections. Left and right column correspond to intervals before excitation, the central column to a free attenuation interval determined from accelerometer recordings (see Fig. 1d). Statistically significant spectral peaks are observed only during the excitation interval, and only along the vertical and lateral axis. In all other cases, noise only is observed. In all graphs superimposed spectra of the two sensors are shown. After Moschas and Stiros (2014b).
The Kanellopoulos timber footbridge was constructed in 2000 using GLULAM wood and certain steel elements. The deck has a total length of about 30 m and width of 2.9 m and is formed by two main twin horizontal parallel beams, stiffly connected at their edges by twin transversal beams. The deck is also supported by two vertical arches leaving a midspan of 26.5 m (Fig. 8; for details see Stiros & Moschas, 2014). Constructional problems (stiffeners beneath the deck omitted during the construction and damage by an extraordinary for the area flash icing event), transformed this initially stiff bridge to a laterally swaying bridge (see video Supplement in Stiros & Moschas, 2014).
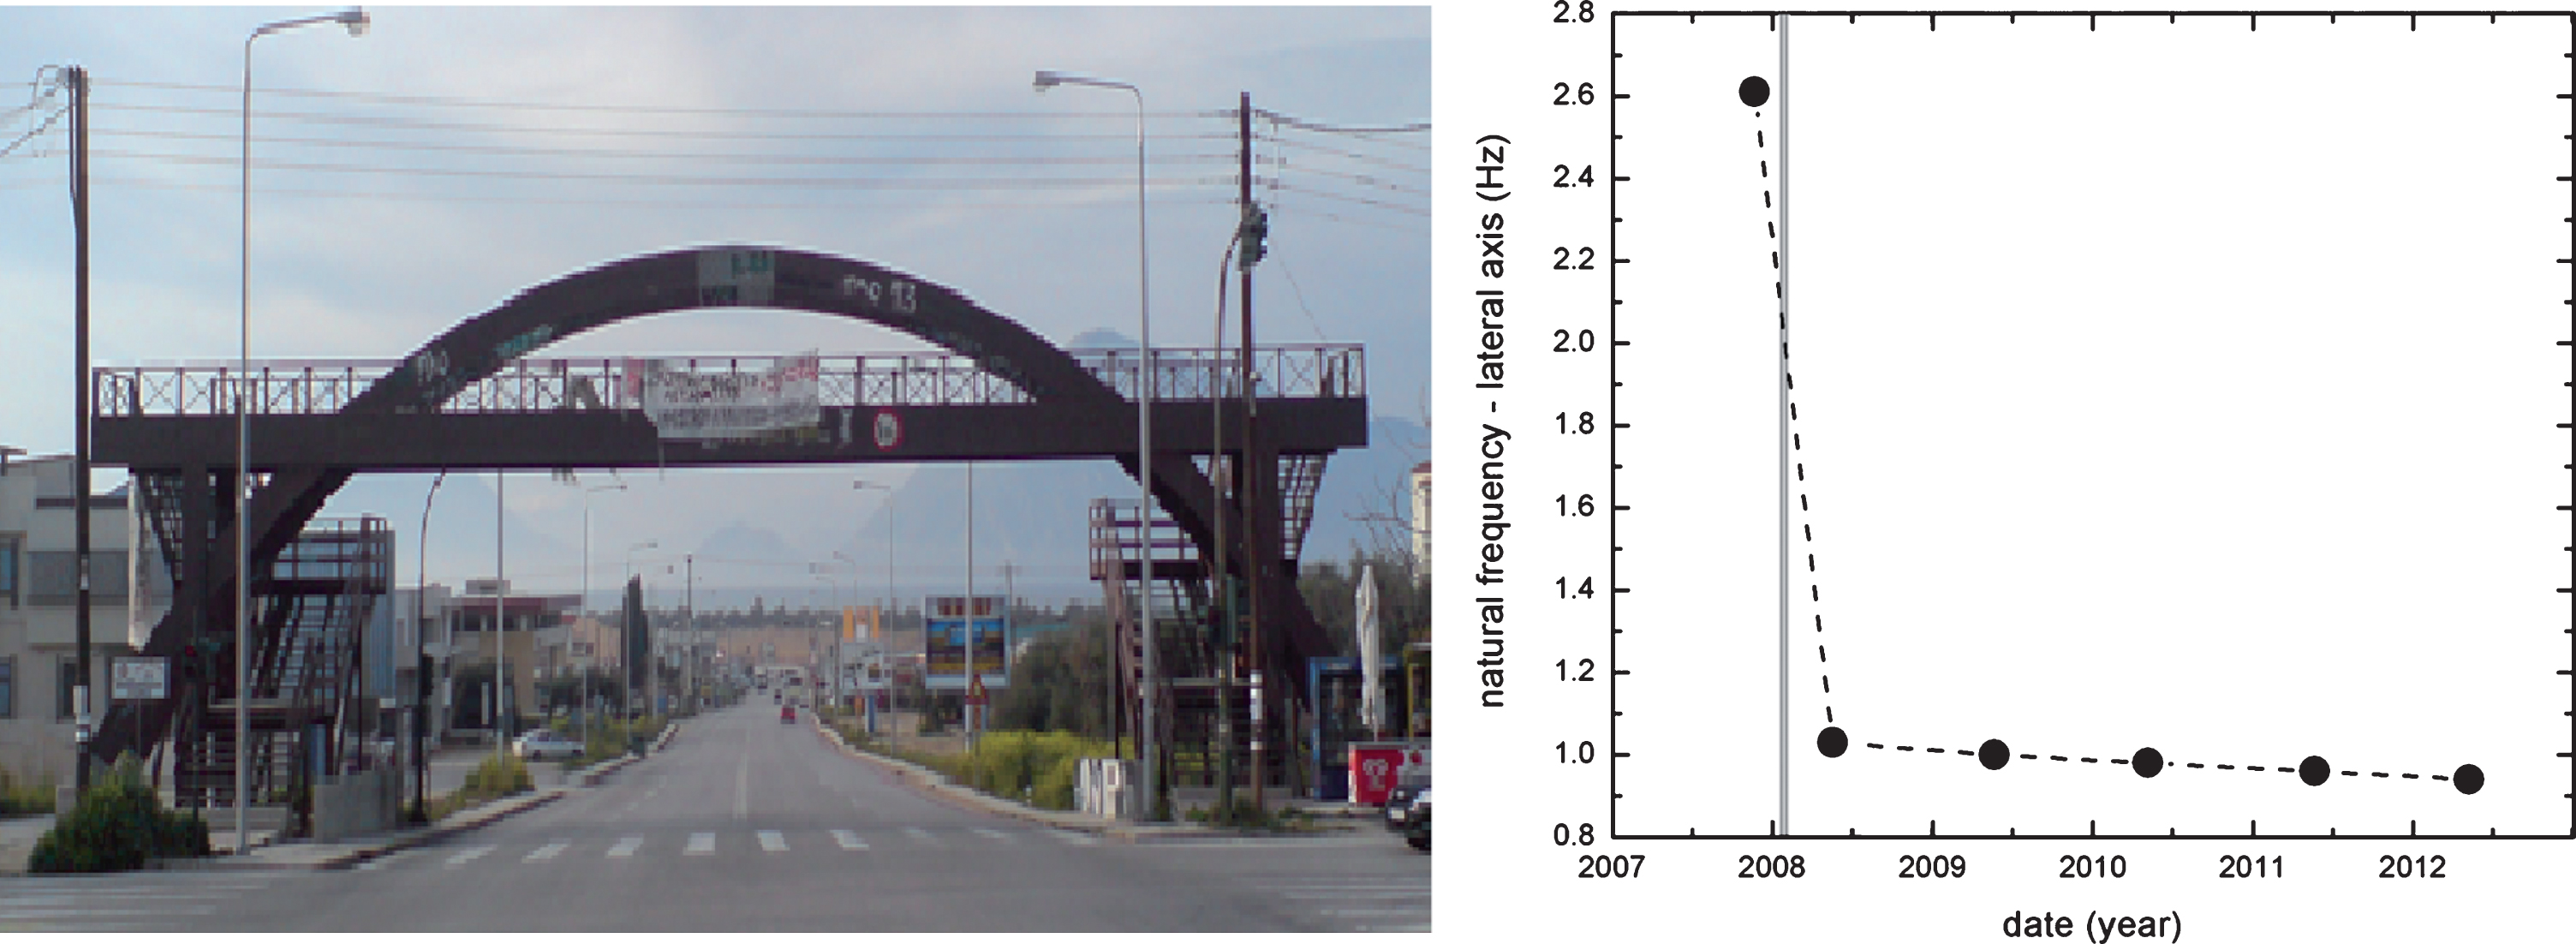
Left: The Kanellopoulos timber bridge in Patras, Greece. Right: Changes in its first lateral frequency derived from RTS and confirmed by GPS. Modified after Stiros & Moschas (2014).
The decay of this structure has been recorded by several annual monitoring surveys between 2007 and 2013, under identical measuring, loading and environmental conditions, and is summarized in Fig. 8b. This figure shows an impressive episodic and then gradual shift of the first lateral natural frequency of the bridge. This result is fully reliable because, for each yearly survey, it comes from several instruments and free-attenuating oscillations which are dominated by a main modal frequency of the bridge. Decay was mainly affecting lateral stiffness, and vertical stiffness was little affected, so that its vertical first natural frequency did not drop below 6 Hz.
This result was derived both by accelerometer and GPS data using 100 Hz GNSS measurements (Moschas & Stiros 2015); RTS data cannot record oscillations of this frequency. Clearly, the use of GPS was possible because this bridge has no large reflective surfaces to produce important multipath.
Experimental evidence and evidence from several bridges summarized above indicates that geodetic instrumentation is not limited to long cable-stayed bridges which are characterized by deflections with an amplitude of the order of tens of centimeters when excited by heavy trucks (Roberts et al 2004; Meng et al., 2007; Brownjohn et al., 2014), but it can cover also short, stiff bridges (openings < 30 m) with modal frequencies of the order of 3 Hz and deflections of a few mm.
Geodetic monitoring, however, has various limitations, and is not free of problems and misconceptions. For example, errors such as dynamic multipath (Fig. 2) may hamper results and give the wrong impression of excessive dynamic dislocations which are not possible from the structural point of view and from the everyday experience. Collocated sensors especially of different types can solve this ambiguity. This is one of the major points of our monitoring strategy.
Another problem is the significance and further use of displacement data. For example, in Fig. 1 an excitation is recorded by GPS and RTS between seconds 20 and 70, but the corresponding spectra cannot readily provide any information on the dynamic characteristics of the bridge (natural frequencies etc.). Probably this record is dominated either by noise or by characteristics of the excitation (velocity of a passing vehicle, frequency of passing vehicles, etc.; transient oscillations). On the contrary, the free attenuating oscillation marked in Fig. 1d is controlled by the first natural frequency of the bridge and the spectrum of the corresponding deflections can define the first natural frequency.
The overall conclusion is that the limits of applications of geodetic sensors in bridge monitoring have been broadened, opening new horizons in structural health monitoring.
Conflict of interest
None to report.