






Abstract
BACKGROUND:
Laser Doppler flowmetry is widely used in scientific studies of blood microcirculation but constrained in clinical use due to the low diagnostic significance.
OBJECTIVE:
This research is aimed at creation of approaches to prognostic value increase in detection of microcirculation disorders in patients with type 2 diabetes mellitus.
METHODS:
The study included 10 volunteers and 10 patients with t2DM. Participants were observed using postural-heating test with LAKK-02 complex. We calculated median microcirculation for each period and then held a retroactive classification of the surveyed groups.
RESULTS:
Statistically significant differences between groups were found in the perfusion during the combination of postural and heating impacts. Conversion of this perfusion in the relative index (Irel) (relative to the baseline perfusion), allowed us to increase the significance of the differences. The value of AUC (95% CI) during the ROC-analysis in reverse classification was 0.81 (0,60–1,0) for the period of the impacts combination, and 0.93 (0,81–1,0) for Irel index.
CONCLUSIONS:
We demonstrated the possibility of using LDF method to achieve predictive value in the detection of microcirculatory disorders in an individual patient with diabetes. This extends the perspectives of the method beyond the purely scientific research.
Background
Laser Doppler Flowmetry (LDF) has been used for examination of blood microcirculation since the 70 s of the XX century [1, 2]. LDF allows to perform non-invasive quantitative assessment of skin microcirculation using different functional tests, that makes this method highly-demanded in researches of microcirculation in different conditions [3–5].
One of the most promising areas for LDF is diabetology. Microcirculation impairment in diabetes mellitus (DM) is the pathogenetic reason of complications development. Results of the scientific use of LDF allow us to single out some perspective ways of clinical implementation of this method: early detection of DM and diabetes complications, assessment of the treatment effectiveness [6, 7].
Unfortunately, clinical realization of LDF is constrained by a number of factors: high variance of measurements, insufficient differences between groups, some metrological and technological aspects (the lack of standardization) [3, 8]. These factors do not allow to proceed from the assessment of groups to assessment of individual patient. In the presented work we studied techniques, which can increase informativeness of measurements: combined functional impacts and algorithms of post-registrational data processing.
Objective
The aim of this research is to determine approaches to prognostic value increase in detection of microcirculation disorders in patients with type 2 diabetes mellitus (t2DM) using LDF.
Methods
The study included 10 volunteers and 10 patients with t2DM. Control group included healthy individuals without disorders and age-related changes of microcirculation. The second group included patients with complicated long-established t2DM (more than 5 years). Characteristics of the groups are shown in Table 1.
Description of the groups included to the study. Calculated parameters: Mean±Standard Deviation – M±SD, Median and quartiles – Me (LQ; UQ), absolute and relative value – n (%)
Description of the groups included to the study. Calculated parameters: Mean±Standard Deviation – M±SD, Median and quartiles – Me (LQ; UQ), absolute and relative value – n (%)
*p < 0,05, Fisher’s exact test.
The groups were formed according to the clinical signs of microcirculation disorders presence. To exclude age-related changes of the microcirculation in the control group, only young individuals were included to the study.
In the current work, the following exclusion criteria were used: Smoking habit (patients were asked to refrain from smoking 5 hours before the test); Pregnancy; Atrial fibrillation and other rhythm disturbances; Endocrinopathies: acromegaly, hypercorticism, etc; Fever, inflammation, acute viral infections; Presence of blood diseases, thrombocytopenia, moderate and severe anemia, etc.; Violations of the musculoskeletal system; Skin diseases.
Skin microcirculation was measured using laser Doppler flowmetry (LAKK-01 complex, SPE “LAZMA”, Moscow, Russian Federation). Blood flow was registered in perfusion units (PU). Sensor was placed on the dorsal surface of the right foot. Temperature in the room was 23±1°C. After 15 minutes of adaptation to the measurements conditions, the patient was placed in a lying position. Measurement of microcirculation was performed using the combined postural-heating test. After a two-minute interval of registration of basic blood flow (I period), the temperature at the sensor continuously raised to 42±1°C for 3 minutes (II period) and maintained at this level to the end of the test. After that patient took a sitting position for 2 minutes (III period). Then the patient returned to the lying position for three minutes (IV period). The scheme of the test, correlated with an example of the measurement is shown in Fig. 1.
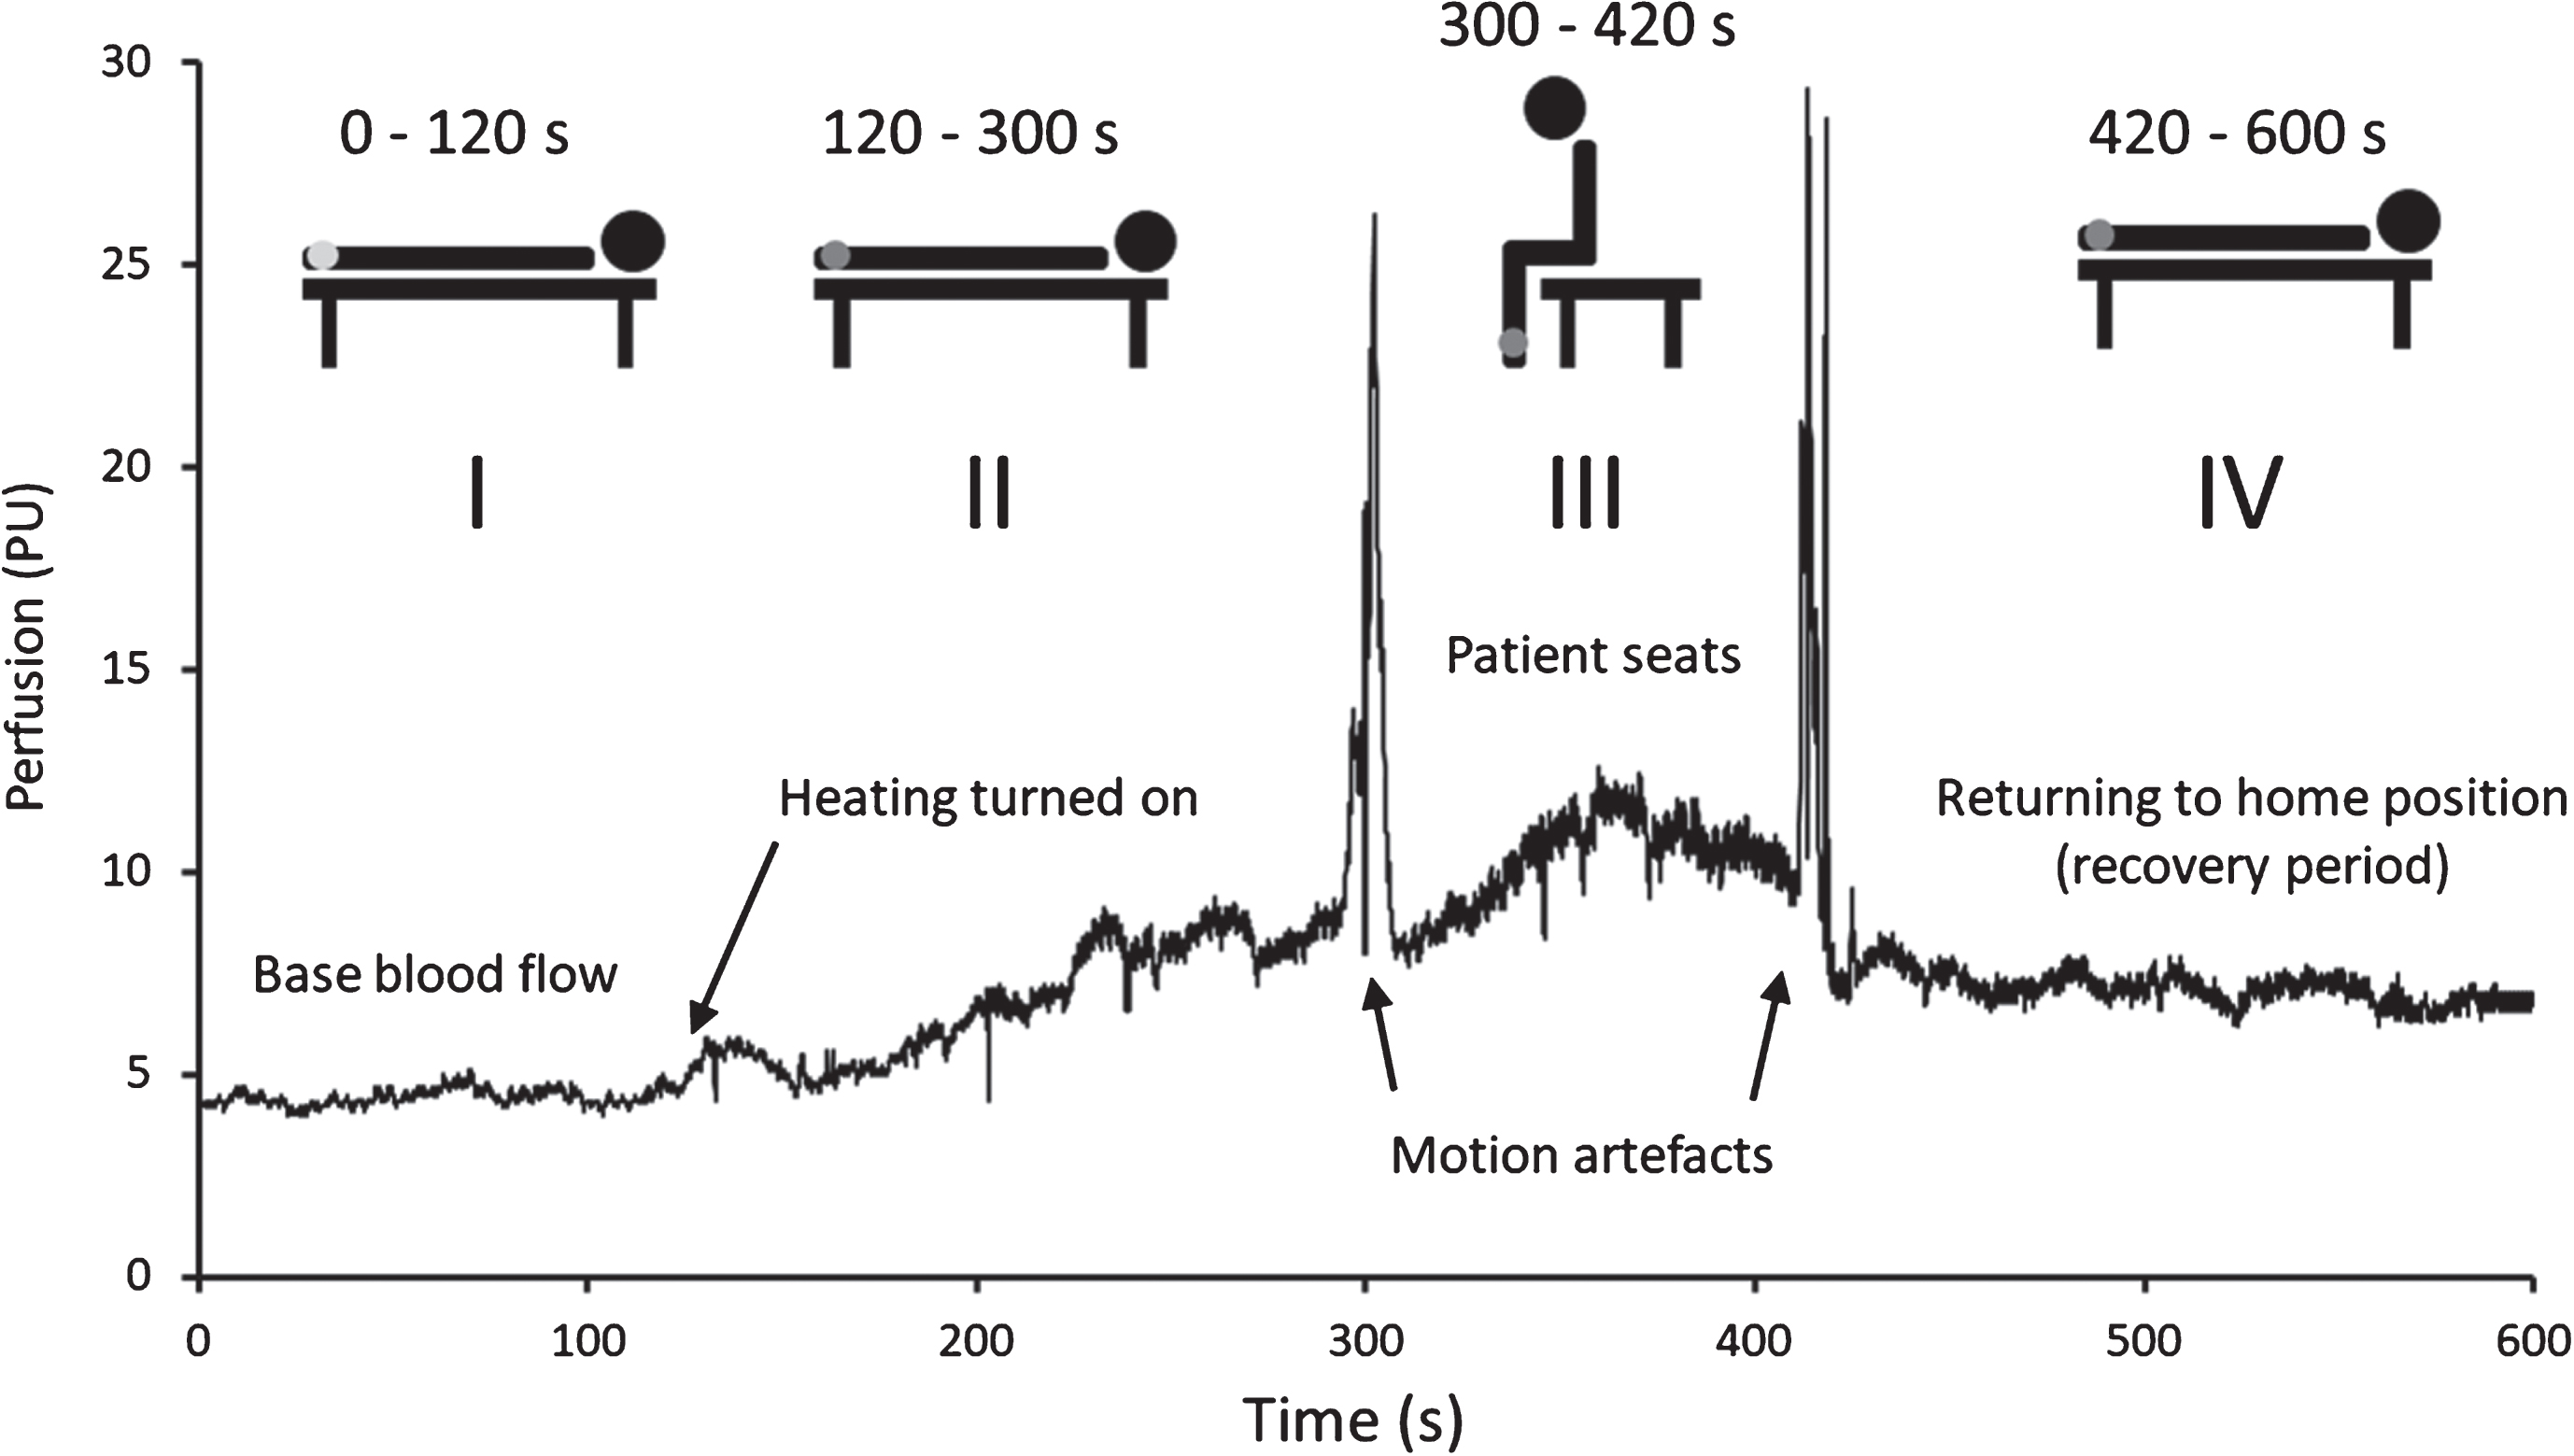
Algorithm of the postural-heating test. Sensor was placed on the dorsal surface of the right foot. After a two-minute interval of registration of basic blood flow (I period), the temperature at the sensor continuously raised to 42±1°C for 3 minutes (II period) and maintained at this level to the end of the test. After that patient took a sitting position for 2 minutes (III period). Then the patient returned to the lying position for three minutes (IV period).
For the I, III and IV periods median perfusion for each patient was calculated. During the calculation, time limits of the periods narrowed for 10 seconds on each side to reduce the influence of motion artifacts on the measurement results. Additionally, we calculated microcirculation index Irel: the median perfusion in the III period divided by the median perfusion in the I period. For these parameters were calculated group median and quartiles – Me (Lower Quartile; Upper Quartile). Comparison of the parameters was performed using Mann-Whitney test. Significance level (α) was set at 0.05. The diagnostic accuracy of the method in the reverse classification of the groups was assessed by ROC-analysis and calculation of sensitivity and specificity. All statistical analysis was performed using SPSS v.22 (IBM Corp., Armonk, NY, USA).
An informed consent was obtained from each patient included in the study. The study protocol conforms to the ethical guidelines of the 1975 Declaration of Helsinki and was approved by human research committee of Moscow Regional Research and Clinical Institute (Protocol No 8 of October 18, 2016).
The median perfusion index for the I period was 5.6 (2.8; 9.4) perfusion units (PU) in the diabetes group and 3.2 (3.0; 3.7) PU in the control group. These differences were not statistically significant (p = 0.089, Mann-Whitney test). II period has not been evaluated due to technical limitations and because of the large number of variants of the shape of the microcirculatory curve during the active heating phase – in the part of observations the microcirculatory curve did not reach the “horizontal” phase. Median perfusion during the III period in diabetes group was significantly lower than in the control group: 18.1 (13.9; 22.4) PU, and 10.8 (9.1; 13.9) PU, respectively (p = 0.023, Mann-Whitney test). During the IV period there was no significant difference: 8.9 (7.2; 13.1) PU in diabetes group and 11.6 (8.9; 20.9) PU in control (p = 0.307, Mann-Whitney test).
For each patient we calculated index of microcirculation Irel by the formula: Irel = MeIII/MeI. MeIII and MeI are medians for the III and I periods, respectively. Median Irel in the diabetes group was 2.1 (1.4; 3.3) and 5.6 (4.3; 7.5) in control group. Difference was statistically significant (p = 0.001; Mann-Whitney test). The results of the evaluation of the perfusion and Irel are shown in Table 2.
The results of the evaluation of the perfusion. Calculated parameters: Median and quartiles – Me (LQ; UQ)
The results of the evaluation of the perfusion. Calculated parameters: Median and quartiles – Me (LQ; UQ)
To evaluate the diagnostic value of the calculated parameters we performed ROC-analysis for the reverse classifying subjects into groups. For the median perfusion during the I period area under the curve (AUC (95% CI)) was 0.73 (0.49–0.97), for the III period –0.81 (0.60–1.0), for the IV period –0.64 (0.39–0.89), and for Irel 0.93–(0.81–1.0).
The median perfusion for the III period and Irel index were diagnostically significant. For these parameters the lower bound of the 95% CI for the AUC was greater than 0.5. The maximum level of sensitivity and specificity for the median perfusion in the III period was 80% and 60%, while the index for Irel –90% and 80%, respectively.
LDF allowed scientists to investigate disorders of microcirculation specific to DM: violation of endothelial function and neural regulation of vascular tone in different forms [9, 10]. The prospects of using the evaluation of cutaneous microcirculation in predicting the risk of developing diabetic foot ulcers were demonstrated [11]. A decrease in the heating vasodilatation in the patients with t1DM and t2DM with polyneuropathy was also shown [12]. Furthermore, method showed ability to detect early changes of microcirculation in patients with prediabetes and high risk of diabetes [13–15]. Unfortunately, in spite of the promising results of the studies, non-invasiveness and ease of use, the method did not spread to the clinics. Low value of LDF in the examination of a particular patient does not help a doctor in making clinical decisions [16].
The important factor of LDF, which restrains its spread in clinical practice, is the high variability of the measured parameters (and, consequently, low reproducibility) [3, 18]. The second factor is small difference between the “normal” and “pathologic” measurements. These factors lead to low efficiency in individual assessment of the microcirculation, whereas in scientific researches these problems can be resolved by increasing the number of subjects included into the study.
We can consider an example of
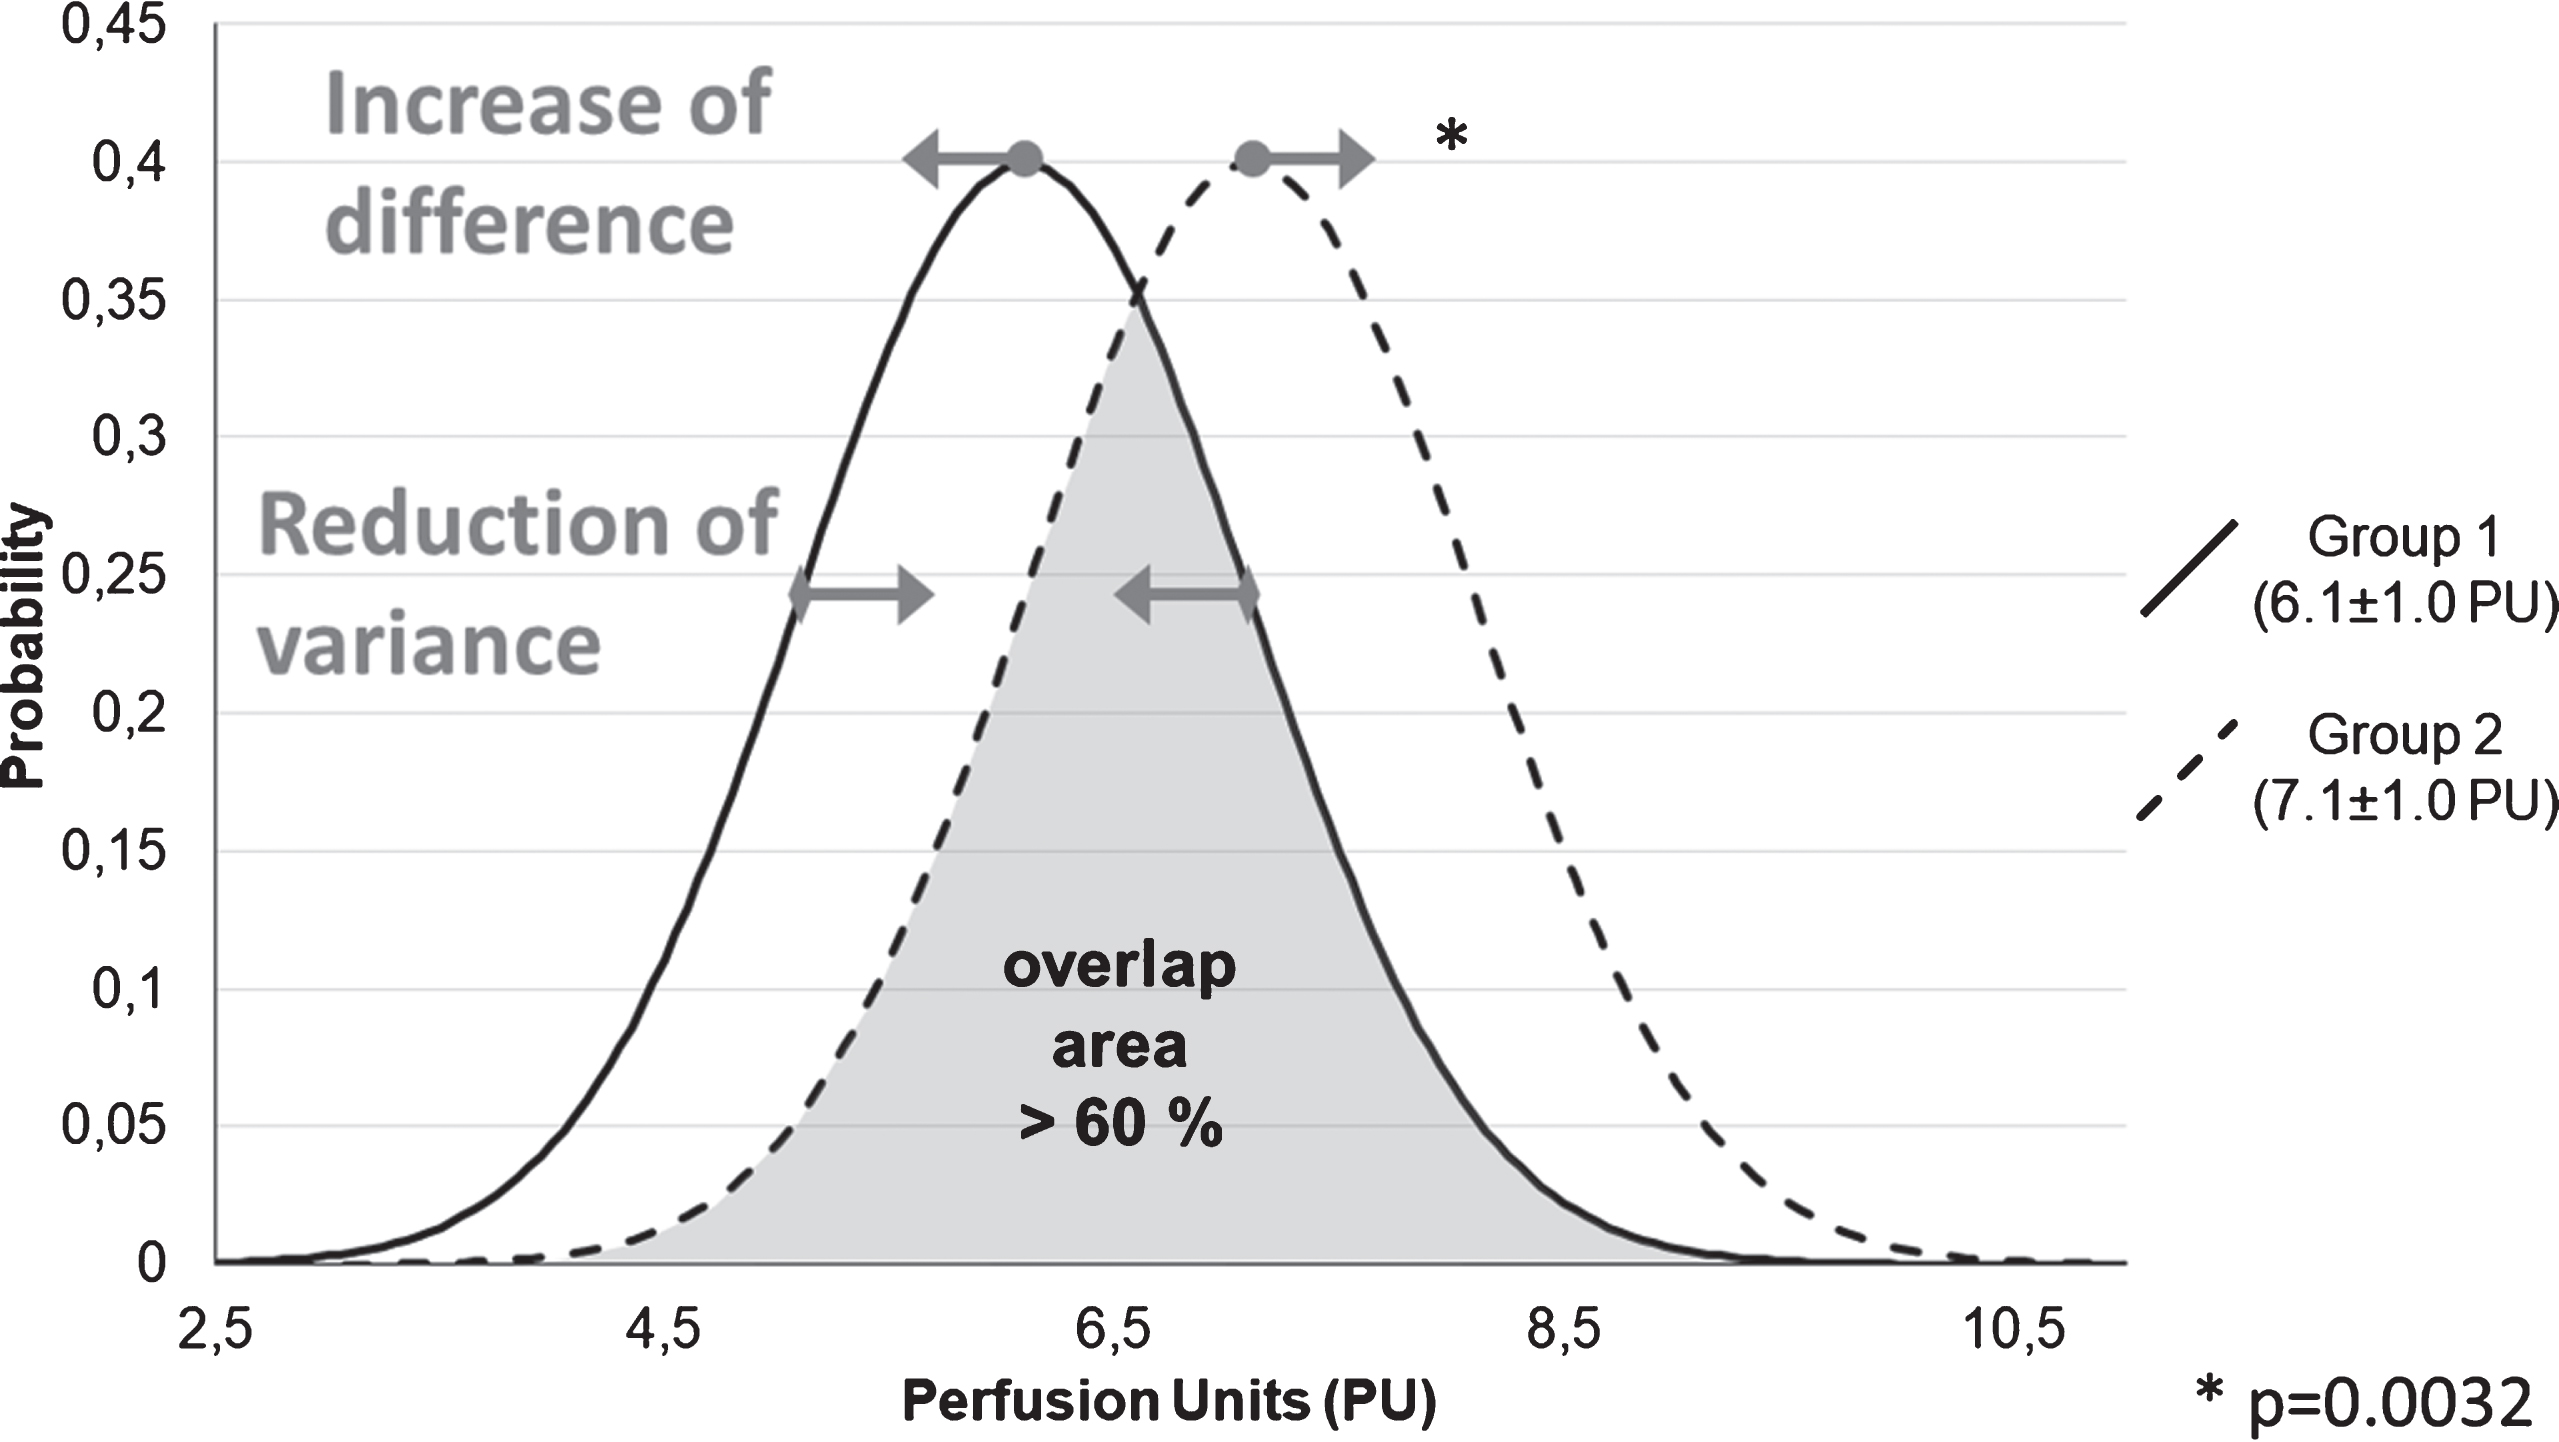
Difference between the statistical and clinical significance. Statistical significant results can’t be used in clinical practice because of big overlap and low diagnostic significance. This problem can be solved by increase of the difference and decrease of the variance.
In the current article, two ways of reduction of the overlap area of data distribution were proposed: reducing variance and an increase of difference (distance) between means (Fig. 2). This can be achieved using the following approaches. use of functional tests (in particular, the combined effect of impacts); additional mathematical processing of measurement results (calculation of medians instead of mean values, transition to “relative values”) and calculation of diagnostic coefficients.
According to the literature, both age and diabetic disorders of microcirculation (both in the first and second type) lead to a decrease in the heating vasodilatation of the hairy skin of the upper and lower extremities [12, 19]. This is due to impairments in nervous innervation (both sensory and sympathetic), a decrease in the contribution of nitric oxide [20, 21]. Also, these changes may be due to anatomical conditions and technical restrictions: thinning of the skin in elderly patients can lead to changes in the registration of the laser Doppler signal [22].
We suppose, that changing the body position during heating test leads to additional vasodilation due to the orthostatic blood flow. This factor increases the differences between the study and control group due to the increased rigidity of the vascular wall and to the rheological disorders present in diabetes [23]. Use of combined functional tests and additional mathematical processing allowed LDF to reach 90% sensitivity and 80% specificity in reverse classification of the groups, while the base perfusion measurements did not show any significant differences.
An important limitation of the current study is the age difference between groups. We wanted to emphasize that the use of combined functional tests and the calculation of diagnostic indices can increase the diagnostic significance of the method and classify individual patient into control or t2DM group. To test the contribution of diabetes, we additionally included 9 patients with t2DM and 8 patients with hypertension, while the groups were comparable in age and did not differ in blood pressure. These patients differed from the main group by a longer duration of the II period of the test (300 seconds instead of 180). The Irel index in the additional group of patients (n = 8) with t2DM was 2.2 (1.3, 3.6) PU and it did not differ from the study group 2.1 (1.4, 3.3) PU, (p = 0.775, Mann-Whitney test). After combining these groups, we obtained the following picture: Irel in patients with t2DM 2.2 (1.4, 3.6) (n = 19) differed from patients with hypertension 3.5 (3.0, 3.9) (p = 0.049, Mann-Whitney test) and from the control group 5.6 (4.3, 7.5) (p < 0.001, Mann-Whitney test). There also were differences between the control group and patients with hypertension (p = 0.025, Mann-Whitney test). These observations allow us to say that the Irel index reflects both the contribution of arterial hypertension, of age and of diabetes itself in microcirculation disturbances in patients with t2DM.
Results of current study cannot be implemented in clinical practice because of the inclusion criteria: clinicians have no need to differentiate healthy young individuals from aged decompensated diabetes patients. We demonstrated the possibility of using LDF method to achieve predictive value in the detection of microcirculatory disorders in an individual patient with diabetes. At the present time we cannot differentiate these changes from the hypertension-related or age-related changes, but this result shows that it is possible to reach diagnostic significance via LDF. This extends the perspectives of the method beyond the purely scientific research. In future, it can be used in experimental pharmacology (finding new therapeutic targets and quantitative assessment of treatment effectiveness), practical medicine (detection of complications risk, patient monitoring during treatment).